Uncorrelated estimations of redshift evolution from DESI baryon acoustic oscillation observations
Abstract
The Dark Energy Spectroscopic Instrumnet (DESI) collaboration recently released the first year data of baryon acoustic oscillations (BAOs). Basing on the five different tracers, the cosmological constraint shows a hint of deviation from the standard CDM model. In this letter, We combine the DESI BAOs with other cosmic probes to constrain the evolution of Hubble constant as a function of redshift in flat CDM model. The non-parametric method is used to estimate the value of Hubble constant at different redshift bins. The correlation among different bins are removed by diagonalizing the covariance matrix. The joint data sample demonstrate a decreasing trend of Hubble constant with a significance of , which can naturally resolve the Hubble tension. It may be due to dynamical dark energy or modified gravity.
1 Introduction
Exploring the expansion history of the Universe is crucial for enhancing our empirical understanding of cosmology. The discovery of the accelerated expansion of the universe indicates that dark energy, with negative pressure, is the dominant component in the current universe (Riess et al., 1998; Perlmutter et al., 1999). Over the past years, the standard cosmological model CDM has been widely supported by most cosmological observations (Planck Collaboration et al., 2020; Alam et al., 2021).
Recently, the Dark Energy Spectroscopic Instrument (DESI) collaboration has released its first round of cosmological constraints based on baryon acoustic oscillations (BAOs) (DESI Collaboration et al., 2024). The results provide hints of dynamic dark energy behavior. For the CDM model, the dark energy equation of state is redshift dependent as . In this context, DESI reports a preference for . Combining DESI with Planck cosmic microwave background (CMB) data (Planck Collaboration et al., 2020) and type Ia supernovae (SNe Ia), the preference for CDM model over CDM model increases to .
The significant discrepancies with the CDM model derived from DESI have sparked widespread discussion on dark energy. Several studies have sought to constrain cosmological parameters using the new DESI BAO data (Bousis & Perivolaropoulos, 2024; Colgáin et al., 2024; Calderon et al., 2024; Wang et al., 2024). The measurement in the luminous red galaxy semms to exhibit significant deviations from the fiducial cosmology (Wang et al., 2024). Some studies have opted to reanalyze cosmological constraints without considering them (Colgáin et al., 2024; Carloni et al., 2024; Wang, 2024). By combining DESI, Planck and Pantheon+ data, the luminous red galaxy sample will have little impact on the constraint on () parameter estimation. The constraints from high-redshift data and low-redshift one demonstrate hints of a evolution of Hubble constant (Bousis & Perivolaropoulos, 2024).
The marginal evidence on the research of the evolution of the Hubble constant is a possible way to solve the Hubble tension (Kazantzidis & Perivolaropoulos, 2020; Hu & Wang, 2022, 2023; Jia et al., 2023). In the flat CDM model, a descending trend in the Hubble constant has been found (Krishnan et al., 2020; Wong et al., 2020; Dainotti et al., 2021, 2022; Ó Colgáin et al., 2022, 2024; Malekjani et al., 2024).Here, we use the novel non-parametric method proposed by Jia et al. (2023) to estimate the redshift evolution of Hubble constant from the new DESI data. This non-parametric method is similar as that used to constrain the dark energy equation of state (Huterer & Cooray, 2005; Riess et al., 2007).
2 Data
Recently, the first round of cosmological constraints based on BAO from the DESI collaboration has been released (DESI Collaboration et al., 2024). The constraints alone are consistent with the standard flat CDM model. However, the combination of DESI, CMB and SNe Ia indicates a discrepancy with the CDM model. The BAO data of DESI 2024 provides a tight constraints on the cosmological models. In order to better study the evolution of the Hubble constant, we incorporate them into our original data sample presented in Jia et al. (2023). Such a joint sample includes the latest observational results from various probes.
The first one is the Hubble parameter sample which contains 33 measurements spanning a redshift range from to which have been utilized in previous literature multiple times (Yu et al., 2018; Cao & Ratra, 2022; Jia et al., 2023). The details of the sample are presented in Table 1 of Jia et al. (2023). They are derived through the cosmic chronometic technique which is unrelated to cosmological models. The Hubble parameter is inferred by comparing the differential age evolution of galaxies at different redshifts with the formula (Jimenez & Loeb, 2002). The value of is measured from the age difference between two passively evolving galaxies and is the redshift interval between them.
Secondly, the old BAO data sample contains 12 measurements which spans the redshift range . The whole sample and their covariance matrix are shown in Jia et al. (2023). The new sample is the DESI first year data release (DESI Collaboration et al., 2024). They are derived from these tracers: the bright galaxy sample, the luminous red galaxy sample, the emission line galaxy sample, the quasar sample and the Lyman- forest sample. The compilation of compressed distance quantities , and are used in this paper, as given in DESI Collaboration et al. (2024). The BAO sample is calibrated by the CMB sound horizon scale distance Mpc at the end of the baryonic drag epoch (Planck Collaboration et al., 2020).
The last sample is the Pantheon+ SNe Ia sample (Scolnic et al., 2022). This sample consists of 1701 light curves of 1550 distinct SNe Ia spanning . The uniform intrinsic luminosity makes it a standard candle, which is crucial for measuring the Hubble constant especially at low redshifts.
3 Method and results
Considering the value of Hubble constant is determined by extrapolating the Hubble parameter from the observational data at higher to the local , using a particular cosmological model. The redshift evolution of the Hubble constant can be studied by an non-parametric method (Jia et al., 2023), similar as the treatment of equation of state of dark energy (Huterer & Cooray, 2005; Riess et al., 2007; Jia et al., 2022). To avoid imposing priors on the nature of the Hubble constant, we refrain from assuming that it follows specific functions. The value of Hubble constant are just allowed to remain a constant in each redshift bin.
3.1 Method
Under the assumption of a piece-wise function, can be represented as:
| (1) |
The parameter is the number of total redshift bins, and means the th redshift bin. The parameter represents the value of in the th bin between to .
A straightforward approach to model the potential evolution of is by modifying the standard cosmological model. Basing on the flat CDM model, the Hubble parameter is given by
| (2) |
The equation (2) can be converted to an integral form
| (3) |
The evolution of the Hubble constant can be researched by combining Equation (1) with Equation (3). The final expression for the Hubble parameter is
Considering the the value of at low redshift is determined by the evolution at high redshifts, the final term should be . The value of will inform us whether it is evolving. The result will revert to , if there is not any evolutionary trend.
The statistic method is used in estimating cosmological parameters with a set of parameters about as ().
| (4) |
The value of is
| (5) |
where and are the observed Hubble parameter and the corresponding 1 error.
The value of is
| (6) |
where is the vector of the BAO measurements at each redshift (i.e. ).
The value of is:
| (7) |
The covariance matrix contains the statistical matrix and the systematic covariance matrix. The parameter is the distance module from the Pantheon+ sample.
The prior of is adopted as [50,80] . A fiducial value for cosmic matter density is used during the fitting process. Due to the reason that the constraints from SNe Ia and CMB are both around 0.3 (Planck Collaboration et al., 2020; Brout et al., 2022). The results from previous literature also demonstrated that such an approximation is reasonable for studying the evolutionary trend of the Hubble constant (Jia et al., 2023). The Markov Chain Monte Carlo (MCMC) code are used to derive the constraints (Foreman-Mackey et al., 2013).
3.2 Results
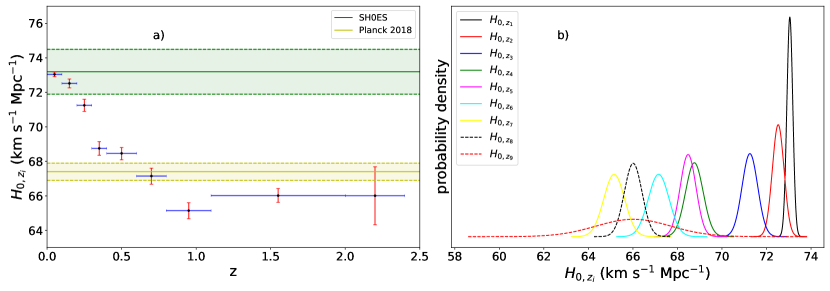
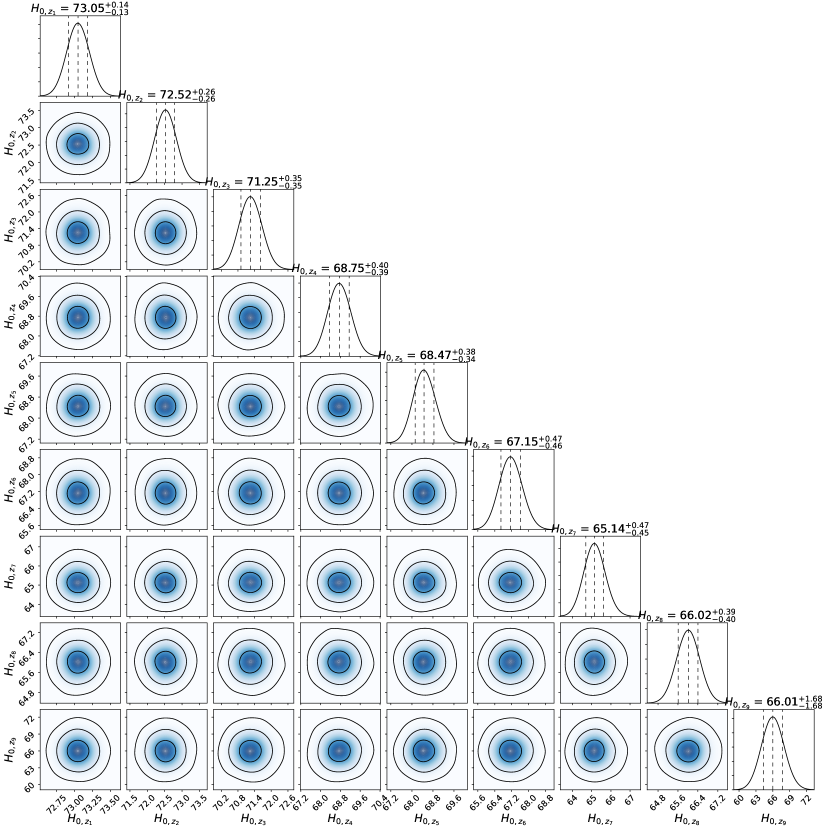
To study the redshift evolution of Hubble constant, we divide the redshift range into nine intervals. The bins are equally spaced at low redshift. Due to the limitation in the number of samples, we are compelled to choose larger redshift intervals at higher redshifts. The upper boundaries of these nine bins are and . The evolution of the values of are given in Figure 1 and Table 1. The fitting results at low redshifts are consistent with the value from the local distance ladder within confidence level (Riess et al., 2022). The value of at the last redshift bin are consisten with the value from CMB within confidence level Planck Collaboration et al. (2020). The decreasing trend in is apparent from to . We use the null hypothesis method to quantify the significance of the decreasing trend (Wong et al., 2020; Millon et al., 2020; Jia et al., 2023). The significance is found to be . Comparing with our previous results (Jia et al., 2023), the new data from DESI provides tighter constraints on the evolution at high redshifts. The uncertainty of is deduced significantly.
4 Conclusions and Discussion
Our results demonstrate an evident decreasing trend with a significance. The decreasing trend was also discovered in the measured by gravitationally lensed objects with a lower significance () (Wong et al., 2020; Kelly et al., 2023). By including the new BAO data from DESI, the results are more tighter compared to previous ones (Jia et al., 2023). The decreasing trend of Hubble constant is more pronounced at low redshifts but tends to stale at high redshifts.
The correlation among has been considered in this work. With the non-parametric method proposed by Huterer & Cooray (2005); Riess et al. (2007), we estimate the Hubble constant at different redshift bins. The principal component analysis removes the correlation among different bins by diagonalizing the covariance matrix (Huterer & Cooray, 2005; Riess et al., 2007). It is noteworthy that some previous works do not consider the correlation among different bins, which may have caused conflicts between their assumptions and methods. Nevertheless, their results also show a decreasing trend. To some extent, our non-parametric method is a good choice without adding prior conditions.
For the deviation from flat CDM model, the reason may due to systematic uncertainties in the data sample or the physical mechanism not captured by the current model. Considering that the SNe Ia sample constitutes the majority of the data used, their systematic uncertainties which may introduce bias into the results shou be discussed. The effect of different components of systematic uncertainties on the estimation of is extensively discussed in Brout et al. (2022). The entire contribution of the uncertainty is below , which is insufficient to explain the currently derived decreasing trend in . However, the evolution of light curve stretch may affect the value of Hubble constant (Nicolas et al., 2021). On the other hand, there are still debates regarding the calibration of SNe Ia, which could lead to different inferred values of (Freedman & Madore, 2023). One of the calibration methods is the Cepheid period-luminosity relation. In the construction of the local distance ladder, Cepheid variables occupy the first rung. Great caution needed to be exercised on the uncertainties at local universe, as small deviations at low redshift can lead to significant tension at high redshift. Fortunately, the hypothesis of unrecognized crowding of Cepheid photometry as the cause of the “Hubble tension” is rejected by the latest observation from James Webb Space Telescope (Riess et al., 2024). However, the transition behavior in the parameters of the Cepheid period-luminosity relation will affect the value of Hubble constant derived from SNe Ia, especially since Cepheids occupy the initial position in the distance ladder (Perivolaropoulos & Skara, 2021, 2022). If the systematic uncertainties are reasonably estimated, our results support that Hubble constant evolves with redshift. Some new physics, such as dynamical dark energy (Ratra & Peebles, 1988; Zhao et al., 2017; Cao & Ratra, 2023) or modified gravity models (Capozziello & de Laurentis, 2011), will have their moment on the stage. The standard cosmological CDM model, long regarded as the ultimate reference, may soon undergo revisions.
acknowledgments
This work was supported by the National Natural Science Foundation of China (grant No. 12273009), the China Manned Spaced Project (CMS-CSST-2021- A12), and Project funded by China Postdoctoral Science Foundation (2022M721561).
References
- Alam et al. (2021) Alam, S., , et al. 2021, Phys. Rev. D, 103, 083533, doi: 10.1103/PhysRevD.103.083533
- Bousis & Perivolaropoulos (2024) Bousis, D., & Perivolaropoulos, L. 2024, arXiv e-prints, arXiv:2405.07039, doi: 10.48550/arXiv.2405.07039
- Brout et al. (2022) Brout, D., Scolnic, D., Popovic, B., et al. 2022, ApJ, 938, 110, doi: 10.3847/1538-4357/ac8e04
- Calderon et al. (2024) Calderon, R., Lodha, K., Shafieloo, A., et al. 2024, arXiv e-prints, arXiv:2405.04216, doi: 10.48550/arXiv.2405.04216
- Cao & Ratra (2022) Cao, S., & Ratra, B. 2022, MNRAS, 513, 5686, doi: 10.1093/mnras/stac1184
- Cao & Ratra (2023) —. 2023, Phys. Rev. D, 107, 103521, doi: 10.1103/PhysRevD.107.103521
- Capozziello & de Laurentis (2011) Capozziello, S., & de Laurentis, M. 2011, Phys. Rep., 509, 167, doi: 10.1016/j.physrep.2011.09.003
- Carloni et al. (2024) Carloni, Y., Luongo, O., & Muccino, M. 2024, arXiv e-prints, arXiv:2404.12068, doi: 10.48550/arXiv.2404.12068
- Colgáin et al. (2024) Colgáin, E. Ó., Dainotti, M. G., Capozziello, S., et al. 2024, arXiv e-prints, arXiv:2404.08633, doi: 10.48550/arXiv.2404.08633
- Dainotti et al. (2021) Dainotti, M. G., De Simone, B., Schiavone, T., et al. 2021, ApJ, 912, 150, doi: 10.3847/1538-4357/abeb73
- Dainotti et al. (2022) Dainotti, M. G., De Simone, B. D., Schiavone, T., et al. 2022, Galaxies, 10, 24, doi: 10.3390/galaxies1001002410.48550/arXiv.2201.09848
- DESI Collaboration et al. (2024) DESI Collaboration, Adame, A. G., Aguilar, J., et al. 2024, arXiv e-prints, arXiv:2404.03002, doi: 10.48550/arXiv.2404.03002
- Foreman-Mackey et al. (2013) Foreman-Mackey, D., Hogg, D. W., Lang, D., & Goodman, J. 2013, PASP, 125, 306, doi: 10.1086/670067
- Freedman & Madore (2023) Freedman, W. L., & Madore, B. F. 2023, J. Cosmology Astropart. Phys, 2023, 050, doi: 10.1088/1475-7516/2023/11/050
- Hu & Wang (2022) Hu, J. P., & Wang, F. Y. 2022, MNRAS, 517, 576, doi: 10.1093/mnras/stac2728
- Hu & Wang (2023) Hu, J.-P., & Wang, F.-Y. 2023, Universe, 9, doi: 10.3390/universe9020094
- Huterer & Cooray (2005) Huterer, D., & Cooray, A. 2005, Phys. Rev. D, 71, 023506, doi: 10.1103/PhysRevD.71.023506
- Jia et al. (2023) Jia, X. D., Hu, J. P., & Wang, F. Y. 2023, A&A, 674, A45, doi: 10.1051/0004-6361/202346356
- Jia et al. (2022) Jia, X. D., Hu, J. P., Yang, J., Zhang, B. B., & Wang, F. Y. 2022, MNRAS, 516, 2575, doi: 10.1093/mnras/stac2356
- Jimenez & Loeb (2002) Jimenez, R., & Loeb, A. 2002, ApJ, 573, 37, doi: 10.1086/340549
- Kazantzidis & Perivolaropoulos (2020) Kazantzidis, L., & Perivolaropoulos, L. 2020, Phys. Rev. D, 102, 023520, doi: 10.1103/PhysRevD.102.023520
- Kelly et al. (2023) Kelly, P. L., Rodney, S., Treu, T., et al. 2023, Science, 380, abh1322, doi: 10.1126/science.abh1322
- Krishnan et al. (2020) Krishnan, C., Colgáin, E. Ó., Ruchika, Sen, A. A., Sheikh-Jabbari, M. M., & Yang, T. 2020, Phys. Rev. D, 102, 103525, doi: 10.1103/PhysRevD.102.103525
- Malekjani et al. (2024) Malekjani, M., Mc Conville, R., Ó Colgáin, E., Pourojaghi, S., & Sheikh-Jabbari, M. M. 2024, European Physical Journal C, 84, 317, doi: 10.1140/epjc/s10052-024-12667-z
- Millon et al. (2020) Millon, M., Galan, A., Courbin, F., et al. 2020, A&A, 639, A101, doi: 10.1051/0004-6361/201937351
- Nicolas et al. (2021) Nicolas, N., Rigault, M., Copin, Y., et al. 2021, A&A, 649, A74, doi: 10.1051/0004-6361/202038447
- Ó Colgáin et al. (2022) Ó Colgáin, E., Sheikh-Jabbari, M. M., Solomon, R., et al. 2022, Phys. Rev. D, 106, L041301, doi: 10.1103/PhysRevD.106.L041301
- Ó Colgáin et al. (2024) Ó Colgáin, E., Sheikh-Jabbari, M. M., Solomon, R., Dainotti, M. G., & Stojkovic, D. 2024, Physics of the Dark Universe, 44, 101464, doi: 10.1016/j.dark.2024.101464
- Perivolaropoulos & Skara (2021) Perivolaropoulos, L., & Skara, F. 2021, Phys. Rev. D, 104, 123511, doi: 10.1103/PhysRevD.104.123511
- Perivolaropoulos & Skara (2022) —. 2022, Universe, 8, 502, doi: 10.3390/universe8100502
- Perlmutter et al. (1999) Perlmutter, S., Aldering, G., Goldhaber, G., et al. 1999, ApJ, 517, 565, doi: 10.1086/307221
- Planck Collaboration et al. (2020) Planck Collaboration, Aghanim, N., Akrami, Y., et al. 2020, A&A, 641, A6, doi: 10.1051/0004-6361/201833910
- Ratra & Peebles (1988) Ratra, B., & Peebles, P. J. E. 1988, Phys. Rev. D, 37, 3406, doi: 10.1103/PhysRevD.37.3406
- Riess et al. (1998) Riess, A. G., Filippenko, A. V., Challis, P., et al. 1998, AJ, 116, 1009, doi: 10.1086/300499
- Riess et al. (2007) Riess, A. G., Strolger, L.-G., Casertano, S., et al. 2007, ApJ, 659, 98, doi: 10.1086/510378
- Riess et al. (2022) Riess, A. G., Yuan, W., Macri, L. M., et al. 2022, ApJ, 934, L7, doi: 10.3847/2041-8213/ac5c5b
- Riess et al. (2024) Riess, A. G., Anand, G. S., Yuan, W., et al. 2024, ApJ, 962, L17, doi: 10.3847/2041-8213/ad1ddd
- Scolnic et al. (2022) Scolnic, D., Brout, D., Carr, A., et al. 2022, ApJ, 938, 113, doi: 10.3847/1538-4357/ac8b7a
- Wang (2024) Wang, D. 2024, arXiv e-prints, arXiv:2404.13833, doi: 10.48550/arXiv.2404.13833
- Wang et al. (2024) Wang, Z., Lin, S., Ding, Z., & Hu, B. 2024, arXiv e-prints, arXiv:2405.02168, doi: 10.48550/arXiv.2405.02168
- Wong et al. (2020) Wong, K. C., et al. 2020, MNRAS, 498, 1420, doi: 10.1093/mnras/stz3094
- Yu et al. (2018) Yu, H., Ratra, B., & Wang, F.-Y. 2018, ApJ, 856, 3, doi: 10.3847/1538-4357/aab0a2
- Zhao et al. (2017) Zhao, G.-B., et al. 2017, Nature Astronomy, 1, 627, doi: 10.1038/s41550-017-0216-z
| Redshift bin | |
|---|---|