Diffusion-based Image Generation for In-distribution Data Augmentation in Surface Defect Detection
Abstract
In this study, we show that diffusion models can be used in industrial scenarios to improve the data augmentation procedure in the context of surface defect detection. In general, defect detection classifiers are trained on ground-truth data formed by normal samples (negative data) and samples with defects (positive data), where the latter are consistently fewer than normal samples. For these reasons, state-of-the-art data augmentation procedures add synthetic defect data by superimposing artifacts to normal samples. This leads to out-of-distribution augmented data so that the classification system learns what is not a normal sample but does not know what a defect really is. We show that diffusion models overcome this situation, providing more realistic in-distribution defects so that the model can learn the defect’s genuine appearance. We propose a novel approach for data augmentation that mixes out-of-distribution with in-distribution samples, which we call In&Out. The approach can deal with two data augmentation setups: i) when no defects are available (zero-shot data augmentation) and ii) when defects are available, which can be in a small number (few-shot) or a large one (full-shot). We focus the experimental part on the most challenging benchmark in the state-of-the-art, i.e., the Kolektor Surface-Defect Dataset 2, defining the new state-of-the-art classification AP score under weak supervision of .782. The code is available at https://github.com/intelligolabs/in˙and˙out.
1 INTRODUCTION
††∗ These authors contributed equally to this work.
Surface defect detection is a challenging problem in industrial scenarios, defined as the task of individuating samples containing a defect [Wang et al., 2018]. The first solution involves hiring human experts: they check each product and remove the pieces with a defect. Unfortunately, human experts can be biased and are subject to fatigue. Instead, automated defect detection systems [Tsang et al., 2016, Hanzaei et al., 2017] solve the above problems by learning classifiers on defective and normal training samples. Unfortunately, data collection requires a strong human effort and extensive labeling times, and the collected data has a majority of normal samples (negative samples) since the defects (positive samples) are way less than the normal samples. Training data becomes severely unbalanced in this general scenario, limiting the system’s performance.
To solve this issue, data augmentation methodologies have emerged as viable solutions [Zavrtanik et al., 2021, Yang et al., 2023, Zhang et al., 2023b]. The main principle is to augment the real defective samples with synthetic ones to balance the class distributions. To date, the best and most widely used approach for data augmentation consists of a per-region data augmentation [Yang et al., 2023]. The idea is to start from real negative samples, overlaying them with regions containing texture artifacts, making them positive. Unfortunately, this is far from being similar to a genuine defect, so we refer to that as out-of-distribution data. In terms of detection precision, this approach works since these data are useful to indicate what is certainly not a normal sample, thus avoiding false positive classifications. At the same time, this approach does little to avoid false negative classifications since defects are usually fine-grained deviations from normal samples, leading to low recall scores.
Diffusion models [Dhariwal and Nichol, 2021, Rombach et al., 2022] are deep generative models inspired by non-equilibrium thermodynamics that allow the sampling of rich latent spaces to generate meaningful realistic images. In this paper, we promote using Denoising Diffusion Probabilistic Models (DDPMs) to produce fine-grained realistic defects, solving the above issue. Specifically, we can distinguish two different scenarios: i) when no defects are available (zero-shot data augmentation); ii) when some defects are available, which could be very few (few-shot, or -shot with small) or in a large number (full-shot or -shot with large).
In the first case, a human-in-the-loop paradigm is employed. Specifically, a human operator can drive the generation of proper defects by exploiting their domain knowledge. This occurs using textual strings, which condition the generation of positive samples asking for specific defects (e.g., “scratches”, “holes”). Instead, in the second scenario, when anomalous samples are available, fine-tuning can be done directly on them. In this case, human operators are unnecessary since the model can already learn what a defect looks like. In all the cases, we can observe that DDPM-generated data is complementary to per-region augmented out-of-distribution data, as described in Figure 1, since it allows the enrichment of the statistics of positive data (in-distribution) ameliorating the downstream classification performance in terms of recall.
Due to the high complementarity of the two augmentation policies, we decided to use them together, dubbing our approach In&Out data augmentation since it is a compromise between augmented images that are in and out-of-distribution. We test our approach on the Kolektor Surface-Defect Dataset 2 (KSDD2) [Božič et al., 2021]. Notably, with 120 augmented images, the Average Precision (AP) classification score is .782, setting the new state-of-the-art performance on this dataset.
2 RELATED WORK
One of the most adopted frameworks for automated quality control is defect detection, where the goal is to find images that contain defects. Specifically, we focus on weakly supervised approaches [Božič et al., 2021, Zhang et al., 2021], in which positive and negative training images are labeled at the image level, that is, without per pixel masks. This is the cheapest and most widely used annotation in industrial contexts.
Despite its importance and wide usage, the practice of data augmentation for defect detection received little attention in the literature, and this paper is one of the first that entirely focuses on it.
The most adopted pipeline for the generation of the anomalous synthetic samples consists of a series of random standard augmentations on the input image, such as mirror symmetry, rotation, brightness, saturation, and hue changes, followed by a super-imposition of noisy patches on the image [Yang et al., 2023, Zhang et al., 2023a]. Interestingly, in [Zavrtanik et al., 2021], an ablation study focused on the generation of synthetic anomalies leads to the following findings: i) adding synthetic noise images is never counterproductive, it just diminishes the effectiveness in percentage; ii) few generated anomaly images (in the order of tens) are enough to increase the performance substantially; iii) textural injection in the anomalies is important, or, equivalently, adding uniformly colored patches is not effective.
In all of these papers, it is evident that the synthetically generated images are just out-of-distribution patterns, which do not have to represent the target-domain anomalies faithfully. We improved this setup, being the first to focus on genuine in-distribution defect data. A little improvement has been made in [Zhang et al., 2023b], in which the authors introduced the concept of “extended anomalies”, where the specific anomalous regions of the seen anomalies are placed at any possible position within the normal sample after having applied random spatial transformations. Unfortunately, this requires segmenting the training data, which we want to avoid.
3 BACKGROUND
We organize this section into four different parts, each one providing an overview of a topic related to our work: i) DDPMs; ii) Dreambooth fine-tuning; iii) Low-Rank Adaptation (LoRA), and iv) per-region data augmentation.
Denoising Diffusion Probabilistic Models.
DDPMs are probabilistic models inspired by the non-equilibrium statistical physics phenomenon of diffusion [Sohl-Dickstein et al., 2015, Ho et al., 2020]. In recent years, diffusion models have gradually become state-of-the-art in image synthesis, surpassing GANs in performance [Dhariwal and Nichol, 2021]. One of the main advantages of such models is the ability to guide the sampling steps with additional input data with a technique called conditioning. The most common form of conditioning is a text that describes what the expected image should look like [Rombach et al., 2022]. However, recent developments have explored other forms of conditioning, such as images, segmentation maps, or logic formulas [Capogrosso et al., 2023].
Dreambooth fine-tuning.
Dreambooth [Ruiz et al., 2023] is a procedure for DDPMs that allows fine-tuning the model with a small number of images. During the fine-tuning steps, each of the images is associated with a prompt defining the identification token and the subject class. At the same time, regularization images (images of the same class but without the subject identification token) are used to prevent the fine-tuning model from forgetting the subject class learned during the original (non-fine-tuning) training, thanks to a prior preservation loss. This allows the DDPM to learn a new specialized concept, represented by the identification token, with fewer iterations and without overwriting its prior knowledge.
Low-Rank Adaptation (LoRA).
In recent years, fine-tuning Large Language Models (LLMs) has become prohibitively expensive due to the huge number of parameters. In [Hu et al., 2021], the authors introduced Low-Rank Adaptation (LoRA), a model-agnostic method of fine-tuning models in an efficient way. LoRA has the following advantages: i) many small LoRA modules for different tasks can be built by a single pre-trained model; ii) optimizes only the injected, much smaller low-rank matrices, lowering the hardware requirements barrier; iii) the final model, obtained by merging the original pre-trained model and the low-rank matrices, has no additional inference latency.
Per-region data augmentation.
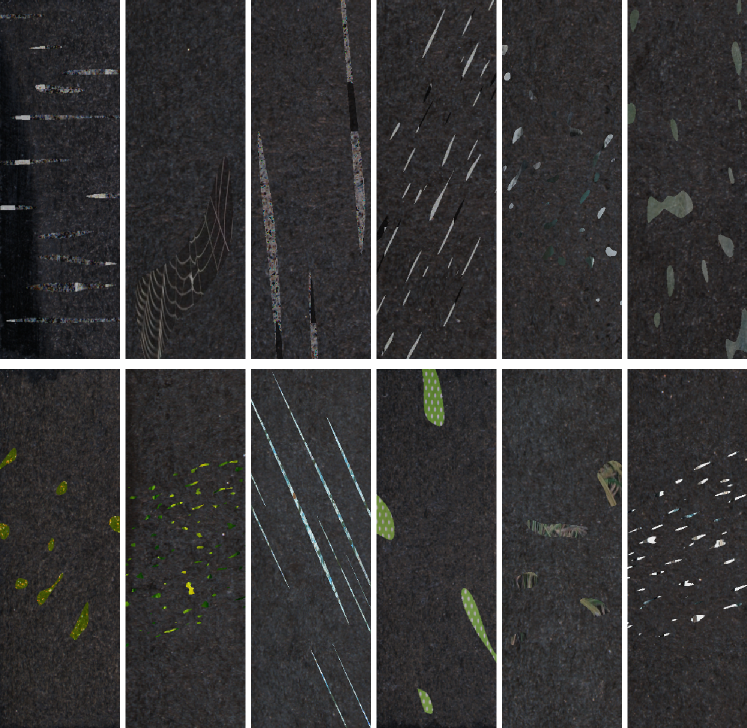
With per-region data augmentation, we refer to out-of-distribution data augmentation procedures that superimpose noise regions on the original image. In our study, we will use MemSeg [Yang et al., 2023] as our out-of-distribution data augmentation. Some examples of images generated by the MemSeg pipeline are reported in Figure 2.
4 METHOD
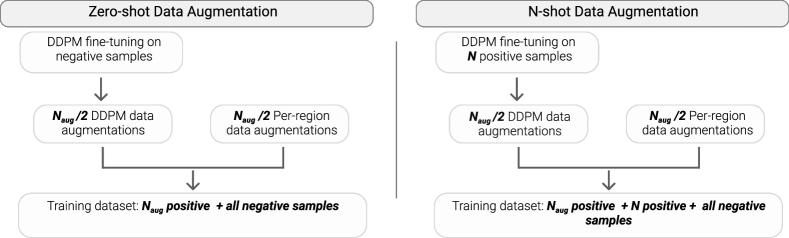
The In&Out data augmentation aims at producing additional positive images. The approach can be applied, with slightly different pipelines, on two scenarios: i) when no positive samples are available (zero-shot data augmentation) and ii) when positive samples are available (-shot data augmentation, where can be small or large). In the following, the two pipelines are detailed; a graphical sketch is presented in Figure 3.
4.1 Zero-shot data augmentation
In this scenario, we simulate that no positive samples are available in the training set. Thus, our aim is a zero-shot data augmentation procedure in which two steps are performed: fine-tuning and data augmentation.
Fine-tuning step.
Dreambooth is adopted to perform fine-tuning on a DDPM. To reduce training time and lower computation requirements, we only train low-rank update matrices by employing LoRA. These update matrices are then summed to the original weights, completing the fine-tuning procedure. Specifically, we control the weight of the LoRA update matrices during the merge with a parameter : a value close to 0 results in no fine-tuning, while a value close to 1 results in the strongest fine-tuning.
In the zero-shot data augmentation, we perform fine-tuning with a portion of randomly chosen negative samples from the training set. The number of samples depends on the complexity of the data we want to manipulate: the larger the intra-class variance, the larger the number of elements to sample. In this preliminary study, we select the number of samples heuristically (see Section 5 for details).
Data augmentation.
In this step, we create the augmented images generating in-distribution images and out-of-distribution images. The in-distribution images are obtained by exploiting the fine-tuned DDPM through natural language prompts, describing the desired anomalies. To define the types of defects in natural language and verify how well text expressions are suited to generate a genuine defect for the data at hand, it is reasonable to perform some human-in-the-loop cycles, exploiting the expert’s domain knowledge to evaluate the augmentation quality. Specifically, the operator prompts textual expressions and evaluates the generated data (total of ), certifying reasonable defects or revising expressions for improved generations. The out-of-distribution images are obtained by the per-region data augmentation, detailed in Section 3.
This ensures that half of the augmented data will be in-distribution, describing the visual appearance of the defects (the diffusion-based one), while the other half of the data will focus on specifying what is certainly not a perfect sample (the per-patch images). After the augmentation, the final training dataset will be formed by augmented positive images plus all the original negative samples.
4.2 N-shot data augmentation
In this scenario, we assume to have images from the positive pool of dataset images on which we perform Dreambooth fine-tuning with LoRA. We refer to the cases where as few-shot data augmentation. After the fine-tuning, in-distribution positive samples are generated. As for the zero-shot data augmentation scenario, the additional out-of-distribution images are obtained by the per-region data augmentation, detailed in Section 3.
After the augmentation, the final training dataset will be formed by augmented positive images + original positive images plus the negative samples.
5 EXPERIMENTS
In this study, we explore the efficacy of our In&Out data augmentation approach for defect detection on the KSDD2 dataset.
Dataset.
The KSDD2 contains RGB images of defective production items, provided and annotated by Kolektor Group d.o.o. The defects vary in shape, size, and color, ranging from small scratches and minor spots to large surface imperfections.
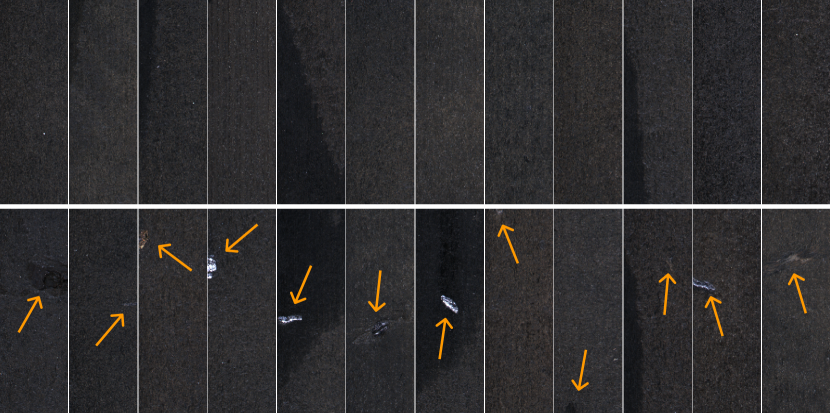
Since the images are of different sizes, we standardize the dataset resolution by center-cropping and resizing all the images to pixels. The dataset is split into train and test subsets, with 2085 negative and 246 positive samples in the training set, and 894 negative and 110 positive samples in the test set. At the moment of writing, the state-of-the-art AP on this dataset stands at .733 [Božič et al., 2021]. We show several normal and anomalous samples in Figure 4.
5.1 Implementation details
In this section, we specify all the implementation details for the sake of reproducibility. All training and inferences have been carried out on an NVIDIA RTX 4090 GPU.
DDPM fine-tuning.
In our experiments, we use Stable Diffusion [Rombach et al., 2022] as DDPM. The fine-tuning process follows the Dreambooth procedure (see Section 3 for details). We used the prompt “skt background”, where “skt” is the identification token. As written in Section 3, the string “skt” has no semantic meaning, and was selected to define an ID code for a new visual class. On the other hand, “background” is the subject class, identified as the most suited to obtain images with a homogeneous background. The regularization images have been generated using the prompt “background”. The weight of the prior preservation loss is set to as in the original paper. For faster training time and lower computation requirements, we also employ the LoRA-c3Lier low-rank adaptation, a modified version of LoRA that also applies low-rank approximations to convolutional kernels and linear layers.
The code is implemented in PyTorch. We used AdamW8bit [Dettmers et al., 2022] as an optimizer, with a learning rate of . We kindly direct the reader’s attention to our configuration file for a more comprehensive exploration of the various hyperparameters involved.
DDPM data augmentation.
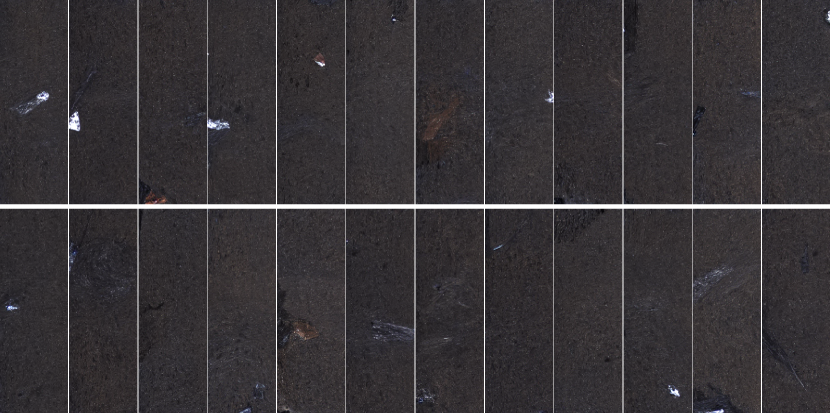
After training Stable Diffusion, we use it to generate augmented images. In the zero-shot scenario, we use the prompts “skt background cracked” and “skt background scratched” to induce the generation of anomalous samples. These prompts have been chosen after a series of tests and result in images containing plausible anomalies like the ones shown in Figure 5. These generated images are then added to the training set, which will be used to train the anomaly detection model. We train and evaluate this model with four different seeds for each of our experiments, generating new images each time to provide the most statistically relevant results.
ResNet-50 training and testing.
We use the PyTorch implementation of the ResNet-50 [He et al., 2016] as our anomaly detection model, in which we substitute the fully connected layers after the backbone to make it a binary classifier. The network is trained for 50 epochs with an SGD optimizer, a learning rate of , and a batch size of 5.
To keep consistency with the training and evaluation procedures of the KSDD2, we modify their official implementation to accommodate our ResNet-50 model. In particular, our setup is similar to the weakly supervised one presented in [Božič et al., 2021], where only the images and ground truth labels are used to train the model. For each scenario, i.e., zero-shot data augmentation and N-shot data augmentation, we will train three versions of our ResNet-50 model: i) using only MemSeg to generate images; ii) using only our DDPM to generate images; and iii) using In&Out as data augmentation, resulting in images generated by MemSeg and generated by our DDPM.
5.2 Zero-shot data augmentation
| AP | Precision | Recall | AP | Precision | Recall | ||
|---|---|---|---|---|---|---|---|
| MemSeg 80 | .514 (.026) | .733 (.113) | .436 (.033) | DDPM 80 | .547 (.086) | .427 (.301) | .695 (.194) |
| MemSeg 100 | .388 (.066) | .633 (.129) | .432 (.054) | DDPM 100 | .532 (.028) | .387 (.277) | .714 (.286) |
| MemSeg 120 | .511 (.050) | .683 (.054) | .470 (.091) | DDPM 120 | .445 (.186) | .465 (.329) | .591 (.274) |
| Average | .471 (.047) | .683 (.099) | .446 (.059) | Average | .508 (.100) | .426 (.302) | .667 (.251) |
In these experiments, we emulate a situation where no positive samples are available in the training set. With this premise, we train our diffusion model with only randomly chosen negative samples from the training set. We chose this number empirically and deemed it sufficient to represent the intra-class variance of the negative samples. We train the DDPM for 5 epochs, using as guiding prompt “skt background” and .
Once the diffusion model is trained, we generate augmented positive samples using prompts specific to the dataset. In our case, we used prompts such as “skt background cracked” and “skt background scratched”, resulting in images like the ones shown in Figure 5. Therefore, we produce out-of-distribution images by MemSeg, obtaining the of our In&Out approach. We also experiment with fully-MemSeg and fully-DDPM augmentation pipelines for comparison.
We train the ResNet-50 model on different values of and evaluate it on the original test set. For each number of data augmentation, four different seeds have been used to report the most statistically relevant results. We report the comparison between MemSeg and DDPM in Table 1, where the numbers outside the parenthesis indicate the average results over the four seeds, while the numbers between parenthesis indicate the standard deviation. As we can see, DDPM achieves the highest AP (.547), recorded at 80 augmented images, while also resulting in an overall higher mean AP when compared to the MemSeg pipeline (.508 vs. .471).
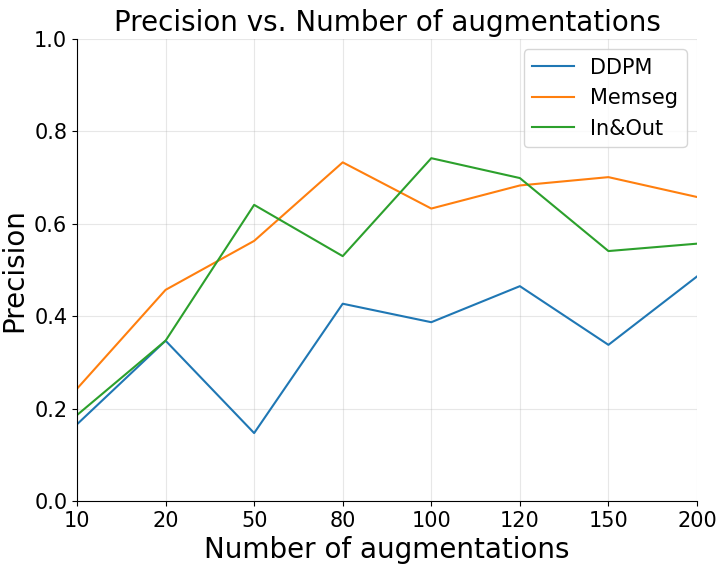
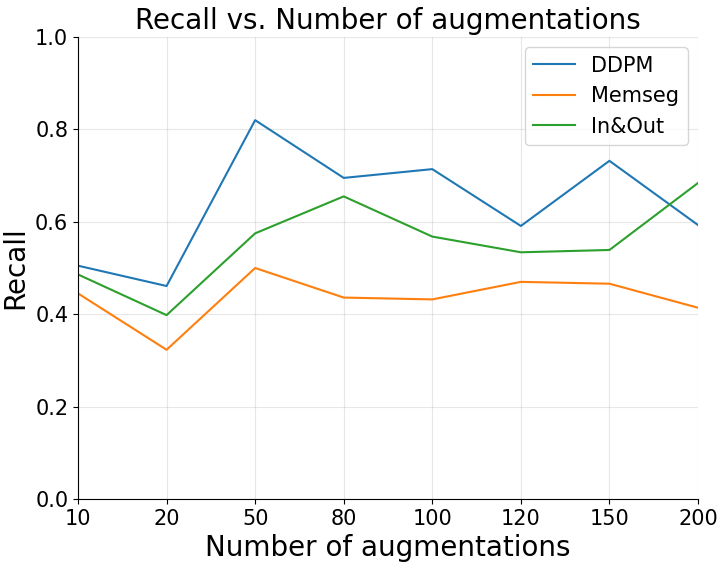
We want to highlight the difference between the precision and recall scores of MemSeg and DDPM. While DDPM achieves a higher recall (.714), the MemSeg pipeline results in a higher precision (.733). This behavior is clearly shown in Figure 6 and 7, where we plot the values of precision and recall of the two methods for different .
| AP | Precision | Recall | |
|---|---|---|---|
| In&Out 80 | .556 (.085) | .530 (.219) | .655 (.065) |
| In&Out 100 | .626 (.059) | .742 (.109) | .568 (.029) |
| In&Out 120 | .536 (.023) | .699 (.085) | .534 (.086) |
| Average | .573 (.056) | .657 (.138) | .586 (.060) |
When combined in the In&Out pipeline, where half of the augmented positive samples are provided by DDPM and the other half is provided by MemSeg, we obtain a huge performance boost in maximum (.626) and average (.573) AP, with balanced precision and recall metrics. These results, reported in Table 2, suggest how combining in-distribution (DDPM) and out-of-distribution (MemSeg) data, ameliorates precision and recall scores, helping the model better understand what an anomalous sample is.
5.3 -shot data augmentation, small
Within manufacturing environments, organizations strive to minimize the occurrence of defects, resulting in a generally restricted number of anomalous samples. In this sub-section, we put ourselves in this situation, i.e., only a minimal amount of ground truth positive samples are available in the dataset.
| AP | Precision | Recall | AP | Precision | Recall | ||
|---|---|---|---|---|---|---|---|
| MemSeg 80 | .582 (.018) | .836 (.101) | .466 (.049) | DDPM 80 | .580 (.045) | .542 (.270) | .634 (.212) |
| MemSeg 100 | .511 (.086) | .686 (.082) | .527 (.069) | DDPM 100 | .526 (.075) | .610 (.063) | .477 (.081) |
| MemSeg 120 | .593 (.044) | .801 (.065) | .507 (.053) | DDPM 120 | .535 (.063) | .659 (.127) | .491 (.046) |
| Average | .562 (.049) | .774 (.083) | .500 (.057) | Average | .547 (.061) | .604 (.153) | .534 (.113) |
To simulate this challenging setup, we randomly select only anomalous samples from the KSDD2 training dataset and use them to fine-tune the DDPM for 49 epochs with . Following the procedure introduced in Section 4.2, we generate several training sets induced by the different of new samples, plus the images on which we trained the DDPM. For the classifier, we use the same ResNet-50 architecture. The findings of this experiment are documented in Table 3. As we can see, the MemSeg method slightly outperforms DDPM, resulting in an average AP of .562 and .547, respectively. Moreover, MemSeg produces a maximum AP of .593 at , while DDPM records a maximum AP of .580 at . The precision and recall have similar behavior as seen in 5.2, with DDPM having a higher recall (.634 vs. .527) and lower precision (.659 vs .836) w.r.t. MemSeg.
| AP | Precision | Recall | |
| In&Out 80 | .531 (.041) | .507 (.220) | .655 (.126) |
| In&Out 100 | .578 (.041) | .450 (.343) | .761 (.245) |
| In&Out 120 | .575 (.025) | .635 (.316) | .636 (.189) |
| Average | .561 (.036) | .531 (.293) | .684 (.187) |
Interestingly enough, in Table 4, we can see that the In&Out pipeline does not seem to increase the performance, achieving an average AP on par with MemSeg (.561) while recording a slightly lower maximum AP (.578 vs. .593). We hypothesize that, in this setup, DDPM overfits the minimal number of anomalous images and cannot generalize the anomalous samples properly. This is a problem if the samples on which we fine-tune the model are a subset of all the anomalies and, thus, are not representative enough of the entire anomalous distribution.
5.4 -shot data augmentation, large
| AP | Precision | Recall | |
| MixSegdec | .733 (-) | - (-) | - (-) |
| In&Out 0 | .747 (.055) | .826 (.081) | .723 (.058) |
| In&Out 80 | .747 (.022) | .764 (.046) | .734 (.032) |
| In&Out 100 | .775 (.013) | .868 (.050) | .720 (.026) |
| In&Out 120 | .782 (.030) | .906 (.064) | .689 (.030) |
| Average | .768 (.022) | .846 (.053) | .714 (.029) |
Finally, to showcase In&Out as a general data augmentation technique, we explore the scenario with more positive samples in the training set. To this aim, we make all 246 positive samples available to the anomaly detection model during training, in addition to the usual augmented anomalous images. Following the procedure in Section 4.2, we use all the positive samples from the training set to fine-tune our diffusion model for 25 epochs with . Finally, we define a baseline by training the ResNet-50 with (In&Out 0), achieving an average AP of .747. The results are reported in Table 5.
| AP | Precision | Recall | AP | Precision | Recall | ||
|---|---|---|---|---|---|---|---|
| MemSeg 80 | .744 (.007) | .851 (.055) | .691 (.058) | DDPM 80 | .758 (.007) | .808 (.056) | .768 (.043) |
| MemSeg 100 | .774 (.016) | .814 (.038) | .752 (.028) | DDPM 100 | .763 (.008) | .829 (.059) | .725 (.034) |
| MemSeg 120 | .734 (.032) | .772 (.107) | .707 (.031) | DDPM 120 | .772 (.034) | .858 (.084) | .725 (.061) |
| Average | .751 (.018) | .812 (.067) | .717 (.039) | Average | .764 (.016) | .832 (.066) | .739 (.046) |
The results of the two separate data augmentation procedures are reported in Table 6. In this scenario, the anomaly detection model trained with DDPM augmented images achieves a maximum AP of .772, outperforming both the baseline (.747) and resulting in a higher average AP than MemSeg (.764 vs. .751). As we can see in Table 5, In&Out achieves the highest average AP yet (.768) while balancing the precision and recall metrics, confirming our intuition. Notably, with 120 augmented images, the maximum AP classification score is .782, beating the previous .733 [Božič et al., 2021] and setting the new state-of-the-art.
6 CONCLUSION
In this work, we introduce In&Out, a data augmentation method that generates positive images using DDPMs for in-distribution samples and per-region augmentation for out-of-distribution samples. We focus the experimental part on the KSDD2, defining the new state-of-the-art classification AP score under weak supervision of .782. These results encourage further study on additional datasets and exploring how textual prompts interact with DDPM, especially when defects are very few and not limited to cracks and scratches.
ACKNOWLEDGEMENTS
This study was carried out within the PNRR research activities of the consortium iNEST (Interconnected North-Est Innovation Ecosystem) funded by the European Union Next-GenerationEU (Piano Nazionale di Ripresa e Resilienza (PNRR) – Missione 4 Componente 2, Investimento 1.5 – D.D. 1058 23/06/2022, ECS_00000043). This manuscript reflects only the Authors’ views and opinions, neither the European Union nor the European Commission can be considered responsible for them.
REFERENCES
- Božič et al., 2021 Božič, J., Tabernik, D., and Skočaj, D. (2021). Mixed supervision for surface-defect detection: From weakly to fully supervised learning. Computers in Industry, 129:103459.
- Capogrosso et al., 2023 Capogrosso, L., Mascolini, A., Girella, F., Skenderi, G., Gaiardelli, S., Dall’Ora, N., Ponzio, F., Fraccaroli, E., Di Cataldo, S., Vinco, S., et al. (2023). Neuro-symbolic empowered denoising diffusion probabilistic models for real-time anomaly detection in industry 4.0: Wild-and-crazy-idea paper. In 2023 Forum on Specification & Design Languages (FDL), pages 1–4. IEEE.
- Dettmers et al., 2022 Dettmers, T., Lewis, M., Shleifer, S., and Zettlemoyer, L. (2022). 8-bit optimizers via block-wise quantization. ICLR.
- Dhariwal and Nichol, 2021 Dhariwal, P. and Nichol, A. (2021). Diffusion models beat gans on image synthesis. Advances in Neural Information Processing Systems, 34:8780–8794.
- Hanzaei et al., 2017 Hanzaei, S. H., Afshar, A., and Barazandeh, F. (2017). Automatic detection and classification of the ceramic tiles’ surface defects. Pattern recognition, 66:174–189.
- He et al., 2016 He, K., Zhang, X., Ren, S., and Sun, J. (2016). Deep residual learning for image recognition. In CVPR, pages 770–778.
- Ho et al., 2020 Ho, J., Jain, A., and Abbeel, P. (2020). Denoising diffusion probabilistic models. Advances in neural information processing systems, 33:6840–6851.
- Hu et al., 2021 Hu, E. J., Shen, Y., Wallis, P., Allen-Zhu, Z., Li, Y., Wang, S., Wang, L., and Chen, W. (2021). Lora: Low-rank adaptation of large language models. arXiv preprint arXiv:2106.09685.
- Rombach et al., 2022 Rombach, R., Blattmann, A., Lorenz, D., Esser, P., and Ommer, B. (2022). High-resolution image synthesis with latent diffusion models. In Proceedings of the IEEE/CVF Conference on Computer Vision and Pattern Recognition, pages 10684–10695.
- Ruiz et al., 2023 Ruiz, N., Li, Y., Jampani, V., Pritch, Y., Rubinstein, M., and Aberman, K. (2023). Dreambooth: Fine tuning text-to-image diffusion models for subject-driven generation. In CVPR, pages 22500–22510.
- Sohl-Dickstein et al., 2015 Sohl-Dickstein, J., Weiss, E., Maheswaranathan, N., and Ganguli, S. (2015). Deep unsupervised learning using nonequilibrium thermodynamics. In ICML, pages 2256–2265. PMLR.
- Tsang et al., 2016 Tsang, C. S., Ngan, H. Y., and Pang, G. K. (2016). Fabric inspection based on the elo rating method. Pattern Recognition, 51:378–394.
- Wang et al., 2018 Wang, T., Chen, Y., Qiao, M., and Snoussi, H. (2018). A fast and robust convolutional neural network-based defect detection model in product quality control. The International Journal of Advanced Manufacturing Technology, 94:3465–3471.
- Yang et al., 2023 Yang, M., Wu, P., and Feng, H. (2023). Memseg: A semi-supervised method for image surface defect detection using differences and commonalities. Engineering Applications of Artificial Intelligence, 119:105835.
- Zavrtanik et al., 2021 Zavrtanik, V., Kristan, M., and Skočaj, D. (2021). Draem-a discriminatively trained reconstruction embedding for surface anomaly detection. In Proceedings of the IEEE/CVF International Conference on Computer Vision, pages 8330–8339.
- Zhang et al., 2023a Zhang, H., Wang, Z., Wu, Z., and Jiang, Y.-G. (2023a). Diffusionad: Denoising diffusion for anomaly detection. arXiv preprint arXiv:2303.08730.
- Zhang et al., 2023b Zhang, H., Wu, Z., Wang, Z., Chen, Z., and Jiang, Y.-G. (2023b). Prototypical residual networks for anomaly detection and localization. In CVPR.
- Zhang et al., 2021 Zhang, J., Su, H., Zou, W., Gong, X., Zhang, Z., and Shen, F. (2021). Cadn: a weakly supervised learning-based category-aware object detection network for surface defect detection. Pattern Recognition, 109:107571.