Reducing the Environmental Impact of Midblock Crossing
Abstract
Accommodating pedestrians crossing midblock has been shown to have harmful environmental consequences because of increased fuel consumption and \chCO2 emissions. Somewhat surprisingly, no studies were devoted to mitigating the environmental impact of midblock crossing. Our main contribution is to propose schemes that mitigate the increased fuel consumption and \chCO2 emissions due to pedestrian midblock crossing by leveraging information about the location and expected duration of the crossing. This information is shared, in a timely manner, with approaching cars. We evaluated the impact of car decisions on fuel consumption and emissions by exploring potential trajectories that cars may take as a result of messages received. Our extensive simulations showed that timely dissemination of pedestrian crossing information to approaching vehicles can reduce fuel consumption and emissions by up to 16.7%
Keywords Smart mobility Fuel consumption \chCO2 Emissions Vehicular communications Midblock crossing Pedestrian safety
1 Introduction
Recent statistics revealed that midblock crossing, including jaywalking, is a ubiquitous and pervasive societal phenomenon that is here to stay Hunsanon et al. (2017); Tezcan et al. (2019). Further studies have confirmed that accommodating pedestrians who cross midblock increases fuel consumption, \chCO2 emissions, and the average trip time Li and Sun (2014); Pérez Cruz et al. (2021); Bak and Kiec (2012). In order to avoid crashing into pedestrians crossing midblock, cars must reduce their speed and then accelerate to resume their cruising speed. Unfortunately, these avoidance maneuvers increase significantly fuel consumption and emissions El-Shawarby et al. (2005).
The common approach taken by researchers to contain the increase in fuel consumption due to promoting pedestrian safety at controlled intersections involves using vehicle-to-infrastructure (V2I) communications (e.g., intersection management system) and/or vehicle-to-vehicle (V2V) communications protocols Alsabaan et al. (2013); Wan et al. (2016); Lu et al. (2019); Wang et al. (2021). If pedestrians are detected at intersections managed by traffic systems, the approaching cars react according to the scheduling scheme sent by the traffic management system.
Pedestrians who cross midblock can be detected using on-board pedestrian detection systems Palffy et al. (2023) or by collaborative perception of surrounding cars and/or infrastructure Alali et al. (2023); Zhang et al. (2022); Noh and Yeo (2022).
1.1 Our contributions
Virtually all studies on reducing the environmental impacts of promoting road safety have focused on communication between intersection management systems and vehicles to optimize fuel consumption. However, as previously mentioned, cars can now receive alerts about midblock crossings. Therefore, developing methods to efficiently reduce the speed based on the received alert messages is required.
The main contribution of this paper is to fill this research gap by providing schemes for adjusting the speed of the car after receiving midblock crossing alerts considering the environmental impacts. While environmental impacts of midblock crossing have been explored, there is a glaring lack of effort to reduce these impacts. We propose two schemes for maintaining a safe speed to avoid collisions with pedestrians crossing at several different locations, without the need for the cars to stop. The first scheme is to immediately reduce the speed to a safe speed that minimizes fuel consumption and reduces emissions. The second scheme is to defer the deceleration if the car is already responding to a previous alert until it reaches the crossing area.
Our extensive simulation results show that timely dissemination of pedestrian crossing information to approaching cars can reduce fuel consumption and emissions by up to 16.7%
The remainder of this paper is organized as follows. In Sections 2 and 3 we review, succinctly, related work and the fuel consumption model used. We present our alert model in Section 4. In Section 5 we illustrate our schemes for reducing speed upon receiving alert messages. We show the results of implementing our proposed schemes in Section 6. Finally, we offer concluding remarks in Section 7.
2 Literature review
A number of researchers have utilized information exchanged through vehicular networks to reduce the environmental impact of transportation systems. For example, Alsabaan et al. (2013) introduced a comprehensive optimization model involving both V2V and traffic-light-signal-to-vehicle (TLS2V) communications. Through V2V and V2I communications, cars approaching a traffic light signal receive information to adjust their speed to a recommended value, aiming to minimize fuel consumption and emissions. Similarly, Wan et al. (2016) proposed a Speed Advisory System (SAS) for connected vehicles to enhance fuel efficiency and comfort by managing speed in advance based on upcoming traffic signal information. Further, Lu et al. (2019) introduced an advanced speed control at successive signalized intersections to mitigate fuel consumption and emissions, leveraging V2I and V2V technologies. Car speed was optimized by utilizing real-time traffic signal phasing, timing information, and vehicle queue data. The method notably reduced fuel consumption and \chCO2 emissions by over 18%. In addition, pedestrians crossing intersections were accommodated in Wang et al. (2021) who introduced Roadrunner+, a cooperative autonomous intersection management system designed for connected autonomous vehicles. This work addressed the challenges posed by pedestrian crossings at intersections and scheduled traffic efficiently reducing fuel consumption by up to 7.64%.
3 Fuel consumption and emission estimation model
The physics-based energy demand model was used by Jones (1980) to estimate the energy required to move a car from point to point through a driving cycle. The model takes as inputs the speed profile and car specifications that influence the tractive force. We employed the model to estimate fuel consumption based on the instantaneous energy demand using the following equation Thomas (2014):
| (1) |
where is the estimation of the total expended fuel energy in and refers to the efficiency of the engine in converting fuel into a tractive power. The total instantaneous energy demand on the car in the interval is calculated as follows:
| (2) |
where is the time unit (i.e., one second), is the mass of the car in , is the current acceleration of the car in and is the current speed in . , are the rolling resistance and aerodynamic drag of the car, respectively. These terms represent the forces that a car must overcome while moving (Guzzella et al., 2007). As stated by U.S. Department of Energy and U.S. Environmental Protection Agency (EPA), only 12% to 30% of the fuel goes to the wheel of the car. We assume that the power demand during deceleration is zero because the engine does not provide power to the wheels while braking. Similarly, the power demand during idling is zero as the car shuts down the engine if it stops for more than a few seconds (Huff et al., 2023).
To estimate the \chCO2 emissions, we use the EPA formula U.S. Environmental Protection Agency (2005):
| (3) |
CO2 emissions are highly correlated with the fuel consumed. Based on this, the \chCO2 emissions in grams per can be estimated based on the expended fuel energy . The Carbon Content equals to 0.0196 g/KJ and the Oxidation Fraction equals to 0.99 and the value is the molecular mass of \chCO2 divided by the atomic mass of carbon.
4 The alert system model
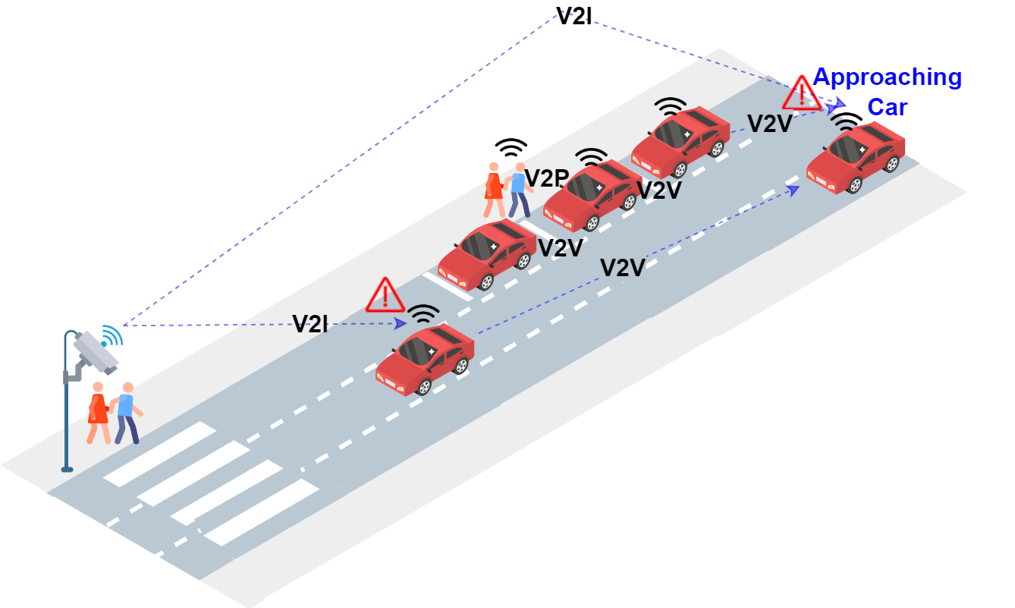
We assume a system that can detect reliably pedestrians crossing midblock and that sends alert messages to approaching cars, as illustrated in Fig. 1. For example, approaching cars may receive, through V2I communications, alert messages from a street monitoring system that uses cameras Noh and Yeo (2022). It may also receive, through V2V communications, alert messages from cars parked along the curb that detect crossing pedestrians Alali et al. (2023). Similarly, the approaching cars may receive alert messages from other approaching cars through V2V Ngo et al. (2023). Finally, cars may receive alert messages from pedestrian hand-held or wearable devices through Vehicle-to-Pedestrian (V2P) communications Tahmasbi-Sarvestani et al. (2017).
We assume that alert messages include the location of the crossing and the speed of the pedestrians. Using a digital map, the car determines the width of the street. With this information, the car can determine the remaining crossing time and the speed it should maintain to avoid colliding with the pedestrians, as we illustrate in Section 5.
5 Speed reduction schemes
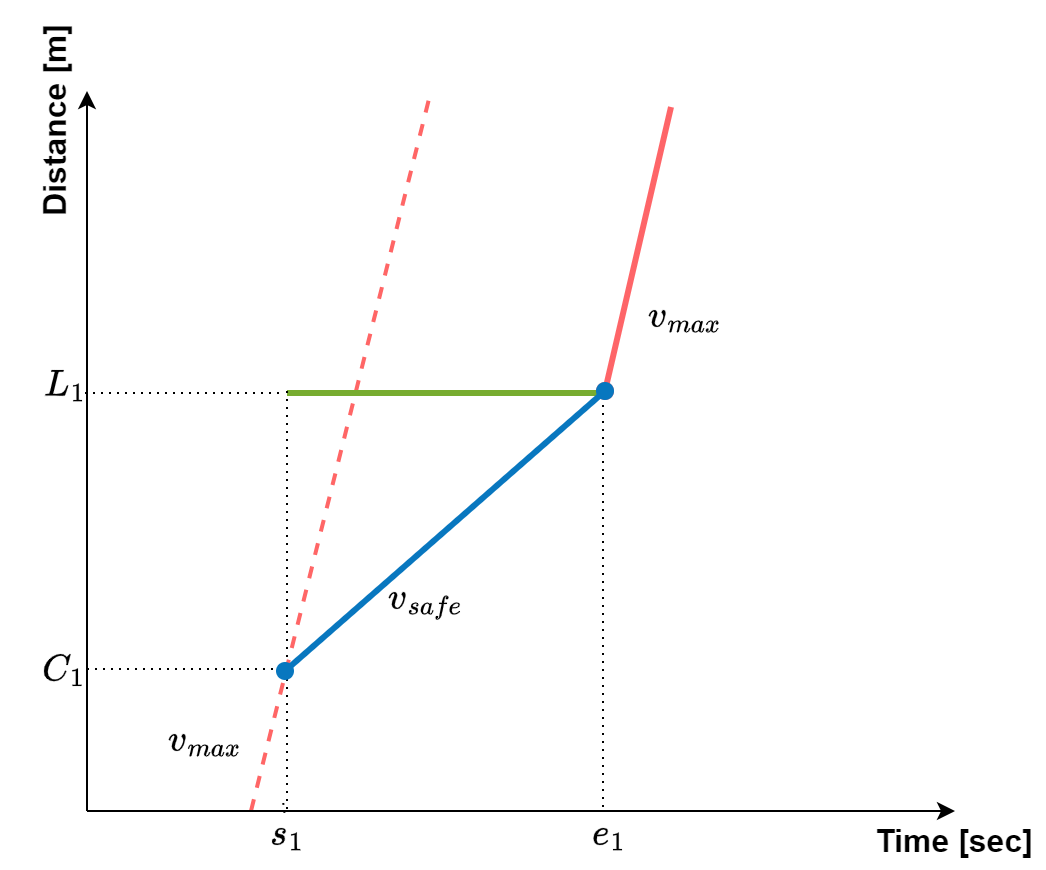
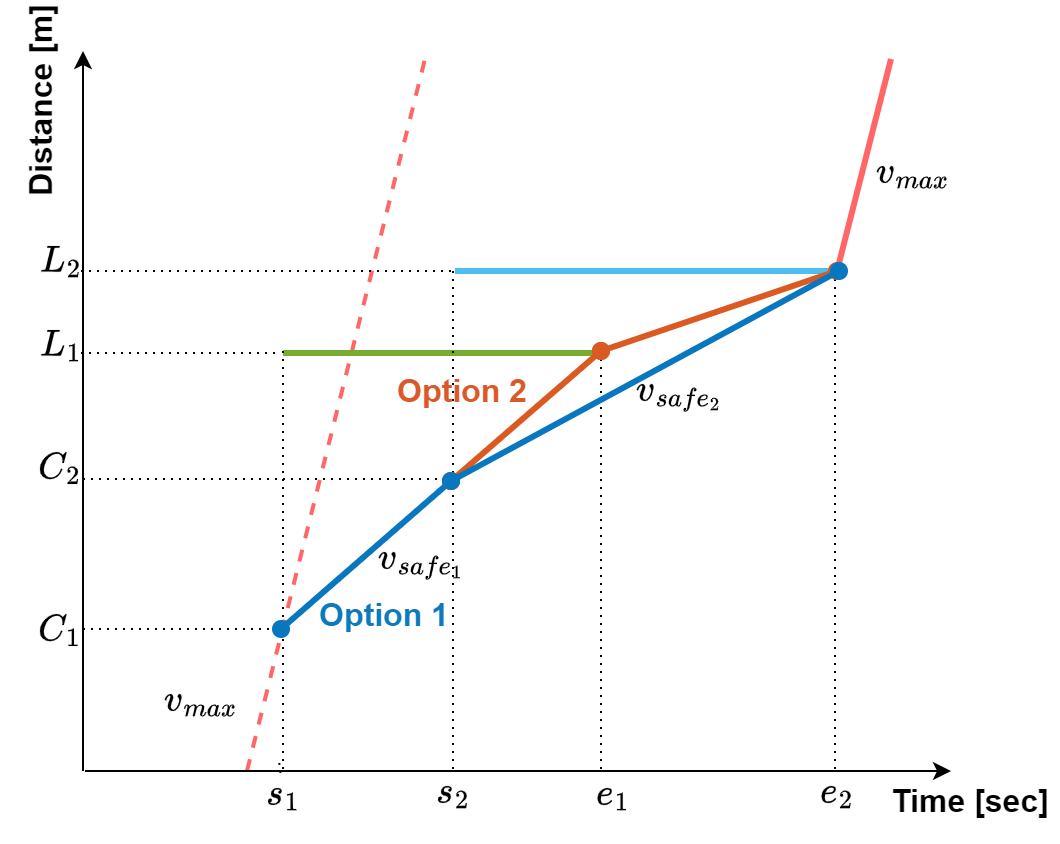
Assume that at time an approaching car at location receives the first alert message containing location for the crossing cohort and the remaining crossing time, which indicates that the crossing will be over at time . Using the time-space diagram shown in Fig. 3(a), the car can calculate the maximum safe speed as:
| (4) |
where is the alert message number. is the safe speed determined using the information included in the received message number . If the received message is the first message, then is equal to the street speed limit .
Now, let us assume that after a while and before the car reaches the crossing location of the first crossing, it receives another message about a cohort crosses at different location , as we show in Fig. 3(b). When the car receives the alert , it checks whether there is a previous alert affects its speed. If no alert was received, the car reduces its speed immediately according to the calculated crossing time. On the other hand, if there is a previous alert, the car will check if the location of the current crossing pedestrian is closer than that of the previous pedestrian location . If it is closer, then the car would choose between the two options, which represent our proposed schemes, Option 1 or Option 2, as explained below:
-
•
Option 1: Immediate deceleration This option is illustrated in Fig. 3(b). In this option, the car at location responds immediately to the second message by reducing its speed. We note here that this option would also prevent collisions with pedestrians at location without the need to stop at . Indeed, when the car reaches the crossing area, it can resume a normal speed equal to the speed limit .
-
•
Option 2: Deferred deceleration: This option represents the second scheme we propose in this work. This option is depicted in Fig. 3(b). In this option, after the car reduces its speed for crossing at location , when it is at location it receives the second message about cohort crossing at location . When the car compares the new safe speed with its current speed , it finds that is lower. Therefore, it may choose not to respond to this message and maintain its current speed until it reaches the crossing at . When it passes the area, it will reduce its speed according to the remaining crossing time for the cohort at location .
These two proposed schemes can be compared with other trajectories that can be taken when the car does not notice the pedestrian in advance. We call this trajectory (Sudden Stop) where there are midblock crossings, but the car does not receive any information beforehand, and alternatively it notices the pedestrian near the crossing location and stops suddenly. Note that the (Sudden Stop) trajectory is similar to a trajectory that would be taken by an aggressive driver who does not adhere to the alert message.
All of these trajectories can be compared to a baseline trajectory when there are no midblock crossing pedestrians. We call this trajectory (No Peds.) which stands for No Pedestrians.
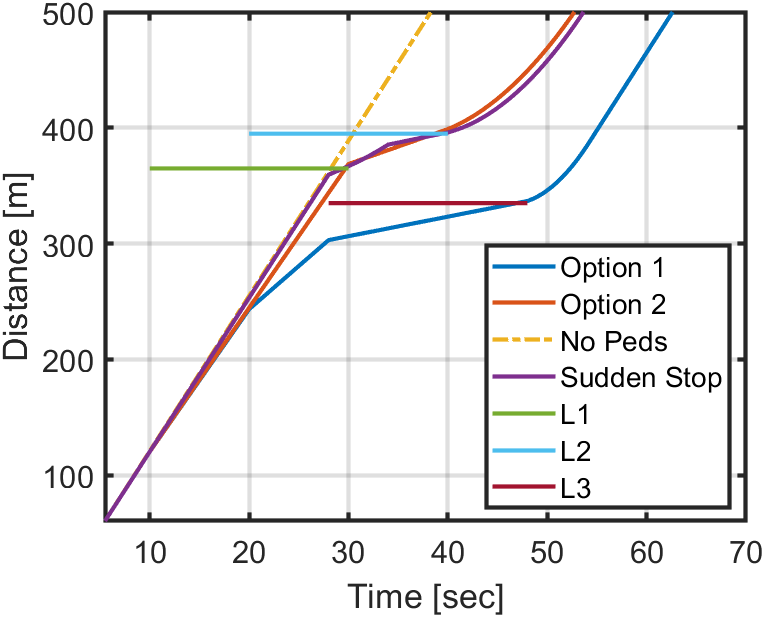
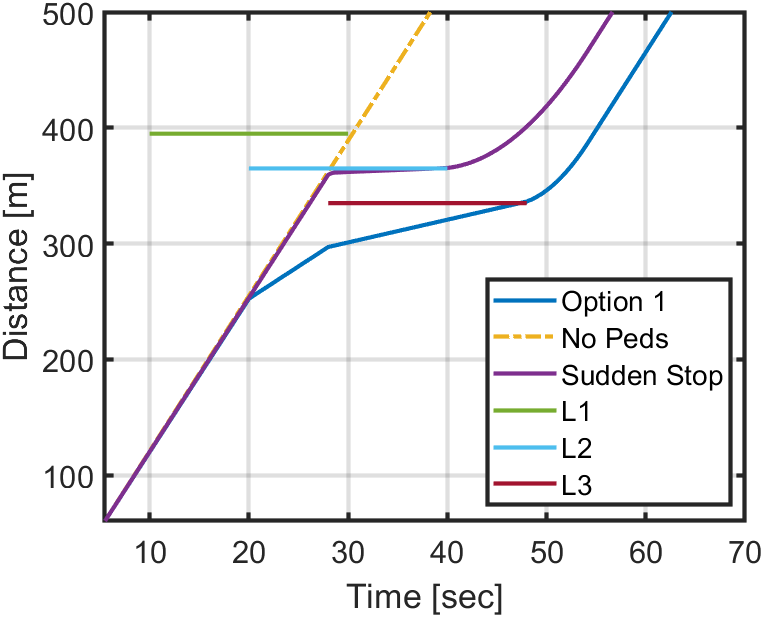
It is important to determine the possible scenarios that may occur when there are several simultaneous crossings at several locations, and an approaching car receives alert messages. This also enables an accurate evaluation of the effectiveness of each reaction in reducing the environmental impacts. Therefore, we designed six possible scenarios for three pedestrians crossing at the same speed (i.e., they had the same crossing time) at three different locations L1, L2, and L3. In each scenario, the order of starting crossing changes at each location. Fig. 2 shows six scenarios with their expected reactions.
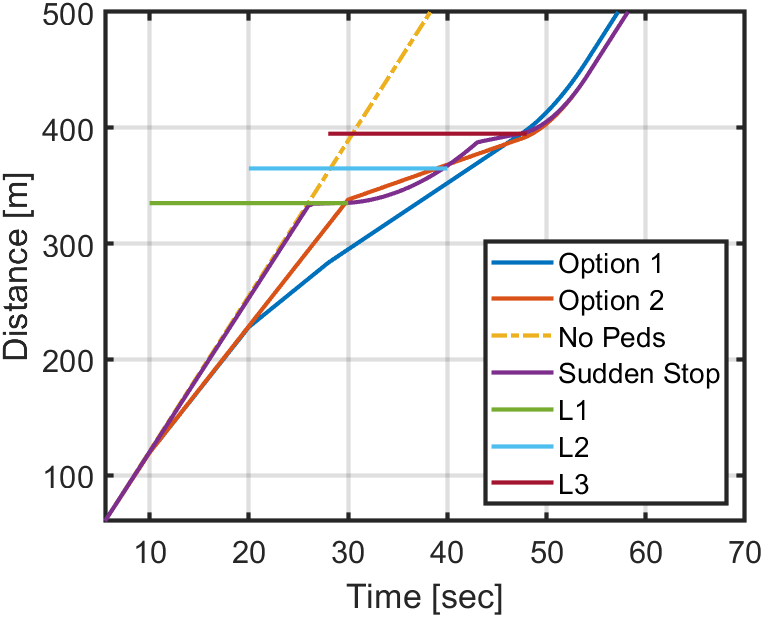
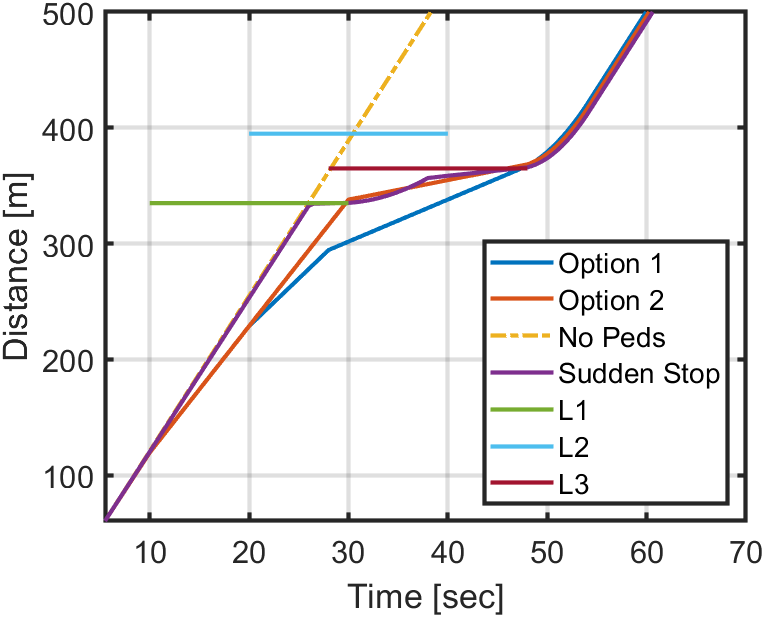
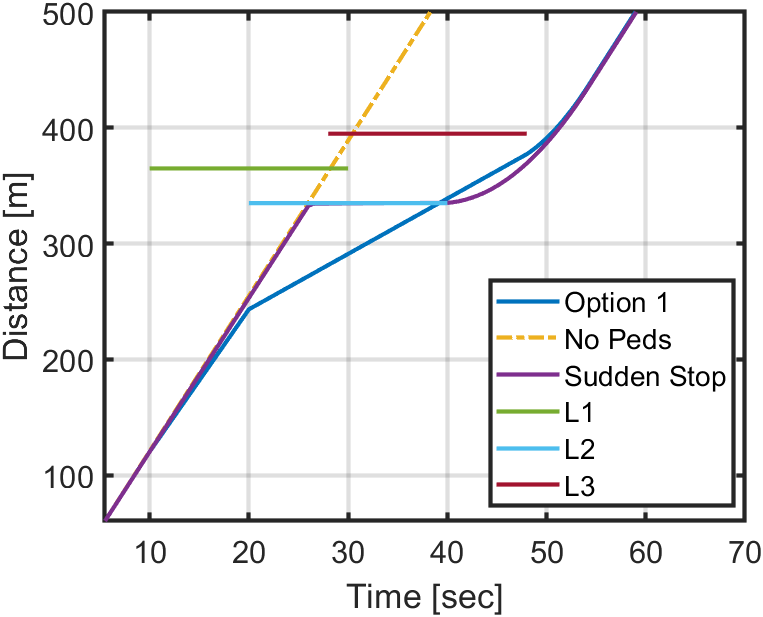
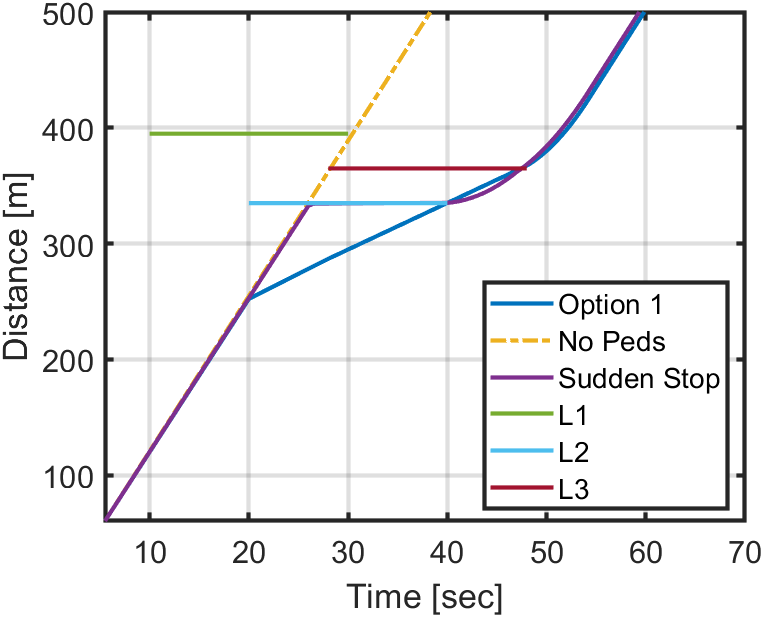
In scenarios 3, 4 and 6, (Fig. 2(c), 2(d), and 2(f)), the only option for the car to avoid collisions with pedestrians without staying idle is immediate deceleration (that is, Option 1). This is the only available option, given that the second alert location is closer to the car than the first alert. In Scenario 3, the car receives the message at time 10 about a pedestrian/cohort crosses at location , the car calculates the safe speed and finds that it is equal to the speed limit, so it continues cruising at the same speed. Note that even if the car does not reduce its speed, it will avoid the collision with the pedestrian without the need to stop at the crossing location. At time 20, the car receives a second alert for a crossing at location . Now, because the location is closer than and is less than the current speed , the car immediately reduces its speed to . When the third crossing starts at location which is farther away from , the car calculates which, this time, is larger than the current speed, so it keeps the minimum which is the current speed . When it reaches , its speed can be increased to if it is less than the speed limit. In Scenario 4, crossing at location starts first, and the car receives the first alert, but as in Scenario 3, this does not affect the current speed because the safe speed now is similar to the speed limit. At time 20, crossing at a closer location starts, which makes the car reduces its speed to avoid the collision. At time 28, a crossing starts at location , but it has no affects this time because = . In scenario 6, the car does not reduce its speed for crossing at , but it does so when crossing at location starts. Again, when has a crossing, the car reduces its speed to avoid the collision.
On the other hand, a second option is available to the car to defer the deceleration in Scenarios 1,2 and 5 (Fig. 2(a), 2(b), and 2(e)). This is actually because the second alert is for crossing at location farther away than the location of the first alert. In scenario 1, the car receives the message at time 10 about a pedestrian/cohort crosses at location , the car calculates the safe speed and finds that it is less than the speed limit ; thus, it reduces its speed to . Then, when a crossing starts at location which is farther away from , it receives the second alert. Now, as the car calculates its and finds that it is less than the current speed , so it has now two options: either to decelerate immediately to reach or to continue on until it reaches crossing then decelerates for the second alert. When the third crossing starts at location , the car calculates which, this time, is less than the current speed (for both options), but ,again, since is farther than , it has now the two options. Similarly, in scenario 2, crossing at location starts first, and the car receives the first alert, then crossing starts at , so the car has the two options. However, when crossing at starts, the car must reduce its speed immediately without having a second option because is closer than . In scenario 5, the car does not reduce its speed for crossing as it can avoid the collision even it maintains the speed limit. Again, when crossing at further location starts, it has the two options. However, when the third crossing at location starts, it affects Option 1 and forces the car to reduce its speed immediately.
In the following, we explain the possible rational reactions of an approaching car inside the Safety Zone when it receives a alert message to a crossing cohort at one location, and after a while, it receives another message of a pedestrian crossing at the same or another location. We examine two cases that may occur in the street while pedestrians cross the midblock.
In this case, the car receives a second alert message about cohort crossing at a location that is different from the first one.
6 Simulation and results
6.1 Simulation model
To generate cars traffic, we utilize Simulation of Urban MObility (SUMO) Lopez et al. (2018), a microscopic simulation modeling vehicles and pedestrian mobility. In the simulation, we created a one way street with two lanes for on-street parking in the right-hand of the street and a left-hand lane for moving cars.
For generating pedestrian traffic, and because we have specific scenarios we aim to study, we determine fixed locations of pedestrian crossing with fixed speed. We chose the minimum speed of crossing midblock reported by Forde and Daniel (2021) to assure safety of pedestrians. We assume that each time a car approaches those determined locations, there is a pedestrian crosses the street at the same time, and it receives a message once it enters the Safety Zone. To achieve this, we disable the randomness in pedestrian generation in SUMO to prove the effectiveness of our schemes. The parameters of the simulation are as follows: street length = 500 meters [m], street width = 13 [m], street speed limit = 30 [mph] 13.4 [m/s], pedestrian speed = 0.67 [m/s], crossing time = 20 [s].
We implemented our proposed schemes on two car models from year 2023 data provided by U.S. Environmental Protection Agency (2023). The first car is the sedan TOYOTA CAMRY LE/SE has mass = 1644 kilogram, = 113.82 newton and = 0.36 newton. The second car is the SUV TOYOTA HIGHLANDER that has mass = 2040.8 kg, = 139.7 newton and = 0.56 newton. According to the EPA data, CAMRY LE/SE consumes less fuel and emit less \chCO2 than HIGHLANDER in city driving cycles.
6.2 Simulation results
In this subsection, we provide an evaluation of the proposed schemes in terms of reducing fuel consumption and \chCO2 emissions using the two cars. Additionally, we prove that receiving informative messages about midblock pedestrians in timely manner via V2V communications reduces the environmental impacts associated with midblock crossing. We compare the fuel consumed during the trips in Option 1 and Option 2 in all the assumed scenarios with the additional trajectories (No Peds.) and and (Sudden Stop). Fig. 2 shows the six scenarios along with the additional generated trajectories for comparison. We evaluate the fuel consumed and the emitted \chCO2 for the four trajectories in each scenario.

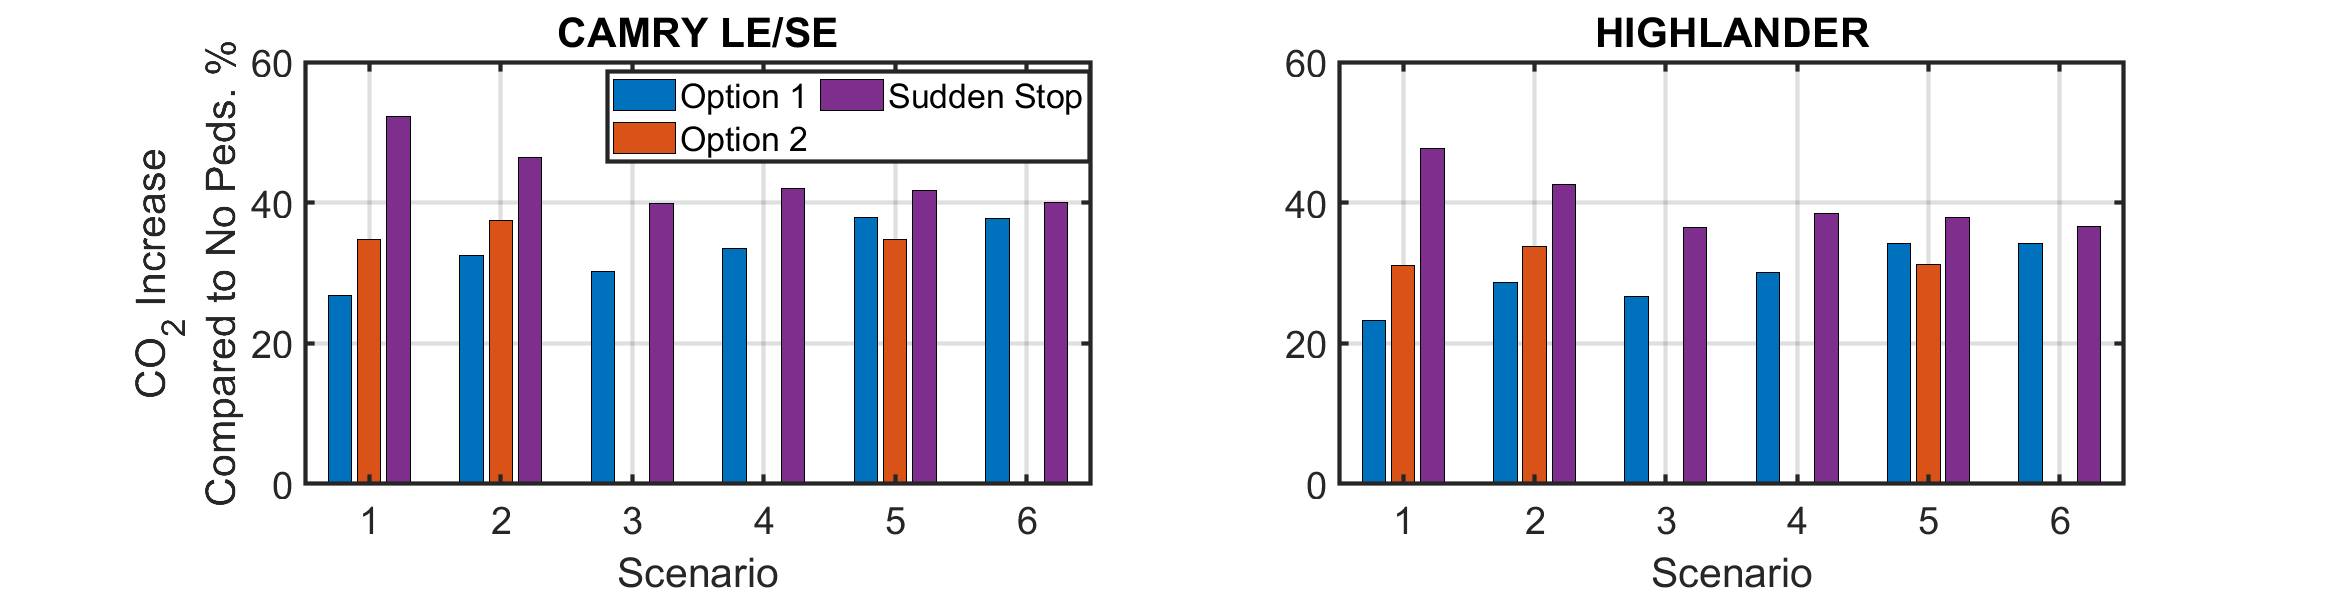
We measured the increase percentage of fuel as a result of midblock crossing compared to the case when there are no pedestrian (No Peds.). Fig. 4 shows that accommodating pedestrians in all scenarios increases the fuel consumption and emissions compared to the case where there are no pedestrians (No Peds.). However, receiving timely informative messages that allow the car to maintain a safe speed consumes less fuel and emits less \chCO2 than the Sudden Stop. This is because when the car maintains a lower speed in advance until the pedestrians finish crossing, it consumes less fuel and consequently emits less \chCO2. Conversely, when the car does not have timely information and suddenly stops at the crossing location, and later resume its normal speed after passing it, it consumes more fuel because of the higher speed and acceleration phases.
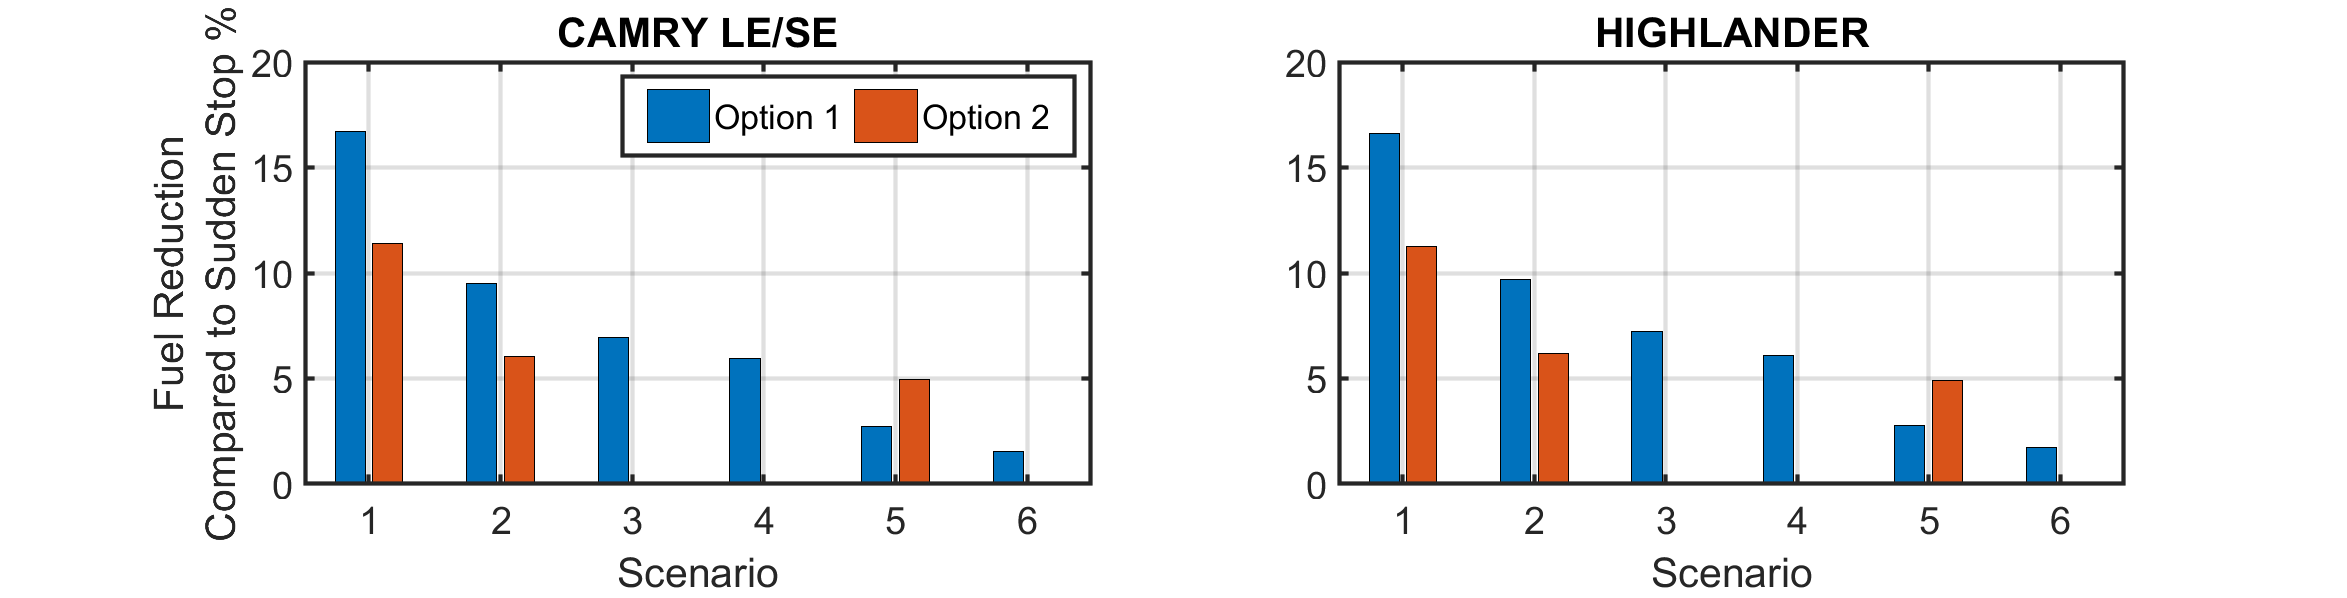
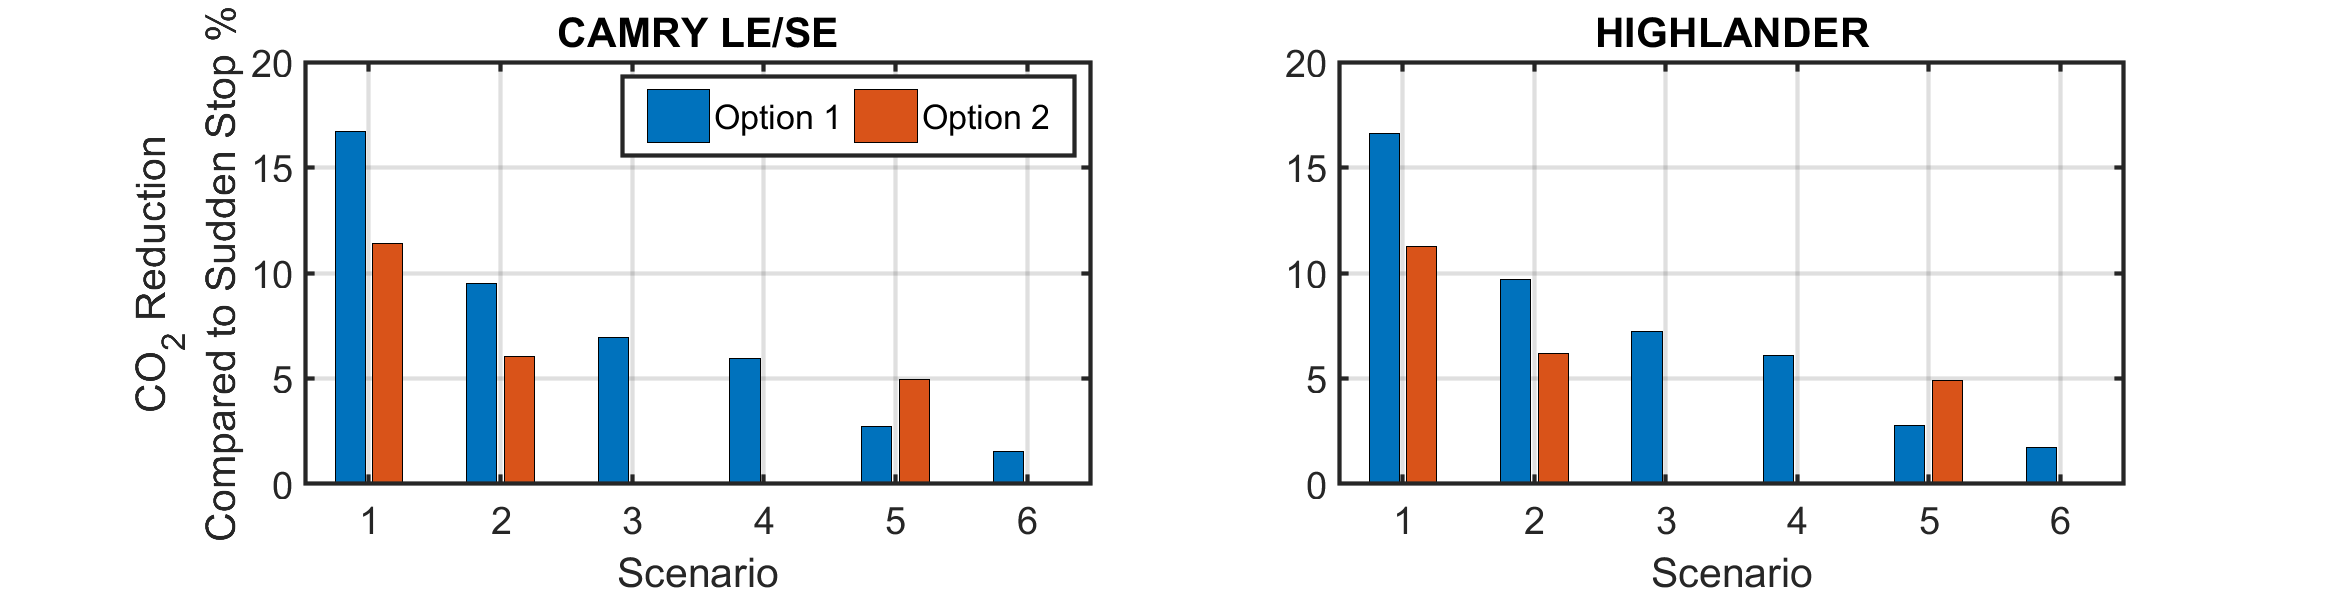
The reduction of fuel consumption and \chCO2 emissions in the proposed schemes is shown in Fig. 5. The reduction of Option 1 and Option 2 were compared with the (Sudden Stop) trajectory. As can be seen, the reduction in fuel consumption is higher in the two options. We can also see that Scenario 1 has the highest fuel and emission reduction. This shows the effectiveness of the proposed schemes in this case. While in the other scenarios, as new information about pedestrian crossing at a closer location may require consuming more fuel as the time allowed to reduce the speed is less than in Scenario 1.
To discuss the results in detail, we show duration of driving modes (acceleration, deceleration, cruising and idling) for all the trajectories in all the scenarios in Table. 1. This data is applicable to the two cars since the speed profile is the same for both. From Table. 1, we see that in Scenario 1 the two options consumed less fuel than sudden stop because in both trajectories the car maintained a lower speed than sudden stop. Another reason is that in sudden stop, and because the car does not have adequate information in advance, it tries to resume its normal speed after it passes the crossing location. This causes an increase in the acceleration duration, which consumes more fuel. This was also applied to the other scenarios.
| Scenario | Trajectory | speed. [mph] | speed. | Acceleration Duration [seconds] | Deceleration Duration [seconds] | Cruising Duration [seconds] | Idling Duration [seconds] |
|---|---|---|---|---|---|---|---|
| Option 1 | 23.934 | 7.3384 | 7 | 1.5 | 85 | 0 | |
| Option 2 | 23.6805 | 8.9587 | 7 | 1.5 | 86 | 0 | |
| No Peds | 29.9982 | 1.07E-14 | 0 | 0 | 74.5 | 0 | |
| 1 | Sudden Stop | 23.6799 | 10.386 | 20.5 | 2.5 | 71.5 | 4.5 |
| Option 1 | 23.2338 | 8.824 | 7 | 1.5 | 87.5 | 0 | |
| Option 2 | 23.1714 | 10.0558 | 7 | 1.5 | 88 | 0 | |
| No Peds | 29.9982 | 1.07E-14 | 0 | 0 | 74.5 | 0 | |
| 2 | Sudden Stop | 23.0918 | 11.3951 | 16 | 2.5 | 78.5 | 13.5 |
| Option 1 | 23.4776 | 8.6753 | 7 | 1.5 | 86.5 | 0 | |
| Option 2 | 23.4776 | 8.6753 | 7 | 1.5 | 86.5 | 0 | |
| No Peds | 29.9982 | 1.07E-14 | 0 | 0 | 74.5 | 0 | |
| 3 | Sudden Stop | 23.4451 | 11.3236 | 15.5 | 2 | 77.5 | 14 |
| Option 1 | 23.2619 | 9.4685 | 7 | 1.5 | 87.5 | 0 | |
| Option 2 | 23.2619 | 9.4685 | 7 | 1.5 | 87.5 | 0 | |
| No Peds | 29.9982 | 1.07E-14 | 0 | 0 | 74.5 | 0 | |
| 4 | Sudden Stop | 23.3836 | 11.337 | 15 | 2.5 | 78 | 14 |
| Option 1 | 22.6306 | 10.6188 | 7 | 2 | 90 | 0 | |
| Option 2 | 25.1097 | 8.0688 | 15 | 1.5 | 72.5 | 0 | |
| No Peds | 29.9982 | 1.07E-14 | 0 | 0 | 74.5 | 0 | |
| 5 | Sudden Stop | 24.8747 | 8.9741 | 19.5 | 1.5 | 69 | 0 |
| Option 1 | 22.5959 | 10.7654 | 7 | 1.5 | 90 | 0 | |
| Option 2 | 22.5959 | 10.7654 | 7 | 1.5 | 90 | 0 | |
| No Peds | 29.9982 | 1.07E-14 | 0 | 0 | 74.5 | 0 | |
| 6 | Sudden Stop | 24.0758 | 10.6726 | 15.5 | 2 | 75.5 | 11.5 |
We conclude that receiving advance information about midblock crossing allows the car to reduce the fuel consumption by up to 16.7% over the sudden reaction and on average 7.4% for both options. Specifically, immediate deceleration reduced about 7.3507% from the sudden reaction and deferred declaration reduced 7.4511% on average. This conclusion applies to CAMRY data, and we achieved approximately similar reduction for the HIGHLANDER model. As the \chCO2 emission are highly correlated with fuel consumption, emissions were reduced correspondingly. It is worth mentioning that neither of the schemes affected the average speed for the whole trip which means that our scheme did not increase trip time.
7 Concluding remarks
Our main contribution was to propose schemes that mitigate the environmental impacts (increased fuel consumption and \chCO2 emissions) of pedestrian midblock crossing by leveraging information about the location and expected duration of the crossing. Our extensive simulations showed that timely dissemination of pedestrian crossing information to approaching vehicles can reduce fuel consumption and emissions by up to 16.7%
References
- Hunsanon et al. [2017] Thodsapon Hunsanon, Nopadon Kronprasert, Auttawit Upayokin, and Praprut Songchitruksa. Control strategy for vehicular and pedestrian midblock crossing movements. Transportation Research Procedia, 25:1672–1689, 2017. ISSN 2352-1465. doi:https://doi.org/10.1016/j.trpro.2017.05.124. URL https://www.sciencedirect.com/science/article/pii/S2352146517304155. World Conference on Transport Research - WCTR 2016 Shanghai. 10-15 July 2016.
- Tezcan et al. [2019] Hüseyin Onur Tezcan, Mahmoud Elmorssy, and Göker Aksoy. Pedestrian crossing behavior at midblock crosswalks. J. Safety Res., 71:49–57, December 2019.
- Li and Sun [2014] Xiang Li and Jian-Qiao Sun. Effect of interactions between vehicles and pedestrians on fuel consumption and emissions. Physica A: Statistical Mechanics and its Applications, 416:661–675, December 2014. URL https://www.sciencedirect.com/science/article/pii/S0378437114007869.
- Pérez Cruz et al. [2021] José Roberto Pérez Cruz, Noureddine Lakouari, Julio César Pérez Sansalvador, and Jorge Luis Zapotecatl López. Effect of interactions between vehicles and mid-block crosswalks on traffic flow and co2 emission. Applied Sciences, 11(24), 2021. ISSN 2076-3417. URL https://www.mdpi.com/2076-3417/11/24/11794.
- Bak and Kiec [2012] Radoslaw Bak and Mariusz Kiec. Influence of midblock pedestrian crossings on urban street capacity. Transportation research record, 2316(1):76–83, January 2012. URL https://doi.org/10.3141/2316-09.
- El-Shawarby et al. [2005] Ihab El-Shawarby, Kyoungho Ahn, and Hesham Rakha. Comparative field evaluation of vehicle cruise speed and acceleration level impacts on hot stabilized emissions. Transportation Research Part D: Transport and Environment, 10(1):13–30, January 2005. URL https://www.sciencedirect.com/science/article/pii/S1361920904000604.
- Alsabaan et al. [2013] Maazen Alsabaan, Kshirasagar Naik, and Tarek Khalifa. Optimization of fuel cost and emissions using V2V communications. IEEE Trans. Intell. Transp. Syst., 14(3):1449–1461, September 2013. URL http://dx.doi.org/10.1109/TITS.2013.2262175.
- Wan et al. [2016] Nianfeng Wan, Ardalan Vahidi, and Andre Luckow. Optimal speed advisory for connected vehicles in arterial roads and the impact on mixed traffic. Transportation Research Part C: Emerging Technologies, 69:548–563, August 2016. URL https://www.sciencedirect.com/science/article/pii/S0968090X16000292.
- Lu et al. [2019] Yingrong Lu, Xiaotong Xu, Chuan Ding, and Guangquan Lu. A speed control method at successive signalized intersections under connected vehicles environment. IEEE Intelligent Transportation Systems Magazine, 11(3):117–128, 2019. URL http://dx.doi.org/10.1109/MITS.2019.2919638.
- Wang et al. [2021] Michael I-C Wang, Charles H-P Wen, and H Jonathan Chao. Roadrunner+: An autonomous intersection management cooperating with connected autonomous vehicles and pedestrians with spillback considered. ACM Trans. Cyber-Phys. Syst., 6(1):1–29, November 2021. URL https://doi.org/10.1145/3488246.
- Palffy et al. [2023] Andras Palffy, Julian F P Kooij, and Dariu M Gavrila. Detecting darting out pedestrians with occlusion aware sensor fusion of radar and stereo camera. IEEE Transactions on Intelligent Vehicles, 8(2):1459–1472, February 2023. URL http://dx.doi.org/10.1109/TIV.2022.3220435.
- Alali et al. [2023] Abrar Alali, Stephan Olariu, and Shubham Jain. Adopt: A system for alerting drivers to occluded pedestrian traffic. Vehicular Communications, 41:100601, 2023. ISSN 2214-2096. doi:https://doi.org/10.1016/j.vehcom.2023.100601. URL https://www.sciencedirect.com/science/article/pii/S2214209623000311.
- Zhang et al. [2022] Meng Zhang, Alexandre Brunoud, Alexandre Lombard, Yazan Mualla, Abdeljalil Abbas-Turki, and Abderrafiaa Koukam. Cooperative behaviors of connected autonomous vehicles and pedestrians to provide safe and efficient traffic in industrial sites. In 2022 IEEE International Conference on Systems, Man, and Cybernetics (SMC), pages 2802–2807. IEEE, October 2022. URL https://ieeexplore.ieee.org/abstract/document/9945188/.
- Noh and Yeo [2022] Byeongjoon Noh and Hwasoo Yeo. A novel method of predictive collision risk area estimation for proactive pedestrian accident prevention system in urban surveillance infrastructure. Transportation research part C: emerging technologies, 137:103570, 2022.
- Jones [1980] R Jones. Quantitative effects of acceleration rate on fuel consumption. Technical Report EPA-AA-SDSB-80-06 Tech Rpt., Environmental Protection Agency, Ann Arbor, MI (USA), April 1980. URL https://trid.trb.org/view/155653.
- Thomas [2014] John Thomas. Drive cycle powertrain efficiencies and trends derived from epa vehicle dynamometer results. SAE International Journal of Passenger Cars-Mechanical Systems, 7(2014-01-2562):1374–1384, 2014.
- Guzzella et al. [2007] Lino Guzzella, Antonio Sciarretta, et al. Vehicle propulsion systems, volume 1. Springer, 2007.
- [18] U.S. Department of Energy and U.S. Environmental Protection Agency. Where the Energy Goes: Gasoline Vehicles. URL https://www.fueleconomy.gov/feg/atv.shtml. Accessed 2024.
- Huff et al. [2023] S. Huff, S. Davis, R. Boundy, and R. Gibson. Auto stop-start fuel consumption benefits. In SAE Technical Paper, page 0346, 2023. doi:10.4271/2023-01-0346. URL https://doi.org/10.4271/2023-01-0346.
- U.S. Environmental Protection Agency [2005] U.S. Environmental Protection Agency. Moves2004 energy and emission inputs. Office of Transportation and Air Quality, March 2005.
- Ngo et al. [2023] Hieu Ngo, Hua Fang, and Honggang Wang. Cooperative perception with V2V communication for autonomous vehicles. IEEE Trans. Veh. Technol., pages 1–10, 2023. URL http://dx.doi.org/10.1109/TVT.2023.3264020.
- Tahmasbi-Sarvestani et al. [2017] Amin Tahmasbi-Sarvestani, Hossein Nourkhiz Mahjoub, Yaser P. Fallah, Ehsan Moradi-Pari, and Oubada Abuchaar. Implementation and evaluation of a cooperative vehicle-to-pedestrian safety application. IEEE Intelligent Transportation Systems Magazine, 9(4):62–75, 2017.
- Lopez et al. [2018] Pablo Alvarez Lopez, Michael Behrisch, Laura Bieker-Walz, Jakob Erdmann, Yun-Pang Flötteröd, Robert Hilbrich, Leonhard Lücken, Johannes Rummel, Peter Wagner, and Evamarie Wießner. Microscopic traffic simulation using sumo. In The 21st IEEE International Conference on Intelligent Transportation Systems, pages 2575–2582, 2018.
- Forde and Daniel [2021] Albert Forde and Janice Daniel. Pedestrian walking speed at un-signalized midblock crosswalk and its impact on urban street segment performance. Journal of Traffic and Transportation Engineering (English Edition), 8(1):57–69, February 2021. URL https://www.sciencedirect.com/science/article/pii/S209575641830415X.
- U.S. Environmental Protection Agency [2023] U.S. Environmental Protection Agency. Data for cars used in testing fuel economy. https://www.epa.gov/compliance-and-fuel-economy-data/data-cars-used-testing-fuel-economy, 2023. Accessed: November 7, 2023.