Search of extended emission from HESS J1702-420 with eROSITA
Abstract
Context. HESS J1702-420 is a peculiar TeV complex with a morphology changing from a diffuse (HESS J1702-420B source) at TeV to point-like (HESS J1702-420A) at TeV energies. The morphology and the spectral properties of HESS J1702-420 could be understood in terms of a (diffusive) hadronic or leptonic models in which the observed TeV emission arises correpondingly from proton-proton or IC-radiation of relativistic particles present in the region.
Aims. In this work we perform searches of the X-ray counterpart of HESS J1702-420B source originated from the synchrotron emission of the primary or secondary relativistic electrons produced within leptonic or hadronic models. Such an emission can be largely extent and remain beyond the detection capabilities of a narrow-FoV instruments such as XMM-Newton.
Methods. We utilise the publicly available first 6-months eROSITA dataset (DR1) fully covering selected for the analysis region of -radius around HESS J1702-420. We discuss biases connected to variable plasma temperature/neutral hydrogen column density in the region and present results based on background modelling approach.
Results. The performed analysis does not allow us to detect the extended X-ray counterpart of HESS J1702-420 of -radii sizes. The derived upper limits are significantly higher than the expected hadronic model flux of the X-ray counterpart. For the leptonic model the derived limits indicate the magnetic field in the region G. We argue, that the further advances in the diffuse X-ray counterpart searches could be achieved either with next generation missions or Msec-long observational campaigns with currently operating instruments.
Key Words.:
gamma-ray sources: HESS J1702-420 – diffusion – eROSITA1 Introduction
HESS J1702-420 is a very-high energy (VHE) complex detected by High Energy Spectroscopic System (H.E.S.S.) in the TeV energy band during the first Galactic plane survey campaign (Aharonian et al. 2006b). The complex was further studied in Aharonian et al. (2008), which reported the extended morphology of the source and the first measurements of its spectral parameters.
The recent H.E.S.S. observations (Abdalla et al. 2021) suggest that the morphology of the complex is changing with energy. While at low energies ( TeV) the source is clearly characterised by a diffuse morphology, at highest energies ( TeV) the morphology of the source is consistent with a point-like. Such energy-dependent morphology is consistent with a superposition of a point-like source HESS J1702-420A with a hard power law spectrum and a much softer extended () source HESS J1702-420B with an elliptical morphology.
Peculiarly, no direct counterparts of these sources were detected at lower energies. The dedicated analysis of 10-900 GeV Fermi/LAT data reported in Abdalla et al. (2021) resulted only in upper limits on the fluxes of both, extended and point-like components. XMM-Newton observations of HESS J1702-420 region did not result in a detection of X-ray counterpart of HESS J1702-420A source, but allowed Giunti et al. (2022) to put constraints on its flux. We note that the size of HESS J1702-420B exceeds the field of view (FoV) of XMM-Newton which prevented Giunti et al. (2022) from constraining this source.
While, as suggested by Abdalla et al. (2021), HESS J1702-420A and HESS J1702-420B can have independent origin, in our recent paper (Aharonian et al. 2023) we suggested that both sources are manifestations of a single phenomena. To explain the TeV emission from HESS J1702-420 complex we proposed a model in which VHE protons are accelerated in (or close to) point-like source HESS J1702-420A and injected into a dense surrounding neutral hydrogen’s cloud of characteristic size of and density cm-3. The observed emission originate from pion-decay process and observed morphological changes correspond to the transition in protons’ propagation regime. The low-energy protons are propagating in a strongly diffusive regime, and consequently characterised by quasi-isotropic angular momenta distribution. The pion decay emission from protons propagating in this regime result in an extended TeV source HESS J1702-420B. To the contrary, the high-energy protons are propagating in a (quasi) ballistic regime and characterised by delta-function like distribution of angular momenta. In this regime the observed -ray emission is characterised by a point-like morphology. A similar model was proposed earlier by Chernyakova et al. (2011) to describe the spectral behaviour of the Galactic Center in the GeV energy band.
To explain simultaneously the observed spatial and spectral behaviour of HESS J1702-420A and HESS J1702-420B sources Aharonian et al. (2023) proposed that the region is characterised by a diffusion coefficient , which is essentially suppressed at low energies in comparison to the interstellar medium ( cm2/s at 1 TeV) but with a strong energy-dependence () that results in the propagation of highest energy protons ( TeV) in ballistic regime. The detected fluxes of gamma rays require a powerful proton accelerator with an injection rate at the level of erg/s.
The secondary electrons produced as a result of the pion-decay process simultaneously with TeV photons are expected to emit the synchrotron radiation, potentially detectable in the X-ray band. This radiation is expected to be characterised by a hard () X-ray spectrum and a flux erg/cm2/s at 1 keV for a broad range (G) of considered magnetic fields in the region (Aharonian et al. 2023). The spatial scale of the emission is expected to significantly exceed the size of HESS J1702-420 complex and be of a degree-scale for preferable (kpc) distances to this complex.
Alternatively, the sources can have an independent origin with the TeV emission produced by a population of relativistic electrons present in the region and emitting Inverse Compton (IC) on a soft-photons radiation field (Abdalla et al. 2021; Giunti et al. 2022). A search of the X-ray counterpart for a point-like HESS J1702-420A source for this-type model was performed by Giunti et al. (2022) with XMM-Newton. This study did not result in a significant detection of point-like X-ray counterpart, but allowed to constrain magnetic field in HESS J1702-420A vicinity to be G. At the same time the narrow field of view (FoV) of XMM-Newton did not allow Giunti et al. (2022) to perform searches for the counterpart of a diffuse source HESS J1702-420B.
In this work we perform a search for an extended emission around HESS J1702-420A position, as expected X-ray counterpart of HESS J1702-420 complex. For these purposes we utilise data-release DR1 dataset (Merloni et al. 2024) of eROSITA satellite (Predehl et al. 2021), i.e. the data taken within first 6 months of eROSITA operation. The publicly available data fully covers the western part of the Galactic hemisphere (Merloni et al. 2024) and thus is perfectly suitable for searches of the large-scale diffuse emission.
2 Data Analysis
For the analysis we utilised all publicly available eROSITA DR1 data (data processing version 010), analysed it with eSSAS4DR1 and heasoft-6.31 and performed spectral analysis with XSPEC v.12.13.0c software. We selected for the analysis 19 eROSITA sky tiles111Available for download from eROSITA website overlapping with -radius circle around HESS J1702-420A position.
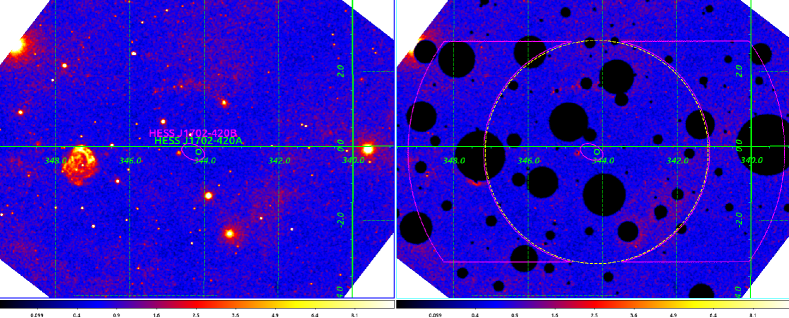
At the initial step of our analysis222Please see eROSITA analysis cookbook for the details we build the count map of the analysed region in 0.3-10 keV energy band with the help of evtool routine. Corresponding map is shown in the left panel of Fig. 1 overlaid with green and magenta ellipses illustrating positions and spatial extent in the TeV band of HESS J1702-420A and HESS J1702-420B sources correspondingly. Aiming in searches of the potentially largely spatially-extended (suggested to be of a degree-scale Aharonian et al. (2023)) emission from the X-ray counterpart(s) of these sources we explicitly masked for the analysis all bright X-ray sources detected in the region. Namely, we performed a search of sources detected at up to level above the local background with the help of erbox and created a mask of the region, masking all sources above detection likelihood threshold equal to 5 with the help of erbackmap routines. The count map of the analysed region with the applied exclusion mask is shown in Fig. 1, right panel.
We note, that there are no visible indications of presence of a large spatial-scale residual emission333Note, that the diffuse shell-like structure at is a known GeV/TeV SNR HESS J1713.7-3946 (Aharonian et al. 2007). centered in the vicinity of HESS J1702-420 in the Fig. 1. In order to justify this qualitative statement we performed a dedicated spectral analysis aiming either to detect the extended emission in the region or to put constraints on its flux.
2.1 Hadronic model: secondary electrons’ synchrotron emission
In this subsection we explicitly assume that the X-ray emission originates from the synchrotron emission of the secondary electrons produced in hadronic model Aharonian et al. (2023). In this case the expected X-ray signal is characterised by a hard spectrum (Aharonian et al. 2023) and the described below analysis was performed for this spectral index.
For the spectral analysis we selected an “ON” region of a certain radius (see Tab. 1) centered at the position of HESS J1702-420A (, ) and corresponding to the possible size of the X-ray counterpart of the TeV source HESS J1702-420. For the estimations of the background flux we utilised the “OFF”-region of the “cutted annulus” shape. The borders of the “OFF”-region are given by an annulus centered at HESS J1702-420A position with the inner radius and outer . Aiming to minimize the impact of possible background variations due to somewhat different average galactic latitudes of ON and OFF regions we additionally cut the OFF-region annulus at minimal/maximal galactic latitudes of the ON region. The characteristic shapes of ON and OFF regions are illustrated in the right panel of Fig. 1 with yellow dashed circle and magenta cutted annulus correspondingly. The exposures of the spectra varies from ksec for to ksec for region.
The widely used “ON-OFF” approach for the estimation of the presence of the signal in ON region relies on the assignment of the OFF-region spectrum as a background for the ON-spectrum and subsequent fitting of the resulted residual spectrum with a certain model. However such an approach relies strongly on the assumption of absence of the variations of the parameters of the background emission in ON and OFF regions. Such an assumption, however, could fail in case if ON and/or OFF regions are significantly extended. In this case the astrophysical background emission in ON and OFF region could be characterised by somewhat different parameters of the medium (e.g. neutral hydrogen column density and/or temperature of the interstellar plasma) which results in a biased (over or under-subtracted) residual ON-OFF spectrum.
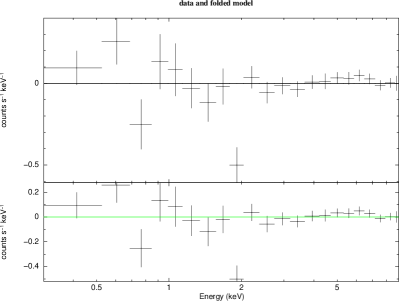
We demonstrate the presence of such an issue with the ON-OFF analysis of the HESS J1702-420 vicinity for the regions of characteristic scale of -radius. Fig. 2, left panel illustrates the ON-OFF (background subtracted) spectrum for the -radius size of the ON region (top sub-panel) and residuals with respect to the best-fit absorbed powerlaw model of the signal ( tbabs*powerlaw in terms of XSPEC444With “wilms” abundances (Wilms et al. 2000) with index fixed to 2). The residual spectrum is statistically consistent with 0, does not demonstrate any energy-depended features and can be used to derive the unbiased upper limits on the normalisation of the signal’s model. The right panel of Fig. 2 shows similar ON-OFF spectrum for the . In this case the spectrum is characterised by a wiggle-like structure with strong over-subtraction at keV energies and under-subtraction in keV energy range. The shown ON-OFF spectrum is unsuitable thus for an unbiased estimations of the strength of the signal. We argue, that the observed wiggle-like structure is connected to variations of the neutral hydrogen density and/or interstellar plasma temperature between ON and OFF regions, i.e. on spatial scales.
Thus, to derive the robust constraints on the flux of the possible spatially-extended source present in the region instead of ON-OFF approach we adopted a background-modelling technique, widely used e.g. in the dark matter searches (see e.g. Thorpe-Morgan et al. 2020; Malyshev et al. 2022). Namely, instead of considering a difference of ON and OFF spectra we focus on a joint spectral modelling of these quantities. We propose to model spectra of ON and OFF regions with a sum of the astrophysical and instrumental background models.
To the model of astrophysical background we included the following components: (i) powerlaw with the spectral index fixed to 2 (presenting the possible signal from X-ray counterpart of HESS J1702-420); (ii) low-temperature plasma ( keV, presenting the contribution from the plasma local to the Solar system); (iii) high-temperature plasma ( keV, presenting the hot plasma in the MW); (iv) powerlaw with the index fixed to 1.4 (presenting the contribution from cosmic X-ray background (De Luca & Molendi 2004)). We additionally corrected the described model for the interstellar neutral hydrogen absorption. In terms of XSPEC the model is given by apec + tbabs(powerlaw + apec + powerlaw) model. Please note, that the apec model component not convolved with the interstellar absorption present the low-temperature plasma local to the Solar system.
To the model of the instrumental background we include a broken powerlaw and 3 narrow gaussian lines at energies keV (Ne IX line); keV (Si K/Si K lines); keV (Fe K line), see e.g. Malyshev et al. (2022) for a summary of the typical XMM-Newton instrumental lines. Note, that the instrumental model was not convolved with eROSITA effective area.
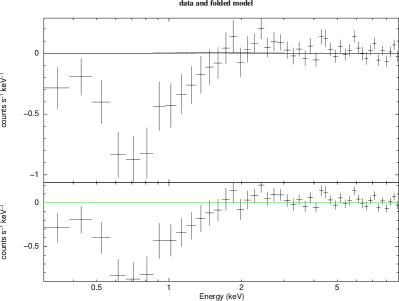
To derive the reported here constraints on the flux of the extended source we simultaneously modeled the spectra of ON and OFF regions with a sum of described models. We additionally required that (i) the temperature of the local plasma is identical for ON and OFF regions; (ii) the flux of the astrophysical components of the model in ON and OFF regions is proportional to the not-masked area of the analysed region (basing on BACKSCALE keyword of the corresponding spectra). The flux from the possible X-ray counterpart of HESS J1702-420 was explicitly set to 0 in OFF region. The characteristic spectra of ON (red points and curves) and OFF (black points and curves) regions along with the proposed best-fit models and residuals with respect to these models are shown in Fig. 3.
The best-fit values of the key parameters of astrophysical model for ON and OFF regions are summarized in Tab. 1. This Table summarizes the temperature of the plasma local to the Solar system (); temperatures of the interstellar plasma in ON and OFF regions ( and correspondingly); neutral hydrogen column density for ON and OFF regions ( and correspondingly) and the limit on the flux of an extended source with spectrum at 1 keV energy. The flux limit correspond to (% c.l.) statistical limit and was calculated with error 4.0 XSPEC command. The columns and indicate the radius of the ON region and the outer radius of the OFF region correspondingly.
For the relatively small radii of the ON region the statistics of the data does not allow firm measurement of the plasma temperatures and/or interstellar absorption. In these cases we fixed corresponding parameters to the values indicated in the Tab. 1 basing on the values observed at larger . For the smallest corresponding to the size of H.E.S.S. point spread function the statistics of the data does not allow any firm measurement of the neutral hydrogen absorption. In this case we explicitly consider two values – cm-2 as indicated by best-fit values at larger and cm-2 as suggested by mean galactic value in HESS J1702-420 direction555As reported at heasarc nH column density website. For this value we indicate in the Table 1 two values for the flux limit and use in what follows the conservative limit.
The described models well fit the data with the reduced for all . For lager radii we noticed the worsening of the fit possibly originating from the presence of multi-temperature and/or variable sub-regions within analysed area. To derive robust constraints in these cases we add (in quadratures) to the data the systematic uncertainty of % level (see “Systematic” column of Tab. 1) which is required for the reduced of the fit to be 1.
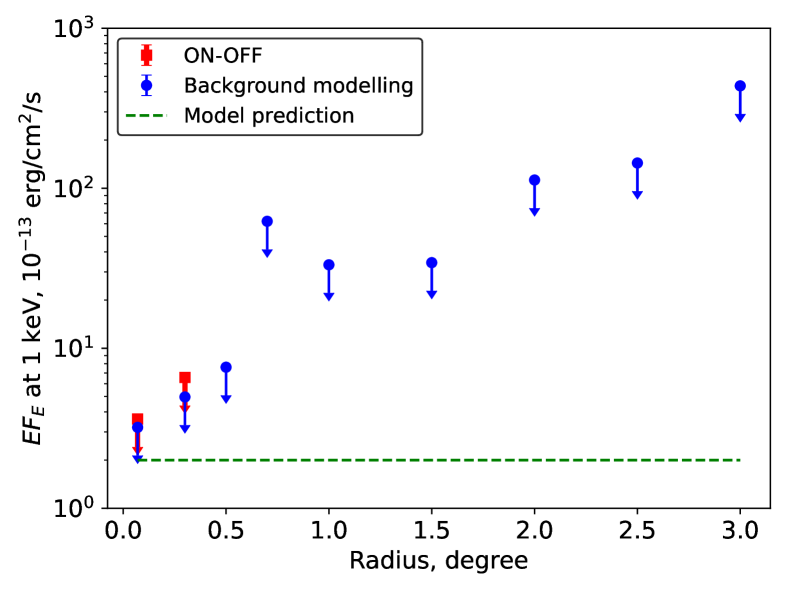
The derived upper limits on the flux at 1 keV of the extended source centered at the position of HESS J1702-420A as a function of the radius of the source are shown in Fig. 4. The red square points indicate results from ON-OFF analysis performed at where the bias caused by different plasma temperatures/ values in ON and OFF regions can be neglected. Blue circle points present the results from background modelling approach and correspond to flux limit values indicated in Tab. 1. The green dashed line illustrate the characteristic flux of the extended source expected from Aharonian et al. (2023) model. We note also a weak, statistically insignificant detection at level of the signal at which somewhat weakened the flux limits at these radii.
We would like to note as well that the dedicated analysis limited only to cameras not affected by a light-leak666See e.g. eROSITA known issues webpage result in very similar upper limits on the flux of the extended source.
2.2 Leptonic model: primary electrons’ synchrotron emission
As an alternative to the hadronic model described in Aharonian et al. (2023) we consider a simple leptonic model. In this model the observed diffuse TeV emission from HESS J1702-420B is explained as an Inverse Compton emission of a powerlaw population of electrons producing VHE emission on the CMB photons. The emission in the X-ray band in this model corresponds to the synchrotron emission from the same population electrons. The emission of the discussed model components was calculated with naima v. 0.10.0 model (Zabalza 2015) which uses Aharonian et al. (2010); Khangulyan et al. (2014) approach to calculate synchrotron and IC components correspondingly.
We derive the parameters of the relativistic electrons’ population by fitting the described IC radiation model to the H.E.S.S. data on HESS J1702-420B. We found that this population is characterised by a relatively soft spectrum of and the total energy in electrons above 1 TeV is erg, see Fig. 5. The corresponding X-ray spectrum is characterised by an index and normalisation proportional to the square of strength of the magnetic field in the region.
Assuming that the X-ray signal originates from a region identical to the spatial shape of HESS J1702-420B source777An ellipse, centred at , semi-axes and rotation angle we have performed an analysis similar to described in Sec. 2.1. Given relatively large size of the signal-extraction region we focused on the background modelling approach. Namely, we extracted background spectrum from the elliptic-annulus region with the inner boundaries coinciding with the signal extraction region. The outer boundary of the background region was defined as an ellipse with semi-axes by a factor of 1.5 larger than the semi-axes of the signal region.
We found, that similar to Sec. 2.1 the data is well-fitted by the described model with zero-level systematic uncertainty. The 95% c.l. upper limit on the flux at 1 keV for the discussed spectral index is ph/cm2/s or erg/cm2/s (red upper limit in Fig. 5). This upper limits correspond to the upper limit on the magnetic field in the considered region of G.
In order to estimate the potential impact of systematic uncertainties on this value we have considered an alternative model, in which the IC TeV emission is produced on Interstellar Radiation Field background Porter et al. (2008) (for kpc ISRF model). We found that for this model the upper limit on the magnetic field is somewhat relaxed to G. We note, that for the models suggesting higher density of the soft photons’ background one can expect even more relaxed limits on the magnetic field.
An additional source of systematic uncertainty could arise from the systematic uncertainty on the flux level of HESS J1702-420B measured by H.E.S.S. that could reach % (Aharonian et al. 2006a). This uncertainty correspond to an additional % systematic uncertainty on the derived limit on the magnetic field in the region, putting it at a level of G.
| Flux limit | Systematic | |||||||
|---|---|---|---|---|---|---|---|---|
| degree | degree | keV | keV | keV | cm-2 | cm-2 | ph/keV/cm2/s | |
| 0.07 | 0.12 | 0.17* | 0.68* | 0.68* | * | 0 | ||
| 0.3 | 0.51 | 0 | ||||||
| 0.5 | 0.85 | 0 | ||||||
| 0.7 | 1.19 | 0 | ||||||
| 1.0 | 1.7 | 0 | ||||||
| 1.5 | 2.55 | 0 | ||||||
| 2.0 | 3.4 | 0.05 | ||||||
| 2.5 | 4.25 | 0.04 | ||||||
| 3.0 | 5.1 | 0.04 |
3 Results and Discussion

In this work we present the results of the search for a possible X-ray counterpart of HESS J1702-420 complex (Abdalla et al. 2021). In the TeV band it is characterised by a peculiar energy-dependent morphology and could be described as a superposition of two sources – point-like HESS J1702-420A and significantly extended () HESS J1702-420B. These sources demonstrate hard (HESS J1702-420A) and soft (HESS J1702-420B) powerlaw spectra up to few tens TeV without cutoff indications.
According to the model proposed by Aharonian et al. (2023) the morphology and spectral behaviour of HESS J1702-420 complex can be explained in terms of hadronic emission from the protons accelerated in HESS J1702-420A source and propagating through the surrounding medium in an energy-dependent regime. The synchrotron emission from the secondary electrons produced in -decay is characterised by a hard spectrum (see Fig. 5) and could be potentially detected in the keV energy band. Aharonian et al. (2023) suggested that the characteristic spatial size of the X-ray counterpart of HESS J1702-420 significantly exceeds TeV-band size of HESS J1702-420B source and reach degree-scale values.
As an alternative to Aharonian et al. (2023) model we considered a simple leptonic model in which the observed diffuse TeV emission originate from an IC emission of the population of relativistic electrons on a soft radiation field present in the region. In this case the X-ray emission is expected to be characterised by a softer slope of (see Fig. 5) and flux level defined by the strength of the magnetic field in the region.
In our work we performed a search for a counterpart in eROSITA DR1 dataset covering first 6 months of data taking. Our analysis indicates that HESS J1702-420 is located in a relatively crowded X-ray region (see Fig. 1) characterised by a degree-scale gradients of the interstellar plasma temperature and/or neutral hydrogen column densities, see Tab. 1. Similarly to previous XMM-Newton observations (Giunti et al. 2022) we did not find obvious point-like X-ray counterparts of HESS J1702-420A and HESS J1702-420B sources within TeV error-ellipses and focused on searches for the largely extended emission in this region.
In order to constrain hadronic model of Aharonian et al. (2023) we performed a search for a hard spectrum (), disk-like spatial morphology sources centered at the position of HESS J1702-420A. Our searches did not result in a significant detection of the emission in 0.3-10 keV energy band for source radius varying between and . Fig. 4 shows the derived flux limits at 1 keV as a function of the radius of the source. The red points illustrate the limits derived within the widely used ON-OFF, “background subtraction” approach, while the blue ones stand for the background modelling method. Note, that the ON-OFF approach at larger radii could result in biased limits, see Fig. 2 and Sec. 2 for the details. The green dashed line in Fig. 4 indicate the expected flux level of the HESS J1702-420 counterpart predicted by Aharonian et al. (2023) model.
The derived limits are significantly weaker than the flux level expected from Aharonian et al. (2023) model. This does not allow us to firmly confirm or reject the proposed model with the current eROSITA data. While this work is based only on first six months of eROSITA data (DR1 data-release), about 2 years of eROSITA data will become public at the end of 2025888According to eROSITA data release schedule . With the same all-sky monitoring strategy this will increase the available exposure by a factor of 4, and in case of absent systematic could allow improvement of presented limits by a factor of 2. Although this improvement is not significant enough to probe the predicted by Aharonian et al. (2023) flux range, it could help to detect the source, in case if the model flux was underestimated by a factor of a few. An order of magnitude improvement of the current limits, required to reach predicted by Aharonian et al. (2023) flux level from a few-degree-scale source, could be achieved (assuming statistical uncertainty only) with times longer exposure, see Fig. 5. Namely, such an improvement would require s long observations with eROSITA or similar missions.
We note also, that our analysis indicated variations of the neutral hydrogen density along the analysed region. The density is highest close to HESS J1702-420A position with a trend to decrease at larger distances (i.e. larger and radii), see Tab. 1. This indirectly supports Aharonian et al. (2023) model, suggesting that the TeV emission from HESS J1702-420B source is connected with a dense molecular cloud of size surrounding the VHE protons’ accelerator HESS J1702-420A.
Our analysis performed for the leptonic model did not led to the detection of the X-ray emission in the spatial region coinciding by the shape with HESS J1702-420B source. We estimated the magnetic field strength in the region to be G (including possible systematic uncertainties) which is in a broad agreement with the characteristic strength of the interstellar magnetic field (Jansson & Farrar 2012). We note, that the derived value is also consistent with the value of the magnetic field for the point-like source HESS J1702-420A derived by Giunti et al. (2022) (G).
We argue, that the further advances on the searches of X-ray counterpart of the TeV source HESS J1702-420 could be done either with a broad-FoV, large effective area future missions e.g. Athena/WFI (Meidinger et al. 2020) or Msec-long observational campaigns with the current-generation instruments (XMM-Newton or eROSITA) which will allow at least an order of magnitude improvement of the presented upper limits based on ksec-long observations of eROSITA.
Acknowledgements
The authors acknowledge support by the state of Baden-Württemberg through bwHPC.
References
- Abdalla et al. (2021) Abdalla, H., Aharonian, F., Ait Benkhali, F., et al. 2021, A&A, 653, A152
- Aharonian et al. (2008) Aharonian, F., Akhperjanian, A. G., Barres de Almeida, U., et al. 2008, A&A, 477, 353
- Aharonian et al. (2006a) Aharonian, F., Akhperjanian, A. G., Bazer-Bachi, A. R., et al. 2006a, A&A, 457, 899
- Aharonian et al. (2006b) Aharonian, F., Akhperjanian, A. G., Bazer-Bachi, A. R., et al. 2006b, ApJ, 636, 777
- Aharonian et al. (2007) Aharonian, F., Akhperjanian, A. G., Bazer-Bachi, A. R., et al. 2007, A&A, 464, 235
- Aharonian et al. (2023) Aharonian, F., Malyshev, D., & Chernyakova, M. 2023, ApJ, 955, 147
- Aharonian et al. (2010) Aharonian, F. A., Kelner, S. R., & Prosekin, A. Y. 2010, Phys. Rev. D, 82, 043002
- Chernyakova et al. (2011) Chernyakova, M., Malyshev, D., Aharonian, F. A., Crocker, R. M., & Jones, D. I. 2011, ApJ, 726, 60
- De Luca & Molendi (2004) De Luca, A. & Molendi, S. 2004, A&A, 419, 837
- Giunti et al. (2022) Giunti, L., Acero, F., Khélifi, B., et al. 2022, A&A, 667, A130
- Jansson & Farrar (2012) Jansson, R. & Farrar, G. R. 2012, ApJ, 757, 14
- Khangulyan et al. (2014) Khangulyan, D., Aharonian, F. A., & Kelner, S. R. 2014, ApJ, 783, 100
- Malyshev et al. (2022) Malyshev, D., Moulin, E., & Santangelo, A. 2022, Phys. Rev. D, 106, 123020
- Meidinger et al. (2020) Meidinger, N., Albrecht, S., Beitler, C., et al. 2020, in Society of Photo-Optical Instrumentation Engineers (SPIE) Conference Series, Vol. 11444, Space Telescopes and Instrumentation 2020: Ultraviolet to Gamma Ray, ed. J.-W. A. den Herder, S. Nikzad, & K. Nakazawa, 114440T
- Merloni et al. (2024) Merloni, A., Lamer, G., Liu, T., et al. 2024, A&A, 682, A34
- Porter et al. (2008) Porter, T. A., Moskalenko, I. V., Strong, A. W., Orlando, E., & Bouchet, L. 2008, ApJ, 682, 400
- Predehl et al. (2021) Predehl, P., Andritschke, R., Arefiev, V., et al. 2021, A&A, 647, A1
- Thorpe-Morgan et al. (2020) Thorpe-Morgan, C., Malyshev, D., Santangelo, A., et al. 2020, Phys. Rev. D, 102, 123003
- Wilms et al. (2000) Wilms, J., Allen, A., & McCray, R. 2000, ApJ, 542, 914
- Zabalza (2015) Zabalza, V. 2015, Proc. of International Cosmic Ray Conference 2015, 922