Progenitor Constraint Incorporating Shell Merger: The Case of Supernova Remnant G359.00.9
Abstract
It is generally hard to put robust constraints on progenitor masses of supernovae (SNe) and remnants (SNRs) observationally, while they offer tantalizing clues to understanding explosion mechanisms and mass distribution. Our recent study suggests that “shell merger”, which is theoretically expected for stellar evolution, can appreciably affect final yields of inter-mediate mass elements (IMEs; such as Ne, Mg, and Si). In light of this, here we report results of X-ray spectral analysis of a Galactic SNR G359.00.9, whose abundance pattern may possibly be anomalous according to a previous study. Our spectroscopy using all the available data taken with XMM-Newton reveals that this remnant is classified as Mg-rich SNRs because of its high Mg-to-Ne ratio (; mass ratio ) and conclude that the result cannot be explained without the shell merger. By comparing the observation with theoretical calculations, we prefer the so-called Ne-burning shell intrusion and in this case the progenitor mass is likely . We confirm the result also by our new molecular line observations with the NRO-45 m telescope: G359.00.9 is located in the Scutum-Centaurus arm (2.66–2.94 kpc) and in this case the resultant total ejecta mass is indeed consistent with the above estimate. Our method using mass ratios of IMEs presented in this paper will become useful to distinguish the type of the shell merger, the Ne-burning shell intrusion and the O-burning shell merger, for future SNR studies.
1 Introduction
Core-collapse (CC) supernovae (SNe) spread heavy elements produced during their progenitor’s evolution and ensuing explosive end, and thus abundances of ejecta in supernova remnants (SNRs) should provide rich information on their past stellar and explosive nucleosynthesis. Although a wide variety of elemental compositions has been reported so far from X-ray spectroscopy of SNRs, a plausible connection between their abundances and progenitor properties is still missing. This is partially because the yield of nucleosynthesis products depends on explosion mechanisms which are currently not fully understood. (decaying to ) is, for instance, created near the proto-neutron star (PNS), where there is a large theoretical uncertainty. While, as Katsuda et al. (2018) reported, the abundance ratio of Fe/Si is known as one of the promising parameters for estimating zero age main sequence mass (), a total mass of varies with different explosion engines (e.g., Sawada & Maeda, 2019; Ertl et al., 2020; Imasheva et al., 2023; Sawada & Suwa, 2023, and references therein).
Lighter elements such as O, Ne, and Mg are mainly synthesized in the pre-SN phase, which may give us more direct hints in understanding progenitors. In our recent study (Sato et al., 2024), we suggested that the high Mg/Ne ratio in the ejecta of a SNR N49B can be explained by a destratification process, in agreement with progenitor models published by Sukhbold et al. (2018). Such so-called ”shell merger” processes are also reported by recent multi-dimension simulations of the progenitor interior (c.f. Mocák et al., 2018; Andrassy et al., 2020; Yadav et al., 2020). According to Collins et al. (2018) and our study (Sato et al., 2024) with the models of Sukhbold et al. (2018), such events will commonly occur in several tenths of a percent of progenitors, which may also affect the chemical evolution of galaxies (Ritter et al., 2018). As indicated by Yadav et al. (2020), when the O- or Ne-burning shell is merged with the outer O-Ne-Mg layer before the collapse, the total yield of Ne is heavily depleted and the resultant Mg/Ne will become higher. We also found that if such violent mergers of burning shells occur the compactness parameter (O’Connor & Ott, 2011) tends to become smaller (Sato et al., 2024): with this stellar evolution path even a supermassive star with may become explodable. Mg-rich SNRs are therefore possibly massive-star remnants while observations of SNe show no robust evidence for an explosion of a red supergiant whose exceeds (red supergiant problem; Davies & Beasor, 2020, and references therein).
Although only a few Mg-rich SNRs has been reported so far (N49B; G284.3-1.8, Park & Bhalerao, 2017; Williams et al., 2015), more candidates will be identified by precisely measuring the Ne and Mg abundances; most promising targets for this purpose would be low-absorbed, i.e., nearby remnants. Here, we focus on the analysis of G359.00.9, which has a large apparent size, suggesting a nearby SNR. G359.00.9 was first discovered by a 10-GHz radio continuum survey with the Nobeyama 45-m (NRO 45-m) telescope (Sofue & Handa, 1984) and follow-up observations revealed a partial radio shell in 1.2 GHz (MeerKAT; Heywood et al., 2022) and H (Anglo-Australian Observatory/United Kingdom Schmidt Telescope; Stupar & Parker, 2011). X-ray observations have been performed with ASCA (Bamba et al., 2000) and Suzaku (Bamba et al., 2009), which have revealed an extremely asymmetric morphology and also suggested a relatively large Mg abundance of ejecta. Although these previous studies imply that G359.00.9 is another candidate for massive-star remnants, the ejecta mass, which correlates with (e.g., Sukhbold et al., 2016), is still uncertain due to discrepant distance estimates; (X-ray absorption; Bamba et al., 2000), or (luminosity attenuation of red clumps; Wang et al., 2020), and (- relation; Pavlović et al., 2012).
In this paper, we present the results of X-ray and molecular line observations of G359.00.9 with XMM-Newton and NRO 45-m. This paper is organized as follows. Section 2 details the above observations and data reduction method. In Section 3, we show results of spectroscopy and provide evidence that this remnant is classified as Mg-rich SNRs. We also report discovery of a molecular cloud associated with G359.00.9. We then discuss the origin of the Mg-rich SNRs in Section 4 and infer the progenitor mass of G359.00.9 in conjunction with a distance estimation through the velocity of the associated cloud. Throughout the paper, errors of parameters are defined as 1 confidence level and the solar abundance is given by Wilms et al. (2000).
2 Observation and data reduction
2.1 X-ray observation with XMM-Newton
| Obs. ID | Date of Obs. | Detector | Total Exposure (ks) | Effective Exposure (ks) |
|---|---|---|---|---|
| 0152920101 | 2003-04-02 | MOS1 | 51.5 | 48.1 |
| MOS2 | 51.5 | 47.0 | ||
| pn | 48.9 | 36.8 | ||
| 0801680501 | 2017-09-18 | MOS1 | 26.9 | 20.4 |
| MOS2 | 28.1 | 22.2 | ||
| pn | 22.9 | 16.0 | ||
| 0801680701 | 2017-09-23 | MOS1 | 28.5 | 26.9 |
| MOS2 | 28.6 | 27.1 | ||
| pn | 26.1 | 23.6 | ||
| 0804250301 | 2018-03-13 | MOS1 | 40.6 | 39.5 |
| MOS2 | 40.6 | 39.7 | ||
| pn | 39.5 | 38.4 |
G359.00.9 has been observed with XMM-Newton four times so far as summarized in Table 1. For the following analysis, we used data from European Photon Imaging Camera (EPIC) instruments: two metal-oxide semiconductor (MOS) detectors (Turner et al., 2001) and one pn detector (Strüder et al., 2001). Data reduction was performed using the XMM Science Analysis System (SAS) version 19.1.0 with the most recent Current Calibration Files (CCF). We combined the spectral files using mathpha from the HEASoft software package. The redistribution matrix file (RMF) and ancillary response file (ARF) for each observation were multiplied using marfrmf. They were then merged using addrmf, weighting by their effective exposure times and detector areas. For the following spectral analysis, we used version 12.13.0c of an X-Ray Spectral Fitting Package (XSPEC, Arnaud, 1996).
2.2 Nobeyama 45-m molecular line observations
Molecular line observations were carried out by two separated sessions in April 2023 by using the Nobeyama 45 m telescope (PI; K. Matsunaga). We used FOur-beam REceiver System on the 45-m Telescope (FOREST; Minamidani et al., 2016), and Spectral Analysis Machine for the 45-m telescope (SAM45; Kamazaki et al., 2012) in the frontend and backend, respectively. FOREST is comprised of four beams with two polarization and two sidebands. Thanks to the large intermediate frequency (IF) bandwidths of 8 GHz (4–12 GHz), a simultaneous observation with , , and C18O(J=1–0) is realized. A typical system noise temperature toward the source and the image rejection ratio were 500 K, and 15 dB, respectively. SAM45 is a FX-type correlator, which consists of 16 IF bands (4 beams2 polarizations2 sidebands) with a 2-GHz bandwidth. We configured two settings for the spectrometer: CO isotopes in a first wide-area survey (setting 1), and follow-up, small-area observations with HCO+, SiO, and HCN (setting 2). We used a “spectral window mode”, which produces two independent spectral windows within each IF band. The roles of 32 spectral windows to the two spectrometer settings are summarized in Table 2. The narrow/wide bands correspond to the velocity resolutions and velocity coverages of 0.33/0.67 km s-1 and 300/600 km s-1, respectively.
| Setting | A01 to A08 | A09 to A16 | A17 to A24 | A25 to A32 |
|---|---|---|---|---|
| 1 | wide band | C18O(J=1–0) narrow band | narrow band | narrow band |
| 2 | HCO+(J=1–0) wide band | SiO(J=2–1) wide band | HCN(J=1–0) wide band | SiO(J=2–1) narrow band |
Through a deep position-switching observation toward (, ) = (11000, 18000) by beam 1, we found that this direction does not include any significant emissions over a 3 noise level in all beams, and thus we used this coordinate as the emission-free direction to do a chopper wheel calibration (Kutner & Ulich, 1981). Pointing observations were done every two hours by observing SiO masers (OH2.60.4) with the H40 receiver at 40 GHz, and achieved a pointing accuracy better than 2″. We carried out mapping observations of the large area shown in Figure 3 with setting 1, and limited areas with setting 2. The half-power beam widths (HPBW), velocity resolutions, and typical r.m.s. noise fluctuations of the final datasets are 2626/26, 0.25/0.25/0.25 km s-1, and 0.60/0.17/0.17 K per channel in scale for 12CO, 13CO, and C18O, respectively. SiO(J=2–1) emissions were not detected in our observations.
3 Data Analysis
3.1 X-ray Spectroscopy
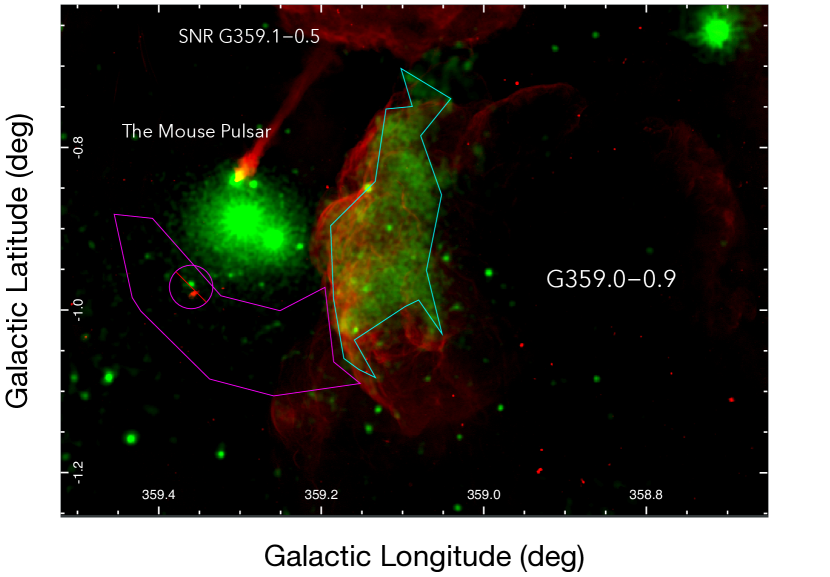
Figure 1 shows the background-subtracted X-ray image of G359.00.9. We found that only the eastern part is bright in X-ray within the radio shell whereas the other region is comparable with the background level outside of the remnant. It is also notable that the X-ray surface brightness is rather uniform in the east and that no apparent shell-like structure is seen there, which implies that G359.00.9 belongs to the class of Mixed-Morphology (MM) SNRs (Rho & Petre, 1998). If this is the case, X-ray emission we detected in G359.00.9 is from shock-heated ejecta, as is the case with the other MM SNRs such as W44 (Uchida et al., 2012) and G359.10.5 (Suzuki et al., 2020).
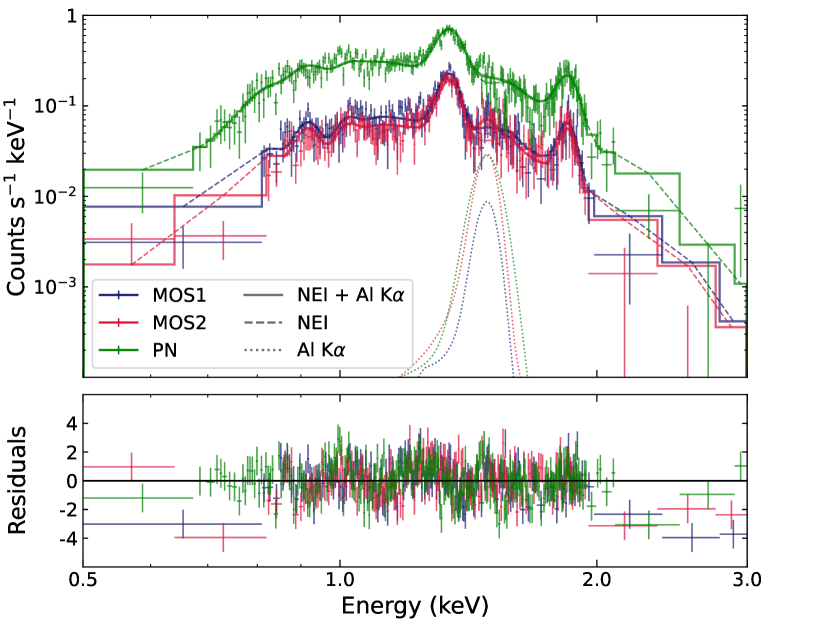
For the following analysis, we focus on the bright eastern part of G359.00.9 as shown in Figure 1. The background region was chosen from the vicinity of the remnant, avoiding the point-spread function from nearby bright binaries (SLX 1744–300/299). Figure 2 displays the obtained spectrum, in which we detected prominent emission lines of highly ionized Mg and Si; no apparent line features of the Fe-L complex and Ne are found. We applied an absorbed non-equilibrium ionization collisional plasma model (NEI; vnei in XSPEC), which is based on Bamba et al. (2009). We set the electron temperature , ionization timescale , normalization and abundances of Ne, Mg, Si (=S=Ar=Ca), Fe (=Ni) as free parameters. The column density was also varied using tbabs (Tübingen-Boulder absorption model; Wilms et al., 2000). We also added a Gaussian component at 1.48 keV, which represents a known Al K line emission due to the particle-induced background of EPIC (Carter & Read, 2007). The single-component NEI model provides a successful fit for the spectrum, as shown in Figure 2. Although residuals are seen especially around the keV band, the widths of these humps are smaller than the response function of EPIC. The addition of another NEI component or freeing the O abundance does not significantly improve the fit, hence we conclude that these residuals are attributed to statistical uncertainty.
The best-fit parameters are listed in Table 3. The result is almost consistent with the previous studies (Bamba et al., 2000), whereas we additionally measured abundances of Ne and Si for the first time. Since Fe is less abundant than the other elements, which exceed the solar value, the plasma is most likely ejecta and thus G359.00.9 would be a remnant of a core-collapse SN. The most striking result of our analysis is the high Mg abundance against Ne; (mass ratio ) deviates significantly from that is expected in most of SNRs. We therefore conclude that G359.00.9 is another example of the Mg-rich SNRs (Park et al., 2003), which has been reported for only two samples: N49B (Park & Bhalerao, 2017) and G284.31.8 (Williams et al., 2015). We additionally note that the Si abundance is also significantly higher than that of Ne and even more abundant than that of Mg; (mass ratio ). Such a characteristic abundance pattern implies a somehow unusual nucleosynthesis during the stellar evolution or explosion.
| Components | Parameters | Best-fit values |
|---|---|---|
| Absorption (TBabs) | ||
| NEI | [keV] | |
| 1 (fix) | ||
| Gaussian | E [keV] | 1.48 (fixed) |
3.2 Discovery of a molecular cloud associated with G359.00.9
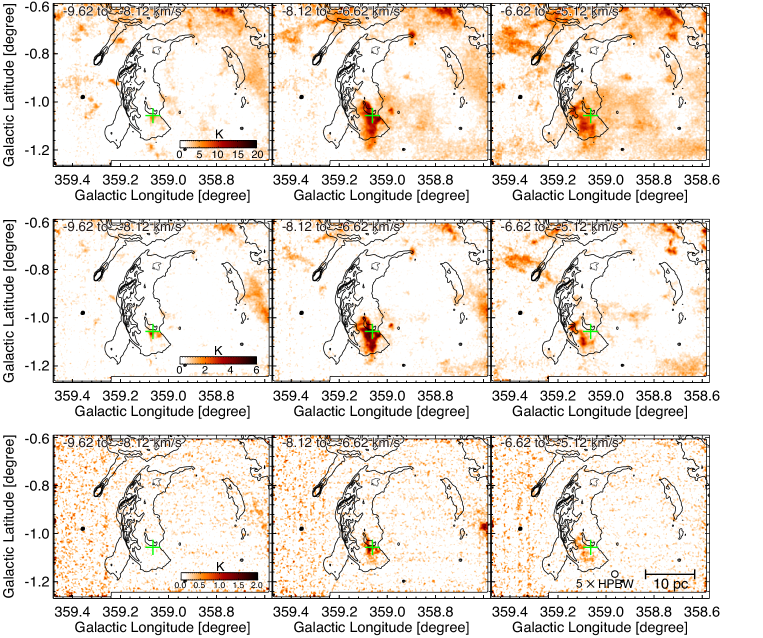
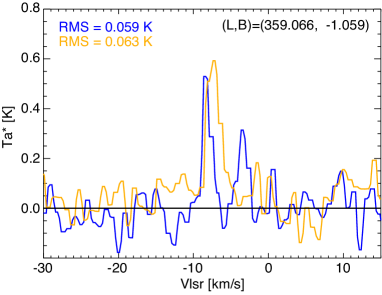
Although the investigation for interactions with surrounding material is important for measuring the distance, no evidence has been reported for G359.00.9 so far. Figure 3 shows velocity channel distributions of , , and C18O(J=1–0) obtained with our new observations. The optically thick emission prevails almost over the entire observation field, while and C18O(J=1–0) are detected only toward the bright parts in . We discovered a bright CO clump seen in all three CO isotopes toward (, ) = (35900 to 35912, 122 to 102). The cloud displays complex structure with a sharp edge at the boundary of the remnant and coincides with the edges of the southeastern radio-bright rims, which suggests an interaction between the cloud and the SN shock. As displayed in Figure 4, the spectra obtained by our follow-up observations under setting 2 (see Section 2.2) clearly show HCN(J=1–0) and HCO+(J=1–0) lines from the cloud with a sufficient significance (9–10). According to Seta et al. (2004), HCO+ lines trace collisionally excited, higher density spots owing to their large electric dipole moment, and they are mainly detected in SN shock regions. Thus, we conclude that the southeastern dense cloud at 7 km s-1 is associated with G359.00.9. The diffuse envelope of the associated cloud may be blown away by the stellar wind from the progenitor, and the surviving dense part is interacting with the remnant.
4 Discussion
4.1 Origin of G359.00.9 and Mg-rich SNRs
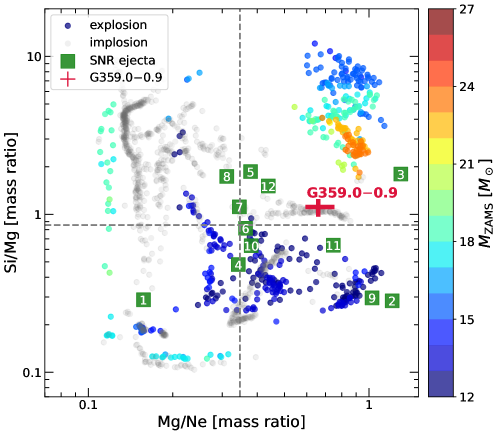
As stated in Section 3.1, our spectral analysis of G359.00.9 indicates that the Mg (and also Si) abundance is significantly higher than the solar value when compared with that of Ne. We have categorized this remnant as a Mg-rich SNR defined by Park et al. (2003). While only two SNRs have been identified as Mg-rich SNRs so far (Park & Bhalerao, 2017; Williams et al., 2015), we expect more candidates to be identified as is the case with G359.00.9. Based on a literature search, we found that at least two SNRs, RX J1713.73946 (Katsuda et al., 2015) and G290.10.8 (Kamitsukasa et al., 2015), may possibly fall into the “Mg-rich”category. In Figure 5, we plot the abundance ratios among Ne, Si, and Mg obtained in our spectral fit of G359.00.9 and previous measurements of other luminous SNRs. The result supports that several SNRs including G359.00.9 show higher Mg/Ne () while the others are roughly clustered around the solar value ().
We recently proposed that the abundant Mg observed in N49B is likely due to a destratification in the progenitor (Sato et al., 2024), where the O- or Ne-burning shell is breaking into outer layers shortly before the core collapse (shell merger; Yadav et al., 2020, and references therein). Such violent destratification promotes a series of Ne-burning processes like and in the case of an O-burning shell merger, is further enhanced. This scenario can account for the origin of the Mg-rich SNRs and we speculate that the abundance ratios among Ne, Si, and Mg are the keys to deciphering stellar nucleosynthesis and evolution. The Ne-burning processes before the explosion result in a higher Mg/Ne, i.e., Mg-rich ejecta, whereas if the O-burning shell merger undergoes, the resultant Si/Mg also becomes higher. Our spectral analysis of G359.00.9 shows a relatively high Si/Mg mass ratio compared with those of N49B and G284.31.8 (0.3 Park & Bhalerao, 2017; Williams et al., 2015), which may be explained by the shell merger with/without the O-burning shell merger.
In order to compare our results with theoretical expectations, we calculate a nucleosynthesis model taking into account the destratification. We used 1D stellar simulations with a standard mass-loss rate published by Sukhbold et al. (2018). The results are overlaid in Figure 5, where we distinguish whether the models are exploding or non-exploding by evaluating a threshold for the explodability (computed with the W18 engine) according to Ertl et al. (2016). Note that we calculated the values of Mg/Ne and Si/Mg outside than the O-burning shell, where the elemental composition is not changed drastically before/after a shock passage. Since Mg and Ne are mainly synthesized before core collapse whereas Si is enriched also in the explosive nucleosynthesis, the calculated values and the measured abundances (particularly of Si) should not be directly compared in Figure 5. It would be nevertheless remarkable that the calculated trend roughly coincides with the observations and especially that there are two “Mg-rich” groups with different Si/Mg. We found that the Mg-rich group with a high Si/Mg ratio indicates a relatively high (), and it is particularly notable that all the results of massive progenitors with are distributed only in this group. The result suggests that the high Si/Mg ratio observed in the ejecta of a Mg-rich SNR is a good indicator of a remnant of a massive progenitor: only a SNR that exhibits both Mg-rich ejecta and a high Si/Mg ratio would be a plausible candidate for a massive star’s remnant ().
4.2 Explosive Nucleosynthesis Yield
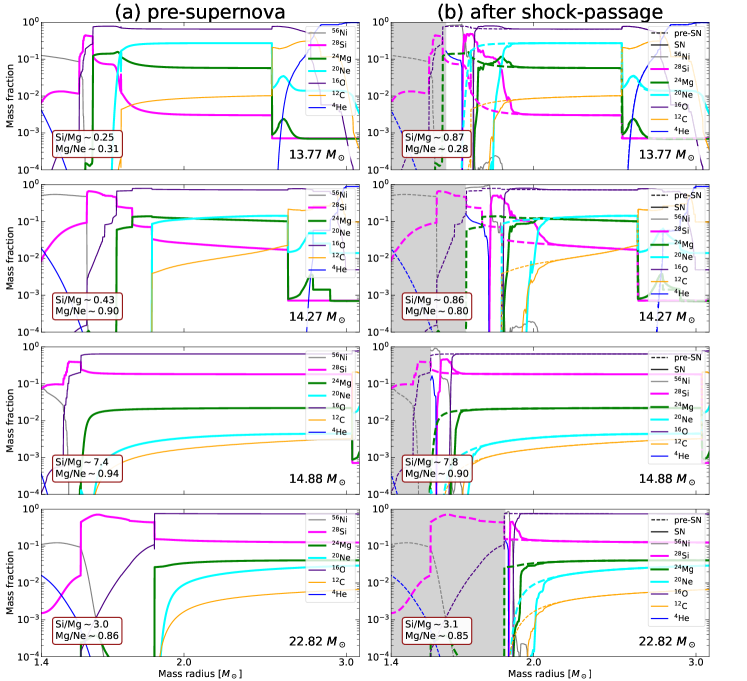
As displayed in the left panels of Figure 6, we confirmed that the shell merger triggers efficient Ne-burning processes and enhances the total yield of Mg and Si, on the basis of the stellar simulations by Sukhbold et al. (2018). In the case of the 13.77 progenitor, for instance, the O-Mg layer are formed as a result of Ne-burning processes, keeping up the boundary with the outer O-Ne layer. On the other hand, due to the shell merger, the boundary in the 14.27 progenitor seems to disappear (Ne-burning shell intrusion; cf. Sato et al., 2024) and also in the 14.88 and 22.82 progenitors O-Si layers are formed by mixing the O-Ne or O-Mg layers (O-burning shell merger; cf. Sato et al., 2024). We found that these merger processes tend to enhance and reduce the total amount of Mg and Ne, respectively. Our simulation reveals that all the models whose Mg/Ne ratio is higher than can be explained by such destratification. It can be used as a threshold to determine whether a SNR is Mg-rich or not.
In order to check how the subsequent nucleosynthesis affects the final yields of Ne, Mg, and Si, we run 1D SN simulations using The SuperNova Explosion Code (SNEC, Morozova et al., 2015) with a Lagrangian hydrodynamic code, in which we incorporate neutrino heating and cooling via a light-bulb scheme (Suwa et al., 2019). The right panels of Figure 6 displays the resultant mass fraction profiles for various after shock passage. We found no significant change in Mg/Ne although a slight decrease is seen: the aforementioned threshold is still able to discriminate between Mg-rich and normal SNRs. While the explosive nucleosynthesis gives an overall trend of increase in Si/Mg, only a slight increase is seen in the cases of the O-burning shell merger, i.e., and 22.82. This may be because before core collapse the O-burning shell merger produces a large amount of Si in the O-rich layer, where the explosive nucleosynthesis is less effective. It is remarkable that all massive star models () experience the O-burning shell merger and hence the resultant Si/Mg becomes significantly higher than the solar value (0.86; Wilms et al., 2000). We therefore believe that if a Mg-rich SNR exhibits high Si/Mg as well it may possibly be a remnant of a massive star. In this sense, since Si/Mg in G359.00.9 () is close to the solar value and relatively consistent with the 14.27 case, the progenitor is likely smaller than 15 and was experienced the Ne-burning shell intrusion before the explosion.
4.3 Estimation of the ejecta mass of G359.00.9
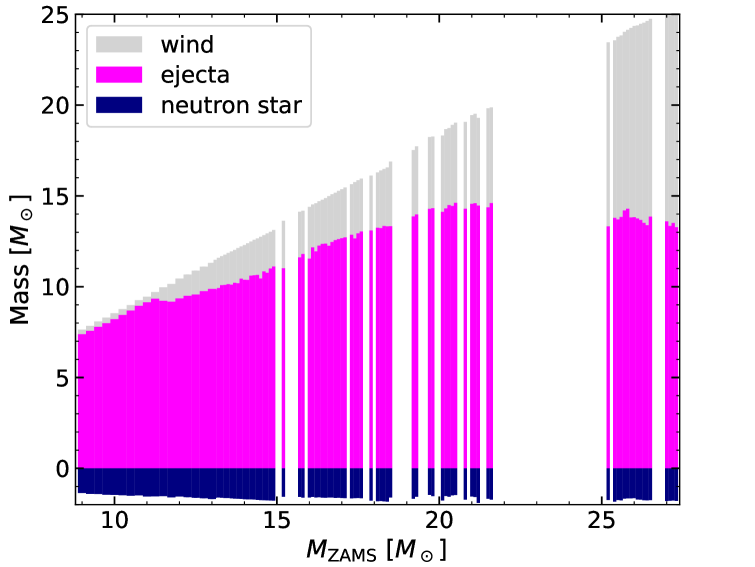
As noted in the previous section, our nucleosynthesis calculations prefer a progenitor mass () less than 15 as the origin of G359.00.9, which should be consistent with the ejecta mass estimate based on the observation. Figure 7 shows the relationship between and the ejecta mass on the basis of calculations given by Sukhbold et al. (2016). The result suggests that the ejecta mass of G359.00.9 is expected to be less than in total. In order to measure the ejecta mass from the emitting volume of this remnant, we require an accurate distance measurement. Nevertheless, whether G359.00.9 is a nearby SNR or not is still a question in the previous studies; with UKIDSS and with VVV (luminosity attenuation of red clumps Wang et al., 2020), (the - relation; Pavlović et al., 2012), and (X-ray absorption; Bamba et al., 2000).
We estimate the distance to G359.00.9 on the basis of the newly discovered cloud (Section 3.2) using a similar method applied for G359.10.5 by Suzuki et al. (2020). This is one of the most reliable methods to obtain the distance to a SNR (cf. Fukui et al., 2012). The associated cloud has a small velocity width km s-1, and its velocity is very close to 0 km s-1. These properties strongly suggest its location in a foreground spiral arm rather than in the Galactic Center (see Enokiya et al., 2014, 2023, for details). According to a spiral arm model of our Galaxy (e.g., Reid et al., 2016) , the velocity of the associated cloud well coincides with that of the Scutum-Centaurus arm. We thus conclude that the associated cloud is likely located in the Scutum-Centaurus arm. Based on Figure 5 in Enokiya et al. (2023), we estimated the distance of the Scutum-Centaurus arm in the direction of G359.00.9 to be 2.8 kpc. Since the width of the Scutum-Centaurus arm is obtained to be kpc (Reid et al., 2016, see Figure 5), the distance to G359.00.9 is estimated to be between 2.66 kpc and 2.94 kpc. The real radius of the remnant in this case is pc.
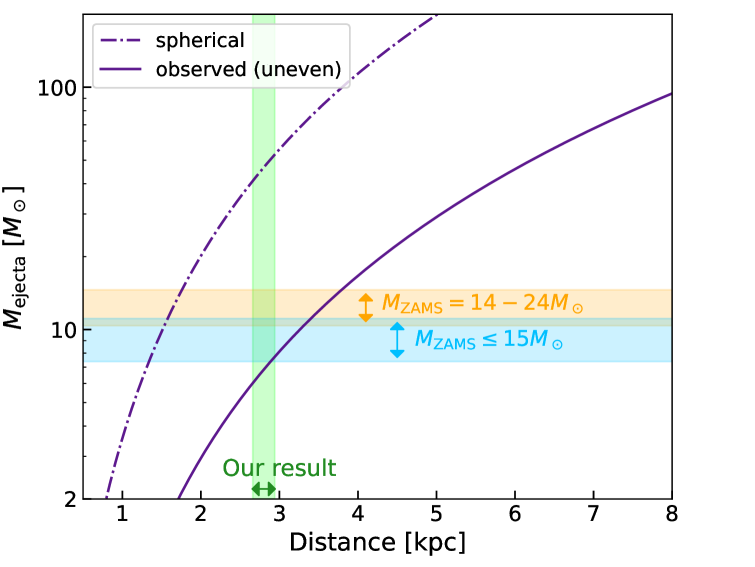
Since G359.00.9 exhibits a highly asymmetric morphology, we consider two cases with different 3D structures for calculating the entire volume: the ejecta has an intrinsically uneven distribution due to an aspherical explosion or a completely spherical with pc but emitting region is somehow limited in the east. In the former case, we assume a spherical cap whose opening solid angle is , which is consistent with a previous estimate (Bamba et al., 2000). The ejecta mass is then calculated as follows:
| (1) |
where the volume filling factor was deduced from a fluctuation in X-ray surface brightness. The result of our calculation is displayed in Figure 8, where the latter spherical case overlaid as well. We found that only assuming the latter uneven case lies within an acceptable range given by Sukhbold et al. (2016) and that on the contrary the former spherical case requires much larger than theoretically expected. Given that the ejecta of G359.00.9 is unevenly distributed to the east, the progenitor mass seems to be less than 15, following our expectation from the abundance pattern.
5 Conclusions
We performed detailed observations of a Galactic SNR G359.00.9 in X-ray and radio bands, which reveal a distorted X-ray morphology with a shell-like structure. The result implies that this remnant belongs to the class of mixed-morphology SNRs. Our spectral analysis with XMM-Newton allows us to measure accurate ejecta mass ratios of Mg/Ne (; solar value is ) and Si/Mg () for the first time. The result indicates that this remnant is categorized as the Mg-rich SNRs (Park et al., 2003), whose origin is still under debate. Our conclusions are presented below:
-
1.
On the basis of our ongoing study (Sato et al., 2024), we speculate that such Mg-rich abundance pattern is derived from violent destratification, so-called shell merger processes that are expected to occur before core collapse (e.g., Yadav et al., 2020). By comparing stellar evolution models given by Sukhbold et al. (2018) and our SN simulations with the abundance ratios of previously observed SNRs, we found that if we take as the threshold several SNRs including G359.00.9 are labeled as the Mg-rich SNRs.
-
2.
Our calculations also reveal that there are two “Mg-rich” groups with different Si/Mg. This is because there are two types of the destratification, the Ne-burning shell intrusion and the O-burning shell merger, and the latter process enhances the total yield of Si. Since all massive star models () experience the O-burning shell merger, a Mg-rich SNR with high Si/Mg may possibly be evidence for a remnant of a massive star. In this sense, the abundance pattern of G359.00.9 prefers the Ne-burning shell intrusion and thus we conclude that the progenitor mass is likely smaller than 15.
-
3.
We also discovered a molecular cloud interacting with G359.00.9 with the Nobeyama 45 m telescope. Consequently, the distance ambiguity that has been argued was solved in favor of the foreground remnant. We conclude that G359.00.9 is located in the Scutum-Centaurus arm, whose distance is kpc (2.66–2.94 kpc). Applying this result, we measured the total ejecta mass of , which is consistent with the above estimation of . Our result also indicates that the ejecta distribution is not spherical but highly distorted, which implies an asymmetric SN explosion.
References
- Andrassy et al. (2020) Andrassy, R., Herwig, F., Woodward, P., & Ritter, C. 2020, Monthly Notices of the Royal Astronomical Society, 491, 972, doi: 10.1093/mnras/stz2952
- Arnaud (1996) Arnaud, K. A. 1996, 101, 17
- Bamba et al. (2009) Bamba, A., Yamazaki, R., Kohri, K., et al. 2009, The Astrophysical Journal, 691, 1854, doi: 10.1088/0004-637X/691/2/1854
- Bamba et al. (2000) Bamba, A., Yokogawa, J., Sakano, M., & Koyama, K. 2000, Publications of the Astronomical Society of Japan, 52, 259, doi: 10.1093/pasj/52.2.259
- Carter & Read (2007) Carter, J. A., & Read, A. M. 2007, A&A, 464, 1155, doi: 10.1051/0004-6361:20065882
- Collins et al. (2018) Collins, C., Müller, B., & Heger, A. 2018, Monthly Notices of the Royal Astronomical Society, 473, 1695, doi: 10.1093/mnras/stx2470
- Davies & Beasor (2020) Davies, B., & Beasor, E. R. 2020, Monthly Notices of the Royal Astronomical Society, 493, 468, doi: 10.1093/mnras/staa174
- Enokiya et al. (2023) Enokiya, R., Sano, H., Filipović, M. D., et al. 2023, PASJ, 75, 970, doi: 10.1093/pasj/psad054
- Enokiya et al. (2014) Enokiya, R., Torii, K., Schultheis, M., et al. 2014, ApJ, 780, 72, doi: 10.1088/0004-637X/780/1/72
- Ertl et al. (2016) Ertl, T., Janka, H.-T., Woosley, S. E., Sukhbold, T., & Ugliano, M. 2016, ApJ, 818, 124, doi: 10.3847/0004-637X/818/2/124
- Ertl et al. (2020) Ertl, T., Woosley, S. E., Sukhbold, T., & Janka, H.-T. 2020, ApJ, 890, 51, doi: 10.3847/1538-4357/ab6458
- Fukui et al. (2012) Fukui, Y., Sano, H., Sato, J., et al. 2012, ApJ, 746, 82, doi: 10.1088/0004-637X/746/1/82
- Heywood et al. (2022) Heywood, I., Rammala, I., Camilo, F., et al. 2022, ApJ, 925, 165, doi: 10.3847/1538-4357/ac449a
- Hughes et al. (1998) Hughes, J. P., Hayashi, I., & Koyama, K. 1998, ApJ, 505, 732, doi: 10.1086/306202
- Imasheva et al. (2023) Imasheva, L., Janka, H.-T., & Weiss, A. 2023, Monthly Notices of the Royal Astronomical Society, 518, 1818, doi: 10.1093/mnras/stac3239
- Kamazaki et al. (2012) Kamazaki, T., Okumura, S. K., Chikada, Y., et al. 2012, PASJ, 64, 29, doi: 10.1093/pasj/64.2.29
- Kamitsukasa et al. (2015) Kamitsukasa, F., Koyama, K., Uchida, H., et al. 2015, Publications of the Astronomical Society of Japan, 67, 16, doi: 10.1093/pasj/psu149
- Katsuda et al. (2018) Katsuda, S., Takiwaki, T., Tominaga, N., Moriya, T. J., & Nakamura, K. 2018, ApJ, 863, 127, doi: 10.3847/1538-4357/aad2d8
- Katsuda et al. (2015) Katsuda, S., Acero, F., Tominaga, N., et al. 2015, ApJ, 814, 29, doi: 10.1088/0004-637X/814/1/29
- Kutner & Ulich (1981) Kutner, M. L., & Ulich, B. L. 1981, ApJ, 250, 341, doi: 10.1086/159380
- Minamidani et al. (2016) Minamidani, T., Nishimura, A., Miyamoto, Y., et al. 2016, in Society of Photo-Optical Instrumentation Engineers (SPIE) Conference Series, Vol. 9914, Millimeter, Submillimeter, and Far-Infrared Detectors and Instrumentation for Astronomy VIII, ed. W. S. Holland & J. Zmuidzinas, 99141Z, doi: 10.1117/12.2232137
- Mocák et al. (2018) Mocák, M., Meakin, C., Campbell, S. W., & Arnett, W. D. 2018, Monthly Notices of the Royal Astronomical Society, 481, 2918, doi: 10.1093/mnras/sty2392
- Morozova et al. (2015) Morozova, V., Piro, A. L., Renzo, M., et al. 2015, ApJ, 814, 63, doi: 10.1088/0004-637X/814/1/63
- O’Connor & Ott (2011) O’Connor, E., & Ott, C. D. 2011, ApJ, 730, 70, doi: 10.1088/0004-637X/730/2/70
- Park & Bhalerao (2017) Park, S., & Bhalerao, J. 2017, ApJ, 834, 189, doi: 10.3847/1538-4357/834/2/189
- Park et al. (2003) Park, S., Hughes, J. P., Slane, P. O., et al. 2003, The Astrophysical Journal, 592, L41, doi: 10.1086/377507
- Pavlović et al. (2012) Pavlović, M. Z., Urošević, D., Vukotić, B., Arbutina, B., & Göker, Ü. D. 2012, ApJS, 204, 4, doi: 10.1088/0067-0049/204/1/4
- Reid et al. (2016) Reid, M. J., Dame, T. M., Menten, K. M., & Brunthaler, A. 2016, ApJ, 823, 77, doi: 10.3847/0004-637X/823/2/77
- Reid et al. (2016) Reid, M. J., Dame, T. M., Menten, K. M., & Brunthaler, A. 2016, ApJ, 823, 77, doi: 10.3847/0004-637X/823/2/77
- Rho & Petre (1998) Rho, J., & Petre, R. 1998, ApJ, 503, L167, doi: 10.1086/311538
- Ritter et al. (2018) Ritter, C., Andrassy, R., Côté, B., et al. 2018, Monthly Notices of the Royal Astronomical Society: Letters, 474, L1, doi: 10.1093/mnrasl/slx126
- Sasaki et al. (2001) Sasaki, M., Stadlbauer, T. F. X., Haberl, F., Filipović, M. D., & Bennie, P. J. 2001, A&A, 365, L237, doi: 10.1051/0004-6361:20000015
- Sato et al. (2024) Sato, T., Matsunaga, K., Sawada, R., et al. 2024, Destratification in the Progenitor Interior of the Mg-rich Supernova Remnant N49B, arXiv, doi: 10.48550/arXiv.2403.04156
- Sawada & Maeda (2019) Sawada, R., & Maeda, K. 2019, ApJ, 886, 47, doi: 10.3847/1538-4357/ab4da3
- Sawada & Suwa (2023) Sawada, R., & Suwa, Y. 2023, Updating the ${̂56}$Ni Problem in Core-collapse Supernova Explosion, doi: 10.48550/arXiv.2301.03610
- Seta et al. (2004) Seta, M., Hasegawa, T., Sakamoto, S., et al. 2004, AJ, 127, 1098, doi: 10.1086/381058
- Sofue & Handa (1984) Sofue, Y., & Handa, T. 1984, Nature, 310, 568, doi: 10.1038/310568a0
- Strüder et al. (2001) Strüder, L., Briel, U., Dennerl, K., et al. 2001, A&A, 365, L18, doi: 10.1051/0004-6361:20000066
- Stupar & Parker (2011) Stupar, M., & Parker, Q. A. 2011, Monthly Notices of the Royal Astronomical Society, 414, 2282, doi: 10.1111/j.1365-2966.2011.18547.x
- Sukhbold et al. (2016) Sukhbold, T., Ertl, T., Woosley, S. E., Brown, J. M., & Janka, H. T. 2016, The Astrophysical Journal, 821, 38, doi: 10.3847/0004-637X/821/1/38
- Sukhbold et al. (2018) Sukhbold, T., Woosley, S. E., & Heger, A. 2018, The Astrophysical Journal, 860, 93, doi: 10.3847/1538-4357/aac2da
- Suwa et al. (2019) Suwa, Y., Tominaga, N., & Maeda, K. 2019, Monthly Notices of the Royal Astronomical Society, 483, 3607, doi: 10.1093/mnras/sty3309
- Suzuki et al. (2020) Suzuki, H., Bamba, A., Enokiya, R., et al. 2020, ApJ, 893, 147, doi: 10.3847/1538-4357/ab80ba
- Turner et al. (2001) Turner, M. J. L., Abbey, A., Arnaud, M., et al. 2001, A&A, 365, L27, doi: 10.1051/0004-6361:20000087
- Uchida et al. (2015) Uchida, H., Koyama, K., & Yamaguchi, H. 2015, The Astrophysical Journal, 808, 77, doi: 10.1088/0004-637X/808/1/77
- Uchida et al. (2012) Uchida, H., Koyama, K., Yamaguchi, H., et al. 2012, Publications of the Astronomical Society of Japan, 64, 141, doi: 10.1093/pasj/64.6.141
- Wang et al. (2020) Wang, S., Zhang, C., Jiang, B., et al. 2020, A&A, 639, A72, doi: 10.1051/0004-6361/201936868
- Williams et al. (2015) Williams, B. J., Rangelov, B., Kargaltsev, O., & Pavlov, G. G. 2015, ApJL, 808, L19, doi: 10.1088/2041-8205/808/1/L19
- Wilms et al. (2000) Wilms, J., Allen, A., & McCray, R. 2000, The Astrophysical Journal, 542, 914, doi: 10.1086/317016
- Yadav et al. (2020) Yadav, N., Müller, B., Janka, H. T., Melson, T., & Heger, A. 2020, ApJ, 890, 94, doi: 10.3847/1538-4357/ab66bb
- Yatsu et al. (2013) Yatsu, Y., Asano, K., Kawai, N., Yano, Y., & Nakamori, T. 2013, ApJ, 773, 25, doi: 10.1088/0004-637X/773/1/25
- Yatsu et al. (2005) Yatsu, Y., Kawai, N., Kataoka, J., et al. 2005, ApJ, 631, 312, doi: 10.1086/432590