Coulomb drag in graphene/hBN/graphene moiré heterostructures
Abstract
We report on the observation of Coulomb drag between graphene-hexagonal boron nitride (hBN) moiré heterostructure with a moiré wavelength of 10 nm and an intrinsic graphene with a lattice constant of 0.25 nm. By tuning carrier densities of each graphene layer independently, we find that the charge carriers in moiré mini-bands, i.e., near the satellite Dirac point (sDP), can be coupled with the massless Fermions near the original Dirac point (oDP), strongly enough to generate a finite drag resistance. At high temperature () and large density (), the drag resistances near both oDP and sDP follow a typical and power law dependence as expected for the momentum transfer process and it also satisfies the layer reciprocity. In contrast, at low , the layer reciprocity is broken in both regions that suggest dominant energy drag. Furthermore, quantitatively, the drag resistances near sDPs are smaller than those near oDP and they deviate from dependence below 100 K. These results suggest that the coupling between the carriers in moiré mini-bands and those in original Dirac bands may not be of a simple Fermi liquid nature.
Lattice mismatch and rotational alignment between graphene and hexagonal boron-nitride (hBN) can generate highly tunable moiré patterns with a wavelength reaching up to nm which is much larger than the lattice constant of graphene, nm [1, 2, 3, 4]. Due to such a large periodicity, the moiré patterns induce superlattice potentials in graphene and create moiré mini-bands that exhibit distinct electronic properties different from the pristine graphene. Examples include, but not limited to, the emergence of satellite Dirac point (sDP) [1, 2, 3, 4], Hofstadter butterfly effect [2, 3, 4], topological valley current [5], resonant tunnelling [6], quantum anomalous Hall effect [7] and ferromagnetism [8]. These studies demonstrate that the graphene-hBN moiré heterostructures provide an excellent platform to study the effect of the moiré mini-bands and their interactions in low-dimensional systems.
Coulomb drag experiment, on the other hand, is a direct measure of electron-electron interactions between two different systems that otherwise cannot be coupled with [9, 10, 11]. During the experiment, a drive current () is applied to one of the layers (an active layer) while a voltage () is measured in another (a drag or passive layer) that is spatially separated by a thin insulating spacer (see, e.g., Fig. 1(a)). Since the two layers are electrically isolated, one can observe a finite drag resistivity, (: a device width and length ratio), only when the charge carriers in the two layers are strongly coupled by Coulomb interactions [9, 10, 11]. The relevant studies have indeed shown that Coulomb drag measurements can reveal the nature of interactions between different systems, such as graphene and GaAs 2D electron gas (2DEG) [12], graphene and 2D superconductors [13], 1D and 2D systems [14, 15], and more.
In this Letter, we have measured Coulomb drag in graphene-hBN-graphene heterostructures where the top (or bottom) graphene is aligned with a thin hBN spacer ( nm) to form moiré patterns (see Figs. 1(a,b)). By tuning charge densities of the top and bottom layers, and , independently, we explored the drag effect in two different regions, the region \@slowromancapi@ where both layers are near the original Dirac point (oDP) and the regions \@slowromancapii@ and \@slowromancapiii@ where the layer aligned with hBN was doped to reach the sDP in the hole and electron side respectively (see Figs. 1(c,d)). Interestingly, we find that is finite in all regions even when nm is an order of magnitude larger than the . This indicates that the carriers in the moiré mini-bands filling a large moiré lattice are coupled with massless Fermions in original graphene bands well enough to induce the drag effect. Moreover, we have found that at high temperature () and large density, follows a typical frictional drag behavior, and , and satisfies the layer reciprocity relation, while below 100 K, the layer reciprocity is broken and in region \@slowromancapii@ no longer follows the dependence. This suggests that at low , the coupling between the carriers in moiré mini-bands and the original massless Fermions may not be fully described by a simple Fermi liquid momentum transfer mechanism [9, 16, 17].
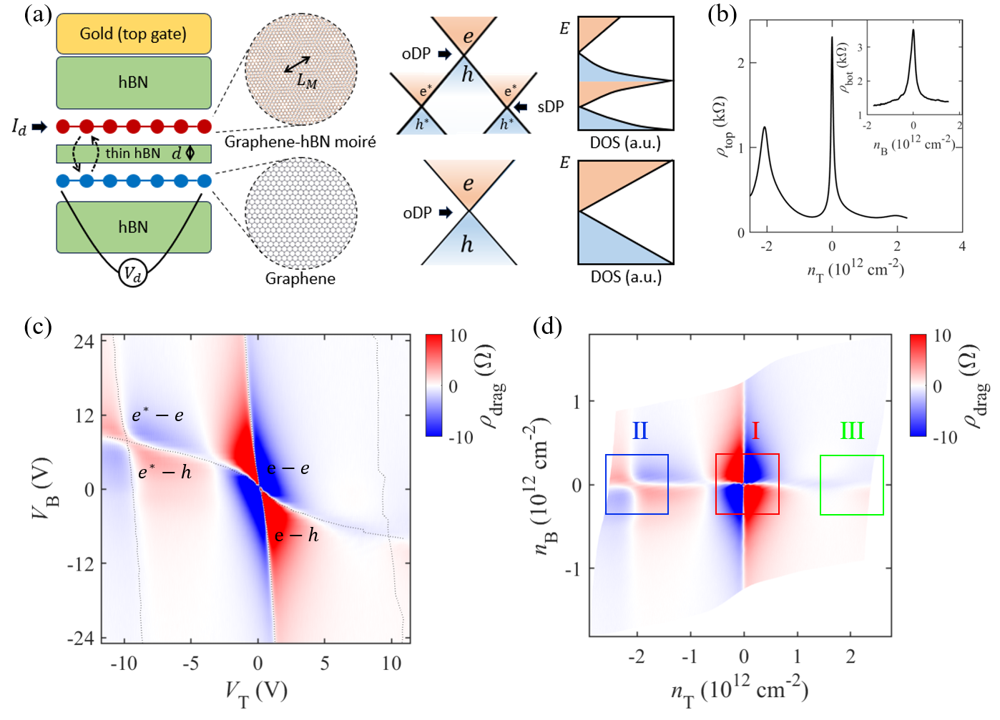
The graphene-hBN-graphene moiré heterostructures used in this study were stacked by picking up multiple graphene and hBN layers alternatively [18] during which we aligned at least one of the graphene layers with hBN to form moiré patterns. The left panel of Fig. 1(a) shows a typical device structure with the top layer aligned with hBN, consisting of a top gold electrode as a top gate () to tune the and a highly-doped silicon substrate (not shown) as a back gate () to vary the independently (a classical Hall effect was used to estimate from ; see Supplemental Materials). Standard e-beam lithography, lift-off, and etching techniques were used to make a Hall bar geometry whose details can be found elsewhere [19]. Fabricated devices were measured in cryogenic systems equipped with a superconducting magnet using a low-frequency lock-in technique in a current bias. To measure the , we drive through the top (bottom) graphene layer and measure a drag voltage at the bottom (top) layer as depicted in Fig. 1(a) for a top drive configuration. While measuring , we have also simultaneously measured the local voltage drop across the drive layer parallel to , (or ), to identify the position(s) of the DP(s) by synchronizing two lock-in amplifiers. As shown in Fig. 1(b), the local resistance measurement confirms the presence of the moiré potential in top graphene layer with nm at a twist angle of 0.94∘ and its absence in the bottom layer as intended.
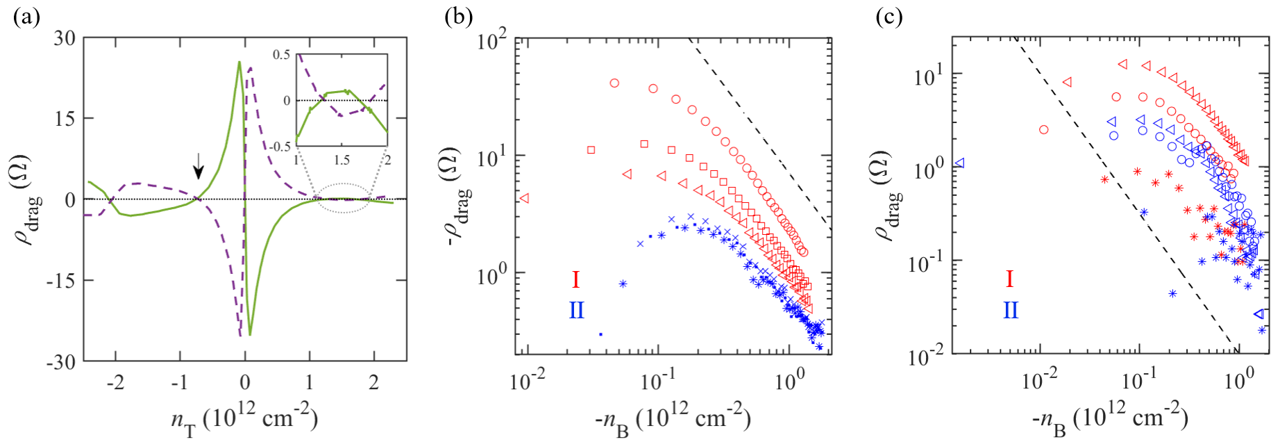
The drag resistance measured at 210 K, Figs. 1(c,d), reveals clear signatures of a finite Coulomb drag in all regions not only near the oDP (region \@slowromancapi@) but also near the sDPs (regions \@slowromancapii@ and \@slowromancapiii@). As shown in Fig. 1(c), in all regions, stays positive when the two layers have opposite carrier types and becomes negative when their carrier types are the same (see Fig. 2(a) for a clearer sign change in the region \@slowromancapiii@). Interestingly, in addition to the DPs, changes its sign at finite densities between the region \@slowromancapi@ and \@slowromancapii@ (\@slowromancapiii@). This corresponds to the van Hove singularity points where the density of states (DOS) becomes maximum and the carrier type is switched due to the existence of the moiré mini-bands [20]. These additional sign changes are more clearly visible in Fig. 2(a) where the line cuts of Fig. 1(d) at cm-2, , are plotted. These sign changes are in a good agreement with the frictional momentum drag [21, 22], confirming that the observed signals are from the Coulomb drag not from the direct tunneling [23].
To compare the drag effect in the regions \@slowromancapi@ and \@slowromancapii@ more directly, we define as the carrier density of the top layer relative to the sDP and plot as a function of at the same values of and . The results for the hole sides in both layers are shown in Figs. 2(b,c) that exhibit a similar power law dependence of in density (broken lines) at large for both regions as expected for the frictional momentum drag [24]. Furthermore, as decreases, the saturates and even decreases as found in previous studies [21]. This can be attributed to small Fermi energy at low density compared with the measurement temperature (210 K). Similar behavior are also found in electron-electron and electron-hole sides (see Supplemental Materials).
Although behaves similarly in in both regions \@slowromancapi@ and \@slowromancapii@, we find that its absolute values and their dependence in are different. First, as shown in Figs. 1(c,d) and 2(a,b), the is smaller in the region \@slowromancapii@ than in the region \@slowromancapi@. Secondly, Fig. 2(b) shows that the in the region \@slowromancapii@ depends very weakly on compared with its dependence on in the region \@slowromancapi@. This small and its weak dependence on in the region \@slowromancapii@, as well as the very weak drag signal in the region \@slowromancapiii@ (see, e.g., Fig. 2(a)), can be qualitatively understood by considering the two intrinsic properties of the graphene-hBN moiré potential: 1) an electron-hole asymmetry originating from the asymmetric on-site potential of hBN layer and the next-nearest neighbor hoping [1, 25, 26], and 2) the large difference in the reciprocal lattices of the moiré mini-bands and of the original Dirac bands due to an order of magnitude difference in the corresponding lattice constants ( nm and nm). The electron-hole asymmetry provides a large finite background DOS from the original Dirac band on the electron side that suppresses the drag effect in the region \@slowromancapiii@ whereas due to the large reciprocal lattice mismatch, compared to the carriers in the region \@slowromancapi@, a larger momentum transfer is needed to couple those in the region \@slowromancapii@, corresponding to the weaker Coulomb interaction as the interlayer Coulomb potential exponentially decays in , with an interlayer spacing [24, 27]. These findings illustrate that the Coulomb drag experiment can be used to explore the nature of the interlayer Coulomb interactions in moiré systems.
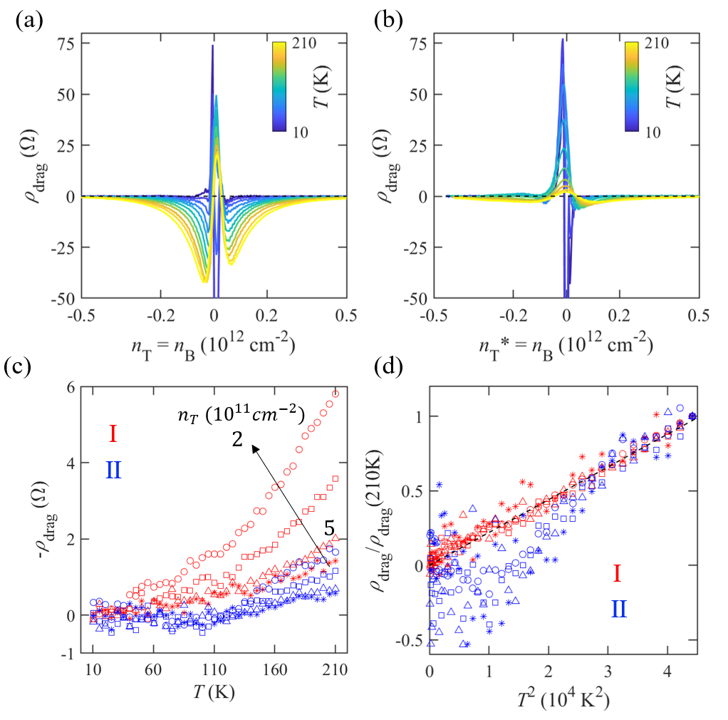
Temperature dependence measurements further distinguish the drag behavior in the regions \@slowromancapi@ and \@slowromancapii@. As shown in Fig. 2(c), exhibits stronger temperature dependence in the region \@slowromancapi@ than in the region \@slowromancapii@. This is more clearly visible in Figs. 3(a,b) which compare from the region \@slowromancapi@ and from the region \@slowromancapii@ measured at different temperatures from 210 K to 10 K. At finite and away from oDP and sDP, the in the region \@slowromancapi@ shows much stronger temperature dependence than those in the region \@slowromancapii@. To compare them in detail, we also plot and normalized (210 K) as a function of (expected for the Fermi liquid [10, 24, 27]) at few different values of and in Figs. 3(c) and (d), respectively. The figures clearly show much weaker temperature dependence of the in the region \@slowromancapii@ than in the region \@slowromancapi@ (Fig. 3(c)) and clear dependence in the region \@slowromancapi@ for all temperature range investigated that contrasts with the non- dependence of the in the region \@slowromancapii@ below 100 K (Fig. 3(d)). Such a deviation from the dependence at low temperatures suggests that the coupling between sDP and oDP may not be of a simple Fermi liquid nature at low temperatures.
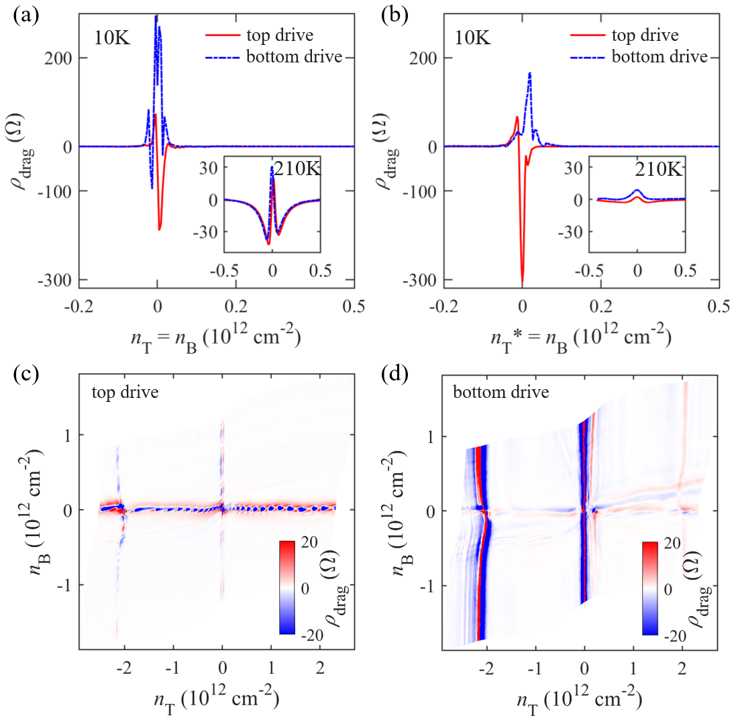
At low temperatures and near zero density below cm-2, Coulomb drag in both regions \@slowromancapi@ and \@slowromancapii@ exhibit unconventional behavior. As shown in Figs. 3(a,b), the near zero density starts exhibiting a rapid sign change in a small density range as temperature goes below K. This is more clearly visible in Figs. 4(a,b) where and measured at 10 K are plotted in a full scale. Such a sign change is absent at higher temperatures as shown in the insets of Figs. 4(a,b) and it strongly depends on the drive layer. This indicates that the sharp change of near zero density is related to the breakdown of the layer reciprocity at low temperatures. To test this, we measured in and at 5 K where we expect the phenomenon becomes the strongest. In fact, as shown in Figs. 4(c,d), the drag effect nearly only depends on the drag layer. In a top drive configuration, for instance, the exhibits strong change in not in (Fig. 4(c)) while when the bottom layer is driven, the behavior is opposite (Fig. 4(d)). As found in the previous study [28], this can be from the energy drag that becomes stronger at lower temperatures. Moreover, near DPs, there can be electron-hole puddles in both layers that can be correlated with each other by Coulomb interactions which can give rise to sign change in a small density range [21, 29] as found in our experiment (Fig. 4). In fact, it is interesting to see that in Figs. 4(c,d), there are nearly no signatures of the sign change at the van Hove singularity points as it can be understood in terms of the electron-hole puddle induced drag effect [21, 29] because near van Hove singularity, the effects of such electron-hole puddles are suppressed due to the large DOS.
In summary, by building graphene-thin hBN-graphene moiré heterostructures, we have successfully demonstrated that the carriers in moiré mini-bands can be Coulomb-coupled with those in an original Dirac band strongly enough to show the finite drag resistance, despite a fact that their reciprocal lattices are largely different. At high temperatures and large density, we find that the in all regions follows a typical frictional momentum drag behavior: a typical sign change with respect to the carrier types, a power law dependence in density and temperature, and the layer reciprocity. In contrast, at low temperatures, the near zero density exhibits a strong dependence in density and depends nearly only on the change in the drag layer. It indicates the strong effect of electron-hole puddles near zero density and the crossover from the momentum to energy drag as lowering temperature that calls for further studies. Nonetheless, our study proves that Coulomb drag experiment can be used to couple the moiré mini-bands with other electronic bands. Having seen a rapidly increasing number of different types of moiré systems [30, 31, 32, 33, 34], we believe our study opens an interesting venue to investigate new interactions effects in diverse moiré systems.
Acknowledgements.
The work is financially supported by the National Key R&D Program of China (2020YFA0309600) and by the University Grants Committee/Research Grant Council of Hong Kong SAR under schemes of Area of Excellence (AoE/P-701/20), CRF (C7037-22G), ECS (27300819), and GRF (17300020, 17300521, and 17309722). K.W. and T.T. acknowledge support from the JSPS KAKENHI (Grant Numbers 21H05233 and 23H02052) and World Premier International Research Center Initiative (WPI), MEXT, Japan.References
- Yankowitz et al. [2012] M. Yankowitz, J. Xue, D. Cormode, J. D. Sanchez-Yamagishi, K. Watanabe, T. Taniguchi, P. Jarillo-Herrero, P. Jacquod, and B. J. LeRoy, Emergence of superlattice dirac points in graphene on hexagonal boron nitride, Nature physics 8, 382 (2012).
- Ponomarenko et al. [2013] L. Ponomarenko, R. Gorbachev, G. Yu, D. Elias, R. Jalil, A. Patel, A. Mishchenko, A. Mayorov, C. Woods, J. Wallbank, et al., Cloning of dirac fermions in graphene superlattices, Nature 497, 594 (2013).
- Dean et al. [2013] C. R. Dean, L. Wang, P. Maher, C. Forsythe, F. Ghahari, Y. Gao, J. Katoch, M. Ishigami, P. Moon, M. Koshino, et al., Hofstadter’s butterfly and the fractal quantum hall effect in moiré superlattices, Nature 497, 598 (2013).
- Hunt et al. [2013] B. Hunt, J. D. Sanchez-Yamagishi, A. F. Young, M. Yankowitz, B. J. LeRoy, K. Watanabe, T. Taniguchi, P. Moon, M. Koshino, P. Jarillo-Herrero, et al., Massive dirac fermions and hofstadter butterfly in a van der waals heterostructure, Science 340, 1427 (2013).
- Endo et al. [2019] K. Endo, K. Komatsu, T. Iwasaki, E. Watanabe, D. Tsuya, K. Watanabe, T. Taniguchi, Y. Noguchi, Y. Wakayama, Y. Morita, et al., Topological valley currents in bilayer graphene/hexagonal boron nitride superlattices, Applied Physics Letters 114 (2019).
- Mishchenko et al. [2014] A. Mishchenko, J. Tu, Y. Cao, R. V. Gorbachev, J. Wallbank, M. Greenaway, V. Morozov, S. Morozov, M. Zhu, S. Wong, et al., Twist-controlled resonant tunnelling in graphene/boron nitride/graphene heterostructures, Nature nanotechnology 9, 808 (2014).
- Serlin et al. [2020] M. Serlin, C. Tschirhart, H. Polshyn, Y. Zhang, J. Zhu, K. Watanabe, T. Taniguchi, L. Balents, and A. Young, Intrinsic quantized anomalous hall effect in a moiré heterostructure, Science 367, 900 (2020).
- Chen et al. [2020] G. Chen, A. L. Sharpe, E. J. Fox, Y.-H. Zhang, S. Wang, L. Jiang, B. Lyu, H. Li, K. Watanabe, T. Taniguchi, et al., Tunable correlated chern insulator and ferromagnetism in a moiré superlattice, Nature 579, 56 (2020).
- Gramila et al. [1991] T. J. Gramila, J. P. Eisenstein, A. H. MacDonald, L. N. Pfeiffer, and K. W. West, Mutual friction between parallel two-dimensional electron systems, Phys. Rev. Lett. 66, 1216 (1991).
- Tse et al. [2007] W.-K. Tse, B. Y.-K. Hu, and S. D. Sarma, Theory of coulomb drag in graphene, Physical Review B 76, 081401 (2007).
- Narozhny and Levchenko [2016] B. N. Narozhny and A. Levchenko, Coulomb drag, Rev. Mod. Phys. 88, 025003 (2016).
- Gamucci et al. [2014] A. Gamucci, D. Spirito, M. Carrega, B. Karmakar, A. Lombardo, M. Bruna, L. Pfeiffer, K. West, A. C. Ferrari, M. Polini, et al., Anomalous low-temperature coulomb drag in graphene-gaas heterostructures, Nature communications 5, 5824 (2014).
- Tao et al. [2023] R. Tao, L. Li, H.-Y. Xie, X. Fan, L. Guo, L. Zhu, Y. Yan, Z. Zhang, and C. Zeng, Josephson–coulomb drag effect between graphene and a laalo3/srtio3 superconductor, Nature Physics 19, 372 (2023).
- Mitra et al. [2020] R. Mitra, M. R. Sahu, K. Watanabe, T. Taniguchi, H. Shtrikman, A. Sood, and A. Das, Anomalous coulomb drag between inas nanowire and graphene heterostructures, Physical Review Letters 124, 116803 (2020).
- Anderson et al. [2021] L. Anderson, A. Cheng, T. Taniguchi, K. Watanabe, and P. Kim, Coulomb drag between a carbon nanotube and monolayer graphene, Physical Review Letters 127, 257701 (2021).
- Sivan et al. [1992] U. Sivan, P. Solomon, and H. Shtrikman, Coupled electron-hole transport, Physical review letters 68, 1196 (1992).
- Song et al. [2013] J. C. Song, D. A. Abanin, and L. S. Levitov, Coulomb drag mechanisms in graphene, Nano letters 13, 3631 (2013).
- Wang et al. [2013] L. Wang, I. Meric, P. Huang, Q. Gao, Y. Gao, H. Tran, T. Taniguchi, K. Watanabe, L. Campos, D. Muller, et al., One-dimensional electrical contact to a two-dimensional material, Science 342, 614 (2013).
- Rao et al. [2023] Q. Rao, W.-H. Kang, H. Xue, Z. Ye, X. Feng, K. Watanabe, T. Taniguchi, N. Wang, M.-H. Liu, and D.-K. Ki, Ballistic transport spectroscopy of spin-orbit-coupled bands in monolayer graphene on wse2, Nature communications 14, 6124 (2023).
- Wu et al. [2016] S. Wu, L. Wang, Y. Lai, W.-Y. Shan, G. Aivazian, X. Zhang, T. Taniguchi, K. Watanabe, D. Xiao, C. Dean, et al., Multiple hot-carrier collection in photo-excited graphene moiré superlattices, Science advances 2, e1600002 (2016).
- Gorbachev et al. [2012] R. Gorbachev, A. Geim, M. Katsnelson, K. Novoselov, T. Tudorovskiy, I. Grigorieva, A. MacDonald, S. Morozov, K. Watanabe, T. Taniguchi, et al., Strong coulomb drag and broken symmetry in double-layer graphene, Nature Physics 8, 896 (2012).
- Kim et al. [2011] S. Kim, I. Jo, J. Nah, Z. Yao, S. K. Banerjee, and E. Tutuc, Coulomb drag of massless fermions in graphene, Phys. Rev. B 83, 161401 (2011).
- Spielman et al. [2000] I. Spielman, J. Eisenstein, L. Pfeiffer, and K. West, Resonantly enhanced tunneling in a double layer quantum hall ferromagnet, Physical review letters 84, 5808 (2000).
- Narozhny et al. [2012] B. Narozhny, M. Titov, I. Gornyi, and P. Ostrovsky, Coulomb drag in graphene: perturbation theory, Physical Review B 85, 195421 (2012).
- Wang et al. [2015] L. Wang, Y. Gao, B. Wen, Z. Han, T. Taniguchi, K. Watanabe, M. Koshino, J. Hone, and C. R. Dean, Evidence for a fractional fractal quantum hall effect in graphene superlattices, Science 350, 1231 (2015).
- Li et al. [2018] J. Li, L. Lin, G.-Y. Huang, N. Kang, J. Zhang, H. Peng, Z. Liu, and H. Xu, Charge transport and electron-hole asymmetry in low-mobility graphene/hexagonal boron nitride heterostructures, Journal of Applied Physics 123 (2018).
- Carrega et al. [2012] M. Carrega, T. Tudorovskiy, A. Principi, M. Katsnelson, and M. Polini, Theory of coulomb drag for massless dirac fermions, New Journal of Physics 14, 063033 (2012).
- Lee et al. [2016] K. Lee, J. Xue, D. C. Dillen, K. Watanabe, T. Taniguchi, and E. Tutuc, Giant frictional drag in double bilayer graphene heterostructures, Physical review letters 117, 046803 (2016).
- Ho et al. [2018] D. Y. Ho, I. Yudhistira, B. Y.-K. Hu, and S. Adam, Theory of coulomb drag in spatially inhomogeneous 2d materials, Communications Physics 1, 41 (2018).
- He et al. [2021] F. He, Y. Zhou, Z. Ye, S.-H. Cho, J. Jeong, X. Meng, and Y. Wang, Moiré patterns in 2d materials: a review, ACS nano 15, 5944 (2021).
- Lau et al. [2022] C. N. Lau, M. W. Bockrath, K. F. Mak, and F. Zhang, Reproducibility in the fabrication and physics of moiré materials, Nature 602, 41 (2022).
- Mak and Shan [2022] K. F. Mak and J. Shan, Semiconductor moiré materials, Nature Nanotechnology 17, 686 (2022).
- Wang et al. [2023] L. Wang, S. Yin, J. Yang, and S. X. Dou, Moiré superlattice structure in two-dimensional catalysts: Synthesis, property and activity, Small 19, 2300165 (2023).
- Wu and Sun [2024] Y. Wu and M. Sun, 2d moiré superlattice materials: Synthesis, properties and applications, Applied Materials Today 37, 102101 (2024).