WISDOM Project – XXI. Giant molecular clouds in the central region of the barred spiral galaxy NGC 613: a steep size – linewidth relation
Abstract
NGC 613 is a nearby barred spiral galaxy with a nuclear ring. Exploiting high spatial resolution ( pc) Atacama Large Millimeter/sub-millimeter Array 12CO(1-0) observations, we study the giant molecular clouds (GMCs) in the nuclear ring and its vicinity, identifying spatially- and spectrally-resolved GMCs. The GMC sizes () are comparable to those of the clouds in the Milky Way (MW) disc, but their gas masses, observed linewidths () and gas mass surface densities are larger. The GMC size – linewidth relation () is steeper than that of the clouds of the MW disc and centre, and the GMCs are on average only marginally gravitationally bound (with a mean virial parameter ). We discuss the possible origins of the steep size – linewidth relation and enhanced observed linewidths of the clouds and suggest that a combination of mechanisms such as stellar feedback, gas accretion and cloud-cloud collisions, as well as the gas inflows driven by the large-scale bar, may play a role.
keywords:
galaxies: spiral and bar – galaxies: individual: NGC 613 – galaxies: nuclei – galaxies: ISM – radio lines: ISM – ISM: clouds1 Introduction
As giant molecular clouds (GMCs) are the gas reservoirs where most star formation takes place, understanding their life cycle and characteristics is essential to comprehend the formation and evolution of galaxies. Early studies of GMCs were limited to Milky Way (MW) and Local Group galaxies such as the Large Magellanic Cloud (LMC; e.g. Fukui et al. 2008), Small Magellanic Cloud (SMC; e.g. Muller et al. 2010), M 31 (e.g. Rosolowsky, 2007) and M 33 (e.g. Rosolowsky et al., 2003, 2007). These studies revealed that the GMCs of these galaxies have similar properties and size – linewidth relations, with typical sizes of – pc, typical masses of – M⊙ and typical velocity dispersions of – km s-1(e.g. Larson, 1981; Bolatto et al., 2008).
With improvements of the resolution and sensitivity of molecular line observations, GMCs are now studied in extragalactic objects, revealing deviations from the properties of Local Group GMCs (e.g. Bolatto et al., 2008; Rosolowsky et al., 2021). For example, the characteristics of the GMCs of some late-type galaxies (LTGs) vary with galactic environment and do not universally conform to the usual scaling relations of MW clouds (e.g. M 51, Hughes et al. 2013, Colombo et al. 2014; NGC 253, Leroy et al. 2015). The GMCs of early-type galaxies (ETGs) also have either no or different size – linewidth relations and are brighter, denser and have higher velocity dispersions than GMCs in the MW disc (MWd) and Local Group galaxies (Utomo et al., 2015; Liu et al., 2021). In addition, the molecular gas (and clouds) in the bar regions of local star-forming galaxies has higher velocity dispersions and surface densities than that in the discs (Sun et al., 2020, 2022). These results strongly suggest that galactic environment affects GMC properties. More studies of GMCs in galaxies with diverse morphologies and sub-structures are thus required to probe these variations and unravel the underlying physics.
Barred galaxies generally have gas inflows toward their central regions, due to their non-axisymmetric gravitational potentials (e.g. Athanassoula, 1992; Sormani et al., 2015; Sormani & Barnes, 2019; Henshaw et al., 2023; Sormani et al., 2023). Several CO surveys have shown higher concentrations of molecular gas in the central regions of barred galaxies than in unbarred galaxies (e.g. Sakamoto et al., 1999), as well as increased molecular gas linewidths and surface densities (Sun et al., 2020, 2022). Recent high-resolution CO observations of barred disc galaxies have also revealed the presence of distinct structures similar to those observed at optical wavelengths, such as nuclear rings, nuclear bars and nuclear spiral arms, with non-circular motions (e.g. Salak et al., 2016; Cuomo et al., 2019; Bewketu Belete et al., 2021; Sato et al., 2021). Studying barred disc galaxies therefore enables the exploration of GMC properties, including scaling relations, within different galactic environments. However, there have been only a few studies investigating GMCs in barred galaxies so far (e.g. Hirota et al., 2018; Maeda et al., 2020; Sato et al., 2021), including GMCs in the MW (e.g. Solomon et al., 1987; Oka et al., 1998; Heyer et al., 2009; Kauffmann et al., 2017). Rosolowsky et al. (2021) investigated GMCs in ten nearby galaxies, but only one out of their six barred galaxies was observed with a spatial resolution sufficient to spatially resolve individual GMCs ( pc spatial resolution) and thus analyse their scaling relations and physical properties such as size, mass and linewidth.
Choi et al. (2023) recently investigated the molecular gas of the barred spiral galaxy NGC 5806 at the GMC scale ( pc spatial resolution). Despite the GMCs having typical properties on average, they reported that the GMCs in the nuclear ring and its vicinity have a size () – linewidth () relation () that is much steeper than that of the GMCs in the MW or other galaxies. This result implies that the GMCs at the centres of barred galaxies can differ from those in the discs. However, as this behaviour has been observed in a single object and there is no adequate sample for comparison, one cannot conclude yet that it is the bar and associated gas inflow toward the nuclear ring that cause the steep size – linewidth relation.
To further test this conjecture, we examine the GMCs at the centre of the barred spiral galaxy NGC 613 (SBbc(rs)) in this paper. NGC 613 has a large-scale bar, an inner star-forming ring encircling the bar and weak spiral arms protruding from the bar, at a distance Mpc (Tully, 1988). In the central regions (i.e. well within a diameter of kpc), NGC 613 has a bright core and a well-studied star-forming nuclear ring (Hummel & Jorsater, 1992; Böker et al., 2007, 2008; Falcón-Barroso et al., 2008; Falcón-Barroso et al., 2014; Miyamoto et al., 2017, 2018), that are prominent in both optical continuum and molecular gas emission. NGC 613 also harbours a nuclear spiral (Audibert et al., 2019), a low-luminosity active galactic nucleus (LL-AGN; Veron-Cetty & Veron 1986; Hummel et al. 1987; Goulding & Alexander 2009), prominent radio jets (Miyamoto et al., 2017), shock excitation (Falcón-Barroso et al., 2014) and a shock co-spatial with the peak of the radio jet (Davies et al., 2017). The size of the nuclear ring of NGC 613 (radius pc) is almost identical to that of NGC 5806 (radius pc), and the molecular gas mass of NGC 613 is about % larger than that of NGC 5806 when a Galactic conversion factor is applied. NGC 613 also has a total stellar mass ( M⊙) similar to that of NGC 5806 ( M⊙), and a relative size of the nuclear ring with respect to the galaxy optical diameter () similar to that of NGC 5806 (; Agüero et al. 2016). This leads us to expect the nuclear ring of NGC 613 to have conditions similar to those of the NGC 5806 nuclear ring, making a comparison highly relevant. Sato et al. (2021) recently investigated the properties of the molecular gas in and around the nuclear ring of NGC 613. While they identified GMCs and measured their properties, they did not conduct a detailed analysis of the GMC characteristics, such as the size – linewidth relation. We thus first identify and then thoroughly explore the properties of the GMCs in and around the nuclear ring of NGC 613 here. Key characteristics of NGC 613 are summarised in Table 1.
| Quantity | Value | Reference |
|---|---|---|
| Type | SB(rs)bc | (1) |
| R.A. (J2000) | (2) | |
| Dec. (J2000) | (2) | |
| Distance (Mpc) | (3) | |
| Position angle (degree) | (2) | |
| Inclination (degree) | (2) | |
| Systemic velocity (km s-1) | (2) | |
| Central molecular gas mass (M⊙) | (2) | |
| Total stellar mass (M⊙) | (4) | |
| Stellar velocity dispersion (km s-1) | (5) | |
| Total star-formation rate (M⊙ yr-1) | (4) |
References: (1) de Vaucouleurs et al. (1991). (2) Miyamoto et al. (2017). The central molecular gas mass was calculated using the 12CO(3-2) intensity integrated over the central region of NGC 613 only (radius ), assuming a CO-to-molecules conversion factor cm-2 (K km s-1)-1. (3) Tully (1988). (4) Combes et al. (2019). The total stellar mass was calculated using the total luminosity and a mass-to-light ratio . The total star-formation rate was calculated using the total infrared luminosity (NASA/IPAC Extragalactic Database). (5) da Silva et al. (2020). Luminosity-weighted stellar velocity dispersion within the central region of NGC 613 (radius ).
This paper is structured as follows. In Section 2, we describe the data and the methodology used to identify GMCs in NGC 613. The GMCs identified and their properties are discussed in Section 3. In Section 4, we investigate and discuss the GMC size – linewidth relation and dynamical states, and the clouds in the nuclear ring only. We summarise our findings in Section 5.
2 Observations
2.1 Data
NGC 613 was observed in the 12CO(1-0) line (rest frequency GHz) using the Atacama Large Millimeter/sub-millimeter Array (ALMA). The observations were carried out using two different -m array configurations in November and December 2017 (programme 2017.1.01671.S, configurations C43-6 and C43-8, PI Miyamoto). The C43-6 configuration observations had s on-source using antennae and baselines of – m, leading to a maximum recoverable scale (MRS) of . The C43-8 configuration observations had s on-source using antennae and baselines of – m, leading to a MRS of . Both configurations have a primary beam of full-width at half-maximum (FWHM). The correlator was set up with one spectral window of MHz ( km s-1) bandwidth and channels each of kHz ( km s-1) centred on the redshifted 12CO(1-0) line. The three remaining spectral windows each have a GHz bandwidth with channels of kHz and were used to observe the continuum.
2.1.1 Data reduction
The raw data of each configuration were calibrated and then combined using the standard ALMA pipeline version 5.6.1-8, using Common Astronomy Software Applications (casa; McMullin et al. 2007) version 5.6.1. Continuum emission was measured using line-free channels and subtracted from the data using the casa task UVCONTSUB. We imaged the data using Briggs weighting with a robust parameter of and cleaned using the tclean task to a depth equal to twice the root-mean-square (RMS) noise of the dirty data cube (respectively the continuum image), yielding synthesised beam FWHM of ( pc2) with a position angle of for the 12CO(1-0) line and ( pc2) with a position angle of for the continuum. We chose a pixel size of to balance image size and spatial sampling, yielding approximately pixels across the synthesised beam for the line data. We thus created a fully calibrated and cleaned cube encompassing most of the primary beam spatially, with km s-1 (binned) channels spectrally. The RMS noise of the 12CO(1-0) cube is mJy beam-1 ( K) per channel. The continuum image has the RMS noise of Jy beam-1 and the flux of the continuum emission within the nuclear ring (radius ) is mJy.
2.2 Moment maps
Figure 1 shows the zeroth-moment (integrated-intensity), first-moment (intensity-weighted mean line-of-sight velocity) and second-moment (intensity-weighted line-of-sight velocity dispersion) maps of the 12CO(1-0) emission of NGC 613. These were generated using a smooth-moment masking method (e.g. Dame, 2011). In summary, we convolved the 12CO(1-0) data cube spatially with a Gaussian of width equal to that of the synthesised beam and Hanning-smoothed the cube spectrally. To create a mask we then selected only pixels with intensities exceeding three times the RMS noise of the smoothed cube, and applied this mask to the original cube to generate the moment maps.
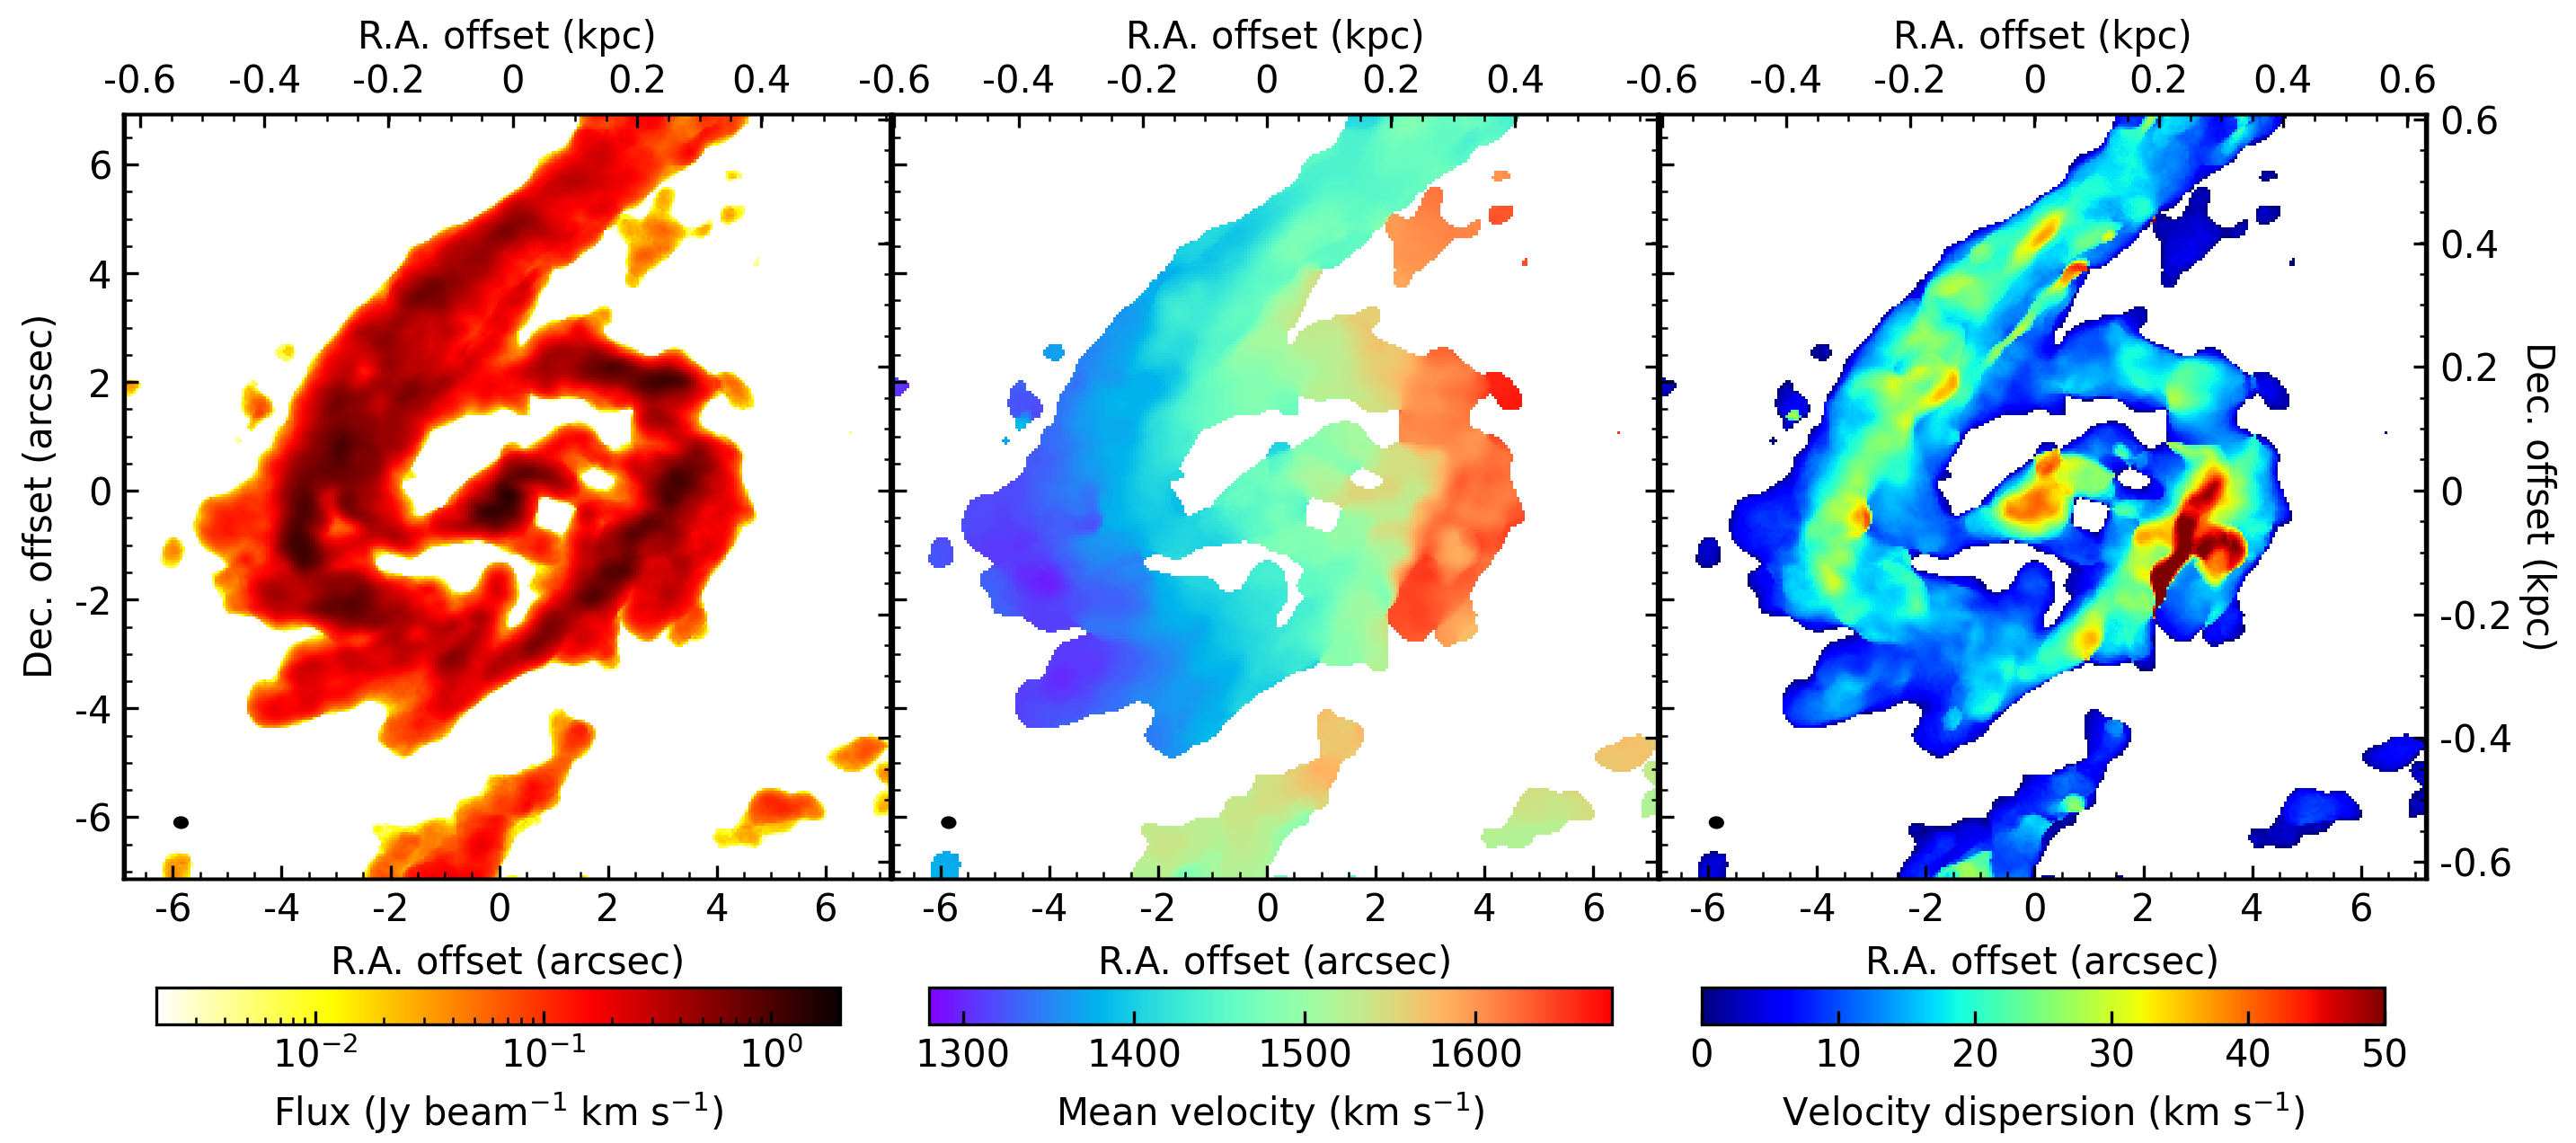
The integrated intensity map of NGC 613 (top-left panel of Figure 1) reveals a highly structured molecular gas distribution. There are at least three clearly distinguishable structures: a nucleus at the very centre of the galaxy, a nuclear ring with a radius of pc and offset dust lanes stretching from the northeast (toward the northwest) and the southwest (toward the southeast). The interface between the nuclear ring and the dust lane in the east has intensities higher than those in the rest of the nuclear ring, and there is a gradual decrease of the intensities as a function of the azimuthal angle in a counter-clockwise direction. The interface in the west also has higher intensities but it does not show a clear decrease of the intensities along the nuclear ring. Finally, there are faint nuclear spiral arms between the nucleus and the nuclear ring.
The mean velocity map (top-middle panel of Figure 1) clearly shows roughly circular motions throughout the disc and particularly within the nuclear ring, with a projected angular momentum vector pointing toward the northeast. The zero-velocity curve shows significant twists, however, particularly along the dust lanes, implying significant non-circular motions. These motions are as expected from the shocks and non-axisymmetric perturbations driven by the large-scale bar of a disc galaxy (e.g. Athanassoula, 1992).
The velocity dispersion of the molecular gas (top-right panel of Figure 1) ranges from to km s-1, higher than typical velocity dispersions across discs of galaxies but similar to those in the central region of nearby disc galaxies (e.g. Wilson et al., 2011; Mogotsi et al., 2016; Sun et al., 2018). The nucleus has particularly high velocity dispersion ( – km s-1). As NGC 613 hosts an AGN and radio jets, this might be due to the AGN and its feedback. The velocity dispersions at the interfaces between the nuclear ring and the offset dust lanes also have high velocity dispersions ( – km s-1), higher than those in the rest of the nuclear ring ( – km s-1). In particular, the interface to the west of the nucleus has velocity dispersions higher ( – km s-1) than those in the interface to the east of the nucleus ( – km s-1), indicating that the two regions are slightly different. Indeed, Sato et al. (2021) revealed that the gas inflow velocity toward the eastern side of the nuclear ring from the northeast dust lane ( km s-1) is lower than that toward the western side of the nuclear ring from the southwest dust lane ( km s-1).
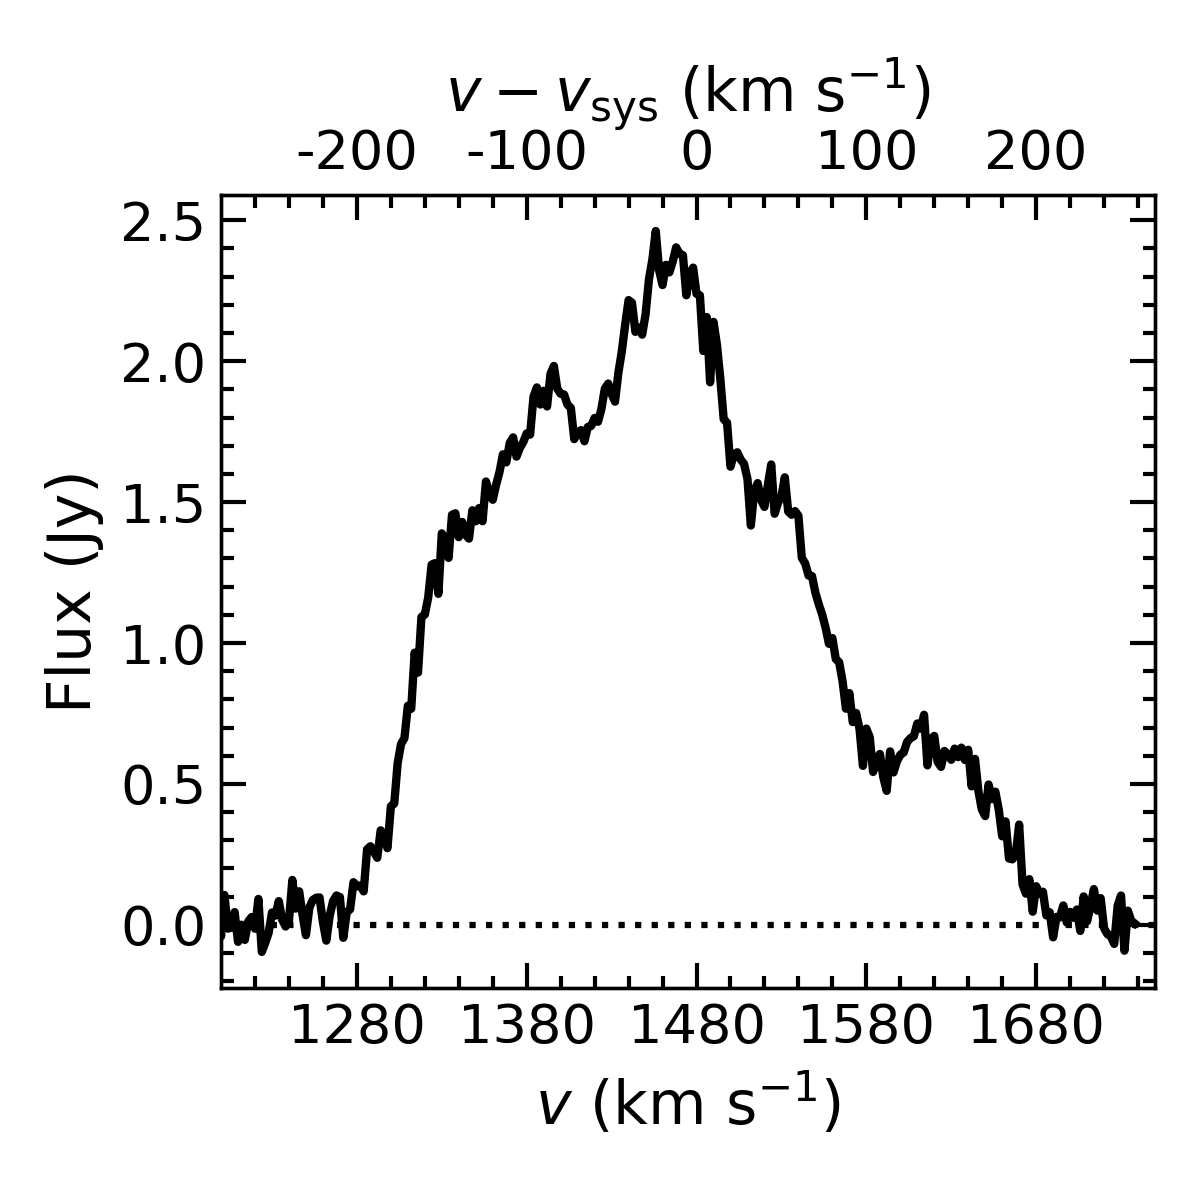
The 12CO(1-0) spectrum of NGC 613 integrated within a central region of (bottom-left panel of Figure 1) reveals multiple peaks, suggesting again complex molecular gas distribution and kinematics. The total 12CO(1-0) flux in that region is Jy km s-1.
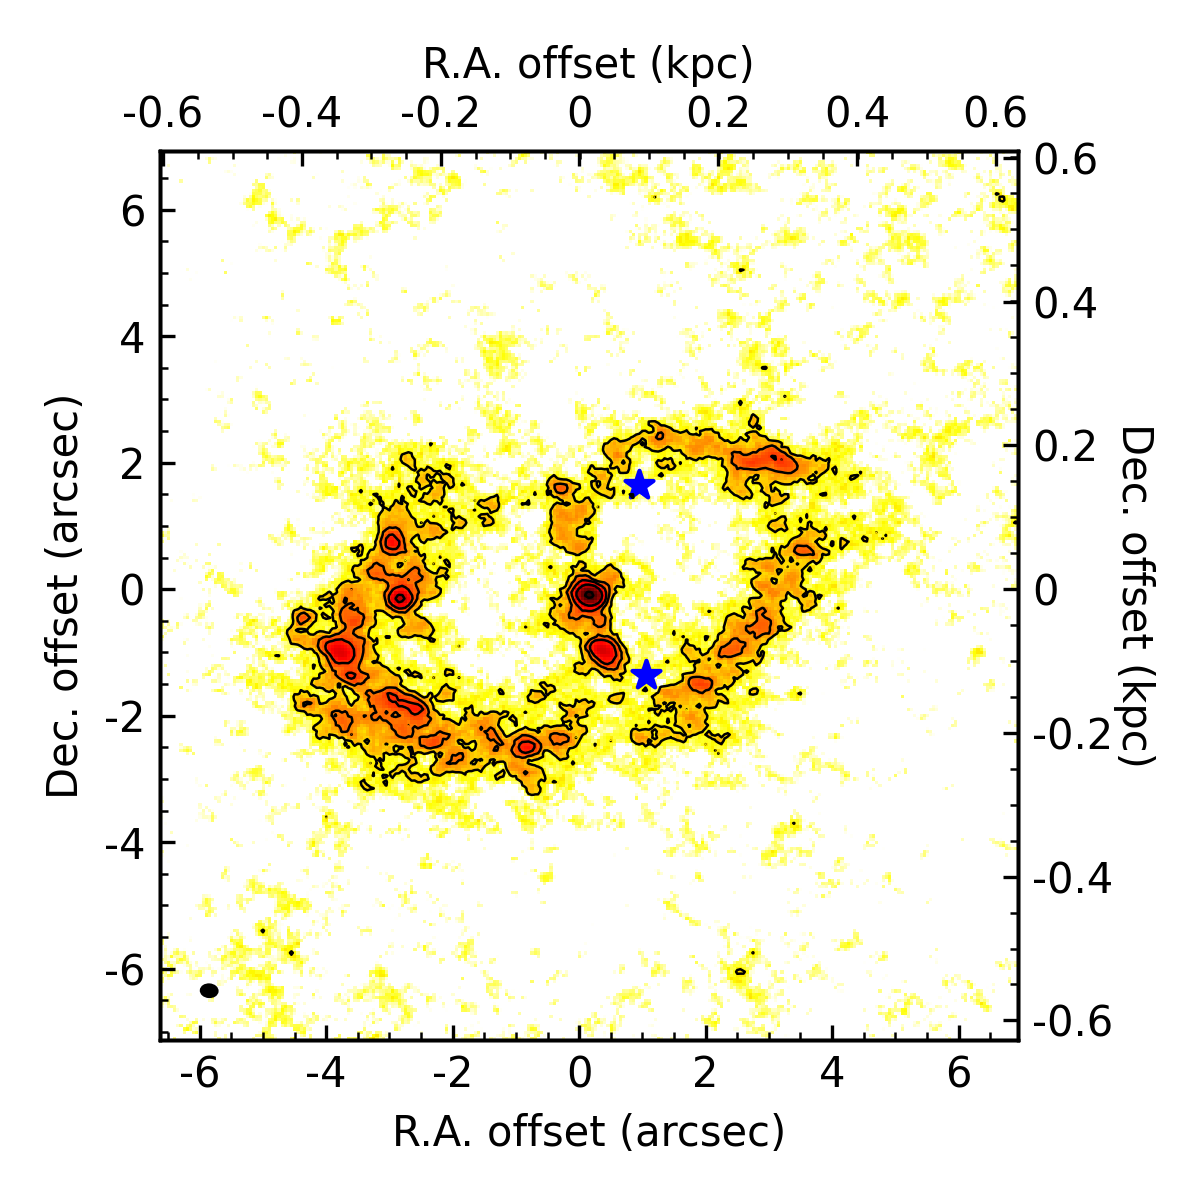
The GHz continuum map of NGC 613 (bottom-middle of Figure 1) shows two distinct structures: one associated with the nuclear ring, the other in the centre and elongated roughly north-south. By showing that the spectral index between and GHz in the nuclear ring while in the central region, Miyamoto et al. (2017) suggested that the continuum emission in the nuclear ring likely arise from free-free emission from H ii regions while the elongated continuum emission at the centre is due to the jet. Additionally, they reported that SiO(2-1) (a shock tracer; e.g. García-Burillo et al. 2001) is detected at both ends of the elongated continuum (blue stars in bottom-middle of Figure 1).
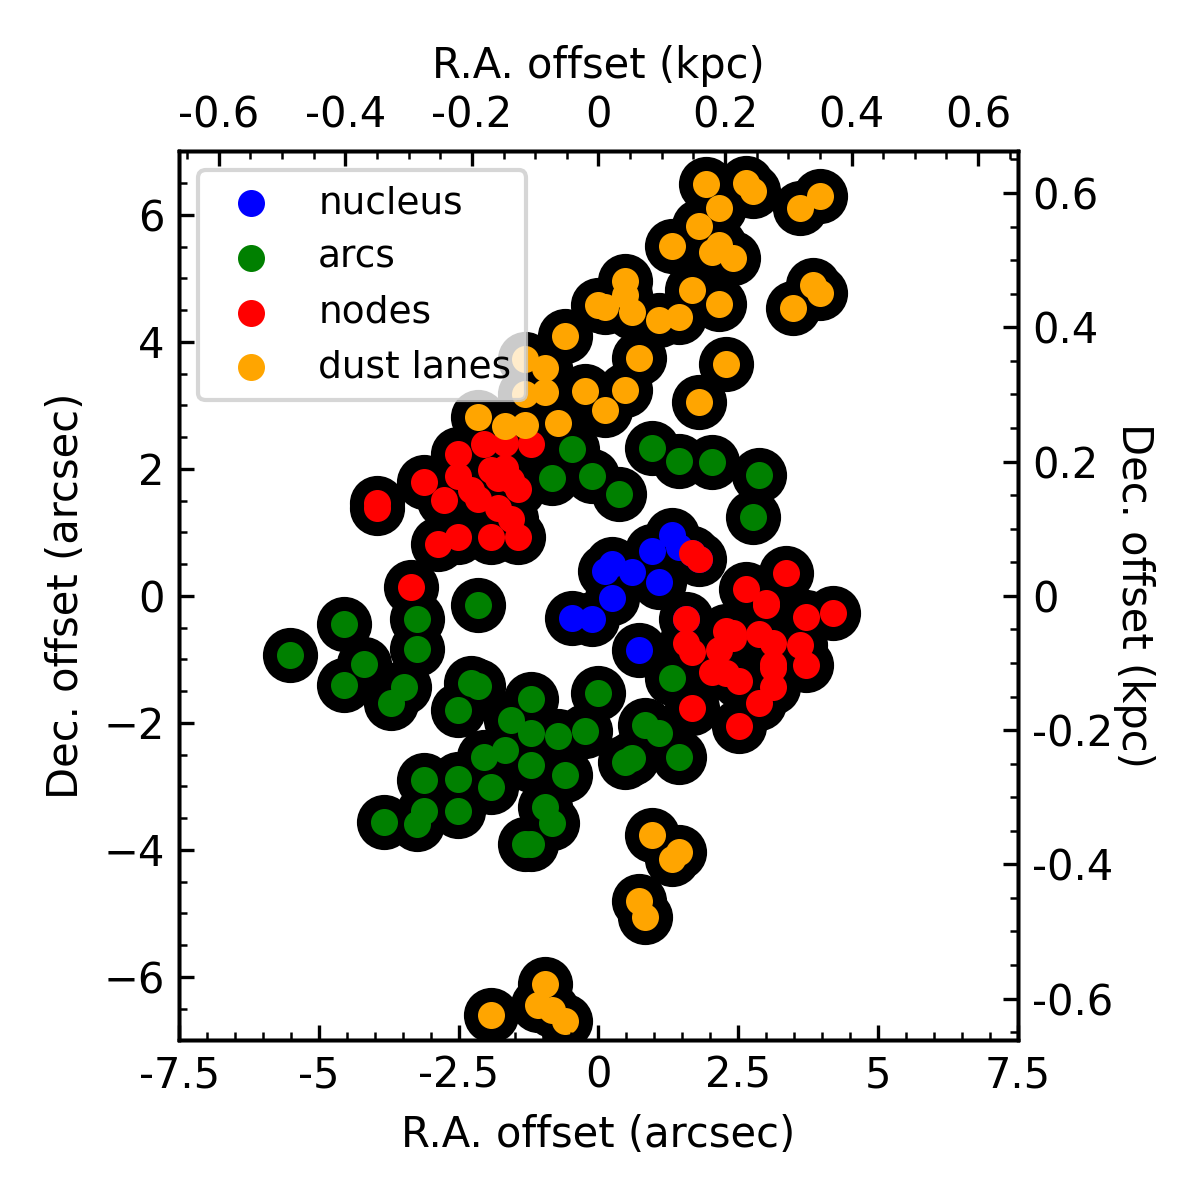
The bottom-right panel of Figure 1 illustrates our definitions of four distinct regions based on the moment maps: nucleus (blue), arcs (green), nodes (red) and dust lanes (yellow). The nucleus encompasses the inner pc in radius. The arcs refer to the regions of relatively low velocity dispersions ( – km s-1) of the nuclear ring, while the nodes refer to the regions of relatively high velocity dispersions ( km s-1) of the nuclear ring, at the interfaces between the offset dust lanes and the nuclear ring. As expected, the dust lanes encompass the two offset dust lanes stretching from the east of the nuclear ring toward the northwest and from the west of the nuclear ring toward the southeast, that are often present in barred disc galaxies (e.g. Athanassoula, 1992). Note that we will also refer to the nuclear ring in its entirety, encompassing both the arcs and the nodes.
Interestingly, the molecular gas distribution of NGC 613 is very similar to that in the central region of NGC 5806 (Choi et al., 2023), except for the fact that NGC 5806 has similar gas inflow velocities at the nodes on either side of the nuclear ring. The GMCs of NGC 613 and NGC 5806 are thus also expected to have similar characteristics.
3 Cloud identification and properties
3.1 Cloud identification
To identify the clouds of NGC 613 (and to be consistent with previous works), we use our own modified version of the algorithms of cpropstoo (Liu et al., 2021), an updated version of CPROPS (Rosolowsky & Leroy, 2006; Leroy et al., 2015). Due to fewer free parameters, our version is more efficient and leads to a more robust cloud identification in complex and crowded environments.
We refer the reader to Liu et al. (2021) for full details of our version of cpropstoo, but introduce here the main parameters of the algorithms. cpropstoo identifies and divides clouds into resolved and unresolved clouds based on fixed input parameters. The algorithm generates a three-dimensional (3D) mask using two parameters, high-threshold and low-threshold. The mask initially chooses only pixels for which two adjacent channels are above high-threshold, and then expands this region to include all neighbouring pixels for which two adjacent channels are above low-threshold. To identify individual clouds from the selected pixels, the algorithm imposes a minimum cloud area (minarea) and a minimum number of cloud velocity channels (minvchan). Lastly, the convexity parameter (defined as the ratio of the volume of a cloud’s 3D intensity distribution to that of its convex envelope) is used to identify structures over multiple spatial scales with less arbitrariness. We set the minimum contrast between a cloud’s peak and its boundary at K.
In this work, we run cpropstoo on a region of the 12CO(1-0) cube centred on the galaxy centre, thus encompassing all of the emission detected in the zeroth-moment map (see Figure 1), adopting high-threshold , low-threshold , minvchan and convexity . We assign minarea a range of – spaxels (the synthesised beam area) with a step size of spaxels in descending order, rather than adopting a single value. As a result, we identify GMCs, of which are both spatially and spectrally resolved, shown in Figure 2. We note that while different sets of parameters yield slightly different cloud identification results, we have verified that for reasonable parameters the overall results and conclusions remain unaffected.
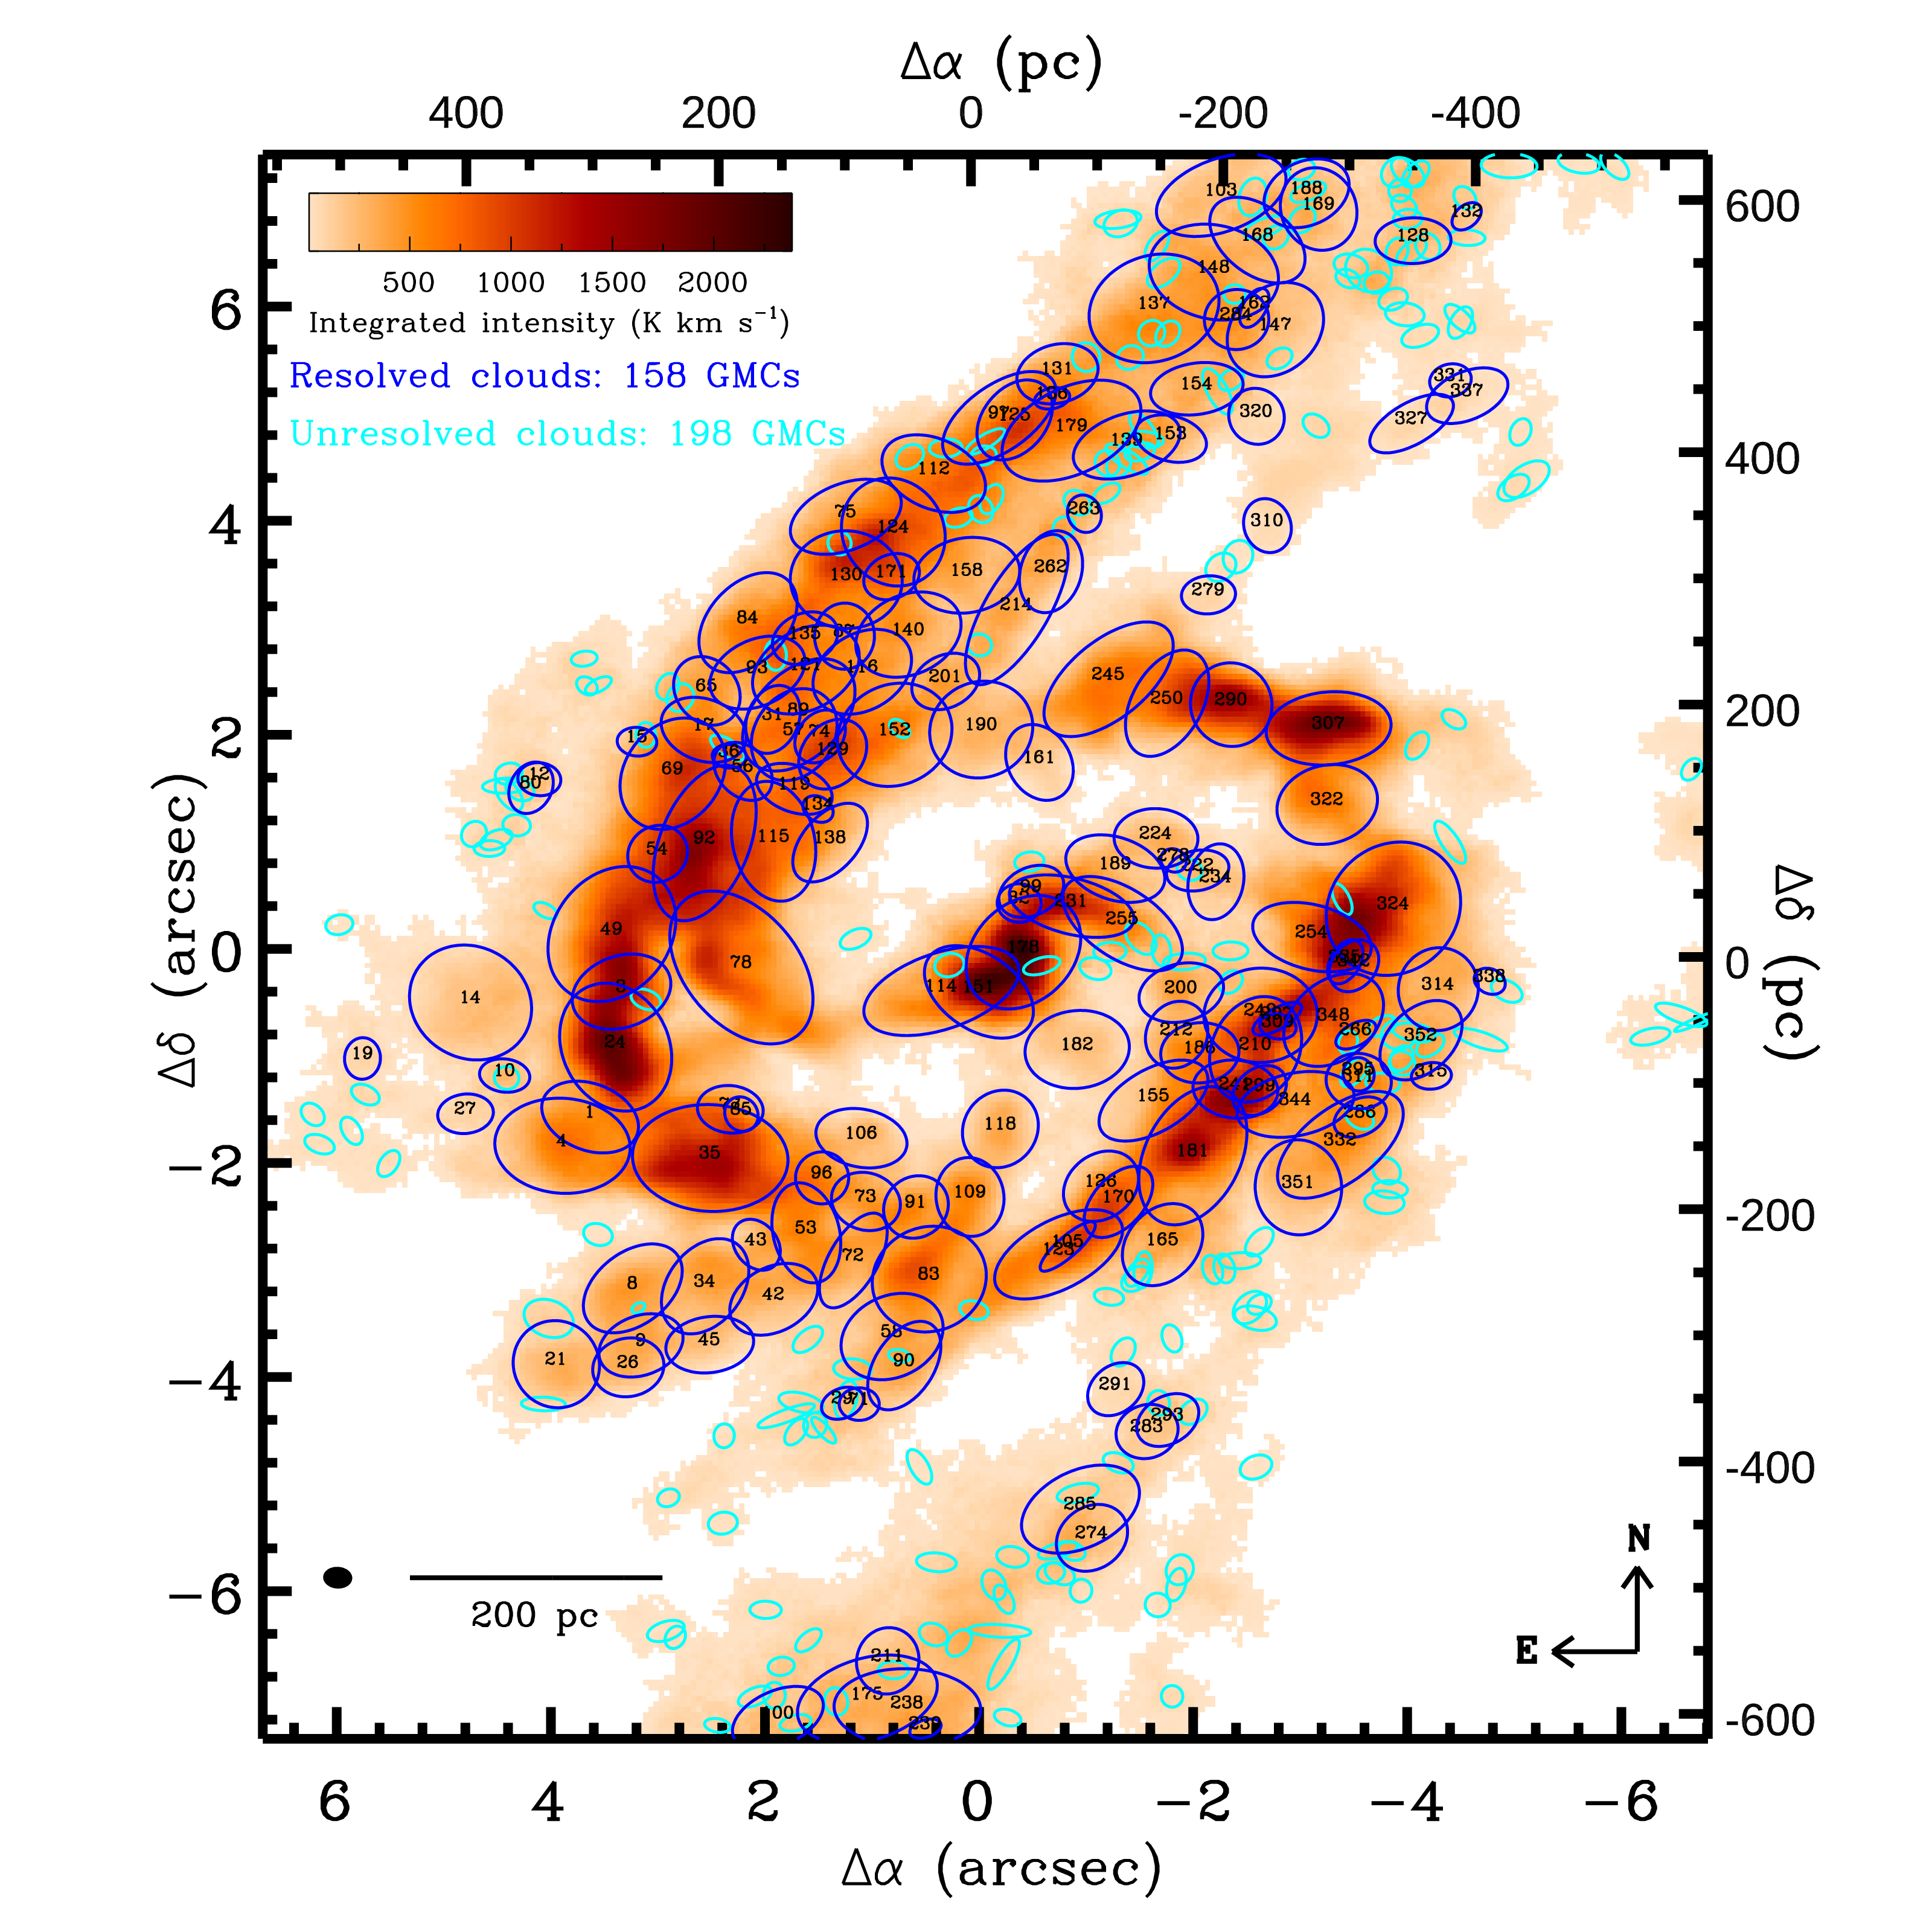
The synthesised beam ( or pc2) is shown in the bottom-left corner as a filled black ellipse.
3.2 Cloud properties
We calculate the physical properties of the clouds as described in Liu et al. (2021) and references therein (Rosolowsky & Leroy, 2006; Leroy et al., 2015). We describe here the three key properties of the clouds (size, velocity dispersion and gas mass), from which the virial parameter is derived.
The cloud size (radius ) is defined as
| (1) |
where is a geometric parameter, and are the deconvolved RMS spatial extent along the major and the minor axis of the cloud, respectively, and we adopt for consistency with earlier studies (e.g. Solomon et al., 1987; Utomo et al., 2015; Liu et al., 2021).
The observed velocity dispersion () is calculated as
| (2) |
where is the second moment extrapolated to the limit of infinite sensitivity ( K) along the velocity axis and is the channel width of km s-1.
The molecular gas mass () is obtained from the 12CO(1-0) luminosity
| (3) |
where is the 12CO(1-0) flux, the galaxy redshift and the observed line frequency. To obtain the molecular gas mass, we adopt a CO-to-molecule conversion factor (including helium) cm-2 (K km s-1)-1, equivalent to a conversion factor M⊙ (K km s-1 pc2)-1, yielding
| (4) |
3.2.1 General properties
Table 2 lists the three aforementioned (intensity-weighted) properties of each cloud and many more (see Liu et al., 2021): each cloud’s central position (R.A. and Dec.), mean local standard of rest velocity (), size (radius ), observed velocity dispersion (), 12CO(1-0) luminosity (), molecular gas mass (), peak intensity (), gradient-subtracted velocity dispersion () and deprojected distance from the galaxy centre (). represents the "turbulent" motions within a cloud, having subtracted all bulk motions due to e.g. shear or internal rotation, and we refer readers to Utomo et al. (2015) for its definition (see also Liu et al. 2021). The uncertainties of the above quantities are derived via bootstrap resampling. The uncertainty of the distance to NGC 613 is not propagated through, as a distance error translates to a systematic scaling of some of the estimated quantities: , , , and (see Section 4).
| ID | R.A. (2000) | Dec. (2000) | ||||||||
|---|---|---|---|---|---|---|---|---|---|---|
| (h:m:s) | () | (km s-1) | (pc) | (km s-1) | (km s-1) | ( K km s-1 pc-2) | ( M⊙) | (K) | (pc) | |
| 1 | 1:34:18.49 | -29:25:08.16 | 1267.1 | 44.41 3.54 | 11.44 1.01 | 9.16 1.12 | 53.035 3.525 | 23.335 1.551 | 9.5 | 357 |
| 2 | 1:34:18.45 | -29:25:07.07 | 1282.3 | - | 5.87 6.31 | 2.38 7.14 | 16.063 33.692 | 7.068 14.825 | 11.2 | 305 |
| 3 | 1:34:18.47 | -29:25:06.99 | 1293.4 | 38.21 2.34 | 12.11 0.74 | 8.72 0.61 | 93.500 3.926 | 41.140 1.728 | 13.2 | 328 |
| 4 | 1:34:18.51 | -29:25:08.43 | 1310.5 | 55.94 1.57 | 20.15 0.52 | 17.95 0.51 | 416.533 6.462 | 183.274 2.843 | 17.7 | 385 |
| 5 | 1:34:18.65 | -29:25:07.95 | 1304.3 | - | 4.82 3.60 | 3.62 5.89 | 4.883 5.776 | 2.149 2.541 | 5.6 | 539 |
| 6 | 1:34:18.55 | -29:25:07.80 | 1308.3 | - | 4.05 4.82 | 0.97 2.38 | 6.225 12.051 | 2.739 5.302 | 7.3 | 420 |
| - | - | - | - | - | - | - | - | - | - | - |
| 356 | 1:34:17.91 | -29:25:07.39 | 1668.8 | - | 4.362.16 | 2.781.79 | 4.4612.141 | 1.9630.942 | 7.8 | 384 |
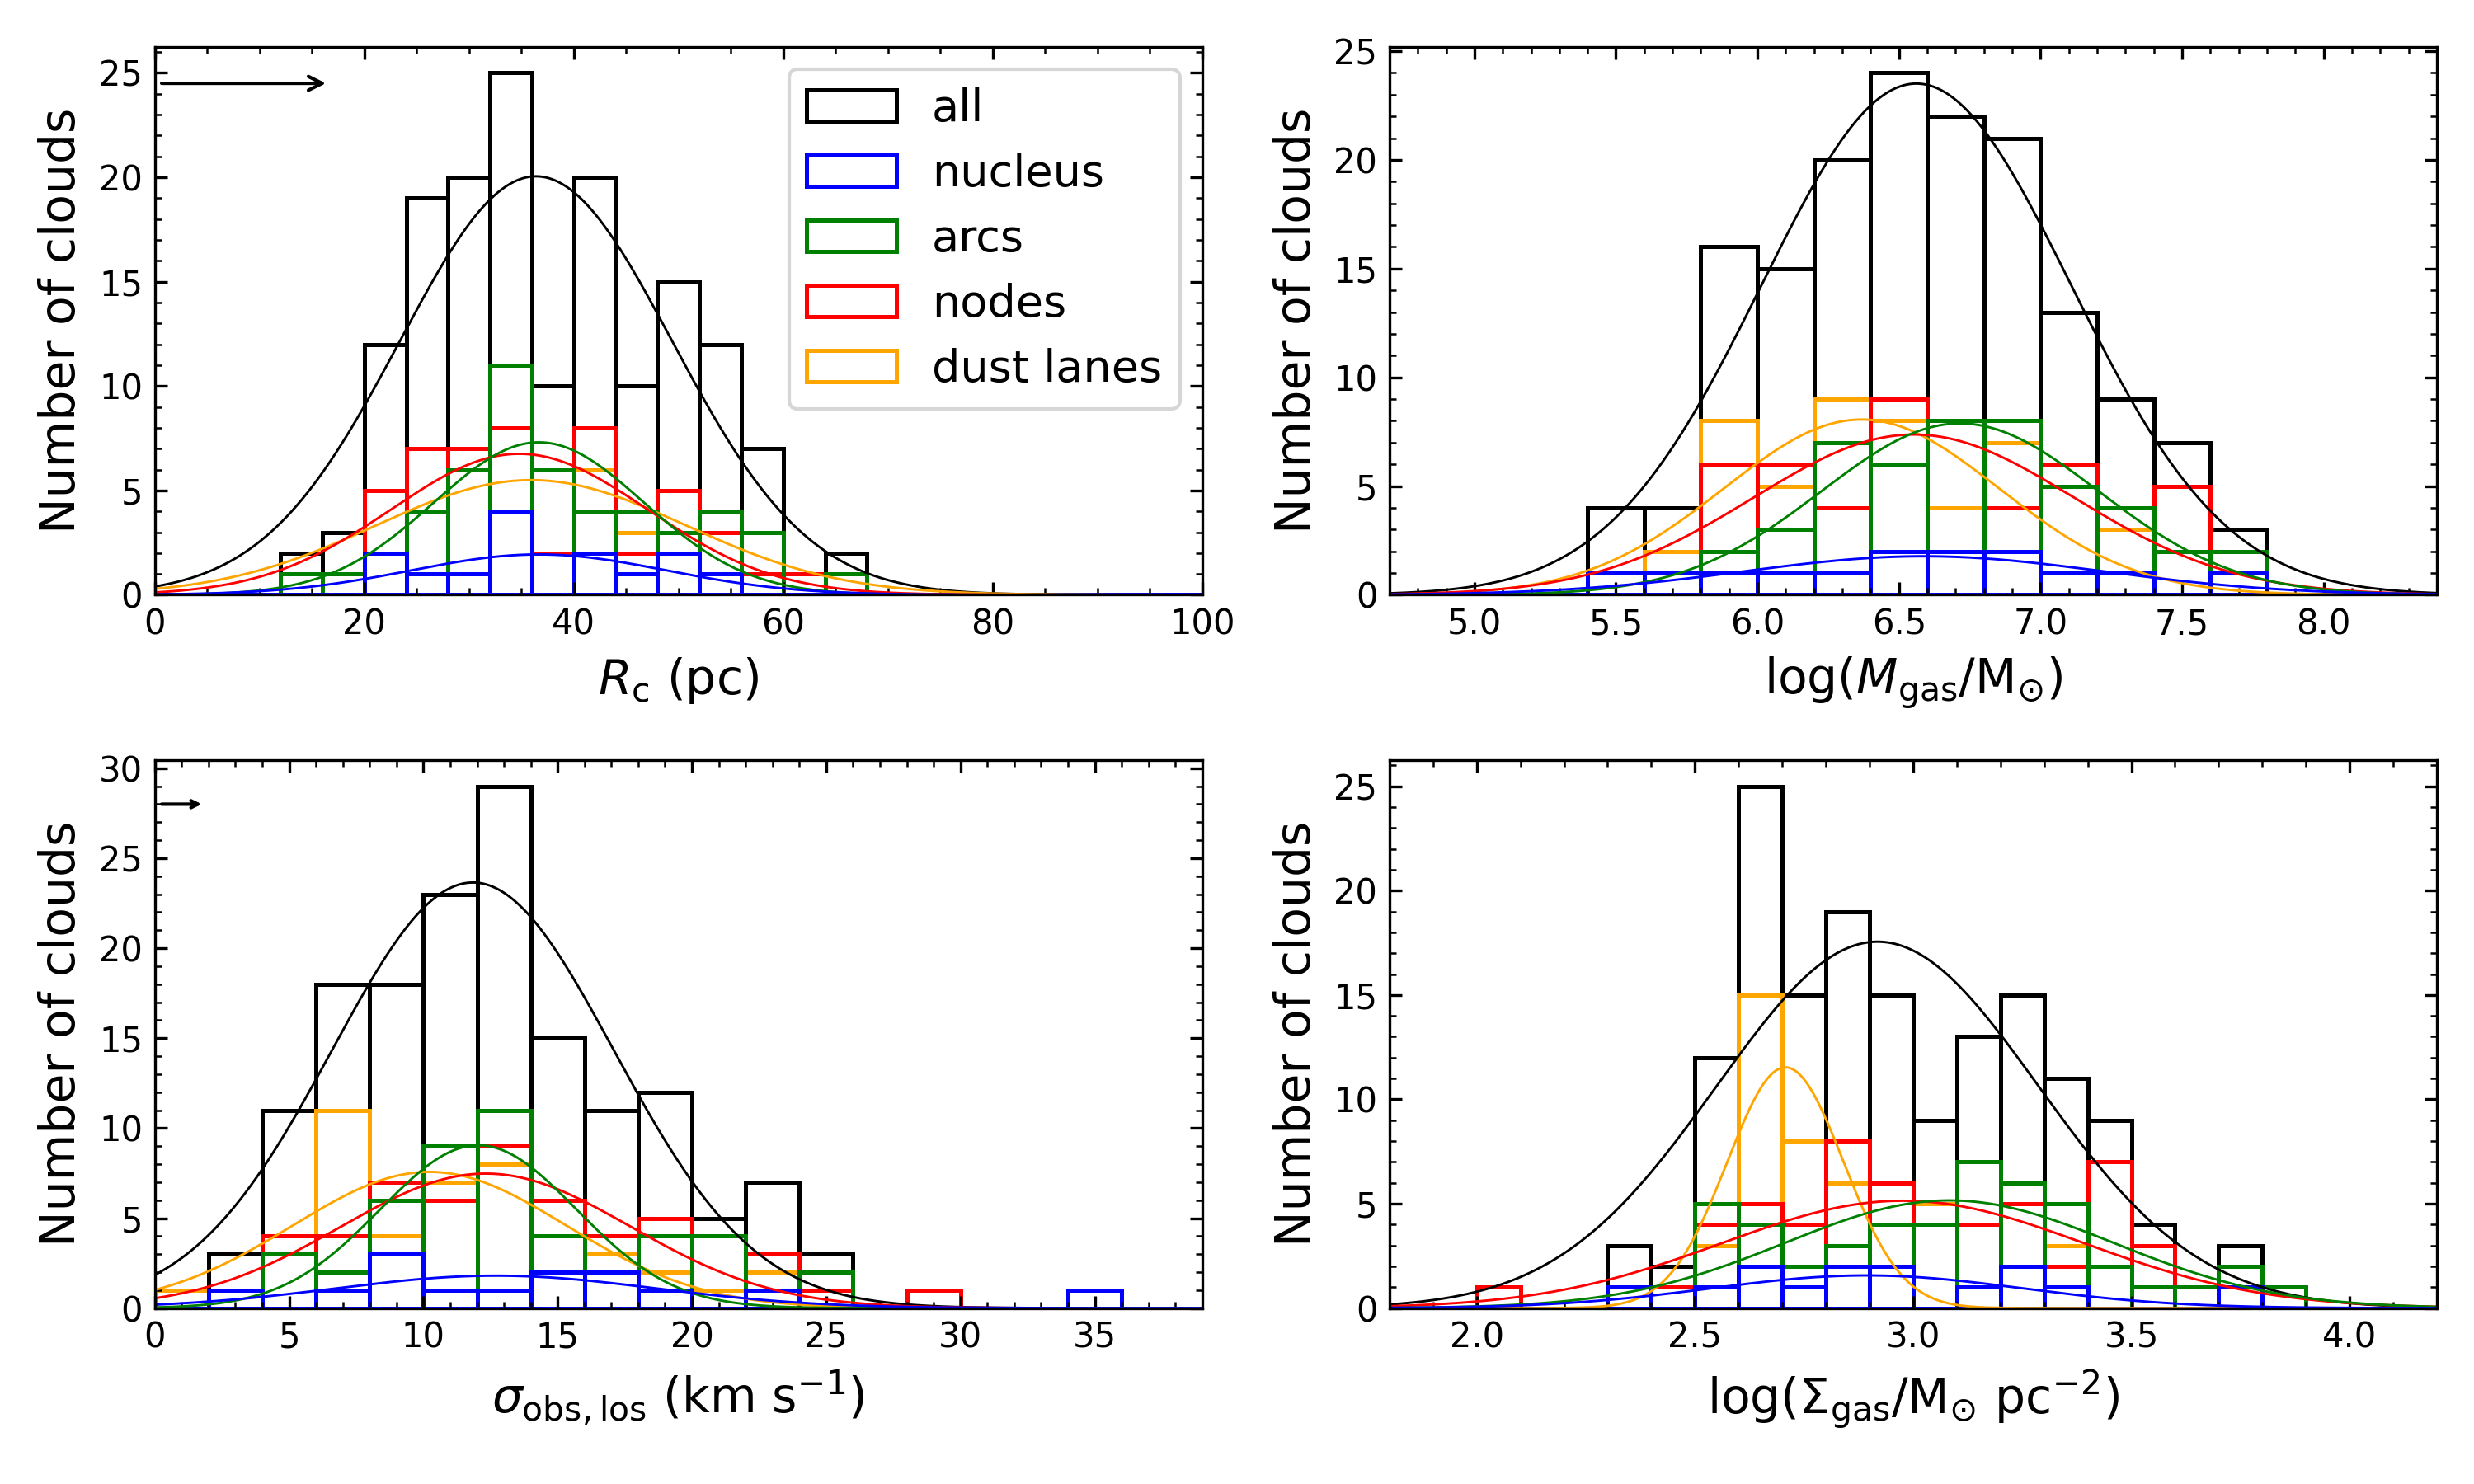
Figure 3 shows the number distributions of , , and gas mass surface density () of the resolved clouds of NGC 613. In each panel, the black histogram and overlaid black Gaussian fit show the full cloud sample, while the colour-coded histograms and Gaussians show only the clouds in the nucleus (blue), arcs (green), nodes (red) and dust lanes (yellow), respectively. The means of all the quantities are listed in Table 3.
| Sample | ||||
|---|---|---|---|---|
| () | (pc) | ( M⊙) | (km s-1) | ( M⊙ pc-2) |
| All () | ||||
| Nucleus () | ||||
| Arcs () | ||||
| Nodes () | ||||
| Dust lanes () |
The resolved clouds of NGC 613 have sizes () ranging from to pc (top-left panel of Figure 3) with a mean of pc. They have gas masses () ranging from to M⊙ (top-right panel of Figure 3) with a mean of M⊙. Most () of the resolved clouds are massive ( M⊙). The observed velocity dispersions of the resolved clouds range from to km s-1 (bottom-left panel of Figure 3) with a mean of km s-1, while the gas mass surface densities range from to M⊙ pc-2 (bottom-right panel of Figure 3) with a mean of M⊙ pc-2.
The clouds in the arcs ( M⊙) and the dust lanes ( M⊙) tend to be more and less massive than the clouds in the nucleus ( M⊙) and the nodes ( M⊙), respectively. The clouds in the dust lanes tend to be less turbulent than those in the other three regions ( km s-1 vs. , and km s-1). However, there is no significant size variation across the four regions, resulting in higher and lower gas mass surface densities for the clouds in the arcs ( M⊙ pc-2) and the dust lanes ( M⊙ pc-2) compared to those in the nucleus ( M⊙ pc-2) and the nodes ( M⊙ pc-2), respectively. In particular, the clouds in the dust lanes have smaller gas mass surface densities than those in the other three regions (see the double-peaked black histogram in the bottom-right panel of Figure 3). This implies that the clouds get denser as they migrate into the nuclear ring.
In Figure 4, we compare the properties of the GMCs of the MWd, MW central molecular zone (CMZ) and other external galaxies with those of the NGC 613 GMCs using violin plots. The resolved clouds of NGC 613 have comparable sizes but larger masses, velocity dispersions and gas mass surface densities than the clouds of the MWd ( pc spatial resolution; Heyer et al. 2009; Rice et al. 2016; Heyer & Dame 2015; and references therein). On the other hand, they have larger sizes and masses but smaller velocity dispersions than the clouds of the CMZ ( pc resolution; Oka et al. 1998, 2001).
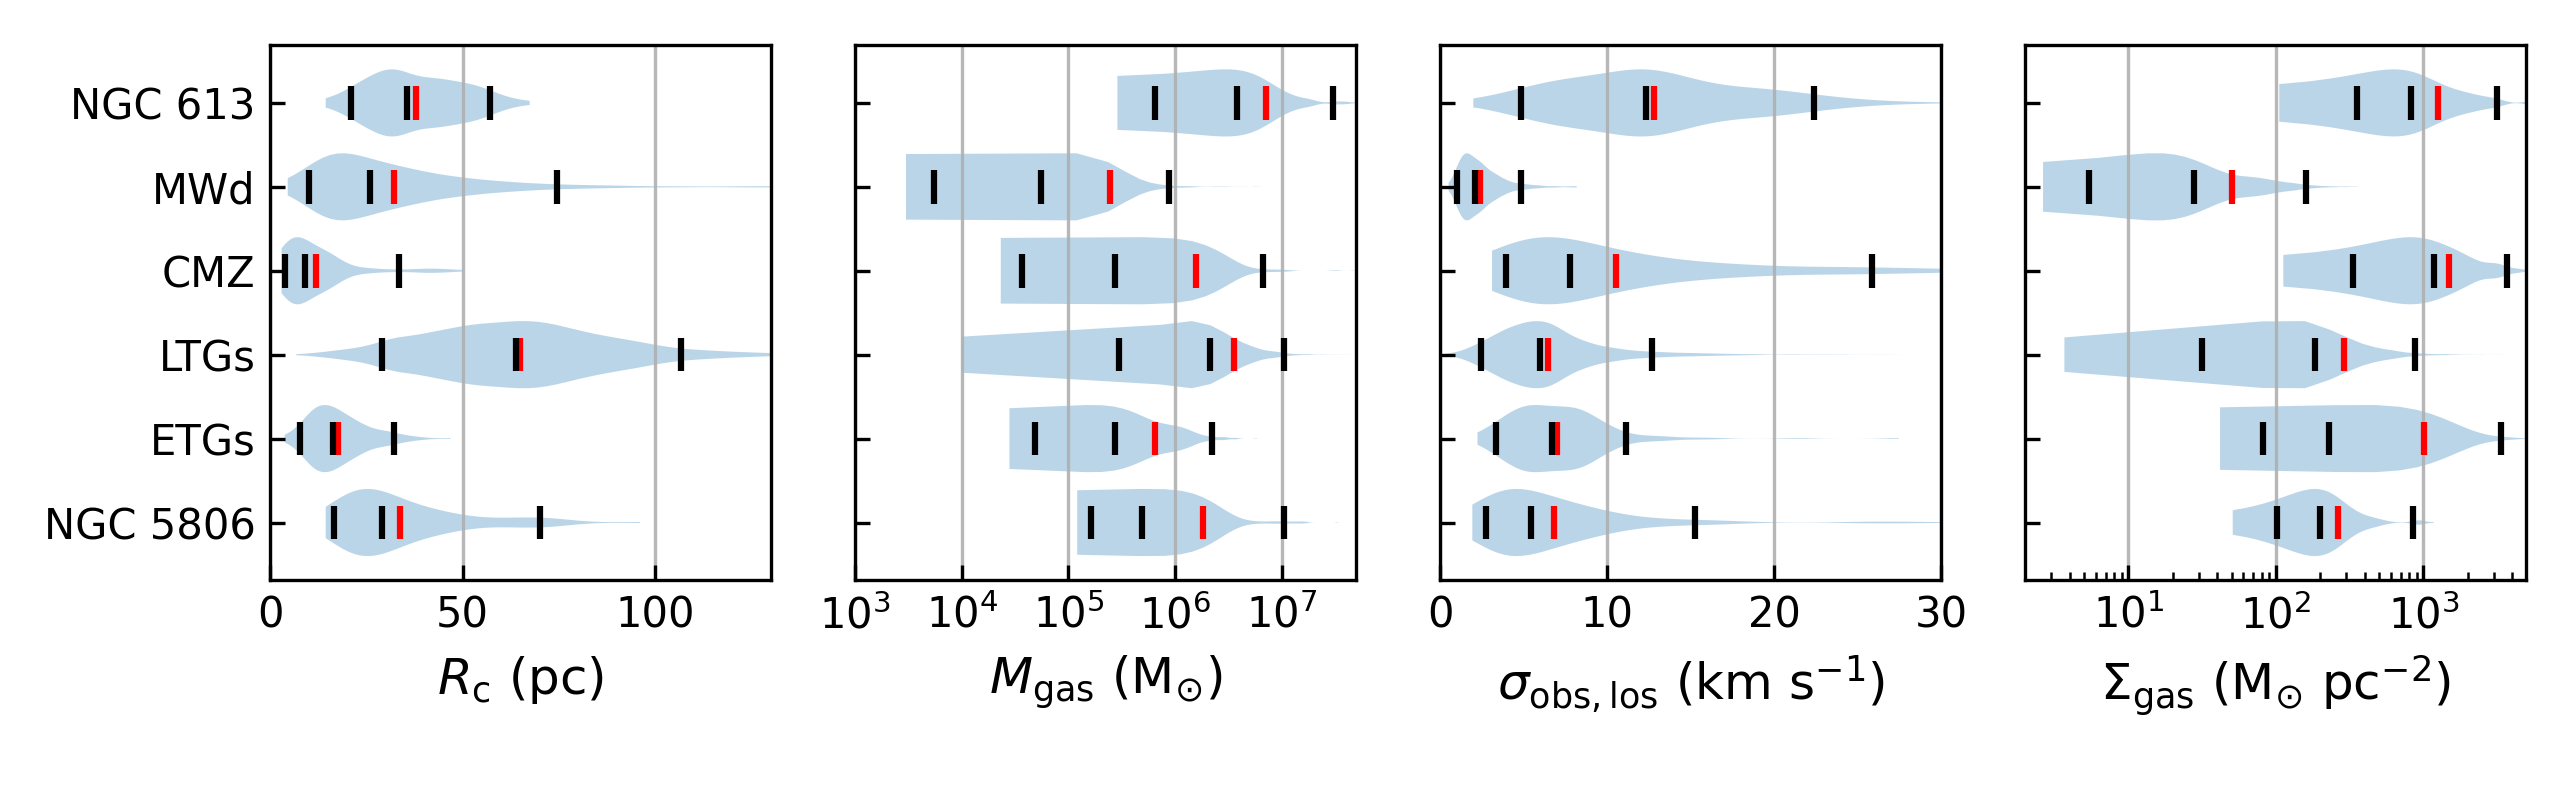
Most clouds in LTGs have larger sizes and comparable gas masses but smaller observed velocity dispersions and gas mass surface densities ( – pc resolution; e.g. Donovan Meyer et al. 2012; Gratier et al. 2012; Colombo et al. 2014; Rosolowsky et al. 2021; Liu et al. submitted) than the NGC 613 clouds. Clouds in ETGs (NGC 4526 and NGC 4429) have smaller sizes, gas masses and observed velocity dispersions ( pc resolution; Utomo et al. 2015; Liu et al. 2021) than the clouds of NGC 613. The gas mass surface densities of the clouds of NGC 4526 and NGC 4429 are comparable to ( M⊙ pc-2) and smaller than ( M⊙ pc-2) that of the clouds of NGC 613, respectively.
The clouds in the morphologically-similar galaxy NGC 5806 ( pc resolution; Choi et al. 2023) have very similar sizes ( – pc, pc), but their gas masses ( – M⊙, M⊙), velocity dispersions ( – km s-1, km s-1) and gas mass surface densities ( M⊙ pc-2) are much smaller than those of the clouds of NGC 613. For both NGC 613 and NGC 5806, the clouds in the arcs and nodes have gas mass surface densities higher than those in the dust lanes.
Overall, there is no significant cloud size variation across the four regions of NGC 613. The clouds in the arcs are generally more massive and have larger gas mass surface densities than the clouds in the dust lanes, while the clouds in the nucleus and nodes are in between. The clouds in the dust lanes tend to be less turbulent than those in other the regions.
3.2.2 Cloud kinematics
By comparing the observed velocity dispersions () with the gradient-subtracted velocity dispersions (), we can assess whether bulk motions (due to e.g. galaxy rotation and/or shear) contribute significantly to the observed velocity dispersions of the clouds. If the gradient-subtracted velocity dispersions are much smaller than the observed velocity dispersions, bulk motions are dominant in the clouds. Figure 5 shows the relation between and . More than of the clouds () of NGC 613 have a small difference between the two velocity dispersions (i.e. a ratio between the two velocity dispersions , with a mean ratio of ), suggesting that the observed velocity dispersions are dominated by internal turbulent motions rather than bulk motions inherited from larger-scale galaxy rotation. This is similar to the case of NGC 5806, for which more than of the clouds have a ratio larger than (Choi et al., 2023).
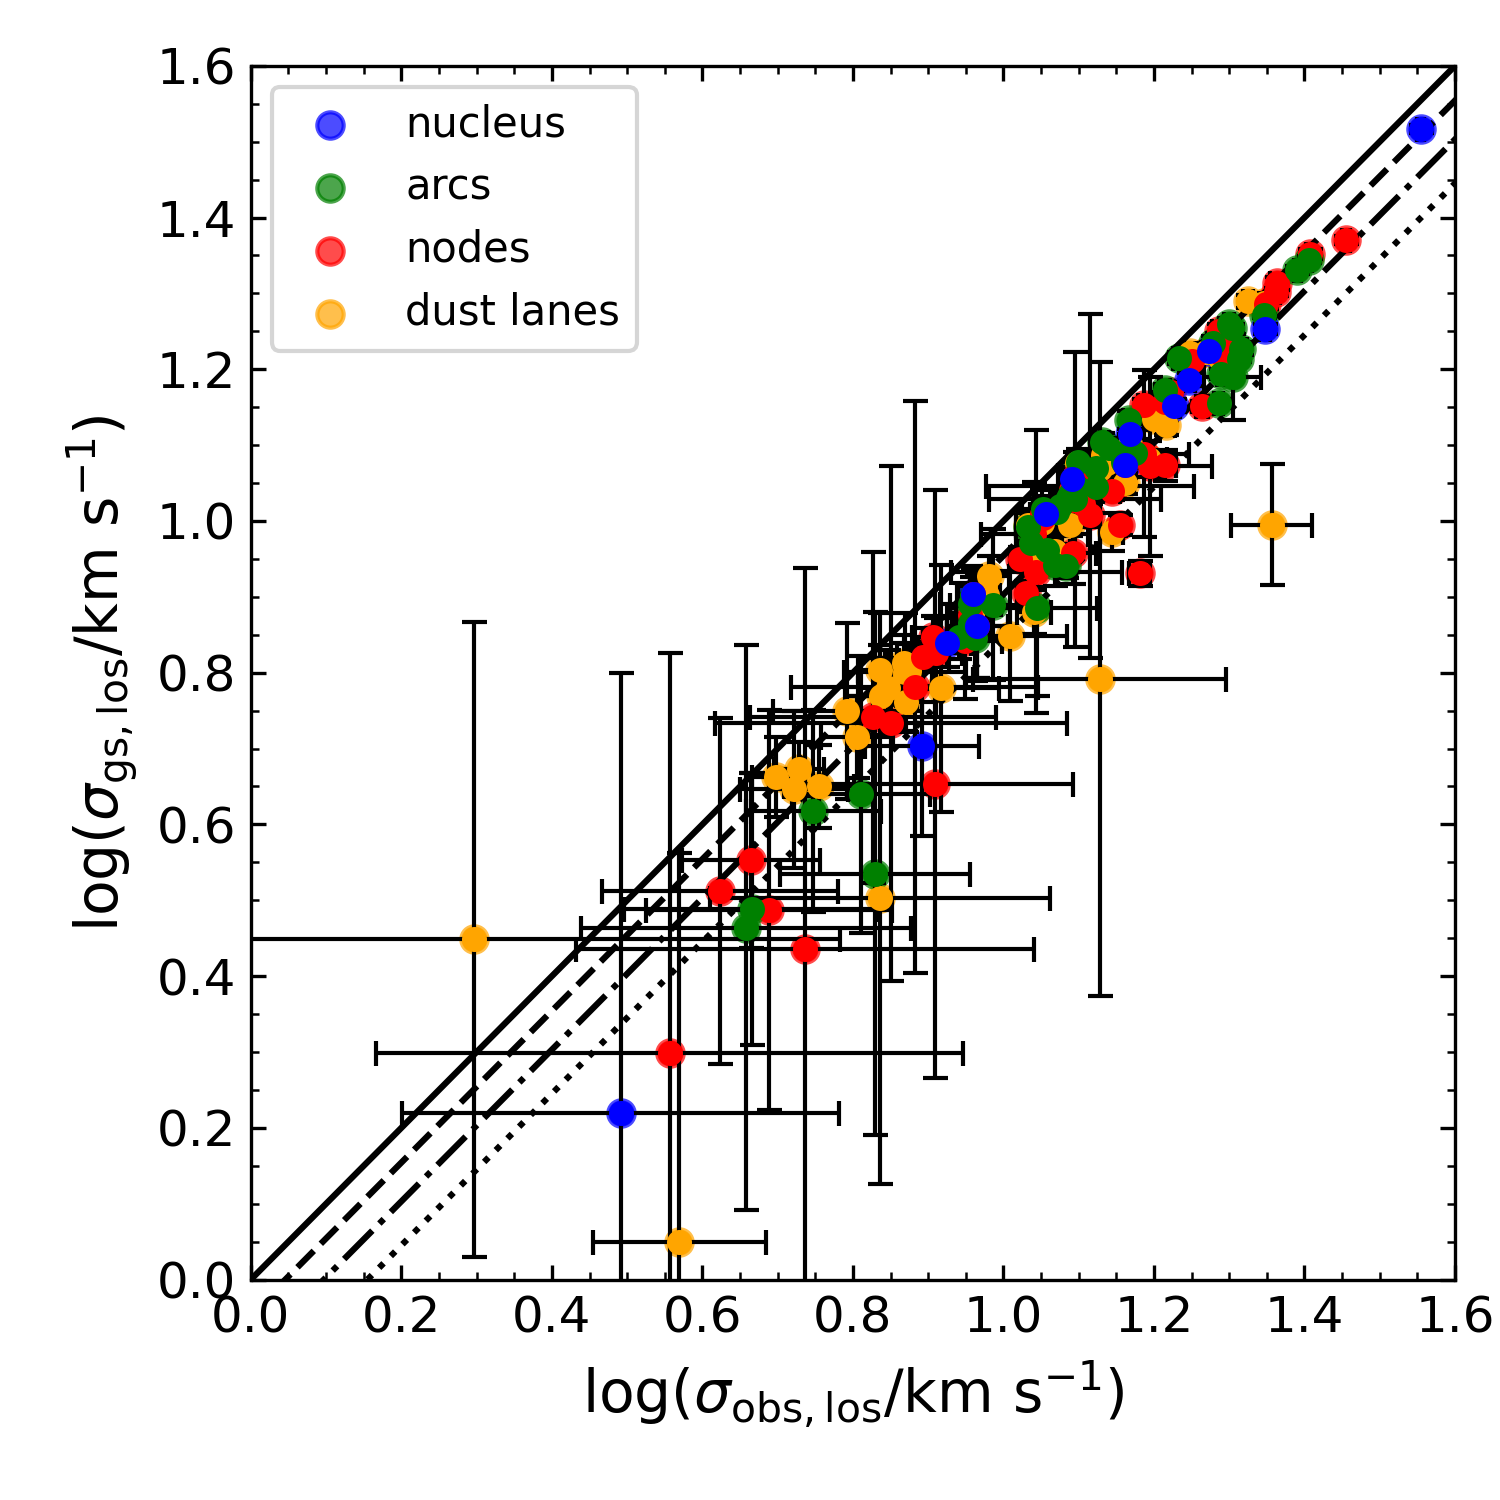
We also confirm that the rotation axes of the NGC 613 clouds are not well aligned with the isovelocity contours, which is consistent with the case of NGC 5806, supporting that the galaxy rotation does not affect the internal rotation of the clouds. This is similar to the case of the MW (Koda et al., 2006), M 31 (Rosolowsky, 2007), NGC 5806 (Choi et al., 2023) and NGC 5064 (Liu et al., 2023), but different from that of the ETGs NGC 4526 (Utomo et al., 2015) and NGC 4429 (Liu et al., 2021), where the rotation axes are well aligned with the isovelocity contours.
4 Dynamical states of clouds
Using the cloud properties calculated above, we now attempt to diagnose the dynamical states of the clouds. A standard relation to characterise clouds is the size – linewidth relation, known to have the form of a power law (e.g. , Larson 1981; Solomon et al. 1987). Another relation quantifying the gravitational boundness of clouds is that between the virial mass and gas mass, the ratio of which corresponds to the virial parameter of the clouds. We now discuss both relations in turn.
4.1 Steep size – linewidth relation
The size – linewidth relation is usually interpreted as being due to the internal turbulent motions of clouds (Falgarone et al., 1991; Heyer & Brunt, 2004; Elmegreen & Scalo, 2004; Lequeux, 2005). In the case of incompressible turbulence, is expected, which comes from the assumption that the energy cascades conservatively down to smaller scales (i.e. constant energy transfer rate, Kolmogorov 1941). In the case of compressible turbulence, the energy transfer down to a smaller scale is not conservative since the energy can be directly dissipated at large scales via shocks and/or gas compression, leading to steeper size – linewidth relations with power-law indices of – (e.g. Cen 2021, McKee & Ostriker 2007, and references therein).
The left panel of Figure 6 shows the size – linewidth relation of all resolved clouds of NGC 613 (coloured circles). There is a clear correlation between size and linewidth, with a Spearman rank correlation coefficient of and a -value of . To calculate the best-fitting power-law relation taking into account both and uncertainties, and to be consistent with previous GMC studies (e.g. Liu et al., 2021; Choi et al., 2023), we use a hierarchical Bayesian method called Linmix (Kelly, 2007). This yields a best-fitting relation
| (5) |
shown in Figure 6 as a black solid line. The best-fitting relations of MWd (Solomon et al., 1987) and CMZ (e.g. Kauffmann et al., 2017) clouds are also shown as black dashed and black dotted lines, respectively.
The best-fitting slope () is steeper than that of the clouds in the MWd (; Solomon et al. 1987) but is comparable to that of the clouds in the CMZ (; Kauffmann et al. 2017) within the uncertainties, and the zero-point ( km s-1) is comparable to that of the MWd clouds ( km s-1; Solomon et al. 1987) but is much smaller than that of the CMZ clouds ( km s-1; Kauffmann et al. 2017). The slope is also steeper than that of the clouds in most nearby galaxies ( – ; Rosolowsky et al. 2003; Rosolowsky 2007; Bolatto et al. 2008; Wong et al. 2011) and the predicted slopes of some theoretical models ( – ; Kolmogorov 1941; Cen 2021).The grey solid line in Figure 6, which shows an even steeper slope, is that from the best-fitting relation derived using the orthogonal distance regression (ODR) algorithm (). This slope is even steeper than that of NGC 5806 () and any other galaxy. We however again note that it is the slope yielded by the Linmix algorithm that will be used for the following discussion, to be consistent with previous GMC studies.
The right panel of Figure 6 shows the size – linewidth relations of the two ETGs NGC 4526 ( pc spatial resolution and K sensitivity) and NGC 4429 ( pc and K) and the LMC ( pc and K), that have observations with comparable spatial resolutions and sensitivities. While the observations of M 51 (Colombo et al., 2014) and M 33 (Gratier et al., 2012) are more different in term of the spatial resolution, we also include them in the right panel of Figure 6 to illustrate the size – linewidth relations of a broader variety of galaxy morphological types. Each coloured contour encompasses of the distribution of the clouds of the associated galaxy, including NGC 5806 (purple contour) and NGC 613 (black contour). The black curve with filled black circles shows the binned trend of NGC 613 from this work. It connects the median velocity dispersions measured in ten bins along the abscissa, each containing an equal number of clouds. Except the LMC (, Wong et al. 2011) and NGC 5806 (purple dotted line), none of these galaxies shows a steeper slope than NGC 613 (M33, , Rosolowsky et al. 2003; M51, no correlation, Colombo et al. 2014; NGC 4429, , Liu et al. 2021; NGC 4526, no correlation, Utomo et al. 2015). The LMC has a comparable slope and a large-scale bar, but comparison with it is not fully justified as the bar is off centred and the whole galaxy is strongly affected by a tidal interaction (e.g. de Vaucouleurs & Freeman, 1972; van der Marel, 2001). In addition, the slope of the NGC 4429 clouds is much shallower (; Liu et al. 2021) than that of the NGC 613 clouds once the influence of the large-scale galaxy rotation on the cloud velocity dispersions is removed.
More recently, Physics at High Angular resolution in Nearby GalaxieS (PHANGS) studies (e.g. Sun et al. 2020, Sun et al. 2022 and references therein) have been systematically probing the properties of extragalactic molecular gas at intermediate spatial scales. While most of the PHANGS studies were carried out using a beam-by-beam or pixel-by-pixel approach, Rosolowsky et al. (2021) identified GMCs in ten nearby galaxies. The spatial resolutions mostly range from to pc, with only two galaxies observed with a spatial resolution comparable to that of our study, but Rosolowsky et al. (2021) report slopes similar to that of the MWd clouds. The GMC velocity dispersions are however observed to be higher at a given cloud size in the central regions than in the outer regions, potentially also resulting in a steeper slope.
4.1.1 Size – linewidth relation in galaxy centres
We now investigate whether the steep size – linewidth relation of the NGC 613 clouds is primarily due to the fact that the relation has been measured in the central region of the galaxy. For instance, the large velocity dispersions and relatively steep slope of the CMZ clouds are the most distinguishing features of their size – linewidth relation, compared to that of the MWd clouds. Moreover, the clouds in the central regions of both NGC 613 and NGC 5806 have steep size – linewidth relations. On the other hand, the clouds in the centres of other galaxies have size – linewidth relations much shallower than (or comparable to) that of the MWd clouds (e.g. no correlation in NGC 6946, Wu et al. 2017; slope of in NGC 5064, Liu et al. submitted; no correlation in NGC 4526, Utomo et al. 2015; slope of in NGC 1387, Liang et al. in prep.). Although the clouds in the centre of M 83 have higher velocity dispersions than those of the MWd clouds and have a steep size – linewidth relation, the correlation is very weak. And while the clumps in the central region of the dwarf lenticular galaxy NGC 404 also have a steep size – linewidth relation (Liu et al., 2022), the comparison is arguably inappropriate as the clumps are much smaller ( pc) than the clouds considered in other studies. Therefore, while the centres of galaxies may partially contribute to steep size – linewidth relations, they are not likely to be the primary driver of them.
4.1.2 Large-scale bars and nuclear rings
Although the GMCs of barred-spiral galaxies have been investigated previously (e.g. M 83 and NGC 1300; Hirota et al. 2018; Maeda et al. 2020), only the GMCs in the central region of NGC 5806 display a very steep size – linewidth relation, with a slope of (purple dotted line in Figure 6). However, among these three galaxies, only the observations of NGC 5806 have a spatial resolution sufficient to resolve GMCs and cover the whole central region. Thus, in Choi et al. (2023), we first suggested that bar-driven gas shocks and inflows toward the nuclear ring, which can potentially cause additional turbulence within the clouds, may be the main reasons for the steep size – linewidth relation of NGC 5806. Intriguingly, in this work, we find another example of a steep size – linewidth relation in and around the nuclear ring of a barred spiral galaxy (NGC 613). We thus discuss briefly below whether bar-driven inflows can contribute to the enhanced cloud linewidths and a steep cloud size – linewidth relation in the nuclear ring of NGC 613.
Adopting the gas inflow velocities ( km s-1 and km s-1) inferred by Sato et al. (2021), the total mass inflow rate along each of the two dust lanes can be estimated as
| (6) |
where M⊙ pc-2 and pc are our measured mean molecular gas mass surface density and width of the gas inflow in both dust lanes, respectively. To examine whether these bar-driven gas inflows carry enough energy to drive turbulence in the nuclear ring, we estimate the total kinetic energy per unit time transported by these gas inflows to the nuclear ring:
| (7) |
We note that this is an upper limit, as it assumes that the kinetic energy transported by the inflows is entirely converted into turbulent energy in the nuclear ring.
To verify whether these bar-driven gas inflows are sufficient to maintain the turbulence in the nuclear ring, we also calculate the turbulent energy dissipation rate , defined as
| (8) |
(e.g. Mac Low & Klessen, 2004), where M⊙, km s-1 and pc are the total mass, mean velocity dispersion and scale height of the molecular gas in the nuclear ring, respectively. This scale height was estimated as (Lin & Pringle, 1987), where is the epicyclic frequency at the nuclear ring radius, that can be calculated as , where , is the circular velocity of NGC 613 and is the radius (at the centre) of the nuclear ring ( pc). We took from Audibert et al. (2019), who derived a rotation curve from 12CO(3-2) line observations of NGC 613 assuming the gas is on circular orbits, leading to km s-1 pc-1 and in turn pc.
If the kinetic energy input rate is balanced by the turbulent energy dissipation rate (i.e. ), the turbulence in the nuclear ring can be sustained by the gas inflows. Although Equation 7 and Equation 8 contain large uncertainties, the estimated input rate is approximately half of the estimated dissipation rate. This estimation suggests that, while bar-driven molecular gas inflows may be a major contributor to the high velocity dispersions and the steep size – linewidth relation observed, they are not sufficient to fully explain them.
By comparing the dissipation timescale and the cloud travel time, we can also constrain the necessity of additional turbulence sources. If the dissipation timescale is significantly shorter than the cloud travel time, this suggests that the turbulence of clouds is not maintained during travel from one node to the other and thus clouds are not sustained. The turbulence dissipation timescale of a GMC can be estimated as (McKee & Ostriker, 2007), yielding a range of – Myr and a mean of Myr for the nuclear ring clouds of NGC 613. Taking into account the rotation of the large-scale bar, the cloud travel time between the two nodes can be estimated as
| (9) |
(Koda, 2021), where is the circular velocity at the radius of the nuclear ring ( km s-1) and is the pattern speed of the large-scale bar. The bar pattern speed of NGC 613 has never been measured, and it is not possible to estimate it from the current observations as they cover only the central region of the galaxy. We can obtain a firm lower limit to the travel time by adopting in Equation 9 (yielding Myr), but instead we derive the bar pattern speed by assuming that NGC 613 has a flat rotation curve in the outer parts of the disc (i.e. around corotation) and by adopting the dimensionless bar rotation rate and projected bar radius measured by Seigar et al. (2018): (where is the bar corotation radius and the deprojected bar half-length) and . This leads to a bar pattern speed km s-1 kpc-1. In turn, using Equation 9, this leads to a travel time Myr, so that the average turbulent dissipation timescale is roughly half the travel time between the two nodes and the turbulent dissipation timescales of most nuclear ring clouds () are shorter than Myr. This implies that the turbulence of the clouds would be dissipated before they travel from one node to the other, and therefore that turbulence must be continuously supplied to the nuclear ring clouds (from additional sources) to maintain the high cloud velocity dispersions.
4.1.3 Other mechanisms inducing the high velocity dispersions of the clouds
As discussed in the previous section, in addition to the impact of the bar and the nuclear ring, other mechanisms are needed to explain the excess cloud turbulence in the central region of NGC 613.
AGN Feedback. NGC 613 is known to host an AGN with radio jets (e.g. Veron-Cetty & Veron, 1986; Hummel et al., 1987; Miyamoto et al., 2017), and AGN feedback is a mechanism known to commonly create high velocity dispersions in molecular gas (e.g. Schawinski et al., 2009; Simionescu et al., 2018; Nesvadba et al., 2021; Ruffa et al., 2022). Several simulations have also suggested that AGN feedback can severely affect molecular gas near galaxy centres (e.g. Wada et al., 2009; Mukherjee et al., 2018), and have shown that the AGN impact is limited to several hundred parsecs in radius within the galactic discs (but extends beyond kpc perpendicularly to the discs). In the case of NGC 613, the high Fe ii to Br line flux ratio suggests that there is an interaction between the radio jets and the nuclear ring (Falcón-Barroso et al., 2014), but this appears limited to only a small region of the nuclear ring (see the blue stars in the continuum map of Figure 1). In addition, shocks due to the interaction of the radio jets with the surrounding medium appear to influence only the circumnuclear disc (i.e. the nucleus according to our region definition; Miyamoto et al. 2017). Miyamoto et al. (2017) also reported that there are only two small regions where the shock tracer SiO(2-1) is detected near the nuclear ring, as shown in Figure 1. Therefore, the impact of the AGN feedback on the molecular gas in the nuclear ring and its vicinity appears limited to small regions and thus only a portion of the NGC 613 clouds.
Stellar Feedback. Early stellar feedback can contribute to cloud turbulence in the forms of stellar winds and the expansion of H ii regions (e.g. Mac Low & Klessen, 2004). Mazzuca et al. (2008) measured a star-formation rate of M⊙ yr-1 using the H emission from the nuclear ring (within a radius of pc) of NGC 613. This ring was also observed in the Br line using the Very Large Telescope SINFONI integral-field spectrograph, revealing sequential star-forming clumps with an age gradient along the nuclear ring (Böker et al., 2008; Falcón-Barroso et al., 2014). As Br is predominantly produced by the dense H ii regions surrounding young OB stars (Ho et al., 1990) and can be used to trace recent star formation (Pasha et al., 2020), early stellar feedback is likely to affect the molecular gas of the nuclear ring and thus drive the cloud turbulence, suggesting that it can contribute to the high cloud velocity dispersions. Once a massive star dies, it explodes and thus injects significant energy into its surroundings, so-called supernova (SN) feedback. SN feedback is well known as one of the major energy sources regulating the evolution of the interstellar medium (Mac Low & Klessen, 2004). It has in fact been suggested that SN feedback is the dominant mechanism driving the turbulence of molecular gas (e.g. Padoan et al., 2016). Using near-infrared line diagnostic diagrams (Colina et al., 2015), Audibert et al. (2019) showed that the nuclear ring of NGC 613 has characteristics of young stars and/or aged ( – Myr) star-forming clumps dominated by SN. SN can thus also contribute to the high cloud velocity dispersions present in the nuclear ring of NGC 613.
Accretion-driven turbulence. Goldbaum et al. (2011) suggested that gas accretion, i.e. the flow of surrounding cold gas onto a molecular cloud, and star formation feedback (in the form of H ii region expansion) contribute roughly equally to the turbulent kinetic energy over the lifetime of a cloud. However, in high gas mass surface density environments, gas accretion dominates the cloud energy budget (over star-formation feedback). As the centre of NGC 613 has high molecular gas mass surface densities, and there are gas inflows toward the nuclear ring via the large-scale bar, accretion-driven turbulence is likely to contribute to the high velocity dispersions of the clouds. Indeed, the molecular gas mass and surface density of the clouds in the nuclear ring are higher than those of the clouds in the dust lanes, implying there is gas accretion that can induce cloud turbulence in the nuclear ring. We note that accretion-driven turbulence is distinct from turbulence driven by bar-driven gas inflows in terms of both physical scale and location. The former occurs at the cloud scale and can take place at any position in and around the nuclear ring, while the latter indicates an energy transfer from large-scale gas inflows to the nuclear ring molecular gas and can only occur near the nodes.
Cloud-cloud collisions. Cloud-cloud collisions have been proposed as another mechanism that can limit cloud lifetimes and act as a source of turbulence within clouds (e.g. Tan, 2000; Li et al., 2018; Wu et al., 2018). For instance, using simulations Wu et al. (2018) suggested that GMC collisions can create and maintain large turbulence within dense gas structures. To assess whether cloud-cloud collisions are important in the nuclear ring of NGC 613, we calculate the cloud-cloud collision timescale. This can be estimated as (Koda et al., 2006), where is the cloud number surface density, is the mean cloud diameter ( pc; see Table 3) and is the cloud-cloud velocity dispersion, generally assumed to be km s-1 (e.g. Koda et al., 2006; Inutsuka et al., 2015). To calculate , we consider the nuclear ring clouds within an elliptical annulus of inner semi-major axis length pc, outer semi-major axis length pc and ellipticity , yielding kpc-2. Overall, this yields Myr, more than half of the cloud travel time between the nodes (ratio of ). However, Li et al. (2018) suggested that cloud-cloud collisions play an important role in driving cloud turbulence only when collisions are more frequent (collision to orbital timescale ratio ranging from to ). Thus, while cloud-cloud collision can contribute to cloud turbulence, they are not likely to be a significant source of turbulence in the nuclear ring of NGC 613. We note that the collision timescale at the nodes should be shorter than the estimated collision timescale above since the cloud number density is higher at the nodes than at the arcs. Thus, cloud-cloud collisions could be more important at the nodes than the arcs.
In summary, no potential source of turbulence appears to be dominant over the others in the nuclear ring of NGC 613. Among them, stellar feedback, gas accretion and cloud-cloud collisions are all plausible sources for the elevated velocity dispersions of the clouds and the steep size – linewidth relation. We note that all the mechanisms suggested above can also destroy clouds depending on their strengths. Thus, a more quantitative investigation of stellar feedback and accretion-driven turbulence is required to better understand their impact on the turbulence of the clouds in NGC 613.
4.1.4 Possible mechanisms for a steep size – linewidth relation
Although we suggested several mechanisms that can enhance the linewidth of the clouds in and around the nuclear ring of NGC 613, it is still unclear why those clouds show a steep size – linewidth relation. To show a steep size – linewidth, one of two things (or both) must happen. Either smaller clouds have lower turbulence or larger clouds are selectively injected with more turbulence.
Firstly, the interstellar medium is highly compressible, indicating that turbulent energy may not fully cascade down to small scales, but rather be spent on shocks and/or gas compression (e.g. Mac Low & Klessen, 2004). As a consequence, smaller clouds can exhibit considerably lower turbulence than larger ones, resulting in a steep size-linewidth relation. However, various numerical simulations have shown that the slope of the size-linewidth relation for strongly compressible flows typically ranges from to (e.g. Padoan et al. 2006, 2007, Schmidt et al. 2009, McKee & Ostriker 2007 and references therein) and rarely exceeds this range. In addition, Cen (2021) recently suggested a new size – linewidth relation with a slope of from a theoretical approach, which is still not sufficiently high to explain our findings. Kauffmann et al. (2017) also attempted to suggest plausible explanations for an unusually steep size-linewidth relation of CMZ clouds. They suggested that the prevalence of shocks, possibly resulting from cloud-cloud collisions and evidenced by SiO emission, could contribute to elevated velocity dispersions. They also proposed stellar feedback and intermittent activity from Sgr A∗ as potential additional mechanisms contributing to elevated linewidths and a steep size-linewidth relation. Nevertheless, the absence of a dominant mechanism and the lack of theoretical arguments explaining the steep size-linewidth remain unaddressed. Therefore, whether the turbulent energy of molecular gas in and around the nuclear ring cascades down to small scales less efficiently (and the mechanisms that cause this) remains to be clarified.
Another way to create a steep size – linewidth relation is to inject more turbulence into the larger clouds. All the mechanisms suggested above can increase the velocity dispersions of clouds of all sizes, but each mechanism may have a characteristic injection scale, that can in turn lead to a steep size – linewidth relation. This is thus another aspect that requires further study.
4.2 Cloud virialisation
We assess the dynamical state of a cloud using the virial parameter
| (10) |
Here, and are the kinetic and gravitational potential energies, respectively, and is a geometrical factor that depends on the internal structure of a cloud, for which we adopt assuming the clouds are homogeneous and spherical. Note that we have customarily defined the virial mass in the last equality of Equation 10. The virial theorem states that a turbulent pressure-dominated cloud would collapse if (or equivalently, ) while it must be either confined by external pressure and/or magnetic fields or disperse when .
The top panel of Figure 7 shows the virial masses of the resolved clouds of NGC 613 (calculated using the observed velocity dispersion ; see Equation 10) as a function of their gas masses, overlaid with the best-fitting power law (black solid line). The black dashed and black dotted lines indicate and , respectively. The best-fitting power law is
| (11) |
implying that the resolved clouds of NGC 613 are virialised on average.
To investigate the virialisation of the resolved clouds of NGC 613 further, we analyse the distributions of for all the GMCs of NGC 613 and those in each region individually, as shown in the middle panel of Figure 7. The mean (median) of is (), indicating that on average the clouds are marginally bound (black solid line). However, has a broad distribution and about of the clouds () lie between and . About of the clouds () have , while about of the clouds () have . Among the four regions, clouds in the arcs tend to have smaller virial parameters (mean of ) than those of the other three regions (mean of to ). This indicates that the clouds in the arcs are more strongly gravitationally bound than those in the other three regions. However, we note that the virial parameters scale inversely with the CO-to-molecule conversion factor . For instance, Sato et al. (2021) used cm-2(K km s-1)-1 and a different cloud finding algorithm (Dendrogram; Rosolowsky et al. 2008) for NGC 613, yielding a mean cloud virial parameter of , approximately larger than ours. It is worth noting that our analysis is more elaborate than theirs, possibly also contributing to the observed differences. Nevertheless, similar to our results, they also reported that the clouds in the arcs tend to have virial parameters lower than those in the dust lanes. Interestingly, low conversion factors have been reported in galaxy centres (e.g. Sandstrom et al., 2013), and Teng et al. (2022, 2023) reported that the conversion factors of barred galaxy centres are – times lower than that of the MWd. These results imply that the virial parameters of the clouds of NGC 613 could be at least four times larger than currently calculated, which would in turn imply that the clouds are not gravitationally bound but either confined by external forces or short-lived.
The bottom panel of Figure 7 shows the correlation between molecular gas mass surface density () and for all the resolved clouds of NGC 613, providing another perspective to assess the dynamical states of the clouds (Field et al., 2011). Regardless of how well clouds obey the size – linewidth relation, if the clouds are virialised they should be clustered around , indicated by the black dashed () and black dotted () diagonal lines. If the clouds are not virialised () but are nevertheless long-lived, external pressure () should be important to confine them (otherwise the clouds are likely transient structures). In this case, the clouds will be distributed around the black solid V-shape curves in the bottom panel of Figure 7:
| (12) |
(Field et al., 2011).
The molecular gas mass surface densities of the resolved clouds of NGC 613 are broadly distributed, varying by orders of magnitude, and are positively correlated with . Given the uncertainties, some clouds with distributed across the V-shaped curves do seem to be bound by high external pressures ( K cm-3, if indeed they are bound). However, the majority of the clouds are located between the and lines, implying that external pressure is unlikely to be important to constrain them. However, we again note that this is impacted by the uncertainties of the CO-to-molecule conversion factor. For example, if we adopt a conversion factor times lower, the cloud molecular gas mass surface densities and virial parameters are in turn times lower. Should that be the case, the clouds of NGC 613 would be unbound (or pressure-bound), similar to the states of the CMZ clouds.
In summary, Figure 6 shows that the size – linewidth relation of the resolved clouds of NGC 613 has a slope that is at least as steep as that of CMZ clouds (or much steeper if we adopt the ODR algorithm). For NGC 613, bar-driven gas inflows alone are not sufficient to explain the increased linewidths of the clouds, and other processes such as stellar feedback, cloud-cloud collisions and/or gas accretion must also contribute. Most of the clouds are marginally gravitationally bound ( with of the MW) and do not seem affected by external pressure (Figure 7).
4.3 Nuclear ring clouds
As discussed in the previous section (Section 4.1), gas inflows driven by the bar are likely to have an impact on the cloud characteristics within the nuclear ring, an effect that has been explored in some previous studies (e.g. Salak et al., 2016; Sato et al., 2021; Choi et al., 2023). Additionally, some galaxies with a nuclear ring show an azimuthal stellar age gradient within it (Mazzuca et al., 2008). Therefore, it is important to investigate whether the nodes have any influence on the cloud properties and whether the cloud properties change with azimuthal angle along the nuclear ring of NGC 613. Figure 8 presents the number of clouds and other cloud properties as a function of azimuthal angle (measured counterclockwise from the western node): virial parameter, gas mass, velocity dispersion, size and gas mass surface density. Interestingly, the number of clouds decreases from one node to the other (see panel (a) of Figure 8), yet other cloud properties show no discernible trend and exhibit large scatters as a function of azimuthal angle (see panels (b) – (f) of Figure 8).
In our previous work, we reported an analogous trend in NGC 5806 (see Figure 12 of Choi et al. 2023), i.e. the number of clouds decreases gradually from one node to the other but none of the cloud properties varies significantly along the nuclear ring. We speculated that these trends are due to the gas inflows along the large-scale bar inducing violent collisions at the nodes, leading to the formation of many clouds, which are then gradually destroyed while moving along the nuclear ring. We also suggested that cloud-cloud collisions, shear and stellar feedback are plausible mechanisms for the changes of cloud number and properties along the nuclear ring, as their timescales appear to be shorter than the estimated cloud lifetimes in NGC 5806. It is therefore interesting to verify whether the same reasoning applies to NGC 613.
To compare the different mechanisms, we first calculate the characteristic cloud lifetime, adopting the same method used in our previous work (Choi et al., 2023). The azimuthal variation of the number of clouds depends on the characteristic cloud lifetime, that can be estimated as
| (13) |
where is the fraction of clouds lost (i.e. the decline of the number of clouds) as they move between the two nodes. This argument is similar to that introduced by Meidt et al. (2015) to estimate the cloud lifetimes in the inter-arm region of a spiral galaxy. They suggested that the number changes as the cloud travels and evolves from one region to another, and that the cloud lifetime can be inferred from this. This formalism relies on a number of assumptions: 1) cloud formation is negligible between the two zones and 2) clouds follow circular paths. In the case of NGC 613, we assume that most cloud formation occurs near the nodes. There are non-circular motions, but they are neither significant nor relevant in the nuclear ring. The fraction of clouds lost between the two nodes is
| (14) |
where and are the number of clouds in two adjacent zones that span equal ranges of azimuth (see panel (a) of Figure 8). We count the numbers of clouds in the first half of the nuclear ring (from the western node to the eastern node), yielding and (and thus ), while in the second half (from the eastern node to the western node) this yields and (and thus ).
Combined with our estimated travel time, these two fractions of lost clouds yield two characteristic cloud lifetime estimates, that we take as a range, – Myr. This cloud lifetime is larger than that of the clouds in the CMZ ( – Myr; e.g. Kruijssen et al. 2015; Jeffreson et al. 2018), but is smaller than that of the clouds in the LMC ( Myr; Ward et al. 2022), the central kpc radius of M 51 ( – Myr; Meidt et al. 2015), nearby galaxies ( – Myr; Jeffreson & Kruijssen 2018; Chevance et al. 2020; Kim et al. 2022), between spiral arms of disc galaxies ( Myr; e.g. Koda et al. 2009) and NGC 5806 ( Myr; Choi et al. 2023).
Prior to making a comparison of the estimated cloud lifetime with other timescales, we calculate the shear timescale, which can also regulate cloud’s lifetimes, especially in galaxy centres where strong shear can lead to cloud disruption and/or mass loss (e.g. Meidt et al., 2015; Jeffreson & Kruijssen, 2018). We estimate the shear timescale as (Liu et al., 2021), where km s-1 pc-1 is Oort’s constant evaluated at the nuclear ring using the aforementioned rotation curve, yielding Myr.
Consequently, these other timescales ( Myr and Myr) tend to be shorter than the characteristic cloud lifetime ( – Myr), indicating that they could also play a role and affect the number of clouds and other cloud properties along the nuclear ring, in addition to the stellar feedback discussed previously. It is, therefore, still unclear which mechanism primarily regulates the cloud lifetimes and causes the number of clouds to decrease with azimuth while other cloud properties remain roughly constant. Quantifying the impact of each of these mechanisms on the nuclear ring clouds will be important in the future.
5 Summary
We presented high-resolution ( pc2) 12CO(1-0) ALMA observations of the barred spiral galaxy NGC 613. We identified GMCs, of which are spatially and spectrally resolved, with a modified version of cpropstoo. We investigated the cloud properties and scaling relations and explored potential explanations for our findings. Our results can be summarised as follows:
-
1.
The GMCs of NGC 613 have sizes ( – pc) that are comparable to, but molecular gas masses ( – M⊙), velocity dispersions ( – km s-1) and molecular gas mass surface densities ( – M⊙ pc-2) that are larger than those of the Milky Way disc and Local Group galaxy GMCs (Figure 3).
-
2.
The GMCs sizes are similar across the different regions of the galaxy (nucleus, arcs, nodes and dust lanes), but the GMCs in the dust lanes have molecular gas masses, velocity dispersions and gas mass surface densities smaller than those of the GMCs in the other regions. The GMCs in the arcs tend to have gas masses and gas mass surface densities larger than those of the GMCs in the other regions.
-
3.
The GMCs of NGC 613 have a steep size – linewidth relation (; Figure 6).
-
4.
The kinetic energy injection rate from the gas inflows driven by the large-scale bar is smaller than the turbulent energy dissipation rate, and the turbulence dissipation timescale is shorter than the cloud travel time, suggesting that additional sources of turbulence are required beside the gas inflows.
-
5.
AGN feedback has a limited impact on the cloud turbulence, while stellar feedback, gas accretion and cloud-cloud collisions are plausible turbulence sources. Gas inflows into the nuclear ring from the dust lanes remain one of the likely explanations for the clouds’ high velocity dispersions. However, quantitative analyses to assess the relative importance of the different mechanisms are required.
-
6.
The GMCs of NGC 613 are marginally gravitationally bound ( with of the MW), and the GMCs in the arcs tend to have smaller virial parameters than the GMCs in the other regions.
-
7.
The number of clouds decreases azimuthally downstream from the nodes within the nuclear ring (Section 4.3). By tracking cloud disruption through GMC number statistics, we estimate the characteristic cloud lifetime to be between and Myr. This tends to be larger than the estimated timescales of cloud-cloud collisions, shear and/or stellar feedback ( Myr), suggesting that any of those could also contribute to the destruction of the clouds within the nuclear ring.
As seen in this work, GMCs in nuclear rings clearly show distinct size-linewidth relations compared to those in other local environments when inspected in a similar manner. However, GMC properties and in particular the slopes of scaling relations can change depending on how individual clouds are defined (e.g. Pan et al., 2015; Dobbs et al., 2019). Therefore, in a follow-up study, we will compare different cloud-finding algorithms to further validate our results (Choi et al. in prep.). Lastly, it is worth mentioning that we are currently analysing high spatial resolution numerical simulations of a galactic nuclear ring to gain physical insights into the high velocity dispersions of the GMCs, while also collecting more GMC observations of comparable quality for similar objects.
Acknowledgements
We thank the anonymous referee for helpful and constructive comments and Dr. Chang-Goo Kim for useful discussions and comments. WC and AC acknowledge support by the National Research Foundation of Korea (NRF), grant Nos. 2022R1A2C100298212, and 2022R1A6A1A03053472. This work was also supported by National R&D Program through the National Research Foundation of Korea (NRF) funded by the Korea government (Ministry of Science and ICT) (RS-2022-00197685). LL was supported by a Hintze Fellowship, funded by the Hintze Family Charitable Foundation, and by a DAWN Fellowship, funded by the Danish National Research Foundation under grant No. 140. MB was supported by UK Science and Technology Facilities Council (STFC) consolidated grant “Astrophysics at Oxford” ST/K00106X/1 and ST/W000903/1. TAD and IR acknowledges support from the STFC grants ST/S00033X/1 and ST/W000830/1. JG gratefully acknowledges financial support from the Swiss National Science Foundation (grant No. CRSII5 193826). This paper makes use of the following ALMA data: ADS/JAO.ALMA#2017.1.01671.S. ALMA is a partnership of ESO (representing its member states), NSF (USA) and NINS (Japan), together with NRC (Canada), NSC and ASIAA (Taiwan) and KASI (Republic of Korea), in cooperation with the Republic of Chile. The Joint ALMA Observatory is operated by ESO, AUI/NRAO and NAOJ. This research has made use of the NASA/IPAC Extragalactic Database (NED), which is operated by the Jet Propulsion Laboratory, California Institute of Technology, under contract with the National Aeronautics and Space Administration.
Data availability
The data underlying this article are available in the ALMA archive (https://almascience.eso.org/asax/) under project code 2017.1.01671.S. All higher-level data products will be shared upon reasonable request.
References
- Agüero et al. (2016) Agüero M. P., Díaz R. J., Dottori H., 2016, International Journal of Astronomy and Astrophysics, 6, 219
- Athanassoula (1992) Athanassoula E., 1992, MNRAS, 259, 345
- Audibert et al. (2019) Audibert A., et al., 2019, A&A, 632, A33
- Bewketu Belete et al. (2021) Bewketu Belete A., et al., 2021, A&A, 654, A24
- Böker et al. (2007) Böker T., Falcon-Barroso J., Knapen J. H., Schinnerer E., Allard E., Ryder S., 2007, Stellar Populations as Building Blocks of Galaxies, 241, 497
- Böker et al. (2008) Böker T., Falcón-Barroso J., Schinnerer E., Knapen J. H., Ryder S., 2008, AJ, 135, 479
- Bolatto et al. (2008) Bolatto A. D., Leroy A. K., Rosolowsky E., Walter F., Blitz L., 2008, ApJ, 686, 948
- Cen (2021) Cen R., 2021, ApJ, 906, L4
- Chevance et al. (2020) Chevance M., et al., 2020, MNRAS, 493, 2872
- Choi et al. (2023) Choi W., et al., 2023, MNRAS, 522, 4078
- Colina et al. (2015) Colina L., et al., 2015, A&A, 578, A48
- Colombo et al. (2014) Colombo D., et al., 2014, ApJ, 784, 3
- Combes et al. (2019) Combes F., et al., 2019, A&A, 623, A79
- Cuomo et al. (2019) Cuomo V., Lopez Aguerri J. A., Corsini E. M., Debattista V. P., Méndez-Abreu J., Pizzella A., 2019, A&A, 632, A51
- Dame (2011) Dame T. M., 2011, arXiv e-prints, p. arXiv:1101.1499
- Davies et al. (2017) Davies R. L., et al., 2017, MNRAS, 470, 4974
- Dobbs et al. (2019) Dobbs C. L., Rosolowsky E., Pettitt A. R., Braine J., Corbelli E., Sun J., 2019, MNRAS, 485, 4997
- Donovan Meyer et al. (2012) Donovan Meyer J., et al., 2012, ApJ, 744, 42
- Elmegreen & Scalo (2004) Elmegreen B. G., Scalo J., 2004, ARA&A, 42, 211
- Falcón-Barroso et al. (2008) Falcón-Barroso J., Böker T., Schinnerer E., Knapen J. H., Ryder S., 2008, Formation and Evolution of Galaxy Bulges, 245, 177
- Falcón-Barroso et al. (2014) Falcón-Barroso J., Ramos Almeida C., Böker T., Schinnerer E., Knapen J. H., Lançon A., Ryder S., 2014, MNRAS, 438, 329
- Falgarone et al. (1991) Falgarone E., Phillips T. G., Walker C. K., 1991, ApJ, 378, 186
- Field et al. (2011) Field G. B., Blackman E. G., Keto E. R., 2011, MNRAS, 416, 710
- Fukui et al. (2008) Fukui Y., et al., 2008, ApJS, 178, 56
- García-Burillo et al. (2001) García-Burillo S., Martín-Pintado J., Fuente A., Neri R., 2001, ApJ, 563, L27
- Goldbaum et al. (2011) Goldbaum N. J., Krumholz M. R., Matzner C. D., McKee C. F., 2011, ApJ, 738, 101
- Goulding & Alexander (2009) Goulding A. D., Alexander D. M., 2009, MNRAS, 398, 1165
- Gratier et al. (2012) Gratier P., et al., 2012, A&A, 542, A108
- Henshaw et al. (2023) Henshaw J. D., Barnes A. T., Battersby C., Ginsburg A., Sormani M. C., Walker D. L., 2023, in Inutsuka S., Aikawa Y., Muto T., Tomida K., Tamura M., eds, Astronomical Society of the Pacific Conference Series Vol. 534, Protostars and Planets VII. p. 83 (arXiv:2203.11223), doi:10.48550/arXiv.2203.11223
- Heyer & Brunt (2004) Heyer M. H., Brunt C. M., 2004, ApJ, 615, L45
- Heyer & Dame (2015) Heyer M., Dame T. M., 2015, ARA&A, 53, 583
- Heyer et al. (2009) Heyer M., Krawczyk C., Duval J., Jackson J. M., 2009, ApJ, 699, 1092
- Hirota et al. (2018) Hirota A., et al., 2018, PASJ, 70
- Ho et al. (1990) Ho P. T. P., Beck S. C., Turner J. L., 1990, ApJ, 349, 57
- Hughes et al. (2013) Hughes A., et al., 2013, ApJ, 779, 46
- Hummel & Jorsater (1992) Hummel E., Jorsater S., 1992, A&A, 261, 85
- Hummel et al. (1987) Hummel E., Jorsater S., Lindblad P. O., Sandqvist A., 1987, A&A, 172, 51
- Inutsuka et al. (2015) Inutsuka S., Inoue T., Iwasaki K., Hosokawa T., 2015, A&A, 580, A49
- Jeffreson & Kruijssen (2018) Jeffreson S. M. R., Kruijssen J. M. D., 2018, MNRAS, 476, 3688
- Jeffreson et al. (2018) Jeffreson S. M. R., Kruijssen J. M. D., Krumholz M. R., Longmore S. N., 2018, MNRAS, 478, 3380
- Kauffmann et al. (2017) Kauffmann J., Pillai T., Zhang Q., Menten K. M., Goldsmith P. F., Lu X., Guzmán A. E., 2017, A&A, 603, A89
- Kelly (2007) Kelly B. C., 2007, ApJ, 665, 1489
- Kim et al. (2022) Kim J., et al., 2022, MNRAS, 516, 3006
- Koda (2021) Koda J., 2021, Research Notes of the American Astronomical Society, 5, 222
- Koda et al. (2006) Koda J., Sawada T., Hasegawa T., Scoville N. Z., 2006, ApJ, 638, 191
- Koda et al. (2009) Koda J., et al., 2009, ApJ, 700, L132
- Kolmogorov (1941) Kolmogorov A., 1941, Akademiia Nauk SSSR Doklady, 30, 301
- Kruijssen et al. (2015) Kruijssen J. M. D., Dale J. E., Longmore S. N., 2015, MNRAS, 447, 1059
- Larson (1981) Larson R. B., 1981, MNRAS, 194, 809
- Lequeux (2005) Lequeux J., 2005, The Interstellar Medium, doi:10.1007/b137959.
- Leroy et al. (2015) Leroy A. K., et al., 2015, ApJ, 801, 25
- Li et al. (2018) Li Q., Tan J. C., Christie D., Bisbas T. G., Wu B., 2018, PASJ, 70, S56
- Lin & Pringle (1987) Lin D. N. C., Pringle J. E., 1987, MNRAS, 225, 607
- Liu et al. (2021) Liu L., Bureau M., Blitz L., Davis T. A., Onishi K., Smith M., North E., Iguchi S., 2021, MNRAS, 505, 4048
- Liu et al. (2022) Liu L., et al., 2022, MNRAS, 517, 632
- Liu et al. (2023) Liu L., et al., 2023, MNRAS, submitted
- Mac Low & Klessen (2004) Mac Low M.-M., Klessen R. S., 2004, Reviews of Modern Physics, 76, 125
- Maeda et al. (2020) Maeda F., Ohta K., Fujimoto Y., Habe A., 2020, MNRAS, 493, 5045
- Mazzuca et al. (2008) Mazzuca L. M., Knapen J. H., Veilleux S., Regan M. W., 2008, ApJS, 174, 337
- McKee & Ostriker (2007) McKee C. F., Ostriker E. C., 2007, ARA&A, 45, 565
- McMullin et al. (2007) McMullin J. P., Waters B., Schiebel D., Young W., Golap K., 2007, in Shaw R. A., Hill F., Bell D. J., eds, Astronomical Society of the Pacific Conference Series Vol. 376, Astronomical Data Analysis Software and Systems XVI. p. 127
- Meidt et al. (2015) Meidt S. E., et al., 2015, ApJ, 806, 72
- Miyamoto et al. (2017) Miyamoto Y., Nakai N., Seta M., Salak D., Nagai M., Kaneko H., 2017, PASJ, 69, 83
- Miyamoto et al. (2018) Miyamoto Y., Seta M., Nakai N., Watanabe Y., Salak D., Ishii S., 2018, PASJ, 70, L1
- Mogotsi et al. (2016) Mogotsi K. M., de Blok W. J. G., Caldú-Primo A., Walter F., Ianjamasimanana R., Leroy A. K., 2016, AJ, 151, 15
- Mukherjee et al. (2018) Mukherjee D., Bicknell G. V., Wagner A. Y., Sutherland R. S., Silk J., 2018, MNRAS, 479, 5544
- Muller et al. (2010) Muller E., et al., 2010, ApJ, 712, 1248
- Nesvadba et al. (2021) Nesvadba N. P. H., et al., 2021, A&A, 654, A8
- Oka et al. (1998) Oka T., Hasegawa T., Hayashi M., Handa T., Sakamoto S., 1998, ApJ, 493, 730
- Oka et al. (2001) Oka T., Hasegawa T., Sato F., Tsuboi M., Miyazaki A., Sugimoto M., 2001, ApJ, 562, 348
- Padoan et al. (2006) Padoan P., Juvela M., Kritsuk A., Norman M. L., 2006, ApJ, 653, L125
- Padoan et al. (2007) Padoan P., Nordlund Å., Kritsuk A. G., Norman M. L., Li P. S., 2007, ApJ, 661, 972
- Padoan et al. (2016) Padoan P., Pan L., Haugbølle T., Nordlund Å., 2016, ApJ, 822, 11
- Pan et al. (2015) Pan H.-A., Fujimoto Y., Tasker E. J., Rosolowsky E., Colombo D., Benincasa S. M., Wadsley J., 2015, MNRAS, 453, 3082
- Pasha et al. (2020) Pasha I., Leja J., van Dokkum P. G., Conroy C., Johnson B. D., 2020, ApJ, 898, 165
- Rice et al. (2016) Rice T. S., Goodman A. A., Bergin E. A., Beaumont C., Dame T. M., 2016, ApJ, 822, 52
- Rosolowsky (2007) Rosolowsky E., 2007, ApJ, 654, 240
- Rosolowsky & Leroy (2006) Rosolowsky E., Leroy A., 2006, PASP, 118, 590
- Rosolowsky et al. (2003) Rosolowsky E., Engargiola G., Plambeck R., Blitz L., 2003, ApJ, 599, 258
- Rosolowsky et al. (2007) Rosolowsky E., Keto E., Matsushita S., Willner S. P., 2007, ApJ, 661, 830
- Rosolowsky et al. (2008) Rosolowsky E. W., Pineda J. E., Kauffmann J., Goodman A. A., 2008, ApJ, 679, 1338
- Rosolowsky et al. (2021) Rosolowsky E., et al., 2021, MNRAS, 502, 1218
- Ruffa et al. (2022) Ruffa I., Prandoni I., Davis T. A., Laing R. A., Paladino R., Casasola V., Parma P., Bureau M., 2022, MNRAS, 510, 4485
- Sakamoto et al. (1999) Sakamoto K., Okumura S. K., Ishizuki S., Scoville N. Z., 1999, ApJ, 525, 691
- Salak et al. (2016) Salak D., Nakai N., Hatakeyama T., Miyamoto Y., 2016, ApJ, 823, 68
- Sandstrom et al. (2013) Sandstrom K. M., et al., 2013, ApJ, 777, 5
- Sato et al. (2021) Sato K., Miyamoto Y., Kuno N., Salak D., Wagner A. Y., Seta M., Nakai N., 2021, PASJ, 73, 1019
- Schawinski et al. (2009) Schawinski K., et al., 2009, ApJ, 690, 1672
- Schmidt et al. (2009) Schmidt W., Federrath C., Hupp M., Kern S., Niemeyer J. C., 2009, A&A, 494, 127
- Seigar et al. (2018) Seigar M. S., Harrington A., Treuthardt P., 2018, MNRAS, 481, 5394
- Simionescu et al. (2018) Simionescu A., Tremblay G., Werner N., Canning R. E. A., Allen S. W., Oonk J. B. R., 2018, MNRAS, 475, 3004
- Solomon et al. (1987) Solomon P. M., Rivolo A. R., Barrett J., Yahil A., 1987, ApJ, 319, 730
- Sormani & Barnes (2019) Sormani M. C., Barnes A. T., 2019, MNRAS, 484, 1213
- Sormani et al. (2015) Sormani M. C., Binney J., Magorrian J., 2015, MNRAS, 449, 2421
- Sormani et al. (2023) Sormani M. C., et al., 2023, MNRAS, 523, 2918
- Sun et al. (2018) Sun J., et al., 2018, ApJ, 860, 172
- Sun et al. (2020) Sun J., et al., 2020, ApJ, 901, L8
- Sun et al. (2022) Sun J., et al., 2022, AJ, 164, 43
- Tan (2000) Tan J. C., 2000, ApJ, 536, 173
- Teng et al. (2022) Teng Y.-H., et al., 2022, ApJ, 925, 72
- Teng et al. (2023) Teng Y.-H., et al., 2023, ApJ, 950, 119
- Tully (1988) Tully R. B., 1988, Nearby galaxies catalog
- Utomo et al. (2015) Utomo D., Blitz L., Davis T., Rosolowsky E., Bureau M., Cappellari M., Sarzi M., 2015, ApJ, 803, 16
- Veron-Cetty & Veron (1986) Veron-Cetty M. P., Veron P., 1986, A&AS, 66, 335
- Wada et al. (2009) Wada K., Papadopoulos P. P., Spaans M., 2009, ApJ, 702, 63
- Ward et al. (2022) Ward J. L., Kruijssen J. M. D., Chevance M., Kim J., Longmore S. N., 2022, MNRAS, 516, 4025
- Wilson et al. (2011) Wilson C. D., et al., 2011, MNRAS, 410, 1409
- Wong et al. (2011) Wong T., et al., 2011, ApJS, 197, 16
- Wu et al. (2017) Wu Y.-L., Sakamoto K., Pan H.-A., 2017, ApJ, 839, 6
- Wu et al. (2018) Wu B., Tan J. C., Nakamura F., Christie D., Li Q., 2018, PASJ, 70, S57
- da Silva et al. (2020) da Silva P., Menezes R. B., Steiner J. E., Fraga L., 2020, MNRAS, 496, 943
- de Vaucouleurs & Freeman (1972) de Vaucouleurs G., Freeman K. C., 1972, Vistas in Astronomy, 14, 163
- de Vaucouleurs et al. (1991) de Vaucouleurs G., de Vaucouleurs A., Corwin Herold G. J., Buta R. J., Paturel G., Fouque P., 1991, Third Reference Catalogue of Bright Galaxies
- van der Marel (2001) van der Marel R. P., 2001, AJ, 122, 1827