0\jourissue0\jourpubyear2024
Implications of in-ice volume scattering for radio-frequency neutrino experiments
Abstract
Over the last three decades, several experimental initiatives have been launched with the goal of observing radio-frequency signals produced by ultra-high energy neutrinos (UHEN) interacting in solid media. Observed neutrino event signatures comprise impulsive signals with duration of order the inverse of the antenna+system bandwidth, superimposed upon an incoherent (typically white noise) thermal noise spectrum. Although bulk volume scattering (VS) of external radio-frequency signals is well-studied within the radar and glaciological communities, and can, in principle, contribute to that background. However, thus far, neutrino experiments have neglected to account for VS when projecting event rates. Herein, we present both model-dependent and model-independent constraints on both coherent, and also incoherent volume scattering, and assess their impact on UHEN experiments. We find that VS contributions are only weakly constrained by extant data; stronger limits may be obtained with dedicated calibration experiments.
1 . Introduction
Within the last decade, high energy neutrino astronomy has evolved from high-statistics measurements of atmospheric neutrinos to more recent measurements of the extraterrestrial neutrino flux at TeV to PeV energies(3; 30; 19; 18; 17; 2). Ultra high energy neutrinos (UHEN), beyond the Glashow resonance at 6.2 PeV, have to low a flux to be detected by optical techniques. Such neutrinos can arise from decay of charged pions photo-produced by collisions of ultra-high energy cosmic rays with the cosmic microwave background. They are therefore an unavoidable consequence of both hadronic interactions near the production point, as well as electromagnetic interactions during propagation, of the ultra-high energy cosmic rays that have been observed by Auger and the Telescope Array(23; 35). Such neutrinos are also expected as the complement to high-energy cosmic gamma rays produced by neutral pion decay(16).
Many UHEN experiments(34; 27; 13; 6; 39; 26) have coalesced around the prospect of measuring signals produced by neutrinos interacting in cold polar ice, primarily owing to the excellent transparency of ice to propagating electromagnetic radiation, particularly at radio-frequency wavelengths ((1 km)(12; 5). Two polar detection strategies have shown considerable promise - measurement of the Askaryan radiation (generated either in-ice or as the result of the hadronic decay of a in-air) produced by the electron/positron charge imbalance in a shower following a charged- or neutral-current neutrino-ice interaction(34; 27; 13; 6; 26; 46), or measurement of the radar echo produced by the (approximately stationary) ionization trail associated with the shower(39).
Projected experimental detection rates are estimated by comparing the calculated signal amplitudes against the irreducible noise background (typically, black-body noise from the environment) to which a typical experiment is subject. Since the neutrino flux is a rapidly falling power-law function of energy, suppressing the thermal noise background (e.g., by minimizing the noise figure of front-end low-noise amplifiers), or, alternatively, reducing the event trigger threshold relative to thermal noise (e.g., by machine learning or phased array triggering techniques(11; 9)) can have dramatic impact on estimated event detection rates – a reduction in the effective signal-to-noise ratio threshold by a factor of two corresponds to approximately an order-of-magnitude increase in the detected event rate.
Detection of muon neutrinos in optical experiments is based on the arrival time of the first Cherenkov photon measured in a photomultiplier tube (PMT). For the optical detection experiments, both absorption, as well as scattering of Cherenkov photons between production point and the front-end PMT dictate the neutrino detection rates. The timing and number of photons measured in response to a dedicated light source (LED), e.g., can be used to quantify the two effects. At South Pole(1), for example, in-ice scattering lengths vary from 15–60 m, depending on local dust concentrations. The longer absorption lengths (60–200 m) therefore play less of a role in limiting neutrino detection rates. Water-based optical experiments show an opposite pattern, with the loss of photons dominated by scattering rather than absorption(8). Determinations of radio-frequency transparency do not (thus far) distinguish between absorption vs. bulk ice (volume) scattering and only measure the combined effect in quantifying signal loss.
To quantify scattering in the optical experiments, LED flashers are used to determine the time structure of photons which scatter and then are measured by PMTs. We expect the detected photon number to grow with time as the collection volume grows as the cube of distance; eventually, the detected photon number begins to decrease when the photon path length approaches one optical absorption length. For a separation distance d between transmitter and receiver of 75 meters, the total number of scattered photons in IceCube was observed to reach a maximum approximately 75 ns after the arrival of the first photon(4); doubling d approximately doubles the time for the scattered photon distribution to reach maximum. The (approximately Rayleigh) distribution has a long tail, consistent with multiple scattering effects. Similar distributions were measured at Mediterranean water sites being considered for the KM3NET(36).
The Askaryan signal sought for by extant radio experiments has a sharp, impulsive leading edge, characteristic of the traversal of the Cherenkov shock front across the front-end receiver antenna. In contrast to single photons, measured broad-band radio signals are temporally extended by the frequency-dependent group delay and the limited antenna and system frequency bandwidth. Consequently, any scattered radio photons will superpose upon the longer-duration radio signals. In principle, such scattering effects might have been observable in the experimental tests of the Askaryan effect(25; 44), although the 2-3 meter scale of the laboratory targets limited the radio photon collection volume and the target differed in composition and purity from polar ice.
Considerable volume scattering work within the radioglaciological community notwithstanding(37; 32; 15; 45; 31), neutrino signal estimates have generally not addressed background contributions possibly resulting from bulk volume scattering. In the case of the Askaryan experiments, VS of primary radiation emitted by the shower could potentially bathe the signal in an additional background after the initial signal onset. Since Askaryan radiation is collimated into a Cherenkov cone with approximately 1 degree transverse width, antennas off the Cherenkov-angle may also be subject to an overall enhancement in the noise level resulting from the isotropic re-scattering from molecules illuminated at, or near the Cherenkov angle. If VS is large enough, this could result in events with a O(0.01–1 s) duration rise in the broadband background noise. We note that measurements radio attenuation lengths thus far do not distinguish between true signal absorption and scattering. The signal amplitude at a receiver point is compared to a transmitted amplitude, and amplitude losses beyond 1/r attributed entirely to attenuation.
For the radar neutrino experiments, which use a clever carrier-cancellation technique to dynamically suppress self-induced backgrounds at the carrier frequency(40), only incoherent volume scattering might contribute since any CVS should be suppressed by the carrier cancellation; any remaining incoherent component would add power linearly to the thermal background.
2 . Experimental Motivation
Current experimental evidence points out apparent deficiencies in our understanding of radio-wave propagation through ice, which help motivate our current VS study, including:
-
•
Previous publications provided experimental evidence for both fixed-frequency (CW), and also broadband signals propagating between two points that, for a smoothly varying refractive index profile dependence on depth, should be shadowed relative to each other(14; 22). This effect was observed, consistently, in data accumulated within the context of efforts by the RICE (using CW), ARIANNA (using impulsive signals) and RNO-G (using impulsive signals) experimental groups to fully parameterize the in situ radio-frequency ice response. The nominally expected shadowing can be considered as a total cancellation of the Huygens wavelets arriving at a given time, propagating from transmitter (Tx) to receiver (Rx). The observed CW signals were observed to be sinusoids, at the carrier frequency, but with significantly reduced amplitude, compared to expectations for non-shadowed propagation. The weak shadow zone signals observed in the RICE data were accentuated after co-adding waveforms, indicating that the phase was coherently preserved trigger-to-trigger. By contrast, incoherent volume scattering would not produce a sinusoidal signal at the carrier, due to the ‘scrambling’ of the phase and would be expected to yield an enhancement of the incoherent background, outside the time window of the signal, as well as some loss of phase coherence in the time window corresponding to observation of the carrier.
-
•
Additionally, published measurements(10) made using a transmitter pulser broadcasting within an ice borehole to the englacial ARA radio receiver array show apparently anomalous, and not understood large measured HPol (p-polarization) power relative to VPol (s-polarization), for a receiver which is, in principle, entirely VPol. Corrected for antenna gain, in some cases the observed HPol power exceeded that measured in VPol; some of this may be attributed to ice birefringence(29; 20).
These experimental observations indicate that our current understanding of the radio-frequency properties of glacial ice is incomplete, and, in part, prompts our search for evidence of volume scattering.
3 . Previous calculations and modeling
3.1 . The Drude-Lorentz oscillator model
Electromagnetic scattering can broadly be considered as the atomic response, and re-radiation of an incident electric field. Modeling an atomic electron as an oscillator bound to a nucleus, the complex permittivity describing its response to a driving excitation with frequency follows directly from F=ma and can be written as:
with the resonant plasma frequency and describing collisional damping. The (absorptive) imaginary term in this expression introduces a phase shift between the driving term and the (real) scattering response. For a pure medium with no thermal fluctuations, coherent non-dissipative scattering is manifest as the refractive index. In what follows, ‘Volume Scattering’ will refer to the more realistic case of impurities, and/or density fluctuations and/or grain boundaries, etc. If, rather than , the scattered phase assumes some random value, the incoherent volume scattering (IVS) case obtains; this might arise, e.g., if, under the vertical gravitational stress and the lateral ice-flow-induced strain (which leads to birefringent effects) individual ice grains acquire phase shifts which vary from site to site. In what follows, we retain two primary features (polarization and re-radiation beam pattern) of the Drude-Lorentz model, which also forms the basis for the estimated single-electron Thomson free-particle scattering cross-section .
3.2 . Approximate Scale of VS Cross-section
We can make a dimensional estimate for the maximum cross-section by setting the inverse of the measured radio-frequency attenuation length in cold polar ice (800 m)(7; 5) equal to the product of the per-ice-molecule VS scattering cross-section multiplied by the molecular number density N, given by =. Equating 800 m to 1/N therefore gives . We interpret this value as an upper limit which our more sophisticated calculation should observe.
By comparison, we note that the atmospheric (at STP) Rayleigh cross-section of nitrogen is , derived for in-air scattering between sparsely located scattering centers: [, with d the scatterer size (we take 0.3 nm as the size of a water molecule and n=1.78). Extrapolated to long-wavelengths, the quartic dependence on therefore suppresses this cross-section by many orders of magnitude. Qualitatively, in the Rayleigh model, for which incident signal is re-radiated by atomic dipole ‘antennas’, the small value in this case reflects the scale mismatch between the macroscopic incident signal and the microscopic atomic dipole antenna, as noted in other estimates of VS(43). Rayleigh scattering corresponds to an in-air scattered power fraction of 1/100,000 per meter travel at optical frequencies; this value obviously scales with increasing density of the scattering medium.
3.3 . Previous calculations
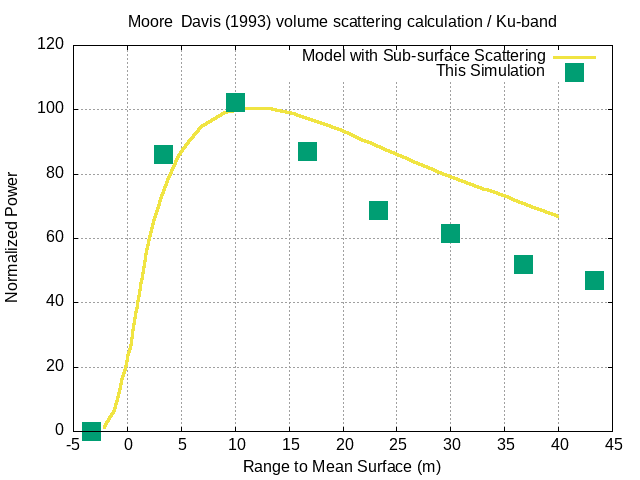
Davis and Moore(21) previously considered the relative contributions of volume to surface scattering, in the context of satellite- or airplane-based radar surveys of the polar ice sheets, at frequencies in the C- and Ku-bands, and spanning the range 4–17 GHz. Their work followed the observation by Ridley and Partington(38; 41) that an exclusively-surface scattering model was inadequate to explain the total reflected power observed in satellite-based radar measurements. They performed an analytic calculation of the volume scattering contribution to the received power measured in the aerial surveys, and concluded that volume scattering dominated the radar returned power in East Antarctica. Figure 1 shows the predictions, comparing exclusively surface scattering (green) vs. a model that also includes volume scattering (purple). We note a suppressed rising edge, but an enhanced falling edge of the power profile with time. Overlaid with the Moore & Davis prediction is the time evolution obtained in our own ‘fast’ simulation (described below).
Yi and Bentley(47) performed a similar analysis and reached a similar conclusion – namely, that volume scattering typically accounts for approximately half of the returned signal power measured in the aerial surveys. However, owing to limited resources, the radar signals were never calibrated against a known reflector (e.g., aluminum sheet), which would have otherwise yielded a surface-only ‘standard’, and allowed an absolute calculation of the sub-surface volume scattering cross-section.
Overall, these two calculations imply VS amplitudes significantly larger than what would be expected by a simple extrapolation of the Rayleigh formula.
Radio-frequency volume scattering in the icy moons of the gas giant planets of the Solar System has recently received renewed attention(42; 43). The ice sheets of Europa, Ganymede, Enceladus, Miranda and Ariel e.g., are interesting not only from a hydrological perspective, but also as possible harbingers of viable life in the liquid oceans under the surface ice sheets. Those ice sheets have also been identified as candidates for measurements of radio emissions from neutrino-induced cascades(28); at the 100 K temperatures typical of those ice sheets, the RF attenuation lengths should exceed 10 km for pure ice, presenting the possibility of measurable echoes from the sub-surface ice/water boundary provided signal attenuation through the ice sheet itself is not prohibitively large. Calculating the thickness of the ice sheets from radar sounding therefore requires estimates of signal losses via VS. A recent calculation of the signal penetration associated with EM emissions from natural auroral activity, expected for the Uranian moons(43) found insignificant volume scattering losses, albeit at comparatively low frequencies (f100–900 kHz), for which the long-wavelength VS suppression would be expected to reduce such contributions to nearly negligible levels.
3.4 . nuradiomc-based Calculation and Modeling
We have used the (24) simulation package to evaluate the expected impact of VS on neutrino waveforms. This Monte Carlo code is currently the most widely used software suite for following a signal ray from an interacting neutrino to an in-ice antenna. For our application, however, for which the VS background must be obtained by propagation of not only one signal ray, but a ray bundle over a volume growing as the cube of distance from the source, the superb fidelity offered by requires considerable CPU resources and limits the parameter space explored.
The molecular radar cross-section is varied in our simulation, resulting in varying amounts of simulated volume scattering. To reduce computational expense, we only track the first scatter and neglect secondary, tertiary, etc, scattering. Additionally, although both a direct (D) and refracted (R) typically connect a given source point to a given receiver, we limit the discussion below to the least-time (D) path, realizing that the volume scattering results presented also apply to any Refracted path, as well.
Additional parameters that must also be specified in the simulation include: i) polarization characteristics of VS (for which we assume that the atomic dipole re-radiates with a standard dipolar beam pattern relative to a given transmitter and retains the incident polarization), ii) coherence (either incoherent [IVS] or coherent [CVS]) of the re-scattered signal, and iii) the angular deviation between the known in-ice Cherenkov angle of the emitted Askaryan radiation and the ‘launch’ angle relative to the axis of the simulated neutrino-induced shower, which is taken from the nuradiomc event generator. The highest signal-to-noise ratio obtains when the in-ice radio receiver is positioned directly at the Cherenkov angle (launch angle= and deviation off-angle =0), therefore, as increases, the relative isotropic volume scattering background should increase. Note that, conversely, if volume scattering is sufficiently large, this presents a possible signal channel, namely a general enhancement in the rms voltage over thermal noise.
For signal of initial amplitude in an infinite, uniform three-dimensional medium and separation distance between transmitter Tx and scatterer S equal to , the amplitude of the signal arriving at time at the scatterer is proportional to . In our nuradiomc simulation, the Askaryan radiation signal, collimated into a Cherenkov cone of transverse width (1 degree) propagates to a distant radio receiver, separated by distances ranging from 50200 m. The volume surrounding the receiver is discretized into a three-dimensional cubical grid having cell volume 3000 cc (limited by CPU execution speed). Each volume element scatters the incident radiation losslessly, retaining the polarization of the incident signal; assuming dipole-like molecular scattering, the spatial distribution of scattered signal follows the standard dipole beam pattern. We consider both Coherent VS (phase of the incident signal retained during scattering) and also Incoherent VS (random phase), then sum all the individual contributions, in appropriate time bins, to obtain the amplitude and time dependence of the scattered signal at the receiver. For each event, we perform a checksum and verify that the sum of the total scattered energy, added to the unscattered energy, matches the total calculated energy emission, in the absence of scattering.
Both CVS and IVS give an expectation value of receiver voltage , while the power delivered to a receiver (); IVS differs from thermal noise in that the source is considered to be a point in our simulation rather than a three-dimensional environmental background source, which results in a characteristic time dependence of the IVS power envelope. Our simulation assumes Tx/Rx are sufficiently deep that the surface ice-air boundary can be neglected. To reduce computing time, the simulation also assumes that any possible inhomogeneities in the ice are much smaller than the characteristic wavelength scale.
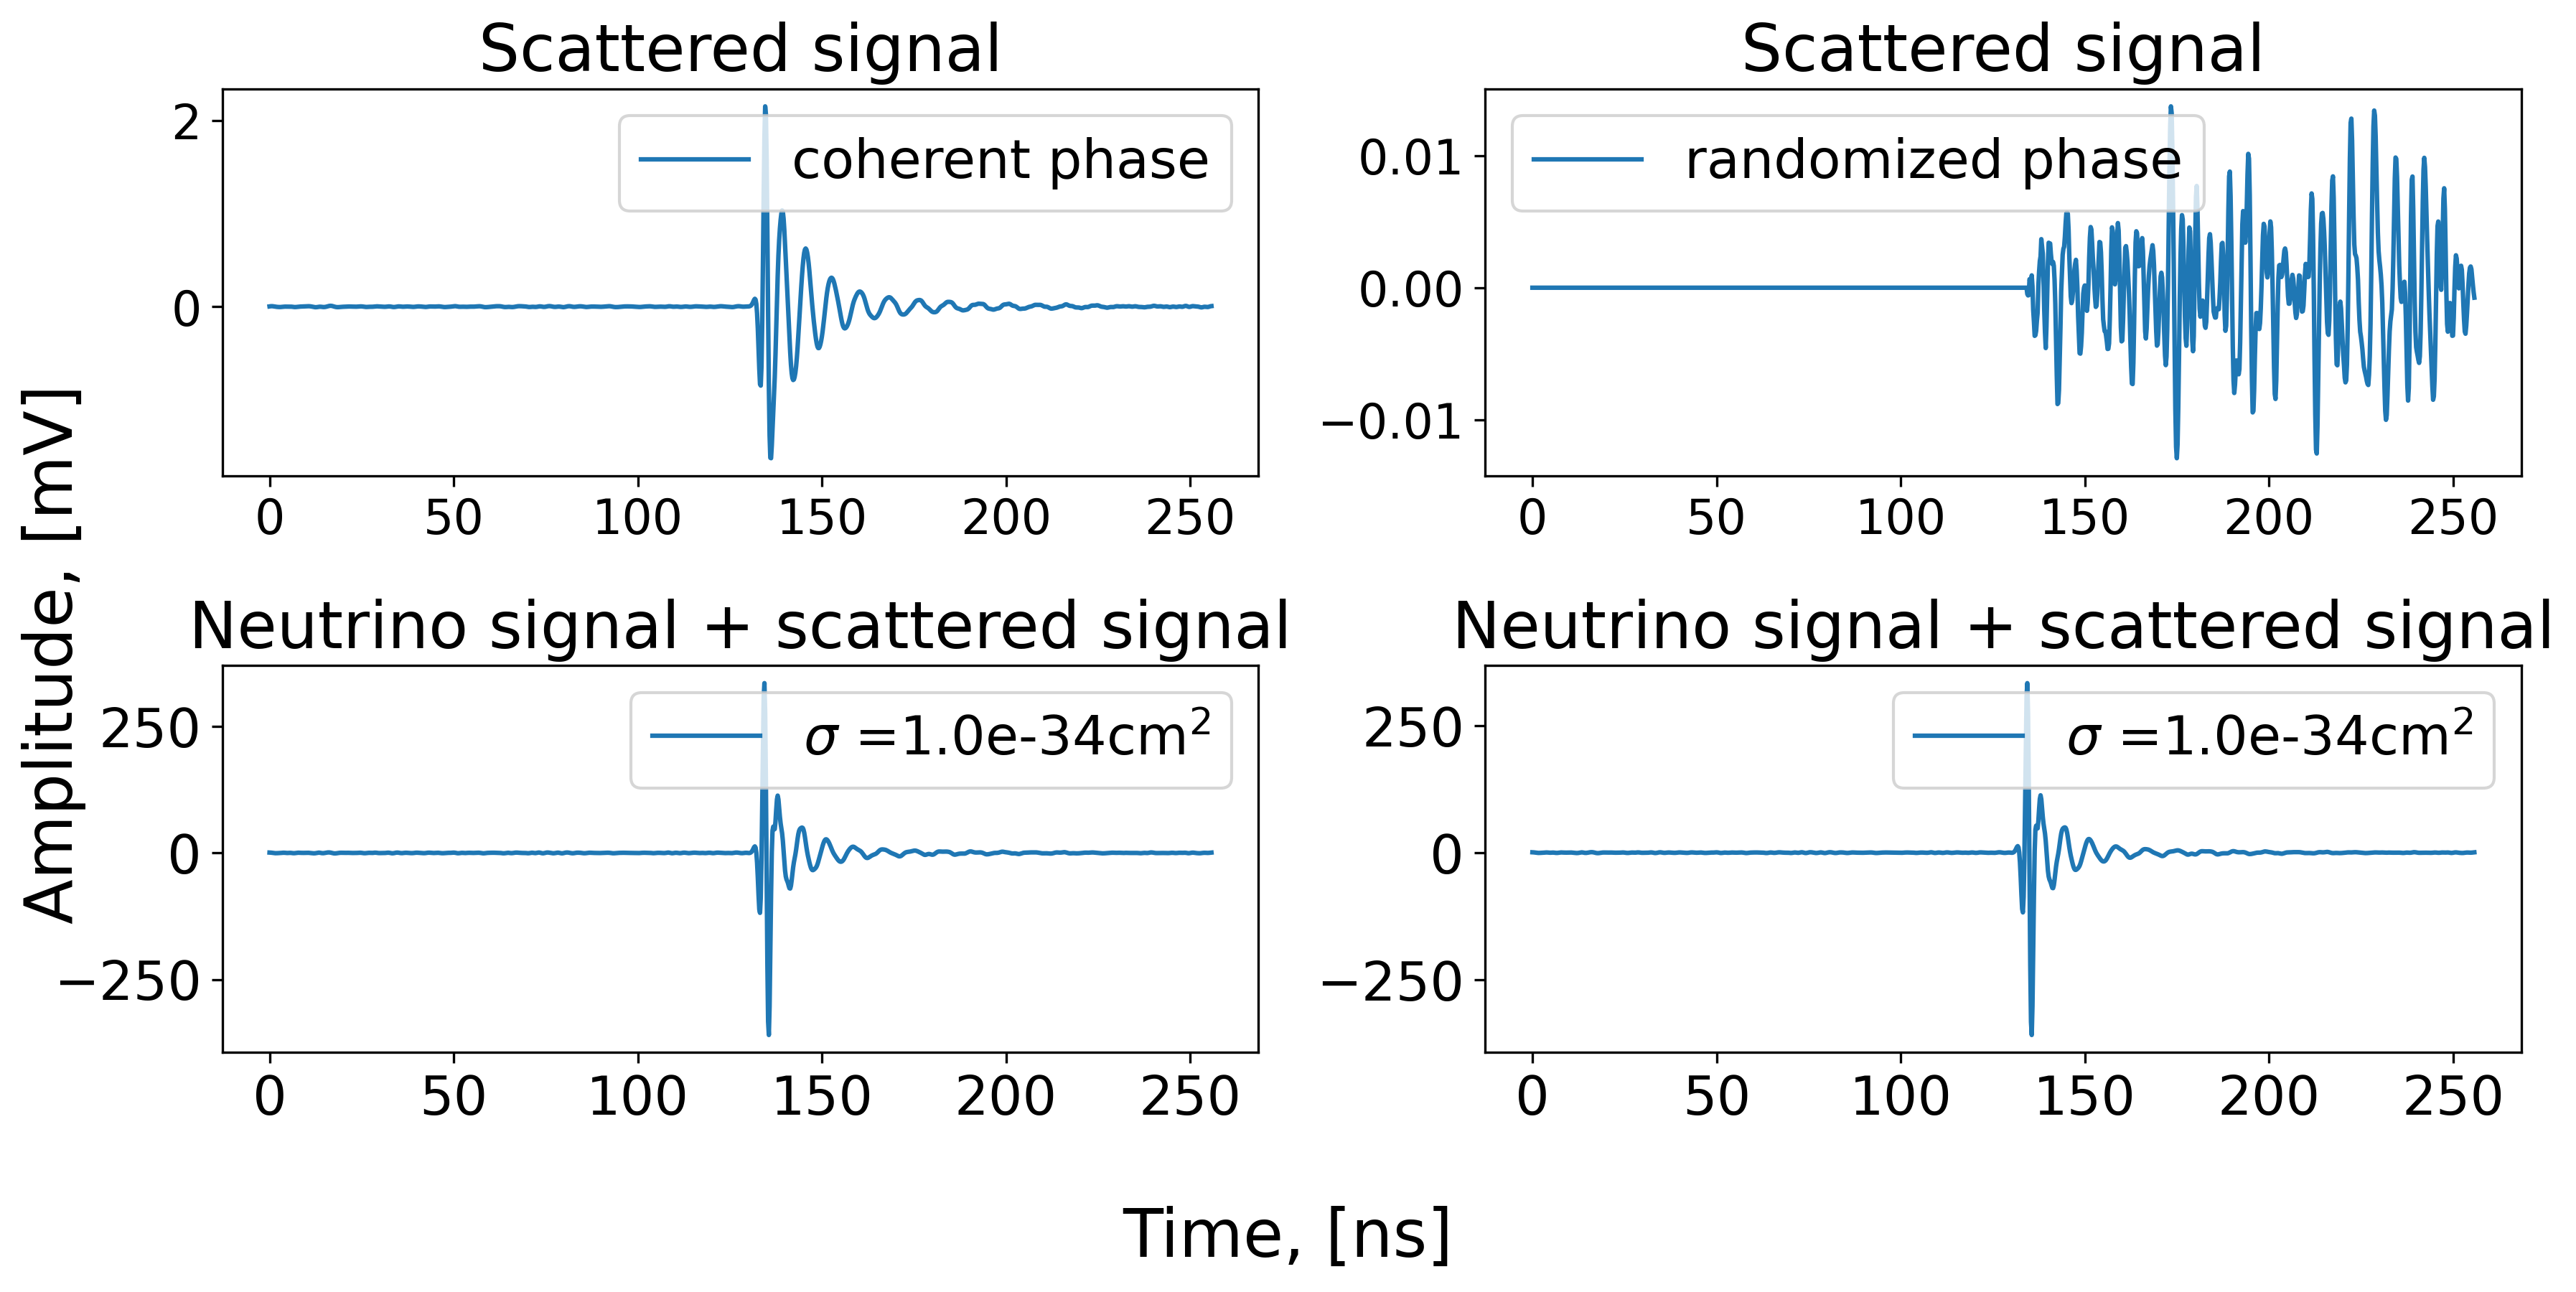
We obtain, from the simulation, both the relative shape, as well as the absolute normalization of the voltage profile for either coherent (CVS) or incoherent (IVS) volume scattering as a function of time relative to an initial signal onset for a given scattering cross-section. Figure 2 shows the results of our simulation for both CVS and IVS. As indicated in the plot, volume scattering leads to considerable signal contributions at large distances from the receiver – qualitatively, the differential volume scattering element is growing as 4dr; however, this growth is mitigated by both the expected dipole beam pattern of the volume scatterers and also signal attenuation.
We first use our simulation to obtain a refined upper limit, from data, of the VS cross-section, to be compared with the dimensional analysis presented previously. Here, we vary the scattering cross-section until the signal loss, beyond standard 1/r amplitude reduction, accounts for the 800 m field attenuation length typical of in-ice radio experiments. We obtain an upper limit on the scattering cross-section of from this exercise, and take this to be the current level at which the scattering cross-section is constrained by extant data.
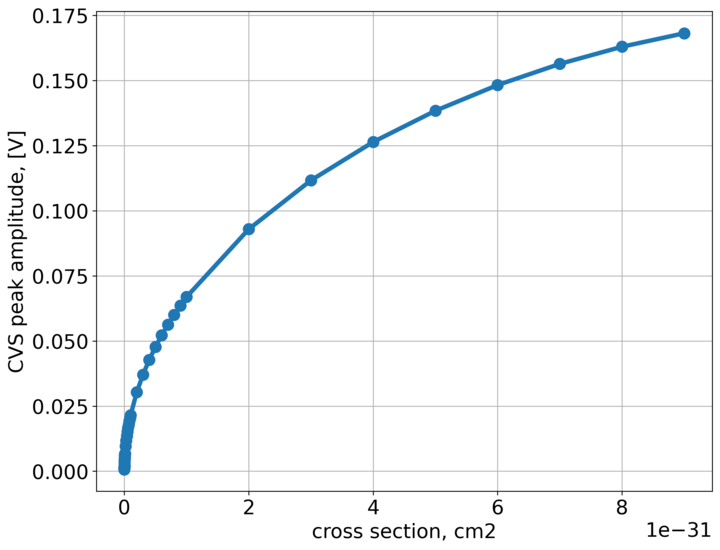
Scanning over cross-sections from in our simulation yields the result that the CVS amplitude scales roughly quadratically with cross-section (Figure 3). At sufficiently high cross-sections, signal is scattered well before reaching the region of the receiver, thereby mitigating the VS signal.
For a given cross-section, we can now evaluate the impact VS might have on observed neutrino signals. Since the neutrino signal arrives at the receiver from a variety of distances and angles, it is important to assess how the putative VS background may similarly vary with range and event geometry. Figure 4 shows the relative CVS contribution, on the Cherenkov cone, for r(Tx,Rx)=50 m and also r(Tx,Rx)=100 m. As the separation distance increases, the CVS flux bundle constricts, such that the CVS amplitude falls off less rapidly than the Askaryan signal.
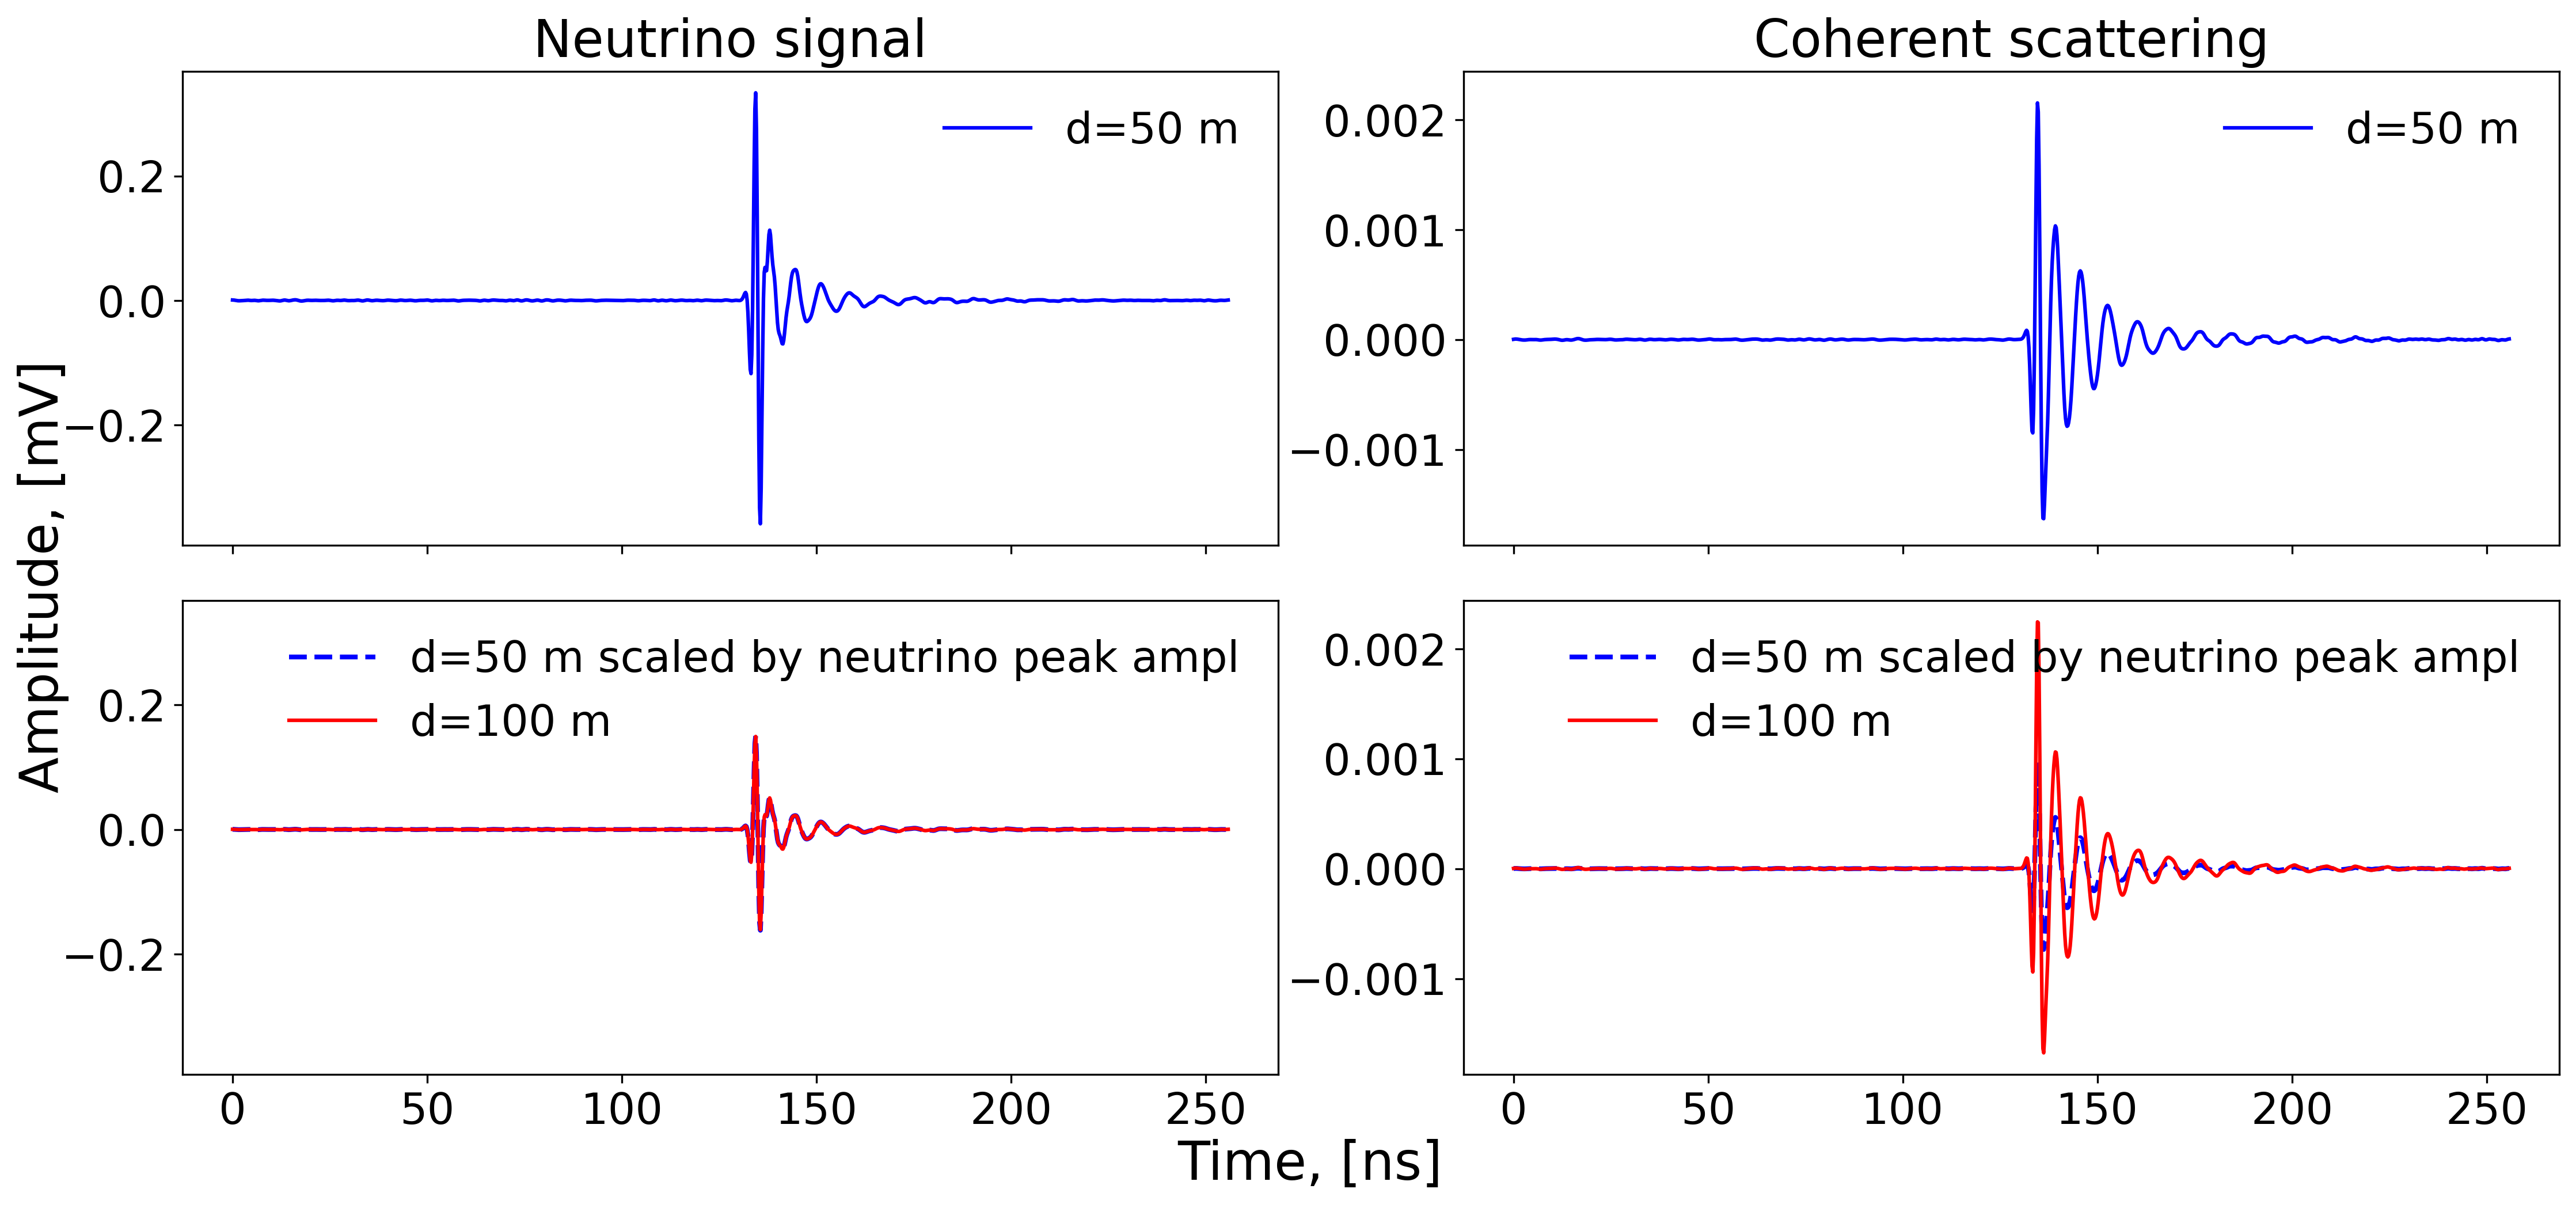
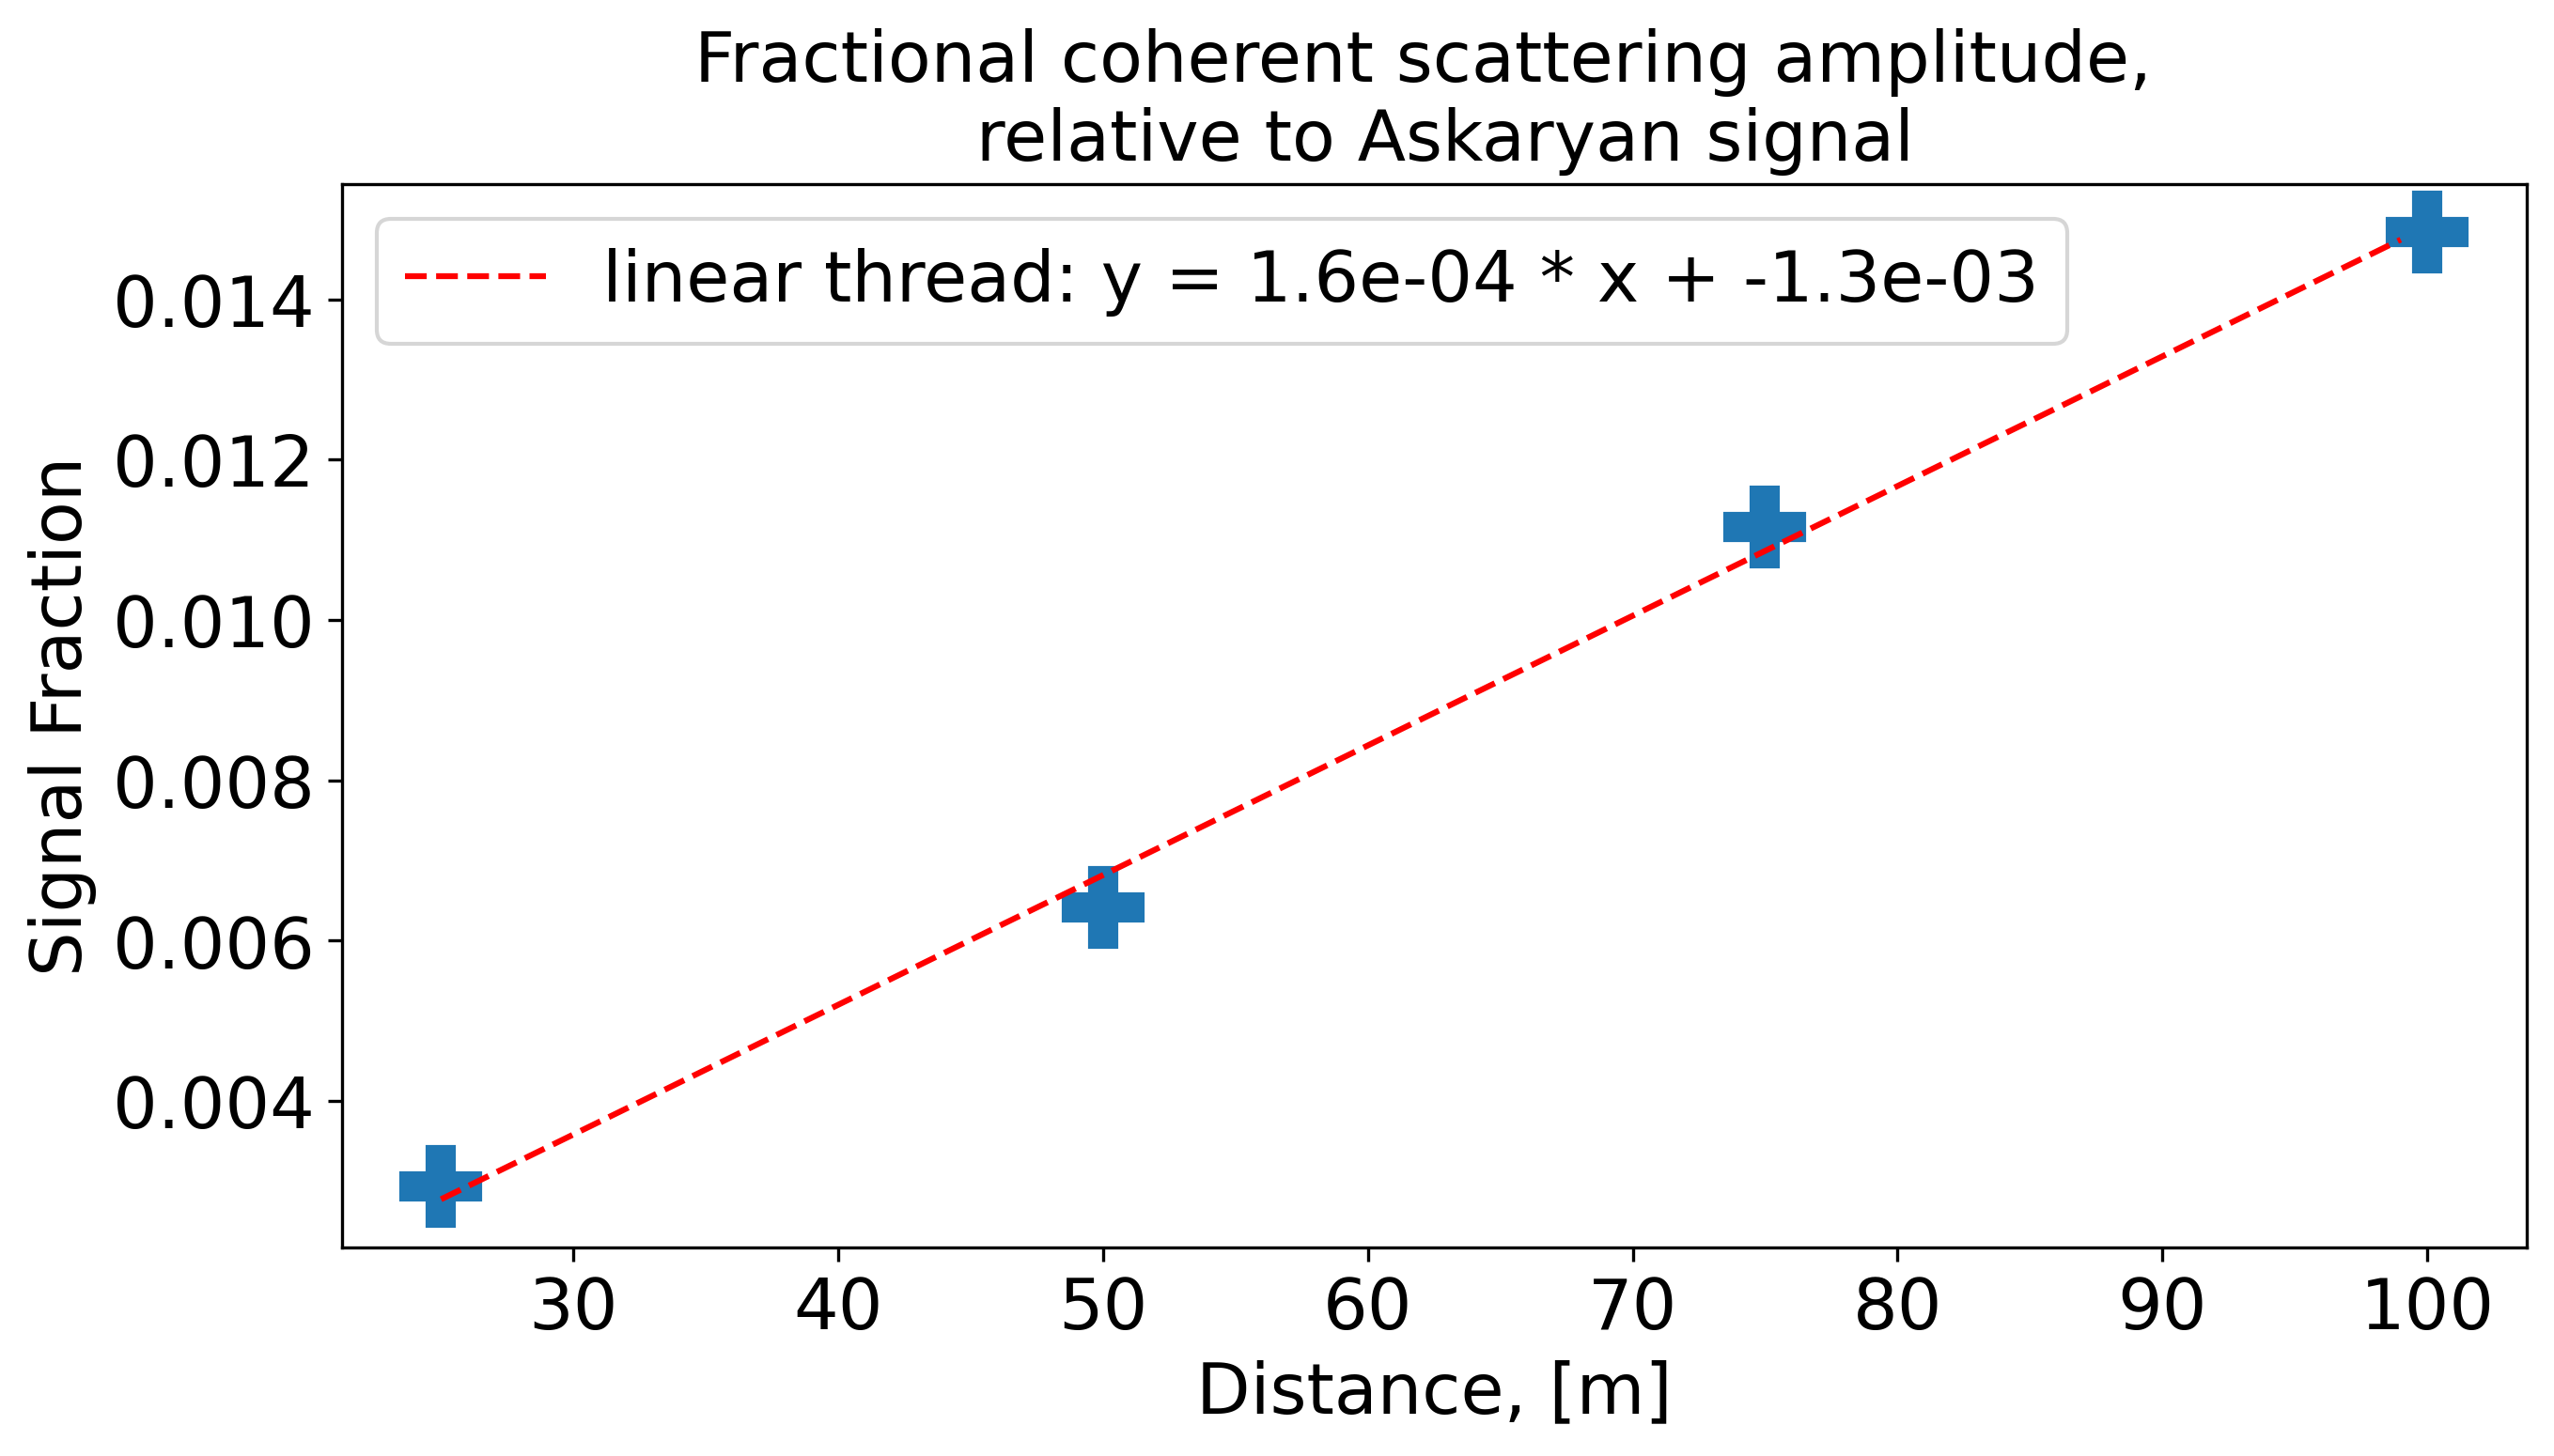
Figure 5 shows the fractional overestimate of neutrino signal amplitude due to the CVS enhancement, (conservatively) assuming the maximal scattering cross-section derived above. We observe an approximately linear increase in the relative CVS contribution. To verify this trend, a ‘fast’ simulation, which is limited to two-dimensions and eschews all frequency-dependent signal/receiver details as well as ray tracing, was written; that faster simulation qualitatively predicts a similar increase in background amplitude with distance, on-Cone, out to kilometer distance scales.
Since the Askaryan signal is confined to a cone of transverse width 1-2 degrees, the VS contribution is expected to grow as the receive angle increasingly deviates from the Cherenkov angle. Figure 6 illustrates the Cherenkov signal geometry in three planar cross-sections, for the case where the receiver (black dot) is maximally illuminated. However, as the receiver is increasingly displaced slightly off-cone, the VS signal from elements remaining on-cone will proportionately increase.
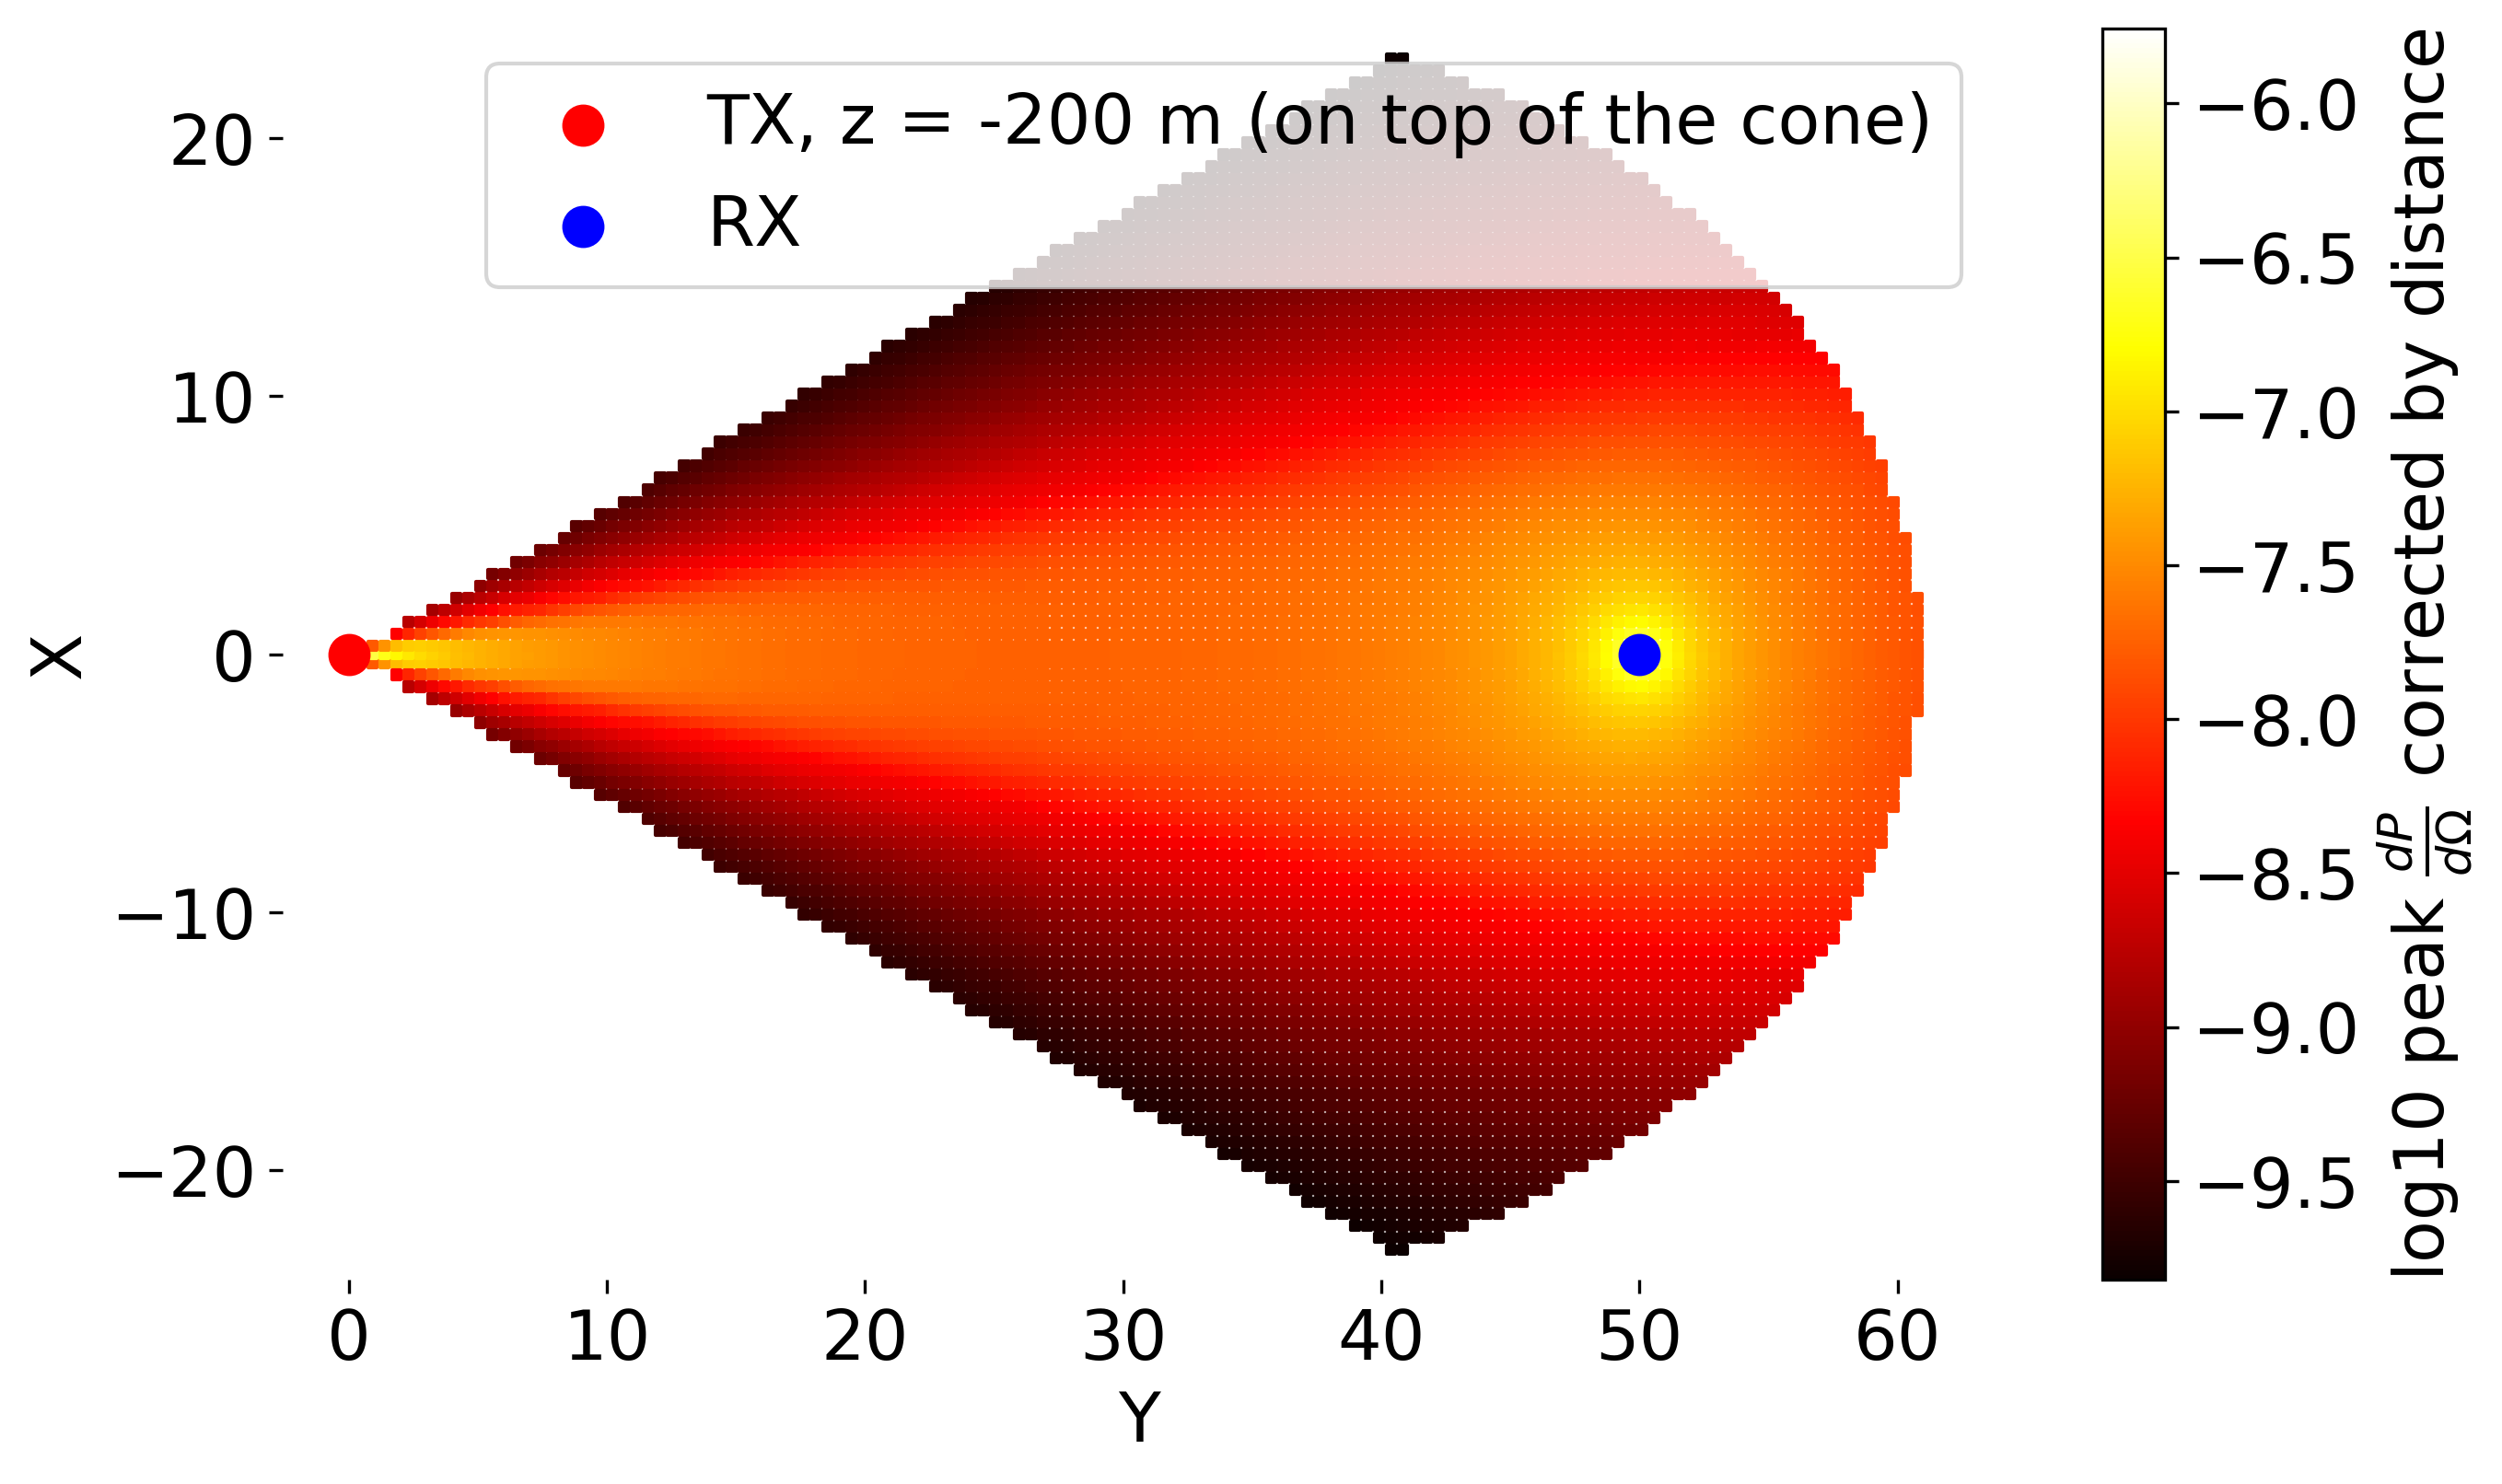
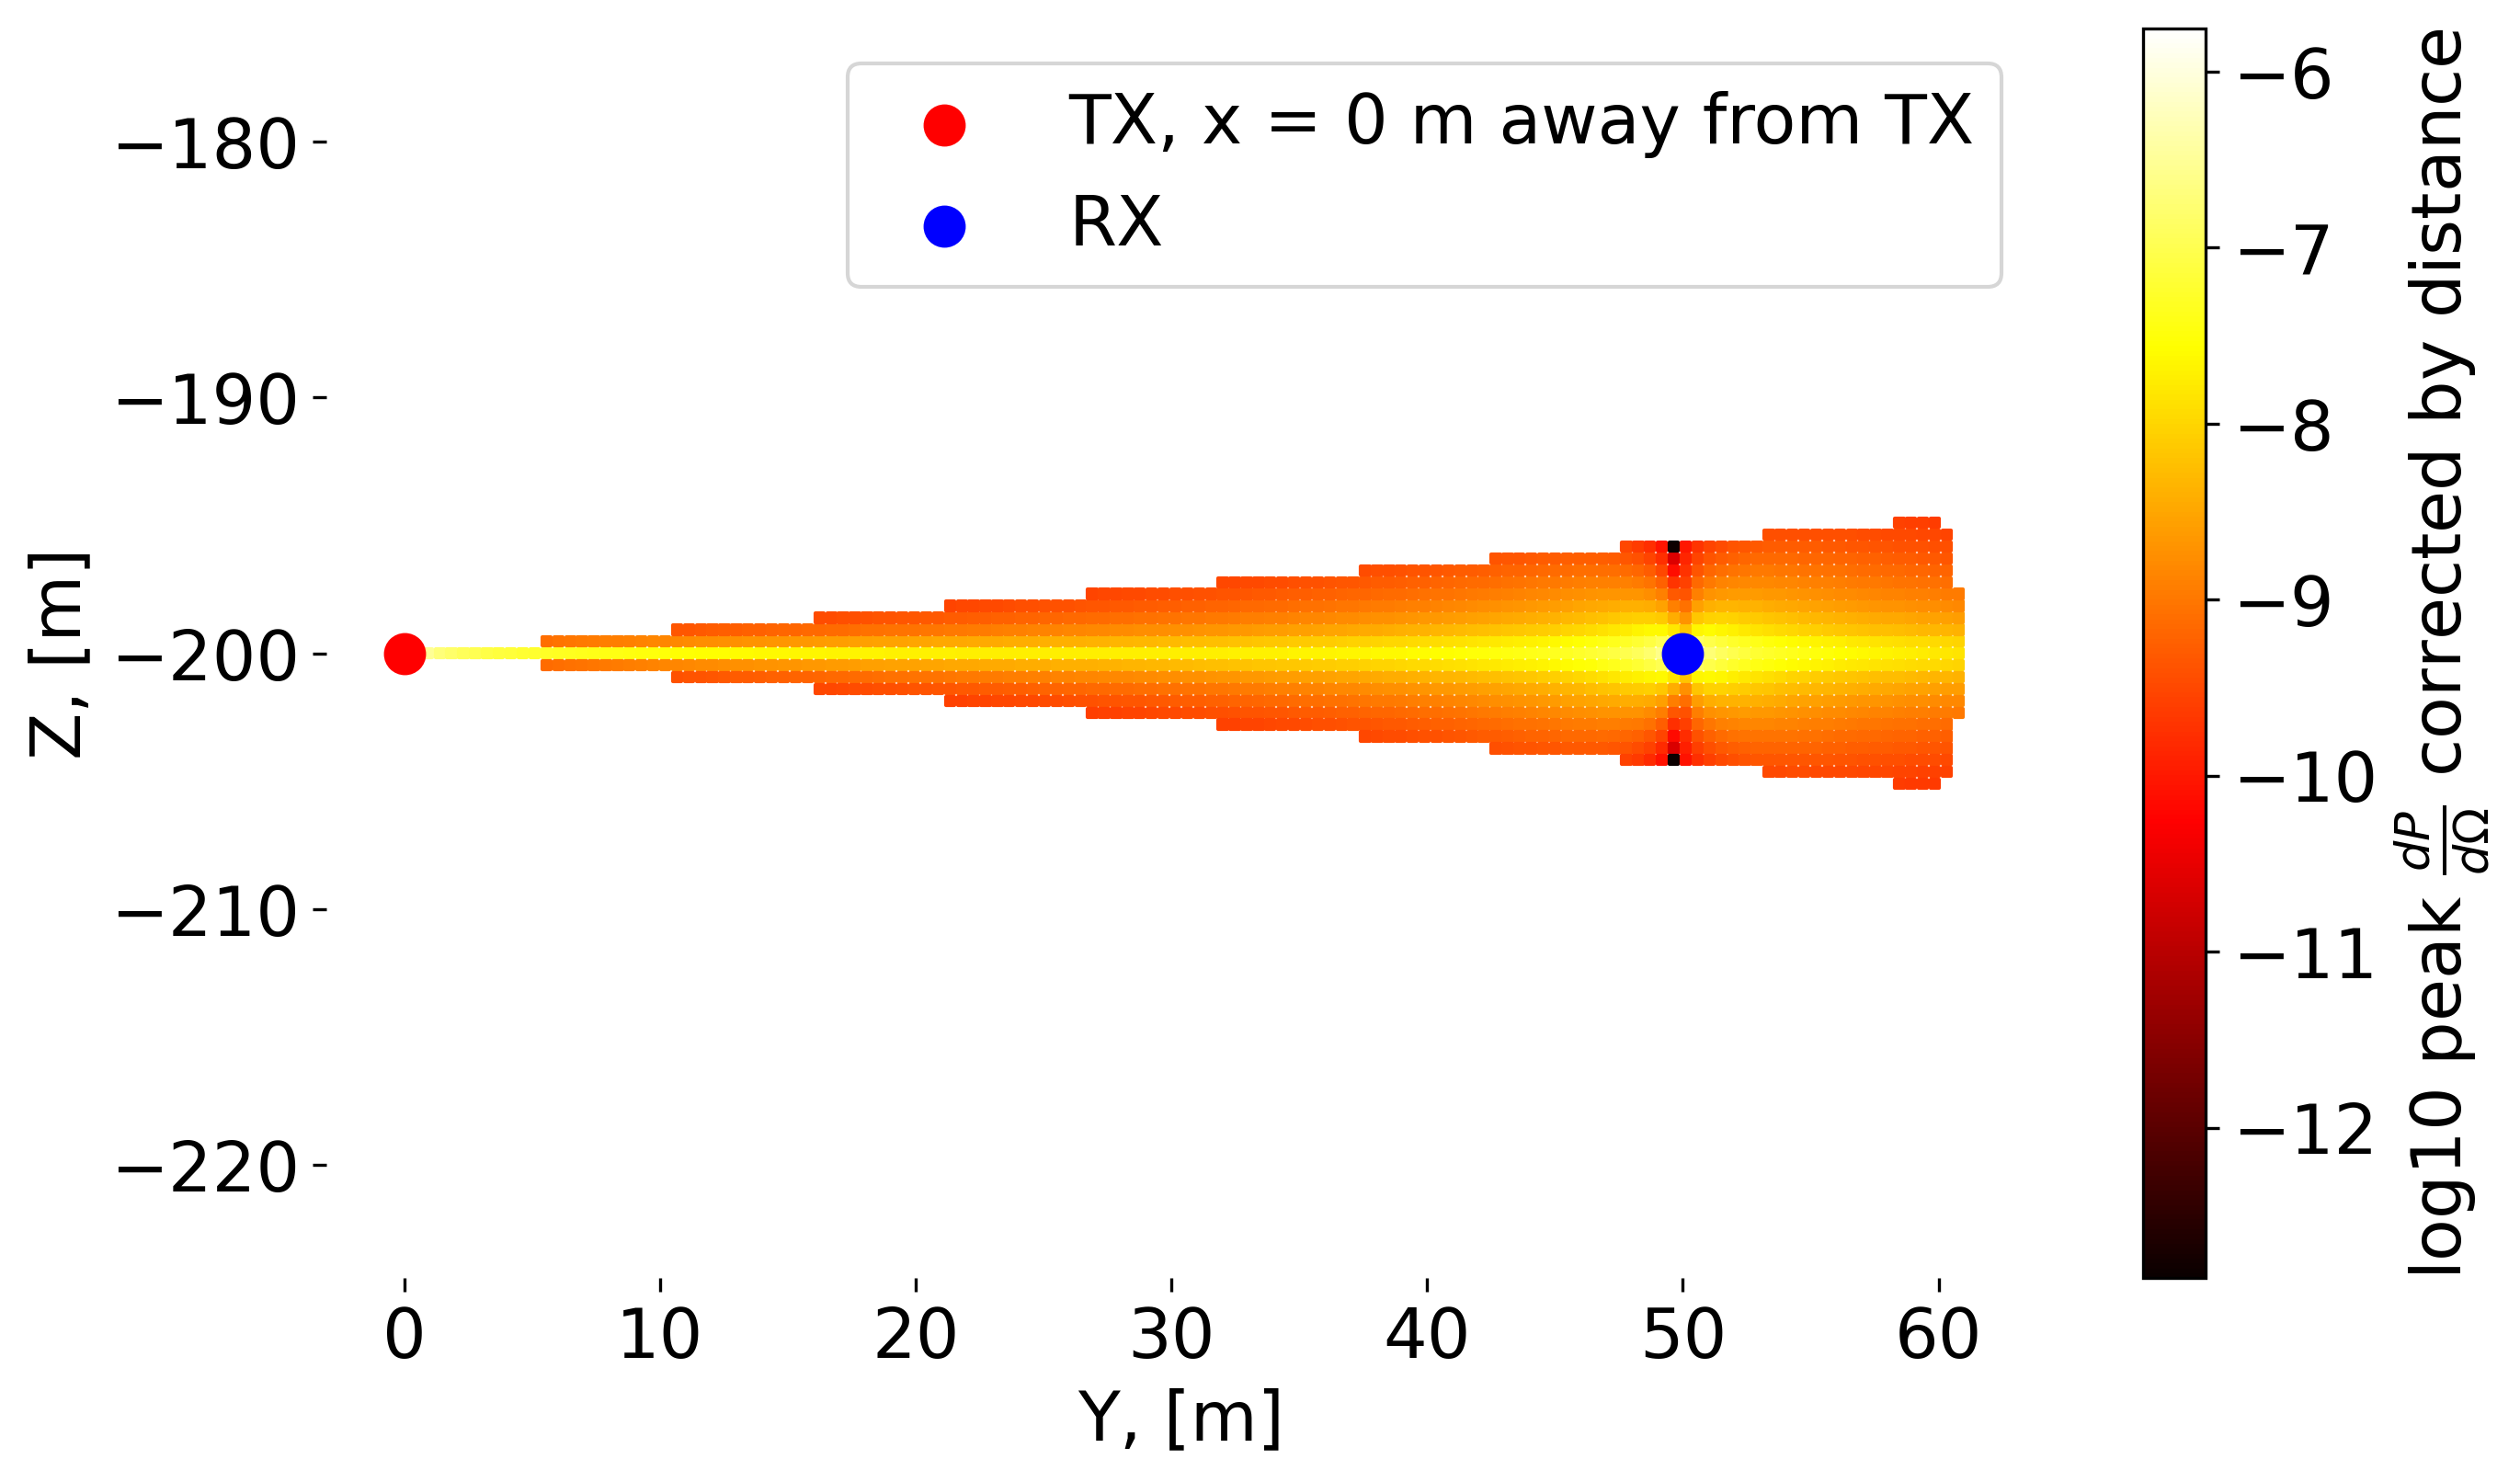
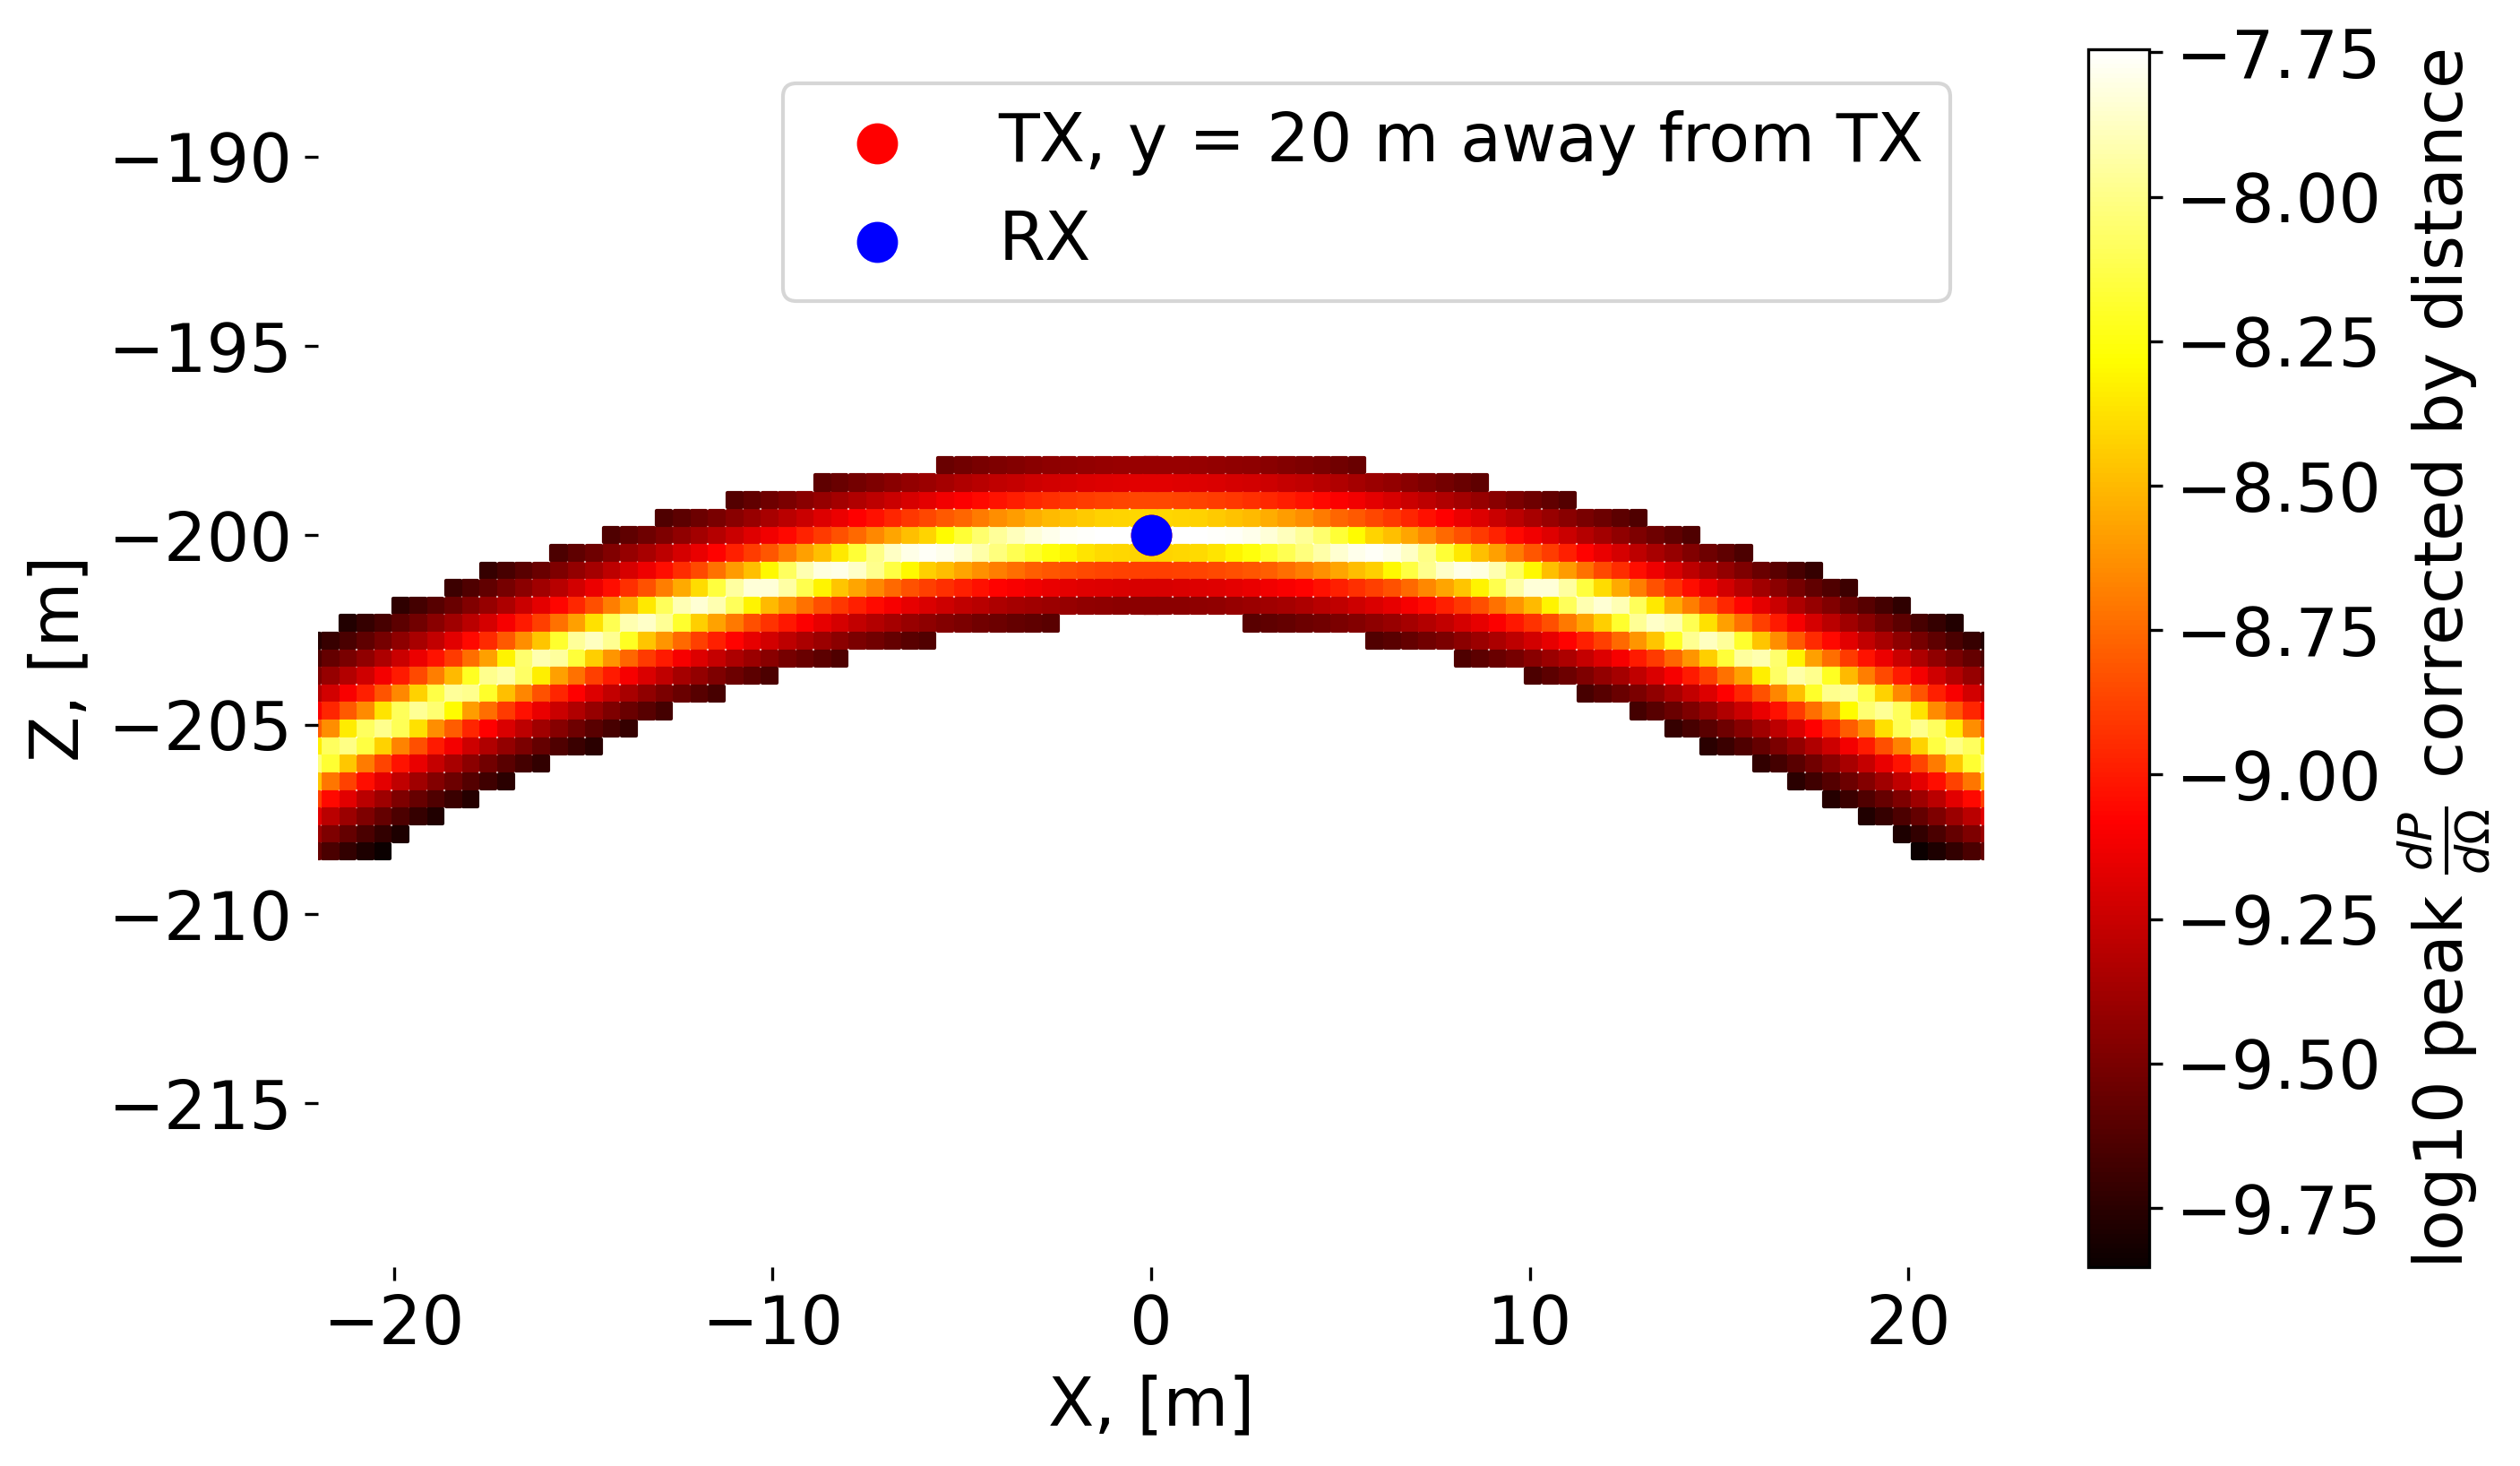
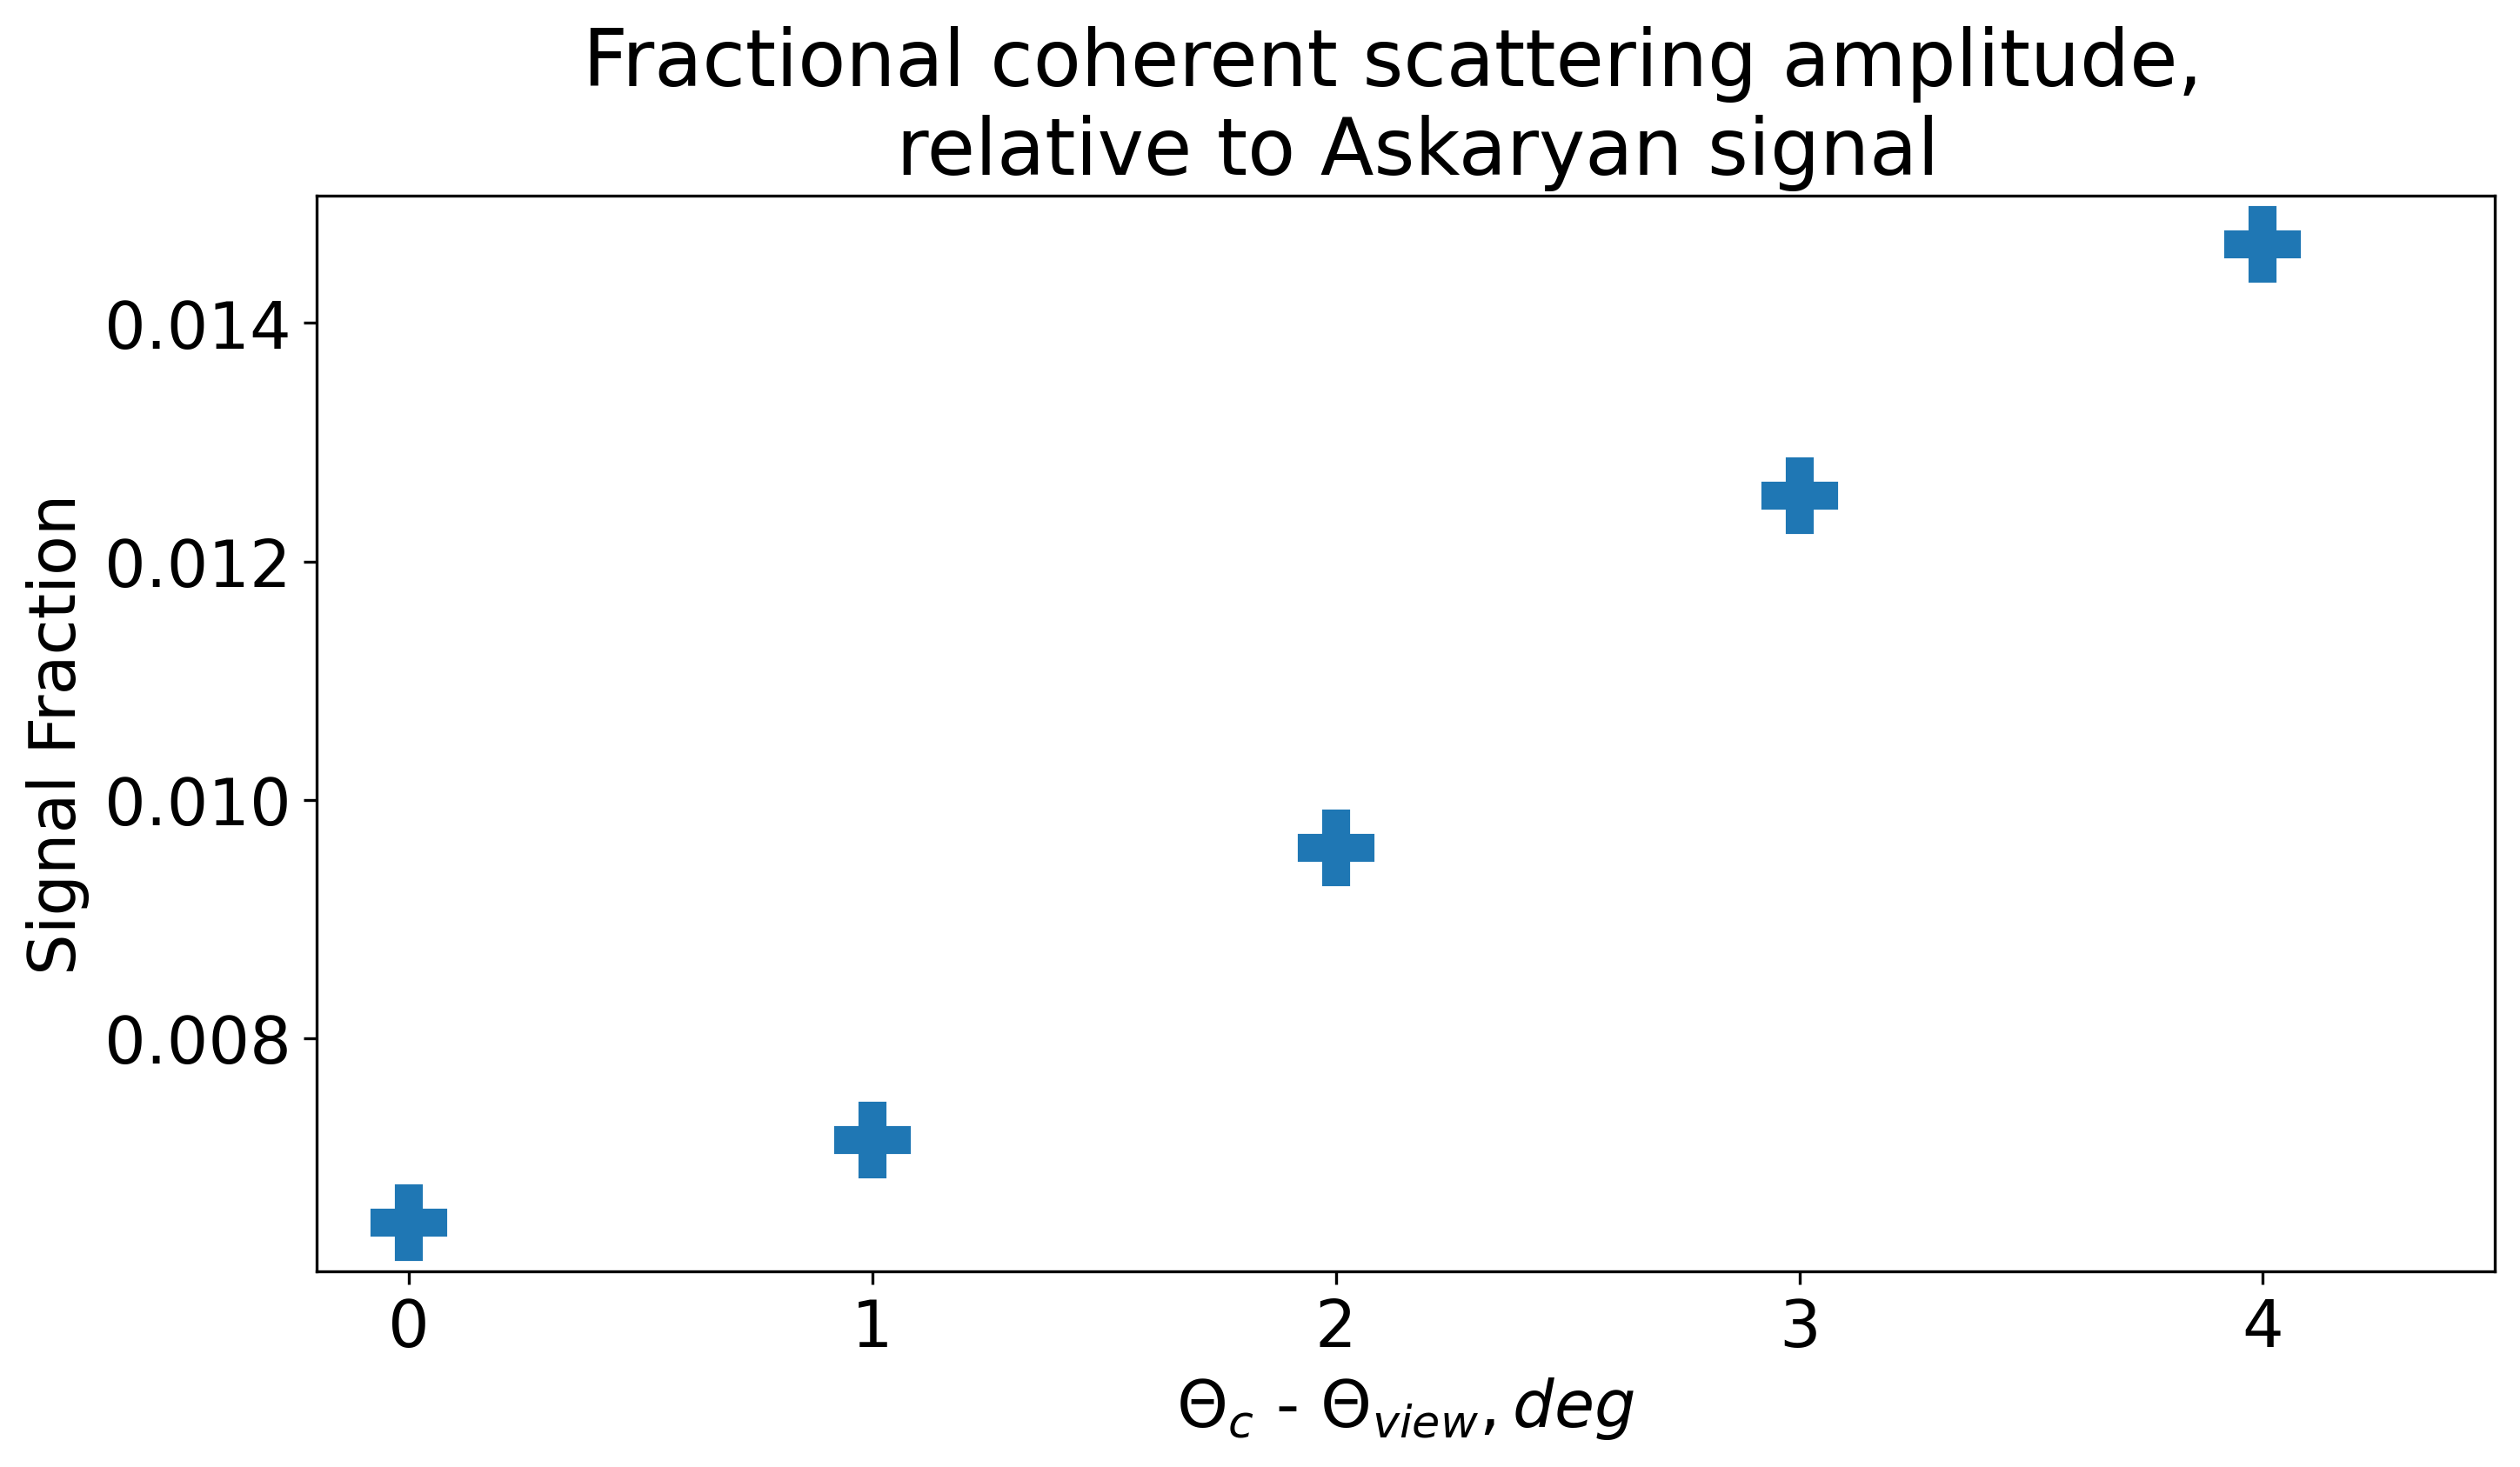
Figure 7 shows the relative CVS amplitude, as the received Askaryan signal deviates from the Cherenkov angle. In this case, the CVS contribution decreases only very slowly with angle, while the Askaryan signal falls as an exponential with characteristic scale of approximately 1 degree.
4 . Incoherent Volume Scattering Experimental Data Analysis
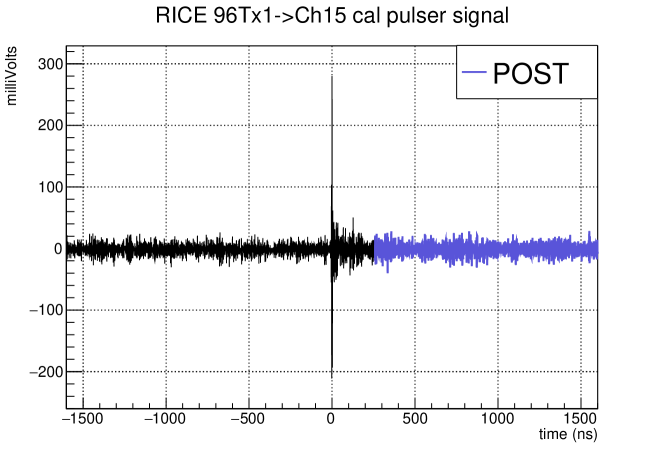
We use experimental in-ice calibration data from the RICE experiment(33; 34) to study possible volumetric scattering effects. Transmitter signals were broadcast to the 16 receiver antennas (approximately 100 meters distant) that comprised the RICE radio receiver array. A typical received pulse (Figure 8) is dictated by the intrinsic antenna response, consisting of a ‘ring-down’ of duration 10-20 ns, plus any possible coherent volume scattering component, superimposed on the incoherent background from thermal noise (constant in time) and any possible incoherent volume scattering component.
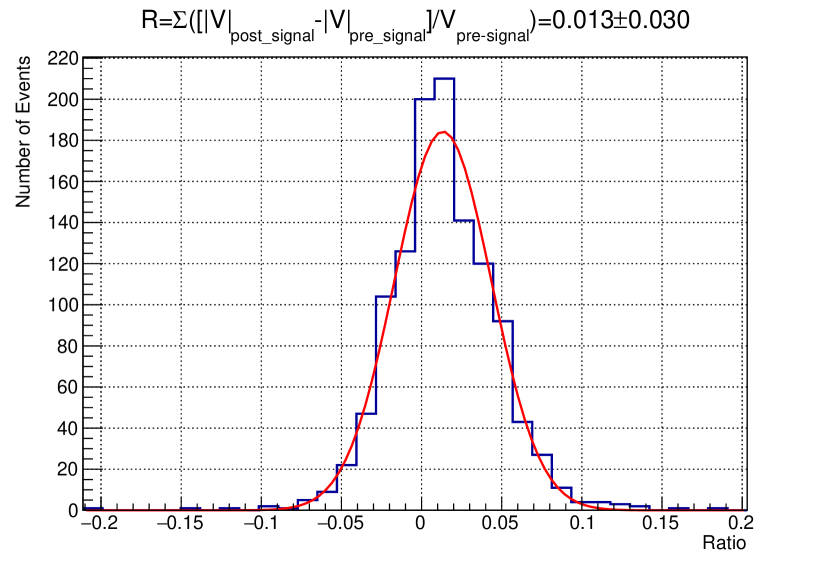
Since the CVS signal, as illustrated above, is so similar to the direct signal, experimental separation of the two is correspondingly difficult, and we therefore focus on the IVS component only. We quantify any possible incoherent volume scattering component produced by these local calibration pulser signals by subtracting the PRE-signal portion of the waveform from the post-signal portion of the waveform, and determine the possible magnitude of a POST IVS excess, independent of simulations, as a function of the signal-to-noise ratio of the calibration pulser waveform. Figure 9 shows the result of this exercise and presents the (POST-PRE)/PRE fraction as a measure of the total IVS component, relative to thermal noise. We note a slight positive offset, relative to zero, which we interpret as due to inclusion of the ‘tail’ of the antenna ring in our POST summed amplitude.
An additional experimental handle could be afforded by the POST/PRE asymmetry dependence on the local density of the environment – volume scattering for shallow antennas should be reduced relative to deep antennas, owing to the smaller local density. The antennas deployed for the RICE experiment, which provided the data analyzed in this study, however, were all deployed at depths exceeding 100 meters, by which point the ice is close to its asymptotic density.
.
5 . Summary, Conclusions and Future Work
Although often referenced in radioglaciological literature, the polar ice volume scattering cross-section has, thus far, lacked quantification. Experimental VS constraints are particularly important for efforts seeking measurement of radio emissions from in-ice neutrino interactions. Herein, we have derived an upper limit on the VS cross-section using bistatic radar echo data, and also derived limits on both coherent and also incoherent volume scattering, using the nuradiomc simulation package to model the expected VS signal shapes. These results are relevant to detection of radio-frequency signals generated by collisions of neutrinos with ice molecules, such as with the current ARA, ARIANNA, PUEO, RET, and RNO-G experiments, and the planned radio component of the IceCube-Gen2 experiment.
Future, more stringent bounds on CVS may be possible with future calibration pulser data taken over a wider range of transmitter-receiver ranges and incidence angles, and/or an improved understanding of how to properly evolve precise antenna response measurements made in-air to dense media, such as ice. Particularly useful would be detailed comparisons of transmitter signals broadcast in-air to transmitter signals broadcast in-medium, from which both CVS and IVS signals may be extracted, as a function of the local ice density. Similar data were taken by the RICE experiment in 2002, for which a transmitter and receiver pair were co-lowered into the South Polar ice sheet and waveforms recorded, as a function of Tx/Rx depth.
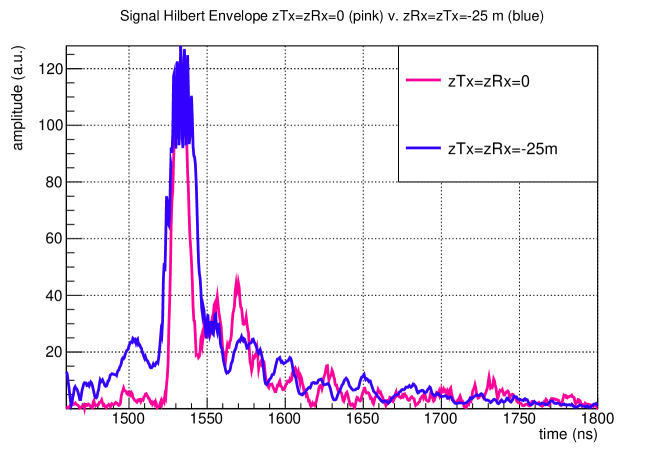
Figure 10, for example, shows the Hilbert envelope of the recorded waveforms, overlaying signals recorded when both RICE dipole transmitter and receiver are on the snow surface (zTx=zRx=0 m) with the case for which Tx and Rx are at a depth of 25 m below the surface. In the latter case, we observe some broadening of the initial pulse; quantitative extraction of any CVS contribution will require understanding how to evolve antenna directionality/gain from air to ice medium.
6 . Acknowledgements
This work was made possible, in part, by the National Science Foundation’s generous IceCube EPSCoR Initiative grant #2019597.
References
- Aartsen and others, (2013) Aartsen M, Abbasi R, Abdou Y, Ackermann M, Adams J, Aguilar J, Ahlers M, Altmann D, Auffenberg J, Bai X and others (2013) Measurement of south pole ice transparency with the icecube led calibration system. Nuclear Instruments and Methods in Physics Research Section A: Accelerators, Spectrometers, Detectors and Associated Equipment, 711, 73–89
- Aartsen and others, (2021) Aartsen MG and others (2021) Detection of a particle shower at the glashow resonance with icecube. Nature, 591(7849), 220–224
- Abbasi and others, (2021) Abbasi R, Ackermann M, Adams J, Aguilar J, Ahlers M, Ahrens M, Alispach C, Alves Jr A, Amin N, Andeen K and others (2021) Icecube high-energy starting event sample: Description and flux characterization with 7.5 years of data. Physical Review D, 104(2), 022002
- Ackermann and others, (2006) Ackermann M, Ahrens J, Bai X, Bartelt M, Barwick S, Bay R, Becka T, Becker J, Becker KH, Berghaus P and others (2006) Optical properties of deep glacial ice at the south pole. Journal of Geophysical Research: Atmospheres, 111(D13)
- Aguilar and others, (2022a) Aguilar J, Allison P, Besson D, Bishop A, Botner O, Bouma S, Buitink S, Cataldo M, Clark B, Couberly K and others (2022a) Radiofrequency ice dielectric measurements at summit station, greenland. arXiv preprint arXiv:2212.10285
- Aguilar and others, (2021) Aguilar J and others (2021) Design and sensitivity of the Radio Neutrino Observatory in Greenland (RNO-G). Journal of Instrumentation, 16(03), P03025 (10.1088/1748-0221/16/03/P03025)
- Aguilar and others, (2022b) Aguilar J and others (2022b) In situ, broadband measurement of the radio frequency attenuation length at Summit Station, Greenland. Journal of Glaciology (10.1017/jog.2022.40)
- Aguilar and others, (2005) Aguilar JA and others (2005) Transmission of light in deep sea water at the site of the ANTARES Neutrino Telescope. Astropart. Phys., 23, 131–155 (10.1016/j.astropartphys.2004.11.006)
- Allison and others, (2019) Allison P and others (2019) Design and performance of an interferometric trigger array for radio detection of high-energy neutrinos. Nucl. Instrum. Meth. A, 930, 112–125 (10.1016/j.nima.2019.01.067)
- Allison and others, (2020) Allison P and others (2020) Long-baseline horizontal radio-frequency transmission through polar ice. Journal of Cosmology and Astroparticle Physics, 2020(12), 009–009 (10.1088/1475-7516/2020/12/009)
- Anker and others, (2022) Anker A, Baldi P, Barwick S, Beise J, Besson D, Bouma S, Cataldo M, Chen P, Gaswint G, Glaser C and others (2022) Improving sensitivity of the arianna detector by rejecting thermal noise with deep learning. Journal of Instrumentation, 17(03), P03007
- Barwick and others, (2005) Barwick SW, Besson DZ, Gorham PW and Saltzberg DP (2005) South Polar in situ radio-frequency ice attenuation. Journal of Glaciology, 51(173), 231–238 (10.3189/172756505781829467)
- Barwick and others, (2015) Barwick SW and others (2015) Design and Performance of the ARIANNA Hexagonal Radio Array Systems. IEEE Trans. Nucl. Sci., 62(5), 2202–2215 (10.1109/TNS.2015.2468182)
- Barwick and others, (2018) Barwick SW and others (2018) Observation of classically ‘forbidden’ electromagnetic wave propagation and implications for neutrino detection. JCAP, 07, 055 (10.1088/1475-7516/2018/07/055)
- Bohren and Battan, (1982) Bohren CF and Battan LJ (1982) Radar backscattering of microwaves by spongy ice spheres. Journal of Atmospheric Sciences, 39(11), 2623–2628
- Cao and others, (2023) Cao Z, Chen S, Liu R and Yang R (2023) Ultra-High-Energy Gamma-Ray Astronomy. Ann. Rev. Nucl. Part. Sci., 73, 341–363 (10.1146/annurev-nucl-112822-025357)
- Collaboration and others, (2018) Collaboration I, MAGIC, AGILE, ASAS-SN, HAWC, HESS, INTEGRAL, Kanata, Kiso, Kapteyn and others (2018) Multimessenger observations of a flaring blazar coincident with high-energy neutrino icecube-170922a. Science, 361(6398), eaat1378
- Collaboration*† and others, (2022) Collaboration*† I, Abbasi R, Ackermann M, Adams J, Aguilar J, Ahlers M, Ahrens M, Alameddine J, Alispach C, Alves Jr A and others (2022) Evidence for neutrino emission from the nearby active galaxy ngc 1068. Science, 378(6619), 538–543
- Collaboration*† and others, (2023) Collaboration*† I, Abbasi R, Ackermann M, Adams J, Aguilar J, Ahlers M, Ahrens M, Alameddine J, Alves Jr A, Amin N and others (2023) Observation of high-energy neutrinos from the galactic plane. Science, 380(6652), 1338–1343
- Connolly, (2021) Connolly A (2021) Impact of biaxial birefringence in polar ice at radio frequencies on signal polarizations in ultra-high energy neutrino detection. arXiv preprint arXiv:2110.09015
- Davis and Moore, (1993) Davis CH and Moore RK (1993) A combined surface-and volume-scattering model for ice-sheet radar altimetry. Journal of Glaciology, 39(133), 675–686 (10.3189/S0022143000016579)
- Deaconu and others, (2018) Deaconu C, Vieregg AG, Wissel SA, Bowen J, Chipman S, Gupta A, Miki C, Nichol RJ and Saltzberg D (2018) Measurements and Modeling of Near-Surface Radio Propagation in Glacial Ice and Implications for Neutrino Experiments. Phys. Rev. D, 98(4), 043010 (10.1103/PhysRevD.98.043010)
- Deligny and others, (2023) Deligny O, Collaboration PA and others (2023) The science of ultra-high energy cosmic rays after more than 15 years of operation of the pierre auger observatory. In Journal of Physics: Conference Series, volume 2429, 012009, IOP Publishing
- Glaser and others, (2020) Glaser C, García-Fernández D, Nelles A, Alvarez-Muñiz J, Barwick SW, Besson DZ, Clark BA, Connolly A, Deaconu C, de Vries K and others (2020) Nuradiomc: Simulating the radio emission of neutrinos from interaction to detector. The European Physical Journal C, 80, 1–35
- Gorham and others, (2007) Gorham PW and others (2007) Observations of the Askaryan effect in ice. Phys. Rev. Lett., 99, 171101 (10.1103/PhysRevLett.99.171101)
- Gorham and others, (2009) Gorham PW and others (2009) The Antarctic Impulsive Transient Antenna Ultra-high Energy Neutrino Detector Design, Performance, and Sensitivity for 2006-2007 Balloon Flight. Astropart. Phys., 32, 10–41 (10.1016/j.astropartphys.2009.05.003)
- Gorham and others, (2009) Gorham PW and others (2009) The Antarctic Impulsive Transient Antenna ultra-high energy neutrino detector: Design, performance, and sensitivity for the 2006-2007 balloon flight. Astroparticle Physics, 32(1), 10 – 41 (10.1016/j.astropartphys.2009.05.003)
- Gusev and others, (2010) Gusev G, Lomonosov B, Ryabov VA and Chechin V (2010) Ice satellites of planets of the solar system and the on-orbit radio detection of ultrahigh-energy particles. Physics-Uspekhi, 53(9), 915
- Heyer and Glaser, (2023) Heyer N and Glaser C (2023) First-principle calculation of birefringence effects for in-ice radio detection of neutrinos. Eur. Phys. J. C, 83(2), 124 (10.1140/epjc/s10052-023-11238-y)
- https://icecube. wisc. edu/analysis@ icecube. wisc. edu and others, (2022) https://icecube wisc edu/analysis@ icecube wisc edu IC, Abbasi R, Ackermann M, Adams J, Aguilar J, Ahlers M, Ahrens M, Alispach C, Alves Jr A, Amin N and others (2022) Detection of astrophysical tau neutrino candidates in icecube. The European Physical Journal C, 82(11), 1031
- Jol, (2008) Jol HM (2008) Ground penetrating radar theory and applications. elsevier
- Kim and others, (2007) Kim MJ, Kulie MS, O’Dell C and Bennartz R (2007) Scattering of ice particles at microwave frequencies: A physically based parameterization. Journal of applied meteorology and climatology, 46(5), 615–633
- Kravchenko and others, (2003) Kravchenko I, Frichter GM, Seckel D, Spiczak GM, Adams J, Seunarine S, Allen C, Bean A, Besson D, Box DJ, Buniy R, Drees J, McKay D, Meyers J, Perry L, Ralston J, Razzaque S and Schmitz DW (2003) Performance and simulation of the RICE detector. Astroparticle Physics, 19, 15–36
- Kravchenko and others, (2012) Kravchenko I, Hussain S, Seckel D, Besson D, Fensholt E, Ralston J, Taylor J, Ratzlaff K and Young R (2012) Updated Results from the RICE Experiment and Future Prospects for Ultra-High Energy Neutrino Detection at the South Pole. Physical Review D, D85, 062004 (10.1103/PhysRevD.85.062004)
- Kuznetsov and Tinyakov, (2023) Kuznetsov M and Tinyakov P (2023) Uhecr anisotropy and extragalactic magnetic fields with the telescope array. In EPJ Web of Conferences, volume 283, EDP Sciences
- Maragos and others, (2016) Maragos N, Balasi K, Domvoglou T, Kiskiras I, Lenis D, Maniatis M and Stavropoulos G (2016) Measurement of light scattering in deep sea. In EPJ Web of Conferences, volume 116, 06009, EDP Sciences
- Mon, (1982) Mon J (1982) Backward and forward scattering of microwaves by ice particles: A review. Radio Science, 17(5), 953–971
- Partington and others, (1989) Partington K, Ridley J, Rapley C and Zwally H (1989) Observations of the surface properties of the ice sheets by satellite radar altimetry. Journal of Glaciology, 35(120), 267–275
- Prohira and others, (2021a) Prohira S and others (2021a) The Radar Echo Telescope for Cosmic Rays: Pathfinder experiment for a next-generation neutrino observatory. Phys. Rev. D, 104(10), 102006 (10.1103/PhysRevD.104.102006)
- Prohira and others, (2021b) Prohira S and others (2021b) The Radar Echo Telescope for Cosmic Rays: Pathfinder experiment for a next-generation neutrino observatory. Phys. Rev. D, 104(10), 102006 (10.1103/PhysRevD.104.102006)
- Ridley and Partington, (1988) Ridley J and Partington K (1988) A model of satellite radar altimeter return from ice sheets. Remote Sensing, 9(4), 601–624
- Roberts and others, (2023) Roberts JH, McKinnon WB, Elder CM, Tobie G, Biersteker JB, Young D, Park RS, Steinbrügge G, Nimmo F, Howell SM and others (2023) Exploring the interior of europa with the europa clipper. Space Science Reviews, 219(6), 46
- Romero-Wolf and others, (2024) Romero-Wolf A, Steinbruegge G, Castillo-Rogez J, Cochrane CJ, Nordheim TA, Mitchell KL, Wolfenbarger NS, Schroeder DM and Peters S (2024) Feasibility of passive sounding of uranian moons using uranian kilometric radiation. Earth and Space Science, 11(2), e2023EA003013
- Saltzberg and others, (2001) Saltzberg D, Gorham PW, Walz D, Field C, Iverson R, Odian A, Resch G, Schoessow P and Williams D (2001) Observation of the Askaryan effect. AIP Conf. Proc., 579(1), 225–233 (10.1063/1.1398175)
- Wang and others, (2016) Wang J, Ge J, Zhang Q, Li X, Wei M, Yang Z and Liu YA (2016) Radar cross-section measurements of ice particles using vector network analyzer. Aip Advances, 6(9)
- Wang and others, (2022) Wang SH and others (2022) TAROGE-M: radio antenna array on antarctic high mountain for detecting near-horizontal ultra-high energy air showers. JCAP, 11, 022 (10.1088/1475-7516/2022/11/022)
- Yi and Bentley, (1994) Yi D and Bentley C (1994) Analysis of satellite radar-altimeter return wave forms over the east antarctic ice sheet. Annals of Glaciology, 20, 137–142