Sonos Voice Control Bias Assessment Dataset:
A Methodology for Demographic Bias Assessment
in Voice Assistants
Abstract
Recent works demonstrate that voice assistants do not perform equally well for everyone, but research on demographic robustness of speech technologies is still scarce. This is mainly due to the rarity of large datasets with controlled demographic tags. This paper introduces the Sonos Voice Control Bias Assessment Dataset, an open dataset composed of voice assistant requests for North American English in the music domain ( speakers, hours, k audio samples, with unique labelled transcripts) with a controlled demographic diversity (gender, age, dialectal region and ethnicity). We also release a statistical demographic bias assessment methodology, at the univariate and multivariate levels, tailored to this specific use case and leveraging spoken language understanding metrics rather than transcription accuracy, which we believe is a better proxy for user experience. To demonstrate the capabilities of this dataset and statistical method to detect demographic bias, we consider a pair of state-of-the-art Automatic Speech Recognition and Spoken Language Understanding models. Results show statistically significant differences in performance across age, dialectal region and ethnicity. Multivariate tests are crucial to shed light on mixed effects between dialectal region, gender and age.
Keywords: speech corpus, automatic speech recognition, spoken language understanding, demographic bias, bias detection
Sonos Voice Control Bias Assessment Dataset:
A Methodology for Demographic Bias Assessment
in Voice Assistants
| Chloé Sekkat1, Fanny Leroy*††thanks: *Independent methodologist in statistics, Salima Mdhaffar2, Blake Perry Smith1, |
|---|
| Yannick Estève2, Joseph Dureau1, Alice Coucke1 |
| 1Sonos Inc., France |
| 2Laboratoire Informatique d’Avignon, Avignon Université, France |
| 1{first.last}@sonos.com |
| 2{first.last}@univ-avignon.fr |
Abstract content
1. Introduction
One of the main applications of Automatic Speech Recognition (ASR) is Spoken Language Understanding (SLU). SLU combines speech and natural language processing techniques and is used in voice interfaces such as domestic voice assistants in smart speakers. It typically combines several tasks like intent classification and slot filling Tur (2011). Such a field of application raises many challenges, especially around footprint and privacy (always-on setting, edge processing like in He et al. (2018); Saade et al. (2019)), proper nouns and rare words recognition (e.g. for music entities recognition, in Liao et al. (2023); Sainath et al. (2021)) and acoustic robustness (far-field noisy settings typical of the home environment, like in Braithwaite and Kleijn (2019); Défossez et al. (2020)).
However less research is directed on what we could call demographic robustness of voice assistants. There is some evidence though that ASR systems do not perform equally well for everyone (see Section 2). In particular, performance degradation stemming from demographic factors – gender, age, accent, race – can be observed, leading to our definition of demographic bias: when the performance of a speech recognition system depends on the group of people it is evaluated upon. Such research is nonetheless mostly focused on conversational use cases of the general domain for dictation and the underlying metric to optimize is transcription accuracy or Word Error Rate (WER). We believe these are not representative of voice assistant usage that focuses on the recognition of short action-oriented commands and that SLU metrics are likely to be a better proxy for voice assistant user experience. The correct execution of voice assistant requests indeed strongly depends on the recognition of isolated and sometimes complex entities, rather than on the exact transcription of the entire utterance.
In this work, we propose an open dataset, the Sonos Voice Control Bias Assessment Dataset ( speakers, hours, k audio samples, with unique labelled transcripts), composed of voice assistant requests in the music domain with a controlled demographic diversity (gender, age, dialectal region and race). The dataset is accompanied by a statistical bias assessment methodology tailored to this use case, leveraging intent and entity tagging through the Exact Match (EM) metric rather than WER. The statistical tests include a standard univariate approach, but also multivariate models to identify possible mixed effects. The proposed approach is illustrated on state-of-the-art End-to-End (E2E) ASR and SLU models. The code to reproduce our results is available on GitHub111https://github.com/sonos/svc-demographic-bias-assessment.
2. Related Work
2.1. Bias Assessment
Existence of biases. A number of works investigate the disparities in performance of commercial and open source ASR systems across a variety of speaker characteristics, most of them focusing on variations of English. Among the most studied demographic variables are native vs. non-native accents (dialectal region), gender, age, and race.
Evidence is mixed regarding gender: some studies found that ASR systems favor female speakers Koenecke et al. (2020); Goldwater et al. (2010); Adda-Decker and Lamel (2005); Sawalha and Abu Shariah (2013); Feng et al. (2024) while others found that male speakers have a better recognition rate Tatman (2017); Garnerin et al. (2019, 2021), or no significant bias at all Meyer et al. (2020).
ASR systems tend to better recognize native speakers vs. non-native ones Koenecke et al. (2020); Palanica et al. (2019); Wu et al. (2020); Tatman and Kasten (2017); Tatman (2020); Feng et al. (2021, 2024) due chiefly to language variability (regional and/or socio-linguistic), accents, articulation and speech rates. Evidence of commercial ASR systems exhibiting racial biases can be found in Koenecke et al. (2020); Tatman (2017) between Black and White speakers. Finally, several studies point out that younger speakers () are better understood than children and seniors Sawalha and Abu Shariah (2013); Feng et al. (2021). This can be explained by the challenge represented by child speech due to their shorter vocal tracts, more variable speaking rate and inaccurate articulation Qian et al. (2017).
Bias assessment methodology. Most of previous work focus on the average relative degradation of the transcription accuracy (through word, character or phoneme error rates) across speaker groups (e.g. male vs. female, native vs. non-native, White vs. African-American). To the best of our knowledge, no previous work aims at quantifying demographic bias through SLU metrics.
Only a handful of prior studies propose univariate statistical tests or models to find out whether these mean variations are statistically significant. Statistical tests such as Wilcoxon Rank Sum, Kruskall-Wallis Garnerin et al. (2021, 2019) and one-way analyses of variance (ANOVA) Feng et al. (2024); Meyer et al. (2020) are used. Even fewer studies consider second order effects with, for instance, linear mixed-effects regressions Tatman (2017); DiChristofano et al. (2022) (with speaker and year as random effects) and mixed-effects Poisson regressions Liu et al. (2021) (with speaker as random effect and demographic tag of interest as fixed effect).
2.2. Available datasets
There is a lack of standard benchmarks in the literature for demographic bias assessment in voice assistants Ngueajio and Washington (2022). Though previous studies are extremely valuable, the datasets used are often small in terms of number of audio samples, speakers and transcripts variability. For instance, the one used in Tatman (2017) is made of 62 words read in isolation by 80 speakers. Other studies use internal datasets such as VoiceCommand in Liu et al. (2021). It was collected through a crowd-sourcing campaign where a limited number of 95 participants were instructed to utter voice commands. When not limited by the number of speakers, the datasets are not representative of the voice assistant use-case but instead comprise books or stories Panayotov et al. (2015); Bradlow et al. (2010), broadcast news Kalluri et al. (2021), conversational speech Oostdijk (2000); Kendall and Farrington ; Pitt et al. (2005), human-machine interaction speech Cucchiarini et al. (2006), interviews Hazirbas et al. (2021), random paragraphs Weinberger and Kunath (2011), and improvised speech Wang et al. (2021); Bradlow et al. (2010).
One of the most recent attempts to publish an open source (under the Creative Commons CC-0 license) dataset for demographic bias assessment is the Artie Bias Corpus introduced in Meyer et al. (2020), a manually annotated subset of the Common Voice Ardila et al. (2019) test set comprising audio clips ( hours), utterances, 3 gender classes, 8 age ranges and 17 English accent classes. However, the metadata is self reported and sometimes incomplete (the accent label is missing for around of the data). This dataset is also very imbalanced towards younger, male, US English speakers. As pointed out by the authors, one of the main limitations of this dataset is its small size which has a direct impact on the statistical power of the tests.
3. Sonos Voice Control Bias Assessment Dataset
The Sonos Voice Control Bias Assessment dataset addresses the usage of a voice assistant for music control, which is reported as the most common use case222Adobe Digital insights 2018, and includes audio samples in North American English ( hours) along with their transcripts, labels, and demographic metadata about the speaker. The dataset was designed mostly for evaluation purposes, but splits for training and development are also made available. Audio samples were obtained following a directed process (read speech) described in the following sections, based on transcript and label production on the one hand, and on speaker specification and selection on the other hand. The dataset is available for download and can be used for academic and/or research purposes333https://github.com/sonos/svc-demographic-bias-assessment.
3.1. Transcripts and labels
Transcripts of this dataset are divided into a set of 32 intents, each standing for a class of actions which can typically be requested within the music domain, related to playing music, controlling the music stream, requesting information, switching, grouping and ungrouping devices, and managing the user’s library. Intents can further specify optional or required entities, in the form of slots, to make their semantic interpretation, in terms of action, complete and coherent. In the case of PlayMusic or VolumeUp, such entities can be names and titles from the music domain, or level quantifiers, identified as e.g. artist or volume_level, which fill up the action of content playing with an actual, quantifiable or identifiable value. The music entities (artist, song, album) contain much more distinct values than the rest of the entities, with respectively artists, songs and albums values found in all the transcripts. There are 32 unique entities in the dataset, distributed among all intents. Transcripts and their labels (intents and slots) are generated through a semi-automated process that is beyond the scope of the present paper.
Two assistant interaction contexts are usually considered. On one hand, the PlayMusic intent (e.g. play the song Abbey Road) which is the only one related to content initiation, with music entities and arguably the most complex intent: a third of the PlayMusic queries have 3 slots or more. On the other hand, the rest of the 31 intents are denoted Transport Control intents, e.g. Forward (fast forward a little), Again (once more), or VolumeUp (play louder). They are typically short queries, of them have either 1 or no slot, and the number of possible phrasings is limited. There is a total of unique transcripts in the dataset, for the PlayMusic intent and for Transport Control intents. Appendix A.2 provides provides more insights on the ontology coverage.
3.2. Speaker demographic metadata
A total of speakers were selected following three dimensions of demographic characteristics: gender (male and female here, though we recognize that gender cannot be captured by a binary variable), age range (5 age ranges starting at 9 years old) and dialectal region. The latter dimension accounts for dialectal variation, e.g. pronunciation and intonation contrasts and fluctuations inside the United States. Six regional groups represent native speakers of American English and two groups represent non-native speakers residing in the USA, native of Asia (Asian) and Latin America (LatinX), with internal variations being expected within each region or group. More details on the choice and definition of these groups can be found in Appendix A.1.
Ethnicity was unreported in the initial version of the dataset. Though we made sure that regions (and more specifically cities) where ethnic diversity is prominent were represented in the data collection, this lack of information made it impossible to quantify bias between different racial groups. Some context can be found in Appendix A.4. We therefore launched an additional campaign targeting specifically Caucasians ( speakers) and African Americans ( speakers), present only in the test split. The gender distribution for these speakers is balanced () and the regional distribution is roughly similar to that of the rest of the dataset. However, recruiting children under 16 proved difficult, therefore constraints imposed on that age group were relaxed.
3.3. Audio samples
Each of the speakers have recorded distinct transcripts on average, except for 9 to 16 year old children ( speakers) who recorded only transcripts on average and for speakers with ethnicity information ( speakers) who recorded transcripts on average. This disparity is explained by the difficulties encountered when hiring speakers from these specific demographic groups. Recording conditions are uniformly clean and close-field.
The total number of audio samples is over unique transcripts, ( hours): ( hours) for the PlayMusic intent and ( hours) for the Transport Control intents. Train, dev and test splits are finally created by splitting speakers among speaker groups, each balanced in terms of demographic characteristics. Speaker groups 1 to 5 are used for the train ( speakers, samples) and dev ( speakers, samples) splits and speaker groups 6 to 10 for the test split ( speakers, samples). A description of the splits can be found in Table 1.
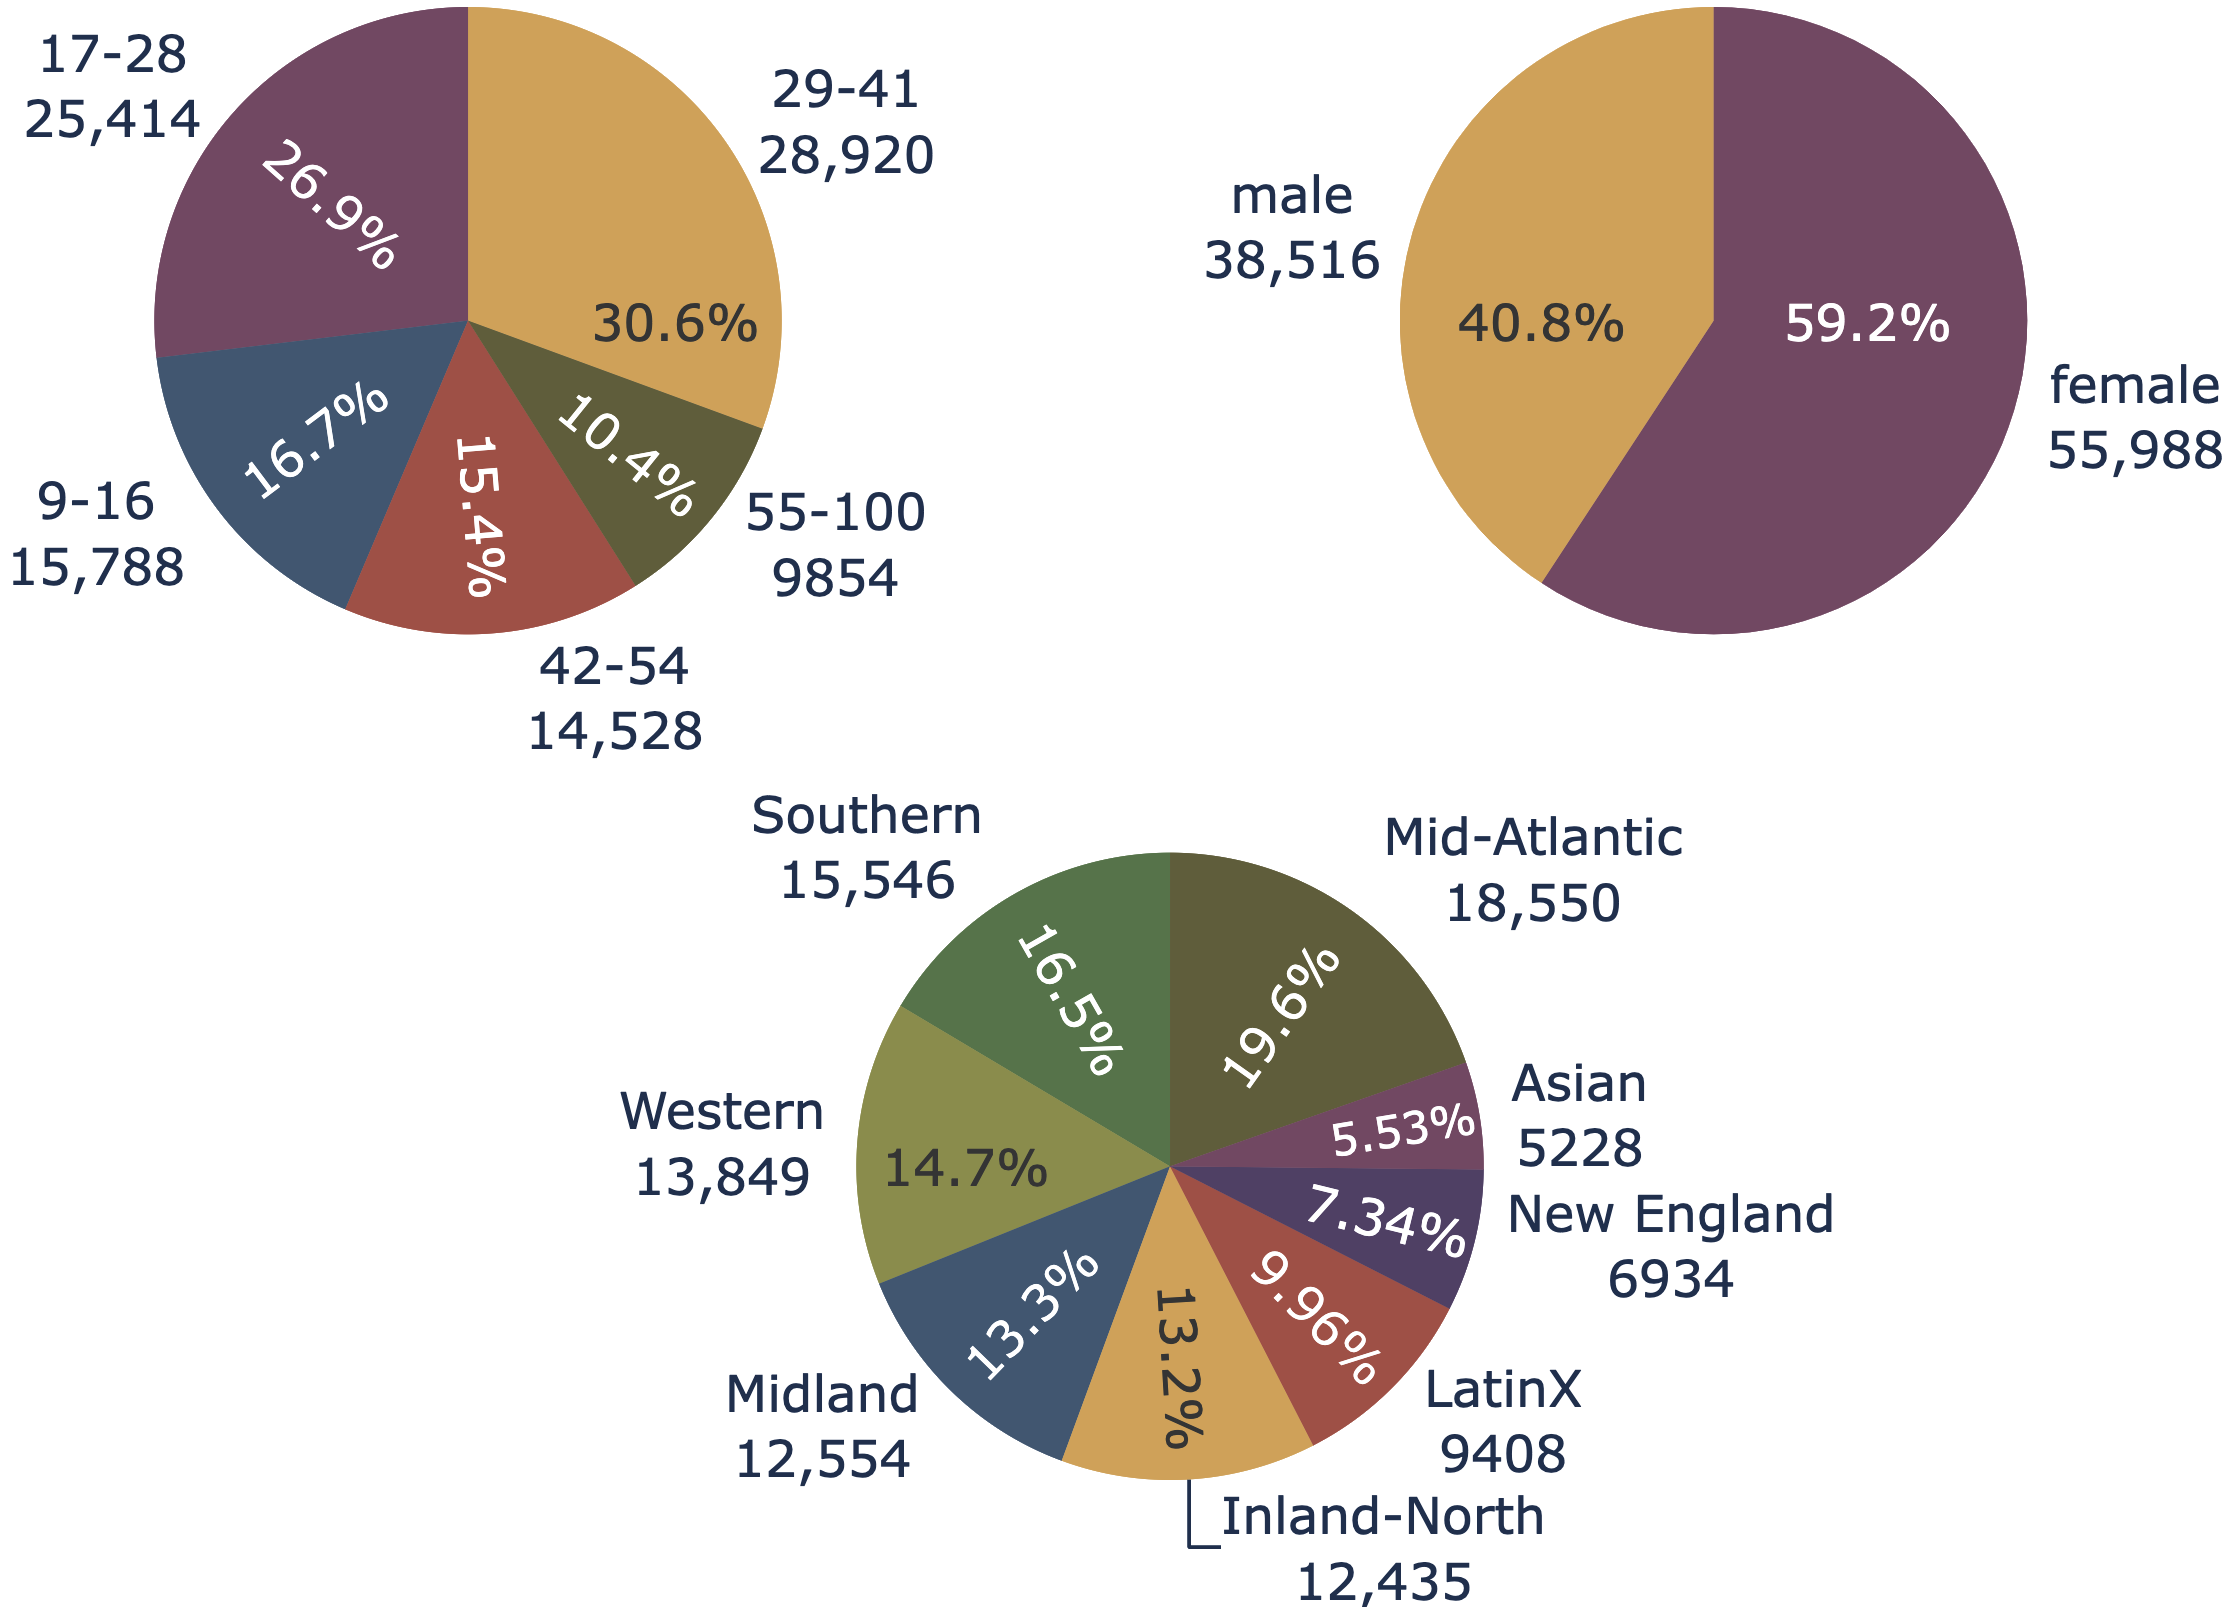
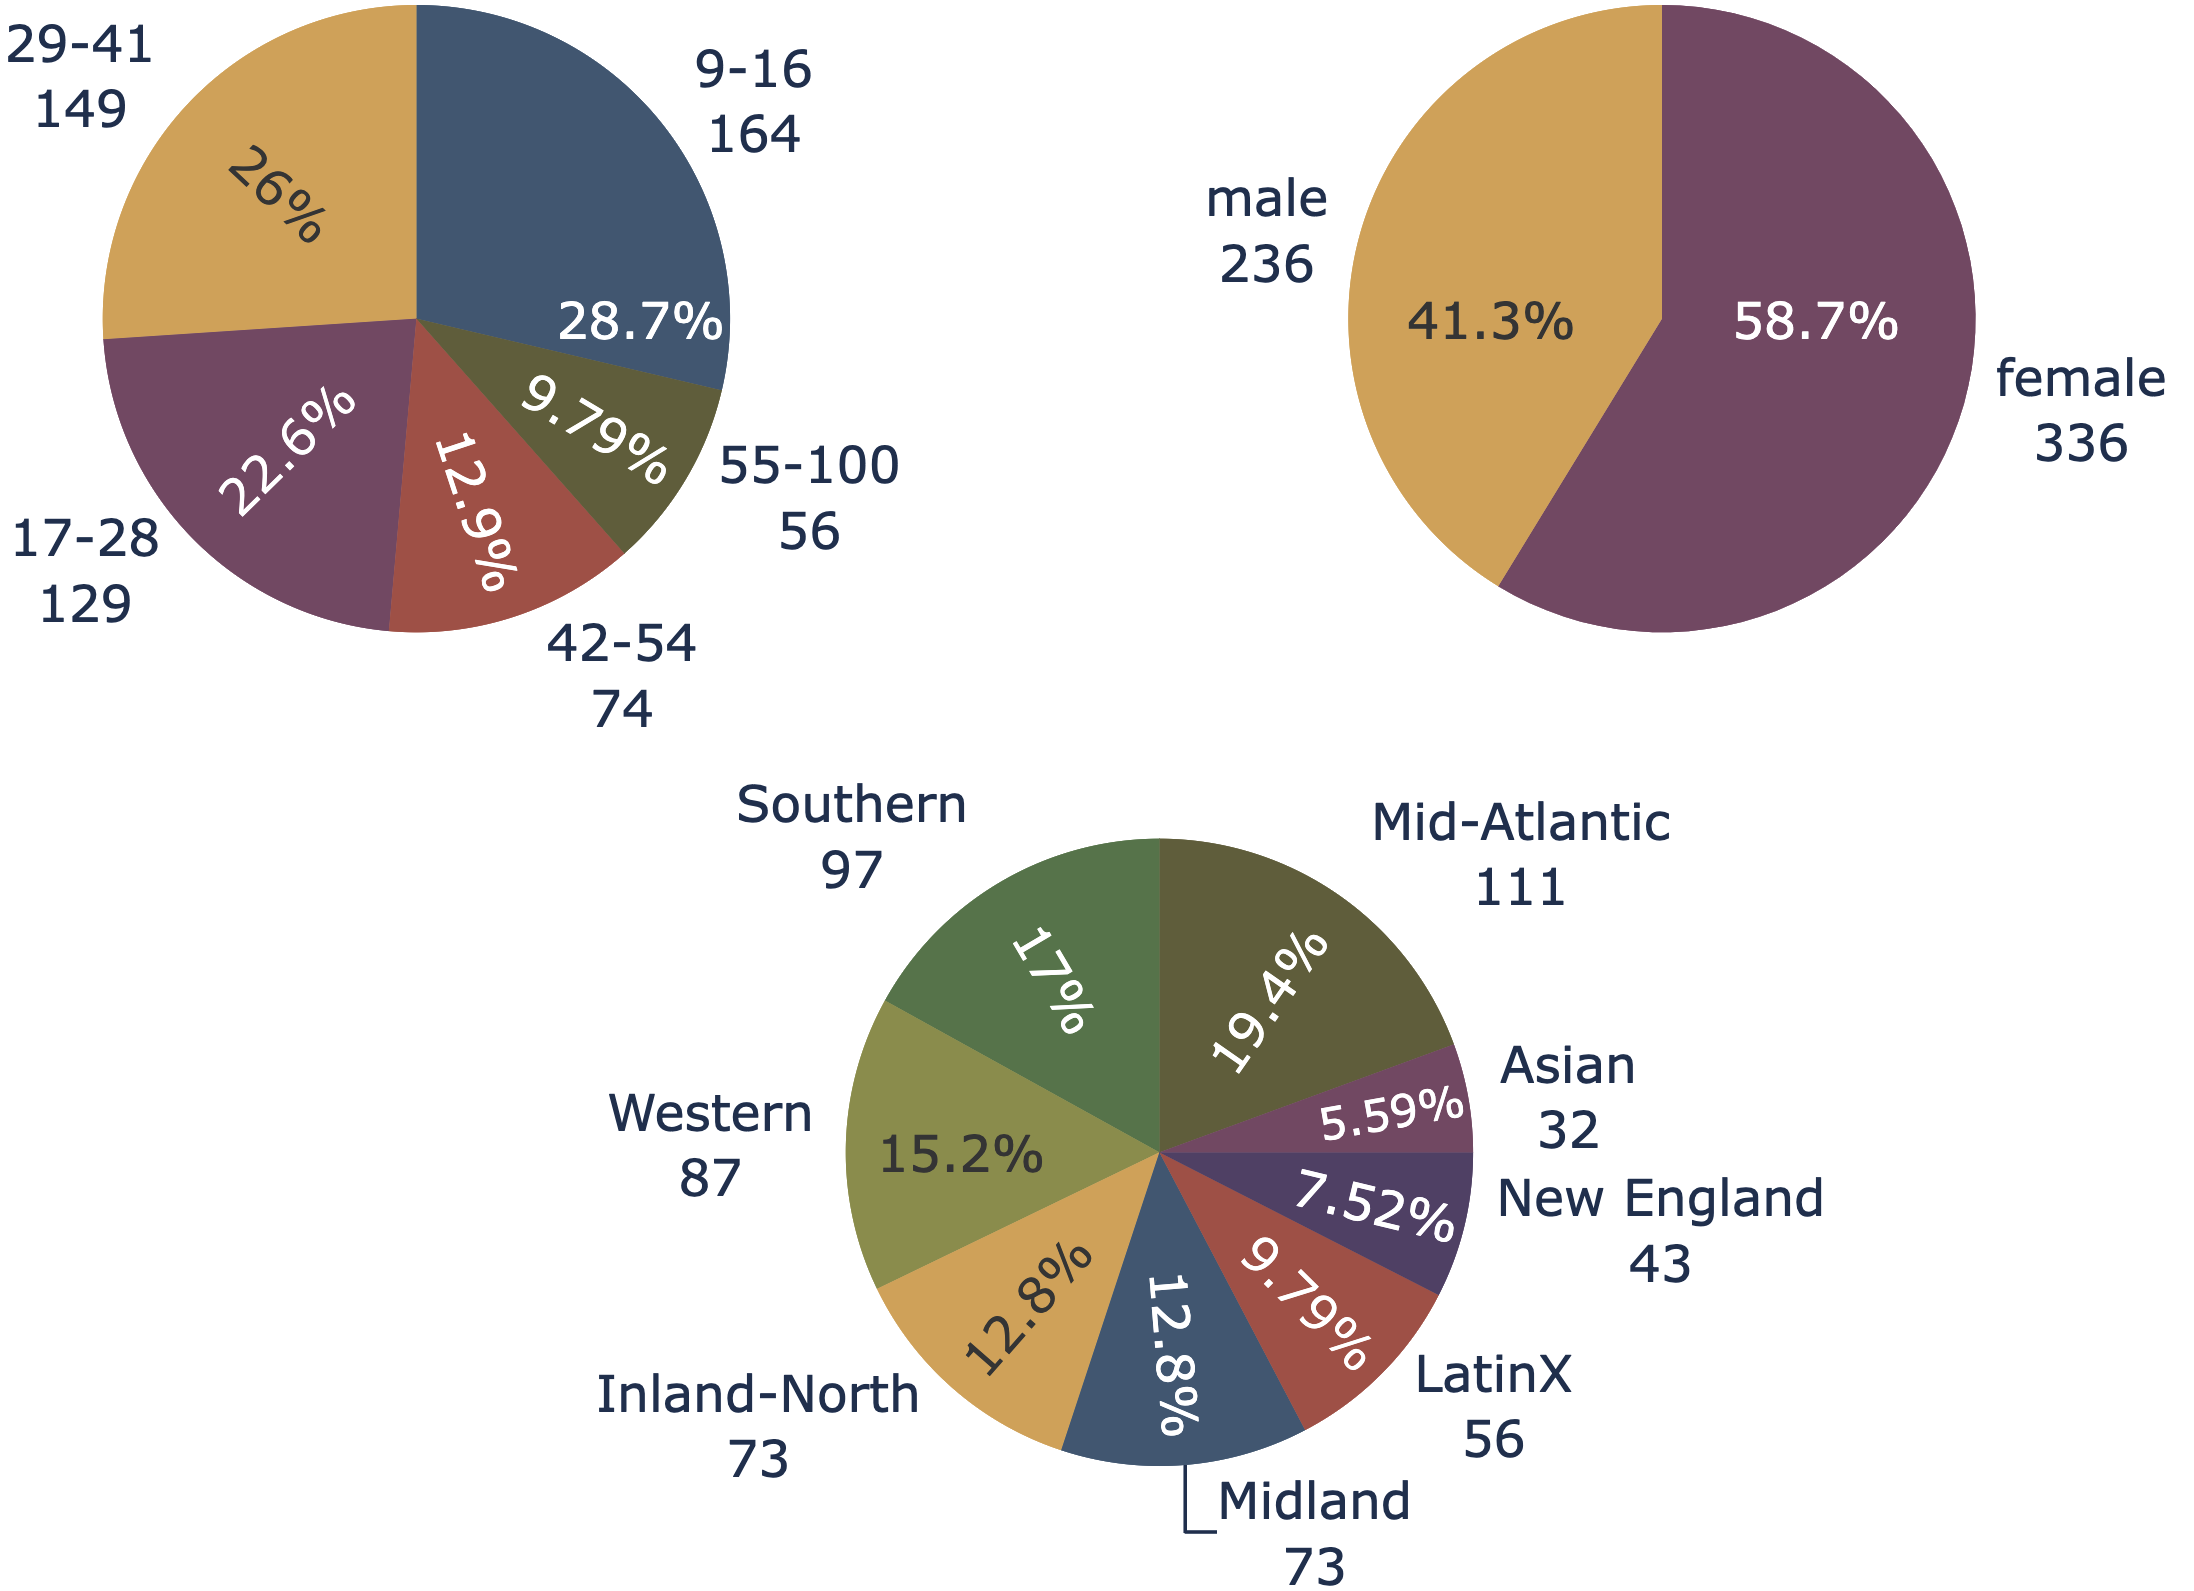
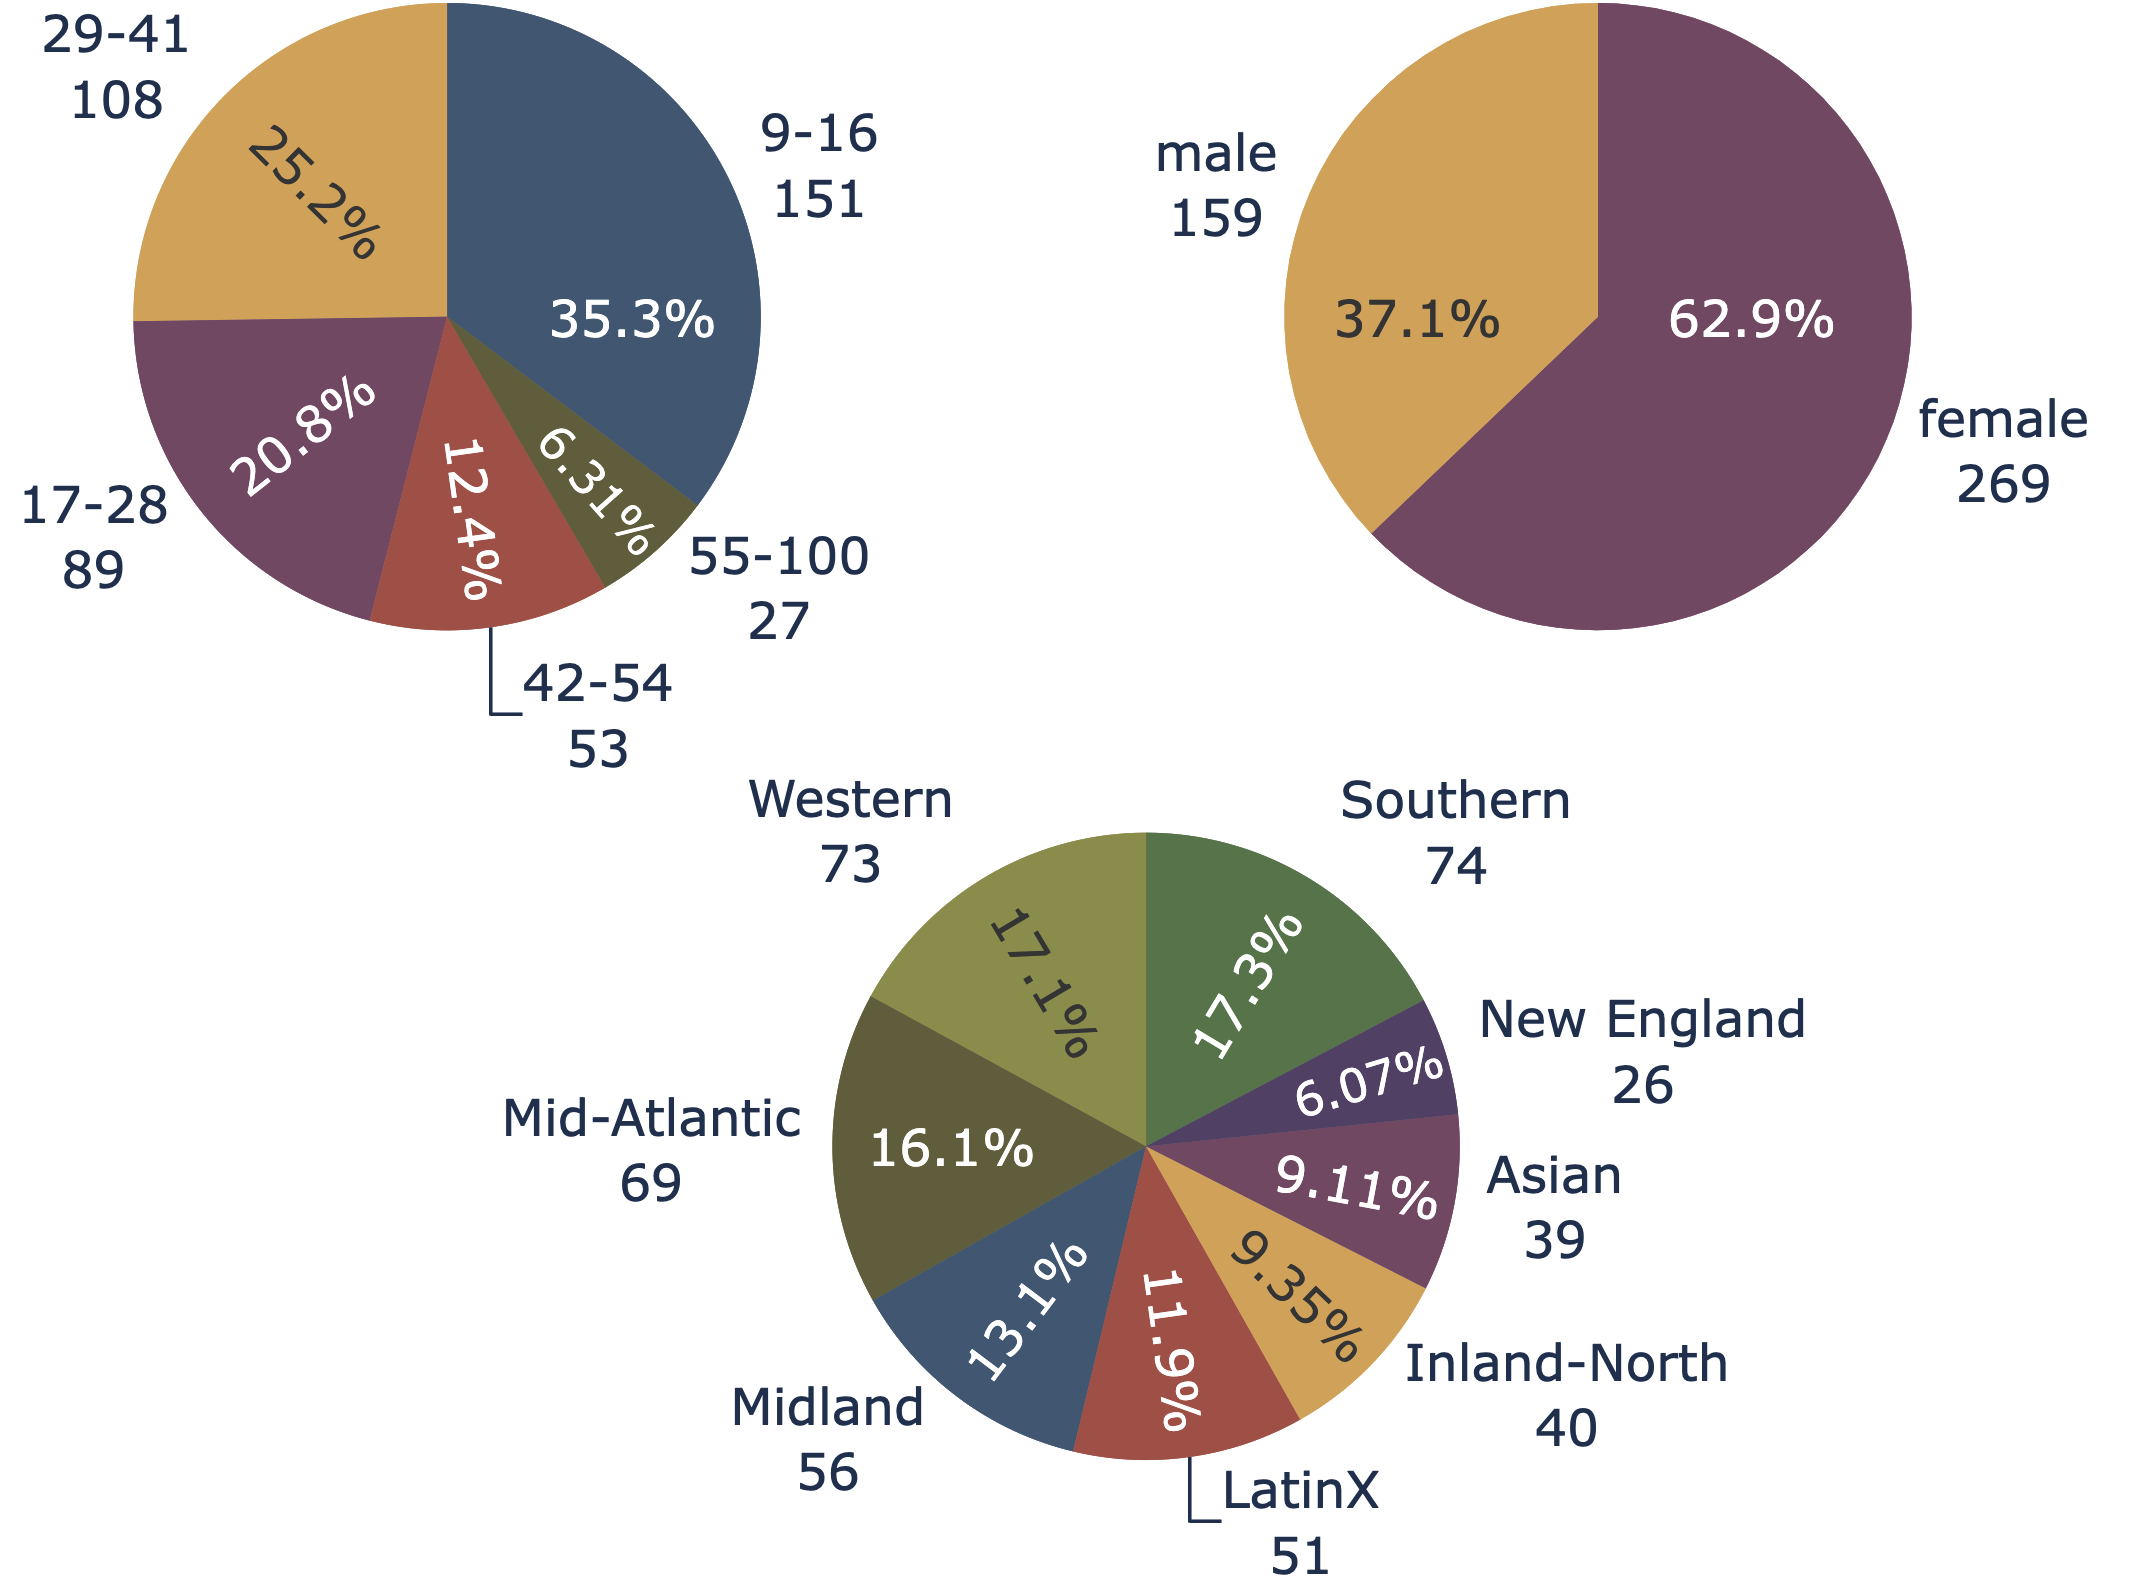
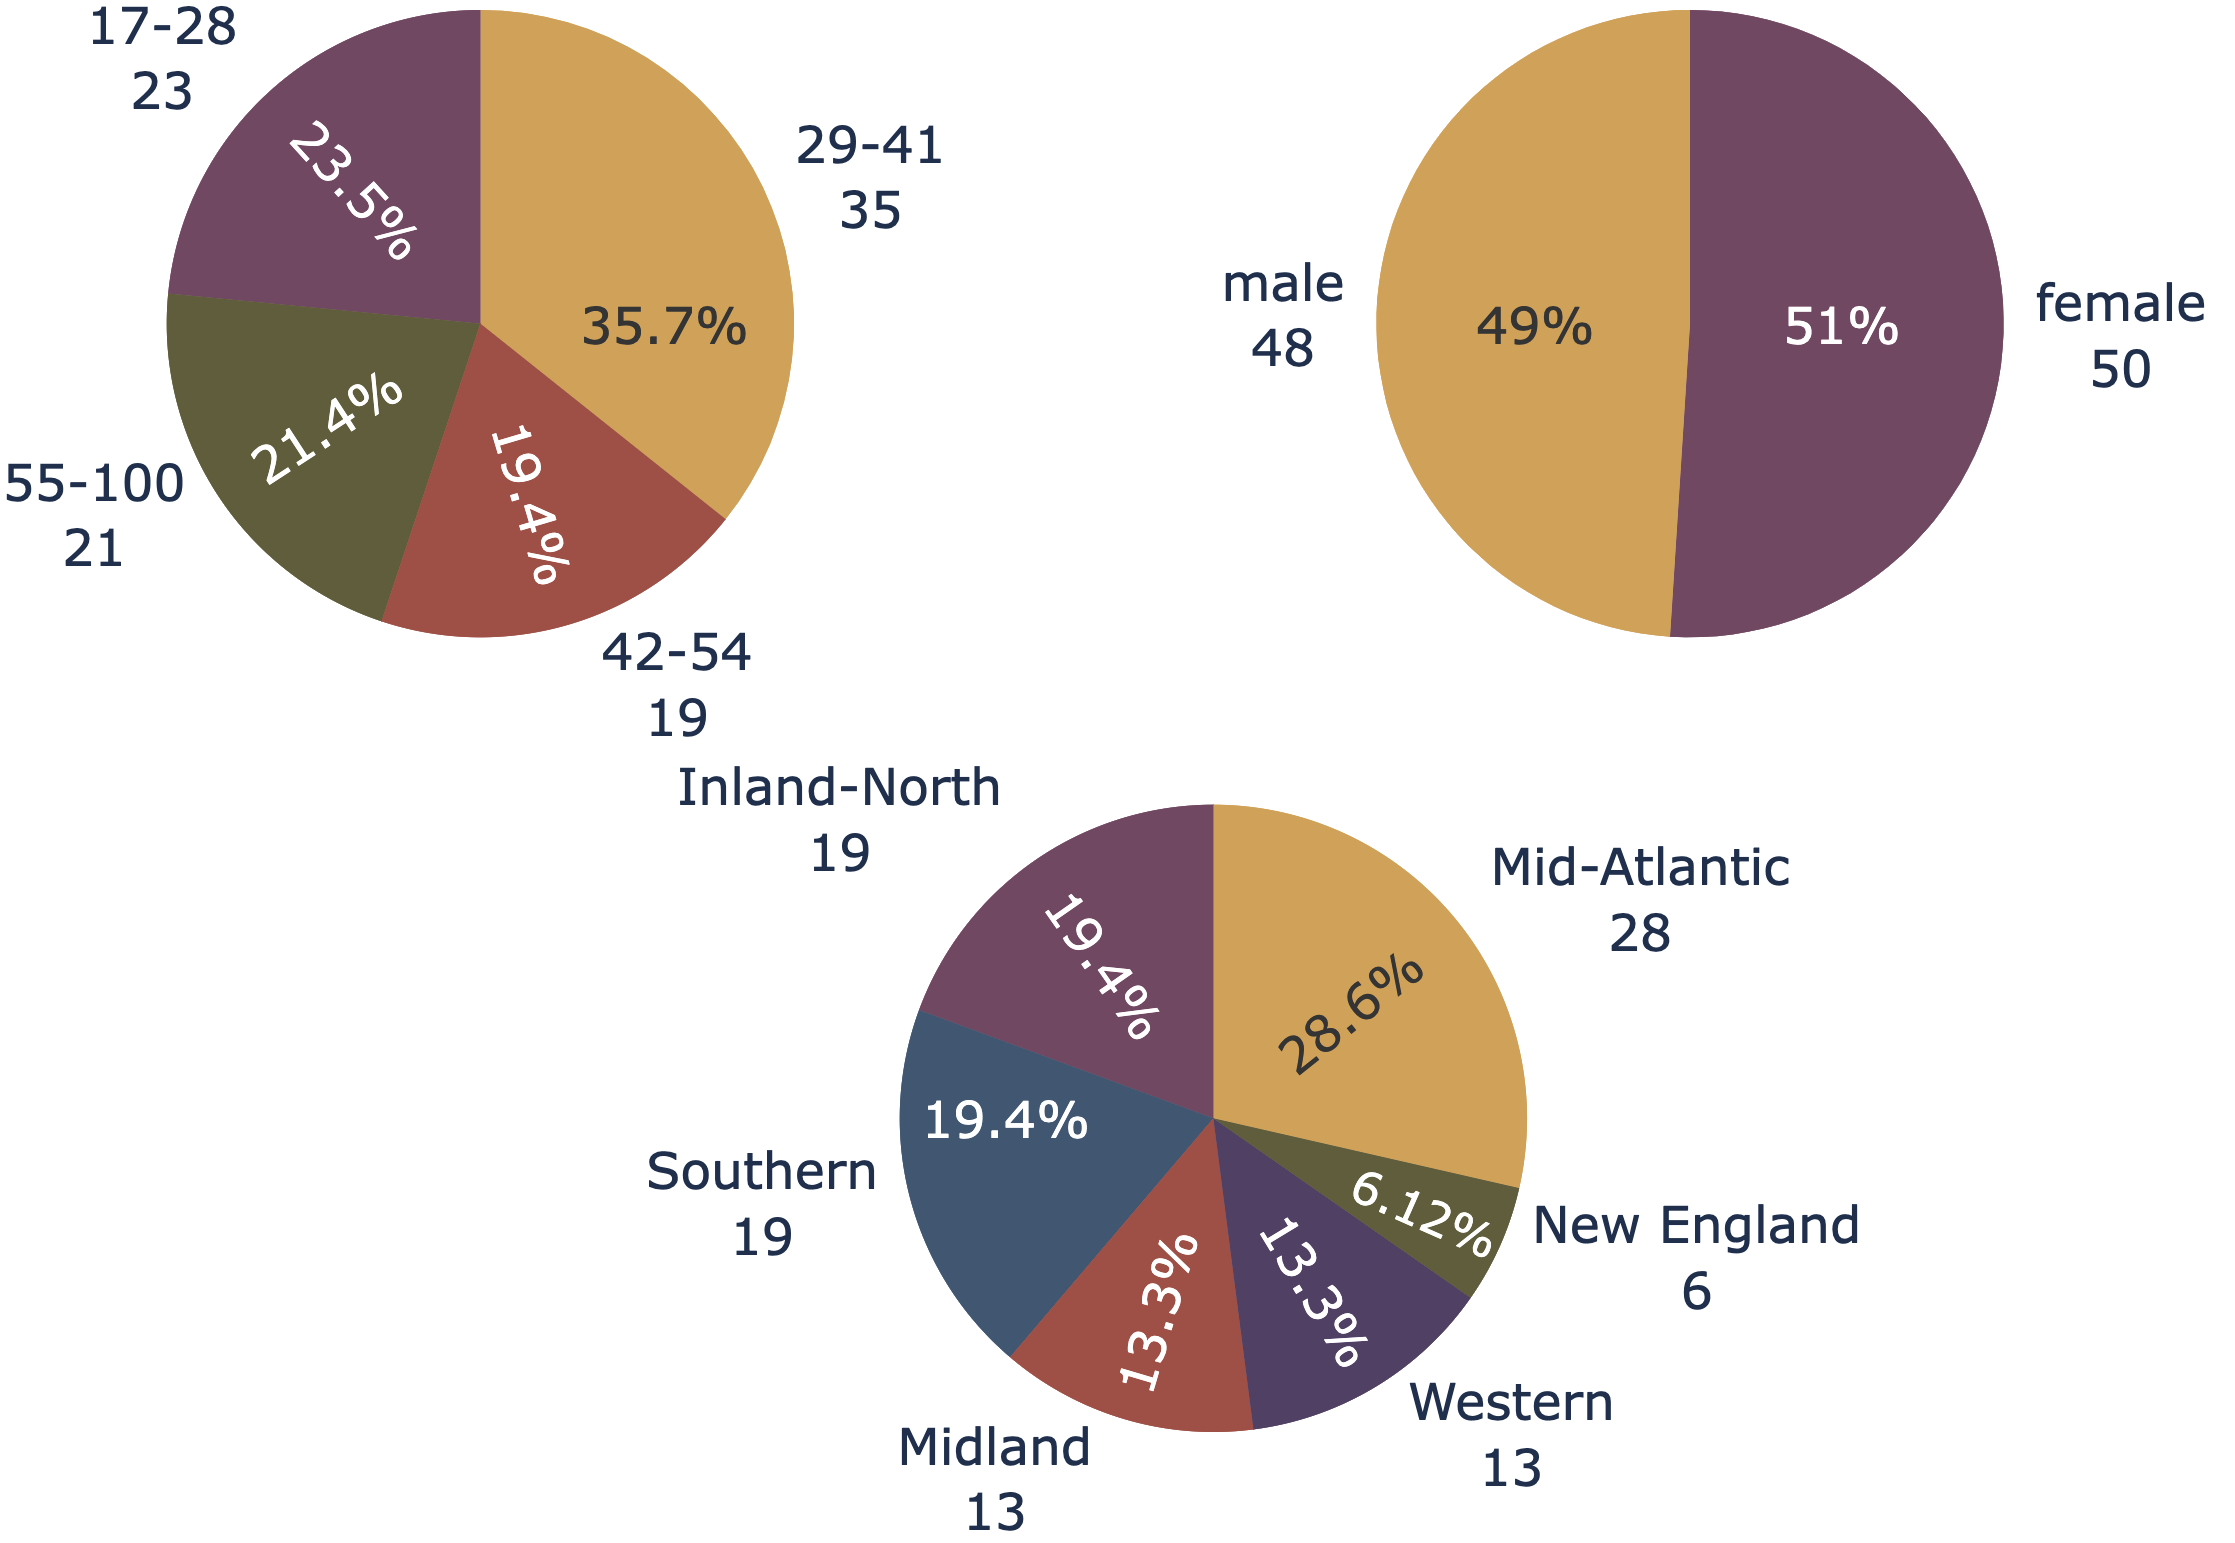
Fig. 1 displays the audio sample distribution in the test split of the dataset for each demographic group. We see that the dataset is skewed towards female and younger speakers. We also note that the LatinX and Asian groups are slightly less populated than the other dialectal regions.
| Split | Samples | Speakers | Duration |
|---|---|---|---|
| Train | : | ||
| Dev | : | ||
| Test | : |
The 3 demographic dimensions included in this dataset (gender, age, dialectal region) amount to 80 different demographic groups (not considering the smaller subset with ethnicity labels), that we tried to keep reasonably balanced by a minimum speaker distribution in each of them. As an illustration, Table 2 displays the age and gender distribution for each dialectal region in the test split. We believe that the coverage in terms of speakers and audio samples in the Sonos Voice Control dataset should allow to assess potential biases of a voice assistant related to demographic characteristics of speakers. Further descriptive statistics can be found in Appendix A and B.
| Dialectal region | Samples | Speakers | Age distribution | Gender distribution | |||||||
|---|---|---|---|---|---|---|---|---|---|---|---|
| Southern |
|
|
|||||||||
| Western |
|
|
|||||||||
| Inland North |
|
|
|||||||||
| New England |
|
|
|||||||||
| Mid Atlantic |
|
|
|||||||||
| Midland |
|
|
|||||||||
| LatinX |
|
|
|||||||||
| Asian |
|
|
3.4. Ethical considerations on the audio collection
To perform the audio collection, we commissioned a third-party data collection company to hire American English speakers (initially, later reduced to for quality reasons) who met the set of criteria we defined on ethnicity, age, gender, and dialectal regions, based on self declaration. These criteria amount to distinct demographic groups (not considering the smaller subset with known ethnicity), such as the 9-16 year old LatinX female speakers group. We further imposed a minimum number of speakers in each of these groups and a minimum amount of audio recording per speaker to guarantee a balanced distribution and enough power for the statistical tests. We provided recording scripts, as defined in 3.1.
The demographic category for a speaker was based on self declaration and no other personal information was collected apart from gender, age, dialectal region and ethnicity. We also explicitly collected consent from the speakers to re-distribute audio recordings of their voice for non-commercial academic and research purposes. The way the data was collected and will be distributed is fully compliant with the GDPR.
The third-party data collection company informed us that all participants were paid well above minimum wage. Hourly rate ranges from to per hour depending on the task requirements, such as the task duration. The estimated time of completion was tracked and adjusted based on previous collections and internal testing of each task to reflect the median time of completion.
All participant recruitment for child recordings is targeted towards parents who worked with their child(ren) to complete the recordings. The privacy policy of the third-party data collection company specifies that they do not process any personal data of children under 16 years of age without consent given or authorized by the holder of parental responsibility over the child. The payment is done directly to the parent of the child.
4. Bias Assessment Methodology
4.1. Approach
In this section, we present the proposed methodology to assess the demographic biases of any given ASR system in the specific context of a music voice assistant. The SLU metric we choose as proxy for user experience is Exact Match (EM, also called utterance-level accuracy in some works Kashiwagi et al. (2023)). An utterance is said to be exactly parsed () if both the correct intent and all the correct slots are retrieved (else ). In the case of a music voice assistant, EM is particularly relevant due to the intrinsic complexity of the slots values, especially artists or songs names that may be cross-lingual (e.g. Spanish songs or artists in an English request) and might be harder to pronounce for some demographic groups.
We propose to conduct statistical tests with logistic regressions McCullagh and Nelder (1989) in order to assess the presence of demographic bias within the SLU system, i.e. to show whether the observed performance disparities are significant. EM serves as binary response variable for the tests. The subpopulations of interest are described by categorical explanatory variables: gender, age, dialectal region, and ethnicity.
Statistical testing with logistic regression helps to identify the effect of a single variable (e.g. singling out the effect of gender), via univariate models (Section 4.2.1) on the one hand. It also allows for identification of mixed effects (e.g. dialectal region and gender) through multivariate approaches (Section 4.2.2) on the other hand, as there could be demographic correlation between variables. In any case, a descriptive analysis of the data is always needed for the interpretation of such tests.
The proposed methodology is valid under several conditions. First, we assume that each observation is independent, i.e. we do not take into account the speaker-level effect. We may therefore operate at the utterance-level for clarity of the interpretation and results. Second, we suppose that the speakers in our dataset are representative of their sub-group. Third, we expect the response variable (EM) to be a function of a linear combination of the considered explanatory variables (age, gender, dialectal region, ethnicity). Finally, we presume that the transcripts’ difficulty is uniformly distributed among speakers (i.e. there are no speakers who have more complicated utterances to pronounce than others).
4.2. Statistical Analysis
4.2.1. Univariate models
Logistic regression is a powerful statistical tool to measure demographic bias: it can shed light on the magnitude of the bias on the response variable through the estimated coefficients (fitted via maximum likelihood) and odds ratios (ORs). The probability that the Exact Match for observation is : can be estimated by taking a monotonic real function such that , for instance the logit function:
| (1) |
and the value of the explanatory variable for observation , its associated coefficient and a constant. The corresponding odds is:
| (2) |
i.e. given , it is the relative chance of having compared to .
Illustrating this on the binary explanatory variable gender, with , the OR is defined as:
| (3) |
i.e. represents the odds of a male speaker to be exactly parsed compared to a female one, all other things being equal. If , then gender has no impact on (independence).
Additionally, we perform hypothesis testing (Wald test Wald (1943)) on the estimated parameter where the null is . The latter is rejected at the -level if the corresponding p-value is lower than . This can be easily extended to non-binary categorical variables by following the method described in 4.2.2. It is used to test if all coefficients but the constant are null. Rejecting this null hypothesis means that at least one estimated coefficient is not null, but it does not inform us on which one it is. To get a better grasp at which modality impacts the EM with respect to the reference modality, one must look at the individual p-values of each coefficient (or, equivalently, at the confidence intervals of the ORs). Note that every coefficient must be interpreted with respect to the reference group (e.g. female in the above example).
4.2.2. Multivariate models
As mentioned previously, there might be confounding variables that could lead to spurious correlations and impact the statistical validity of our analysis. Gender is often described as such in the literature Tatman (2017) and age can be another one. To uncover such potential issues, we perform adjustment tests by augmenting the previous univariate models. For the sake of simplicity, let’s illustrate the approach with two discrete variables: gender () and dialectal region (, with modalities, leaving out the reference group). For the observation , the multivariate model writes:
| (4) |
To assert whether gender could be a potential confusion variable with respect to the dialectal region (i.e. are observed differences in EMs between dialectal regions due to gender imbalance?), we compare model (4) to the univariate one:
| (5) |
Our proposed procedure to assess whether adding gender to the model adds significance, i.e. , is as follows:
-
•
Maximum Likelihood Estimation (MLE) of and .
-
•
Log-likelihood ratio test (LLR). is the log-likelihood (natural logarithm of the MLE function) of (5) and the one of (4). Under , the test statistic where is the difference between the number of parameters of the two models. Similarly as before, can be rejected at the -level when , where is the test statistic and the quantile of a distribution with degrees of freedom.
Rejecting implies that gender adds information to the model. To further assess whether it confounds the effect of the dialectal region, we compare the p-values of the coefficients associated to the dialectal regions in (4) and (5). If the conclusions of the Wald tests in (5) are changed (i.e. p-values becoming lower or greater than the level), we can say that gender is a confounding factor for dialectal region, else there is no statistical evidence supporting this claim.
5. Bias Assessment Experiments
In the following we propose an illustration of the proposed statistical method for bias assessment on the SLU task. To do so, we take an off-the-shelf ASR model (wav2vec2.0 from Baevski et al. (2020)) that we fine-tune on part of the train split of Sonos Voice Control bias assessment dataset to get audio transcription. Intent Classification (IC), Slot Filling (SF) and computation of the EM metric are done by using a JointBERT SLU model Chen et al. (2019). The goal of this Section is to demonstrate the capabilities of our proposed dataset and methodology to quantify demographic bias in voice assistants. Consequently, the ASR and SLU models have not been particularly optimized for bias mitigation.
5.1. Models
ASR model description. The chosen ASR is an E2E Wav2Vec2-Large-960h model, developed by Meta and pre-trained using self-supervised learning (SSL) on hours of English speech data from the Librispeech dataset introduced by Panayotov et al. (2015) and fine-tuned on a subset of the train split of the Sonos Voice Control bias assessment dataset: audio samples from speaker groups 2 and 3 ( speakers). It represents audio samples which amounts to hours of data. The entire dev split is used for validation.
In addition to the large wav2vec2.0 model, we incorporate an extra layer with neurons and LeakyReLU as the activation function followed by a fully-connected layer and a final -dimensional softmax layer, each dimension corresponding to a character. This neural network architecture comprises a total of M trainable parameters. The weights of the two added layers were randomly initialized, while the weights of the wav2vec2.0 were initialized using the pre-trained weights.
This SSL model is then fine-tuned with the additional layers, with a batch size of , distributed across 4 NVIDIA V100 32GB GPU cards. Two optimizers are used: Adadelta Zeiler (2012) for updating the additional layers’ weights and Adam Kingma and Ba (2014) for fine-tuning the SSL model, with initial learning rates of and respectively. The maximum number of epochs is set to : the best model on the validation is obtained at epoch , with a word error rate of on the dev split of the Sonos Voice Control bias assessment dataset. Processing an entire epoch takes around 52 minutes. During the fine-tuning process, a SpecAugment data augmentation technique was applied to the audio signal Park et al. (2019). The ASR system has been implemented by using the open source Speechbrain toolkit Ravanelli et al. (2021).
SLU model description. The SLU model is the bert-base-uncased version of the JointBERT Chen et al. (2019) model, pre-trained on BookCorpus (M words) Zhu et al. (2015) and English Wikipedia (M words). One linear layer is added on top of BERT and the IC weight in the cross-entropy loss is set to . The batch size is and the transcripts are sorted by length and grouped into length buckets of size in order to ensure that batches are not padded too much. The whole network (M parameters) is fine-tuned on the transcripts and labels of the full train split of the Sonos Voice Control dataset. During training, each transcript has been augmented once by replacing slot values by randomly drawing from all possible values in the train split. We use the Adam optimizer with a learning rate of ; no dropout is applied. We train the model for epochs and select the checkpoint achieving the smallest weighted cross-entropy loss on the dev set as final model.
5.2. Results
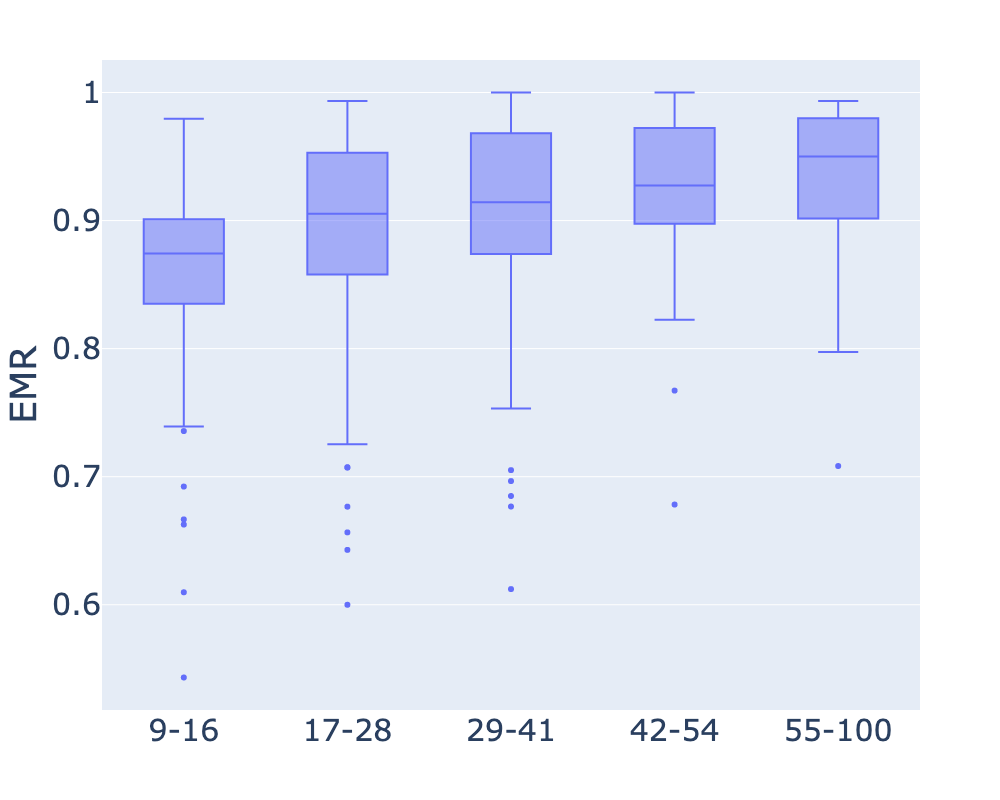
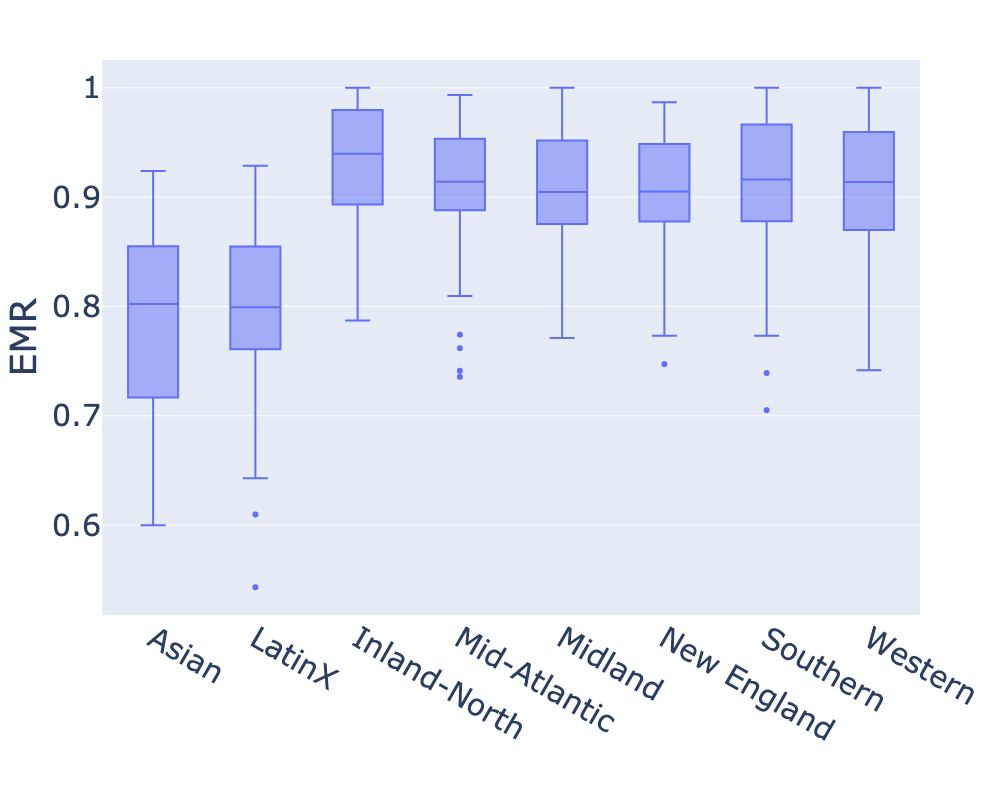
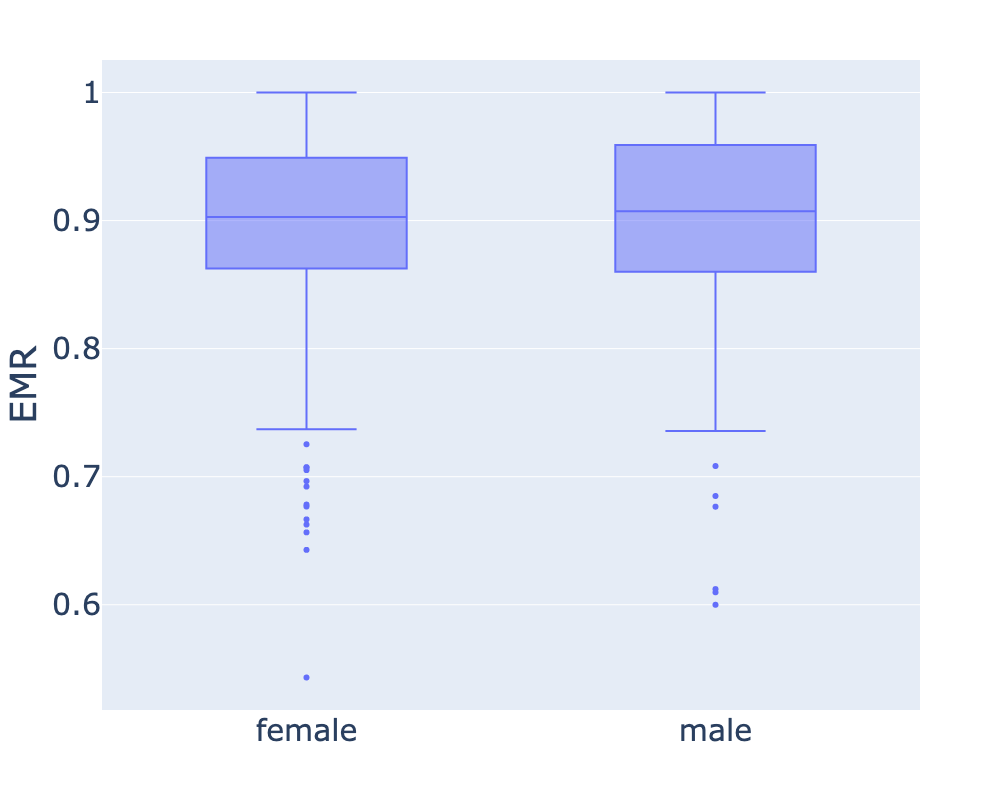
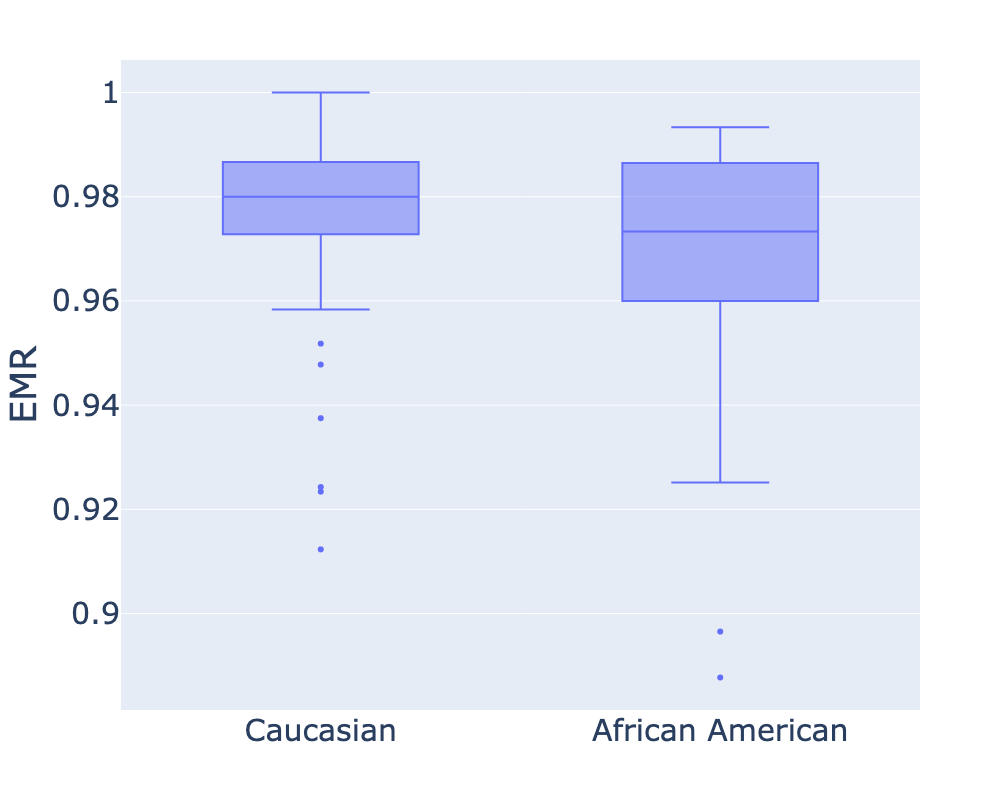
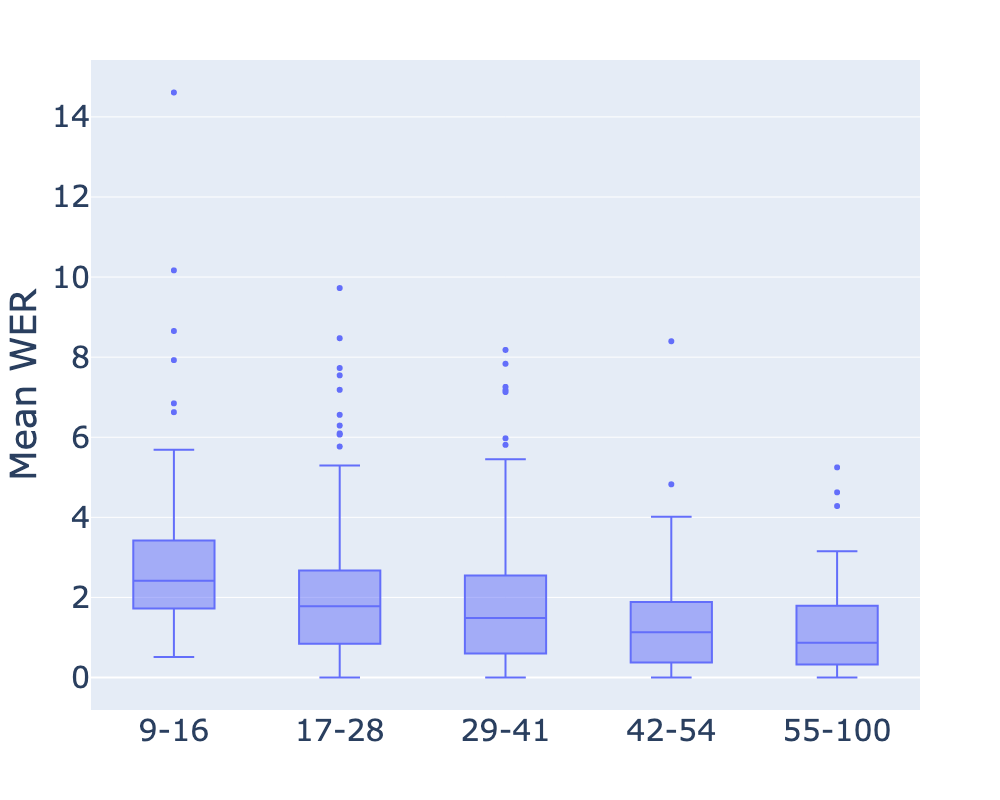
We compute the Exact Match Ratio (EMR, the fraction of exactly parsed audio samples) on the test split, using the fine-tuned E2E model for audio transcription and the fine-tuned SLU model to retrieve intents and slots. We find an EMR of ( for PlayMusic and for TransportControl) and a WER of . The variation of EMR per demographic group can be found in Figure 2. Some individual speakers (outlier points) are much less well understood than others in the same demographic group. This is consistent with the literature Tatman and Kasten (2017); Tatman (2020); Feng et al. (2024). Consideration on speaker variability and more details on WER can be found in Appendix C.
 |
 |
| (a) Age group | (b) Dialectal region |
 |
 |
| (c) Gender | (d) Ethnicity |
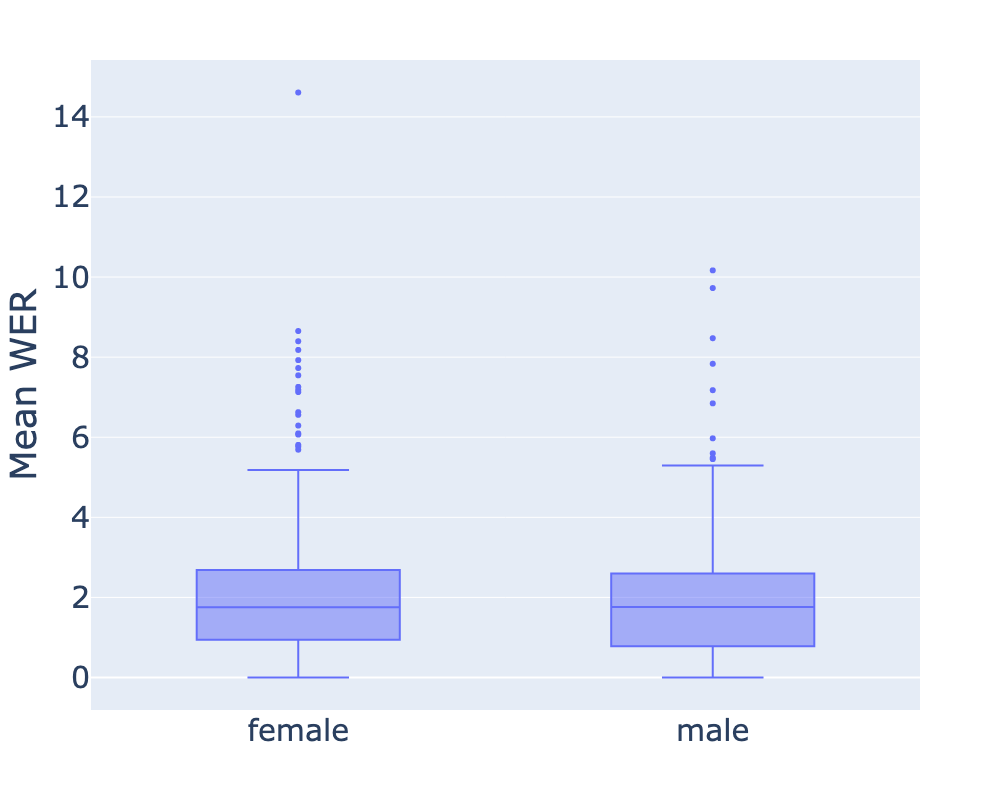
Applying the method described in Section 4, we find statistically significant evidence of bias for all considered explanatory variables in the univariate setting at the level. Regarding gender, men are significantly better recognized than women (, ). However, the OR is very close to and we see in panel (c) of Figure 2 that the difference is slim.
Tests on the age variable show that children are not recognized as well (, for the 9-16 group) as younger adults (17-28yo, reference group), while older groups are increasingly better recognized (ORs are , , and for 29-41, 42-54, and 55-100 respectively, all p-values are ). Interestingly, we note that when isolating Transport Control requests only (simpler patterns, without music entities; see Section 3.1 for the exact definition), the disparities observed between children and younger adults are not statistically significant anymore ().
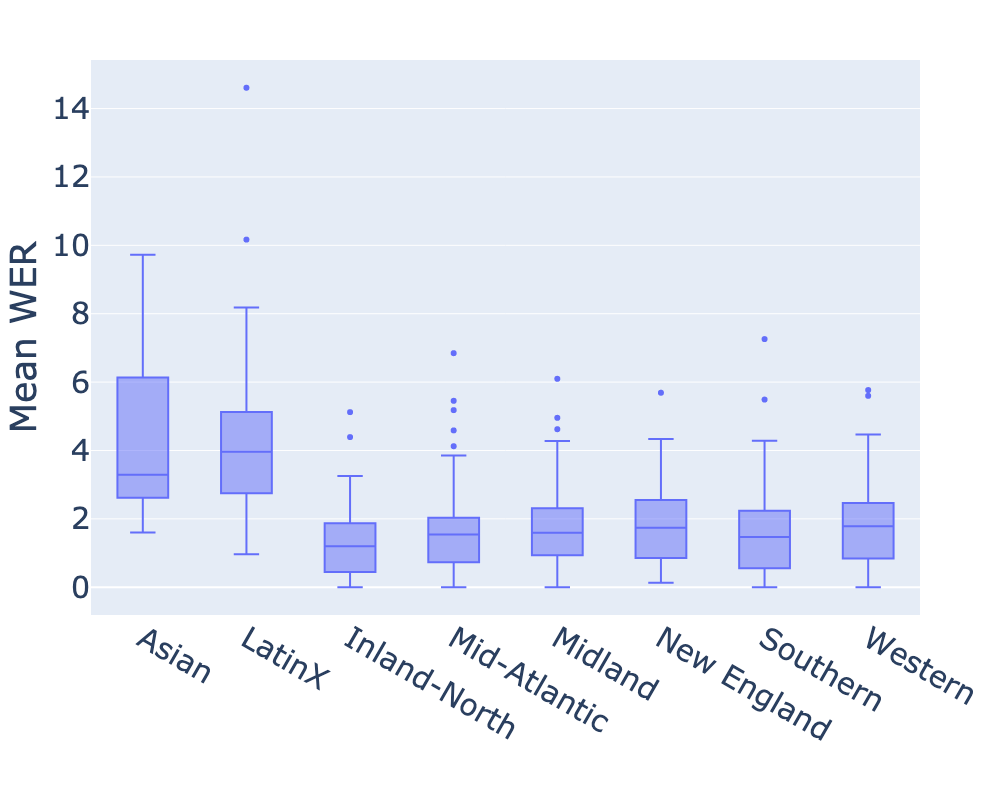
For dialectal region, every group is better recognized than the Asian reference group. However, while requests from all American regional groups have around 3 times more chance to be exactly parsed than Asians’ (ORs are around , all p-values are ), this is only just slightly the case for the LatinX group (). This is clearly visible in panel (b) of Figure 2. On the smaller ethnicity dataset, we found that Caucasian speakers are better understood than African Americans (, ). Additional univariate tests were performed; results can be found in Appendix C.1.
The multivariate analysis introduced in Section 4.2.2 is key to shine light on possible mixed effects. We detect several confusion variables. On one hand, dialect is a confounding factor for gender: the LLR test is statistically significant () and the coefficient associated to male is no longer significant (). The difference observed in the univariate case for gender was actually due to the dialectal region. This hypothesis is confirmed by the gender distribution of the Asian group found in Table 2 (and to a lesser extent of the LatinX group): it is more skewed towards female speakers, while being also less well recognized than the other groups.
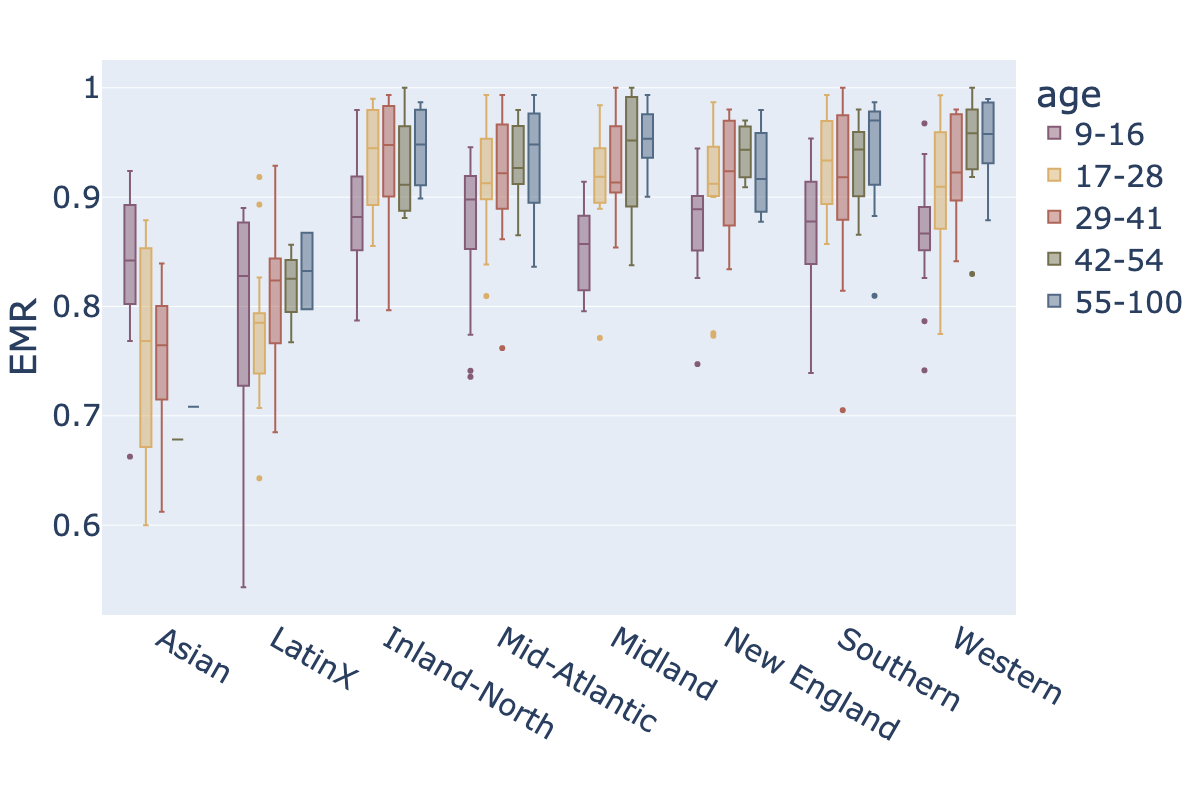
On the other hand, combining dialectal region and age brings more significance to the model as in both cases (adjustments of dialectal region on age and of age on dialectal region), is rejected (respectively, and ). The conclusions of the respective univariate tests are not changed (Wald p-values are still lower than ). However a cross-effect of age and dialectal region is brought to light since the corresponding ORs decrease from the univariate to the multivariate case (for instance, from to for the Mid-Atlantic group). This means that some of the difference observed between dialectal regions is actually due to the age disparity (and vice versa). This effect can be seen in Figure 3. Interestingly, younger Asian and LatinX speakers are better understood while it is the opposite for American regional groups.
By restricting our multivariate analysis to the subset of observations for which we have the ethnicity label, we did not find evidence of any confusion bias between ethnicity and the other demographic groups. Appendix C.2 displays the exhaustive and systematic analysis of all multivariate tests.
6. Conclusion and Discussion
This paper introduces the Sonos Voice Control bias assessment dataset, an open corpus made of audio samples ( hours) from different speakers with their transcripts, labels and demographic tags (age, gender, dialectal region and ethnicity). We also propose a statistical bias assessment methodology (open sourcing its implementation), at the univariate and multivariate levels, tailored to the specific context of voice assistants. We consider Spoken Language Understanding (SLU) metrics measuring the interpretability of a user’s request, rather than the standard transcription accuracy, as we believe it is more representative of end-to-end user experience. After describing the dataset (Section 3) and the statistical methodology (Section 4), their capabilities are illustrated with state-of-the-art ASR and SLU models (Section 5). Results on this example show statistically significant disparities in terms of SLU metrics across age, dialectal region and ethnicity. Second-order considerations allow to unveil mixed effects between dialectal region, gender and age. We hope that releasing this dataset and statistical methodology will foster research on demographic bias for voice assistants.
We identify several limitations in this study. Descriptive analysis of the dataset shows that the empirical distribution of a demographic variable of interest is not the same for the different modalities of another demographic variable of interest (e.g. distribution of gender across dialectal regions; Table 2). These differences are statistically significant (unveiled by non-parametric independence tests; results are not presented here). Therefore there is a selection bias in our dataset leading to a confusion bias when analyzing data. It has to be taken into account for results’ interpretation and motivates the need to perform multivariate analysis in addition to univariate tests (as seen with gender in Section 5.2).
A side effect of controlling the request distribution in the dataset, so that they are representative of a voice assistant in the music domain, is that the recorded samples are not spontaneous, but must follow an imposed transcript. This setting creates two main limitations in the dataset that might amplify bias against some demographic groups. First, evidence shows that the performance of ASR systems degrades in spontaneous speech conditions Nakamura et al. (2008) and this degradation may not be uniform across all groups. Second, imposing the transcript necessarily erases possible lexical and grammatical particularities of each population, which might also amplify bias.
However, recent research seems to suggest that observed disparities in speech recognition accuracy rather stem from the acoustic model rather than the language model Koenecke et al. (2020). Moreover, the music voice assistant use case is constrained to a small number of possible phrasings (think about how one can ask about a song, an artist or a volume set). This dampens the effects of variability in wording. Moreover, while reading is not a perfect simulation for speech that is directed at voice assistants, it allows for controlled collection and is the only feasible option for large-scale data collection such as ours.
We also want to emphasize that the demographic description of the speakers in the dataset has evidently strong limitations in terms of linguistic, social and geopolitical representation, and is only acceptable in terms of the linguistic approximations required for the use case at hand. In addition, any regional split over dialectal variation can be considered as arbitrary, since it generalises over partial demographic estimations and since dialectal variation can be viewed as a linguistic continuum rather than a set of contiguous spaces. We also only consider a binary view of gender while there are more fluid experiences. Other factors such as literacy, level of education, social, cultural and economical background DiChristofano et al. (2022); Chan et al. (2022) could be taken into account, as well as possible speech impairments (e.g. dysarthria in Tu et al. (2016); Moro-Velazquez et al. (2019) or cleft lip and palate Schuster et al. (2006)).
Moreover, modeling explicitly the speaker effect in the statistical analysis is possible (as a random effect for instance as in Liu et al. (2021)) but would increase the complexity of our approach without bringing massive improvements. We argue that the main goal of this paper is to propose a simple yet effective statistical methodology to assess the demographic bias of any given SLU system and provide clear interpretation of the results.
Future work includes considering narrower age ranges to study the effects of younger children without reading capabilities, or elderly adults whose speech patterns may deviate significantly from standard speech. On another topic, it will be extremely interesting to generate far-field and noisy versions of the dataset by simulating realistic acoustic conditions (through room impulse response and reverberation simulation for instance): the performance of ASR systems is indeed particularly degraded in these conditions, while they are typical of domestic voice assistant usage.
7. Acknowledgements
We would like to thank the team of linguists at Sonos for their invaluable expertise and guidance throughout this project, we are especially grateful to Claudia Garber (Sonos) for her contributions to the discussion section, the Appendix, and help reviewing the paper. Thomas Nigoghossian (Sonos) provided valuable insight with the JointBERT NLU training. We thank Dr. Odette Scharenborg (Delft University of Technology) for fruitful discussions and support.
8. Bibliographical References
- Adda-Decker and Lamel (2005) Martine Adda-Decker and Lori Lamel. 2005. Do speech recognizers prefer female speakers? In Interspeech.
- Baevski et al. (2020) Alexei Baevski, Yuhao Zhou, Abdelrahman Mohamed, and Michael Auli. 2020. wav2vec 2.0: A framework for self-supervised learning of speech representations. In Advances in Neural Information Processing Systems, volume 33, pages 12449–12460. Curran Associates, Inc.
- Braithwaite and Kleijn (2019) Daniel T. Braithwaite and W. Bastiaan Kleijn. 2019. Speech enhancement with variance constrained autoencoders. In Interspeech 2019, 20th Annual Conference of the International Speech Communication Association, Graz, Austria, 15-19 September 2019, pages 1831–1835. ISCA.
- Chan et al. (2022) May Pik Yu Chan, Jun Choe, Aini Li, Yiran Chen, Xin Gao, and Nicole R. Holliday. 2022. Training and typological bias in asr performance for world englishes. In Interspeech.
- Chen et al. (2019) Qian Chen, Zhu Zhuo, and Wen Wang. 2019. Bert for joint intent classification and slot filling. CoRR, abs/1902.10909.
- Défossez et al. (2020) Alexandre Défossez, Gabriel Synnaeve, and Yossi Adi. 2020. Real time speech enhancement in the waveform domain. Proceedings of the Annual Conference of the International Speech Communication Association, INTERSPEECH, 2020-October:3291–3295.
- DiChristofano et al. (2022) Alex DiChristofano, Henry Shuster, Shefali Chandra, and Neal Patwari. 2022. Performance disparities between accents in automatic speech recognition. ArXiv, abs/2208.01157.
- Feng et al. (2024) Siyuan Feng, Bence Mark Halpern, Olya Kudina, and Odette Scharenborg. 2024. Towards inclusive automatic speech recognition. Computer Speech & Language, 84:101567.
- Feng et al. (2021) Siyuan Feng, Olya Kudina, Bence Mark Halpern, and Odette Scharenborg. 2021. Quantifying bias in automatic speech recognition. CoRR, abs/2103.15122.
- Fok et al. (2018) Raymond Fok, Harmanpreet Kaur, Skanda Palani, Martez E. Mott, and Walter S. Lasecki. 2018. Towards more robust speech interactions for deaf and hard of hearing users. In Proceedings of the 20th International ACM SIGACCESS Conference on Computers and Accessibility, ASSETS ’18, page 57–67, New York, NY, USA. Association for Computing Machinery.
- Garnerin et al. (2019) Mahault Garnerin, Solange Rossato, and Laurent Besacier. 2019. Gender representation in french broadcast corpora and its impact on asr performance. In AI4TV@MM, pages 3–9. ACM.
- Garnerin et al. (2021) Mahault Garnerin, Solange Rossato, and Laurent Besacier. 2021. Investigating the impact of gender representation in ASR training data: a case study on librispeech. In Proceedings of the 3rd Workshop on Gender Bias in Natural Language Processing, pages 86–92, Online. Association for Computational Linguistics.
- Glasser et al. (2017) Abraham Glasser, Kesavan Kushalnagar, and Raja Kushalnagar. 2017. Deaf, hard of hearing, and hearing perspectives on using automatic speech recognition in conversation. In Proceedings of the 19th International ACM SIGACCESS Conference on Computers and Accessibility, ASSETS ’17, page 427–432, New York, NY, USA. Association for Computing Machinery.
- Goldwater et al. (2010) Sharon Goldwater, Dan Jurafsky, and Christopher D. Manning. 2010. Which words are hard to recognize? prosodic, lexical, and disfluency factors that increase speech recognition error rates. Speech Communication, 52(3):181–200.
- Halpern et al. (2020) Bence Mark Halpern, Rob van Son, Michiel W.M. van den Brekel, and Odette Scharenborg. 2020. Detecting and analysing spontaneous oral cancer speech in the wild. In Proceedings of Interspeech 2020, Interspeech 2020, pages 4826 – 4830. ISCA.
- He et al. (2018) Yanzhang He, Tara N. Sainath, Rohit Prabhavalkar, Ian McGraw, Raziel Alvarez, Ding Zhao, David Rybach, Anjuli Kannan, Yonghui Wu, Ruoming Pang, Qiao Liang, Deepti Bhatia, Yuan Shangguan, Bo Li, Golan Pundak, Khe Chai Sim, Tom Bagby, Shuo-Yiin Chang, Kanishka Rao, and Alexander Gruenstein. 2018. Streaming end-to-end speech recognition for mobile devices. CoRR, abs/1811.06621.
- Kashiwagi et al. (2023) Yosuke Kashiwagi, Siddhant Arora, Hayato Futami, Jessica Huynh, Shih-Lun Wu, Yifan Peng, Brian Yan, Emiru Tsunoo, and Shinji Watanabe. 2023. Tensor decomposition for minimization of E2E SLU model toward on-device processing. In Proc. INTERSPEECH 2023, pages 710–714.
- Kingma and Ba (2014) Diederik P. Kingma and Jimmy Ba. 2014. Adam: A method for stochastic optimization.
- Koenecke et al. (2020) Allison Koenecke, Andrew Nam, Emily Lake, Joe Nudell, Minnie Quartey, Zion Mengesha, Connor Toups, John R. Rickford, Dan Jurafsky, and Sharad Goel. 2020. Racial disparities in automated speech recognition. Proc. Natl. Acad. Sci. USA, 117(14):7684–7689.
- Liao et al. (2023) Junwei Liao, Sefik Eskimez, Liyang Lu, Yu Shi, Ming Gong, Linjun Shou, Hong Qu, and Michael Zeng. 2023. Improving readability for automatic speech recognition transcription. ACM Trans. Asian Low-Resour. Lang. Inf. Process., 22(5).
- Liu et al. (2021) Zhe Liu, Irina-Elena Veliche, and Fuchun Peng. 2021. Model-based approach for measuring the fairness in ASR. CoRR, abs/2109.09061.
- McCullagh and Nelder (1989) P. McCullagh and J.A. Nelder. 1989. Generalized Linear Models, Second Edition. Chapman and Hall/CRC Monographs on Statistics and Applied Probability Series. Chapman & Hall.
- Moro-Velazquez et al. (2019) Laureano Moro-Velazquez, Jaejin Cho, Shinji Watanabe, Mark A. Hasegawa-Johnson, Odette Scharenborg, Heejin Kim, and Najim Dehak. 2019. Study of the performance of automatic speech recognition systems in speakers with parkinson’s disease. Proceedings of the Annual Conference of the International Speech Communication Association, INTERSPEECH, 2019-September:3875–3879.
- Nakamura et al. (2008) Masanobu Nakamura, Koji Iwano, and Sadaoki Furui. 2008. Differences between acoustic characteristics of spontaneous and read speech and their effects on speech recognition performance. Comput. Speech Lang., 22(2):171–184.
- Ngueajio and Washington (2022) Mikel K. Ngueajio and Gloria Washington. 2022. Hey asr system! why aren’t you more inclusive? automatic speech recognition systems’ bias and proposed bias mitigation techniques. a literature review. In HCI International 2022 – Late Breaking Papers: Interacting with EXtended Reality and Artificial Intelligence: 24th International Conference on Human-Computer Interaction, HCII 2022, Virtual Event, June 26 – July 1, 2022, Proceedings, page 421–440, Berlin, Heidelberg. Springer-Verlag.
- Palanica et al. (2019) Adam Palanica, Anirudh Thommandram, Andrew Lee, Michael H. Li, and Yan Fossat. 2019. Do you understand the words that are comin outta my mouth? voice assistant comprehension of medication names. NPJ Digital Medicine, 2.
- Park et al. (2019) Daniel S. Park, William Chan, Yu Zhang, Chung-Cheng Chiu, Barret Zoph, Ekin D. Cubuk, and Quoc V. Le. 2019. Specaugment: A simple data augmentation method for automatic speech recognition.
- Pearson (1900) Karl Pearson. 1900. X. on the criterion that a given system of deviations from the probable in the case of a correlated system of variables is such that it can be reasonably supposed to have arisen from random sampling. The London, Edinburgh, and Dublin Philosophical Magazine and Journal of Science, 50(302):157–175.
- Qian et al. (2017) Yao Qian, Keelan Evanini, Xinhao Wang, Chong Min Lee, and Matthew Mulholland. 2017. Bidirectional lstm-rnn for improving automated assessment of non-native children’s speech. In INTERSPEECH, pages 1417–1421. ISCA.
- Ravanelli et al. (2021) Mirco Ravanelli, Titouan Parcollet, Peter Plantinga, Aku Rouhe, Samuele Cornell, Loren Lugosch, Cem Subakan, Nauman Dawalatabad, Abdelwahab Heba, Jianyuan Zhong, et al. 2021. Speechbrain: A general-purpose speech toolkit. arXiv preprint arXiv:2106.04624.
- Saade et al. (2019) Alaa Saade, Joseph Dureau, David Leroy, Francesco Caltagirone, Alice Coucke, Adrien Ball, Clément Doumouro, Thibaut Lavril, Alexandre Caulier, Théodore Bluche, Thibault Gisselbrecht, and Maël Primet. 2019. Spoken language understanding on the edge. In 2019 Fifth Workshop on Energy Efficient Machine Learning and Cognitive Computing - NeurIPS Edition (EMC2-NIPS), pages 57–61.
- Sainath et al. (2021) Tara N. Sainath, Yanzhang He, Arun Narayanan, Rami Botros, Ruoming Pang, David Rybach, Cyril Allauzen, Ehsan Variani, James Qin, Quoc-Nam Le-The, Shuo-Yiin Chang, Bo Li, Anmol Gulati, Jiahui Yu, Chung-Cheng Chiu, Diamantino Caseiro, Wei Li, Qiao Liang, and Pat Rondon. 2021. An Efficient Streaming Non-Recurrent On-Device End-to-End Model with Improvements to Rare-Word Modeling. In Proc. Interspeech 2021, pages 1777–1781.
- Sawalha and Abu Shariah (2013) Majdi Sawalha and Mohammad Abu Shariah. 2013. The effects of speakers’ gender, age, and region on overall performance of arabic automatic speech recognition systems using the phonetically rich and balanced modern standard arabic speech corpus. In Proceedings of the 2nd Workshop of Arabic Corpus Linguistics WACL-2. Leeds.
- Schultz et al. (2021) Benjamin G. Schultz, Venkata S.Aditya Tarigoppula, Gustavo Noffs, Sandra Rojas, Anneke van der Walt, David B. Grayden, and Adam P. Vogel. 2021. Automatic speech recognition in neurodegenerative disease. International Journal of Speech Technology, 24(3):771–779.
- Schuster et al. (2006) Maria Schuster, Andreas Maier, Tino Haderlein, Emeka Nkenke, Ulrike Wohlleben, Frank Rosanowski, Ulrich Eysholdt, and Elmar Nöth. 2006. Evaluation of speech intelligibility for children with cleft lip and palate by means of automatic speech recognition. International Journal of Pediatric Otorhinolaryngology, 70(10):1741–1747.
- Sven L. Mattys and Scott (2012) Ann R. Bradlow Sven L. Mattys, Matthew H. Davis and Sophie K. Scott. 2012. Speech recognition in adverse conditions: A review. Language and Cognitive Processes, 27(7-8):953–978.
- Tatman (2017) Rachael Tatman. 2017. Gender and dialect bias in youtube’s automatic captions. In EthNLP@EACL, pages 53–59. Association for Computational Linguistics.
- Tatman (2020) Rachael Tatman. 2020. Sociolinguistic variation and automatic speech recognition: Challenges and approaches. In Annual Meeting of the American Academy for the Advancement of Science. Seattle.
- Tatman and Kasten (2017) Rachael Tatman and Conner Kasten. 2017. Effects of talker dialect, gender & race on accuracy of bing speech and youtube automatic captions. In INTERSPEECH, pages 934–938. ISCA.
- Tu et al. (2016) Ming Tu, Alan Wisler, Visar Berisha, and Julie Liss. 2016. The relationship between perceptual disturbances in dysarthric speech and automatic speech recognition performance. Journal of the Acoustical Society of America, 140(5):EL416–EL422.
- Tur (2011) Gokhan Tur. 2011. Spoken Language Understanding: Systems for Extracting Semantic Information from Speech. John Wiley and Sons.
- Wald (1943) Abraham Wald. 1943. Tests of statistical hypotheses concerning several parameters when the number of observations is large. Transactions of the American Mathematical society, 54(3):426–482.
- Wang et al. (2003) Ye-Yi Wang, Alejandro Acero, and Ciprian Chelba. 2003. Is word error rate a good indicator for spoken language understanding accuracy. 2003 IEEE Workshop on Automatic Speech Recognition and Understanding (IEEE Cat. No.03EX721), pages 577–582.
- Wu et al. (2020) Yunhan Wu, Daniel Rough, Anna Bleakley, Justin Edwards, Orla Cooney, Philip R. Doyle, Leigh Clark, and Benjamin R. Cowan. 2020. See what i’m saying? comparing intelligent personal assistant use for native and non-native language speakers. In 22nd International Conference on Human-Computer Interaction with Mobile Devices and Services, MobileHCI ’20, New York, NY, USA. Association for Computing Machinery.
- Zeiler (2012) Matthew D. Zeiler. 2012. Adadelta: An adaptive learning rate method. CoRR, abs/1212.5701.
- Zhu et al. (2015) Yukun Zhu, Ryan Kiros, Richard S. Zemel, Ruslan Salakhutdinov, Raquel Urtasun, Antonio Torralba, and Sanja Fidler. 2015. Aligning books and movies: Towards story-like visual explanations by watching movies and reading books. 2015 IEEE International Conference on Computer Vision (ICCV), pages 19–27.
9. Language Resource References
- Ardila et al. (2019) Rosana Ardila and Megan Branson and Kelly Davis and Michael Henretty and Michael Kohler and Josh Meyer and Reuben Morais and Lindsay Saunders and Francis M. Tyers and Gregor Weber. 2019. Common Voice: A Massively-Multilingual Speech Corpus.
- Bradlow et al. (2010) Ann R. Bradlow and Lauren Ackerman and L. Ann Burchfield and Lisa Hesterberg and Jenna Luque and Kelsey Mok. 2010. ALLSSTAR: Archive of L1 and L2 scripted and spontaneous transcripts and recordings.
- Cucchiarini et al. (2006) Catia Cucchiarini and Hugo Van hamme and Olga van Herwijnen and Felix Smits. 2006. JASMIN-CGN: Extension of the Spoken Dutch Corpus with Speech of Elderly People, Children and Non-natives in the Human-Machine Interaction Modality.
- Hazirbas et al. (2021) Caner Hazirbas and Joanna Bitton and Brian Dolhansky and Jacqueline Pan and Albert Gordo and Cristian Canton Ferrer. 2021. Towards measuring fairness in ai: the casual conversations dataset. IEEE.
- Kalluri et al. (2021) Shareef Babu Kalluri and Deepu Vijayasenan and Sriram Ganapathy and Prashant Krishnan and others. 2021. NISP: a multi-lingual multi-accent dataset for speaker profiling. IEEE.
- (6) Tyler Kendall and Charlie Farrington. The Corpus of Regional African American Language.
- Meyer et al. (2020) Josh Meyer and Lindy Rauchenstein and Joshua D. Eisenberg and Nicholas Howell. 2020. Artie Bias Corpus: An Open Dataset for Detecting Demographic Bias in Speech Applications.
- Oostdijk (2000) Oostdijk, Nelleke. 2000. The Spoken Dutch Corpus. Overview and First Evaluation. European Language Resources Association.
- Panayotov et al. (2015) Vassil Panayotov and Guoguo Chen and Daniel Povey and Sanjeev Khudanpur. 2015. Librispeech: An ASR corpus based on public domain audio books.
- Pitt et al. (2005) Mark A. Pitt and Keith Johnson and Elizabeth Hume and Scott F. Kiesling and William D. Raymond. 2005. The Buckeye corpus of conversational speech: labeling conventions and a test of transcriber reliability.
- Wang et al. (2021) Changhan Wang and Morgane Rivière and Ann Lee and Anne Wu and Chaitanya Talnikar and Daniel Haziza and Mary Williamson and Juan Miguel Pino and Emmanuel Dupoux. 2021. VoxPopuli: A Large-Scale Multilingual Speech Corpus for Representation Learning, Semi-Supervised Learning and Interpretation.
- Weinberger and Kunath (2011) Steven H. Weinberger and Stephen A. Kunath. 2011. The Speech Accent Archive: towards a typology of English accents. Brill.
Appendix A Appendix A: Sonos Voice Control Bias Assessment Dataset, additional descriptive statistics
A.1. Dialectal regions definition
Dialectal regions in America are defined based on phonemic/phonetic, lexical, and syntactic features. Speakers from a certain region may use certain vocabulary or lexical items that are specific to their region (for example ‘gym shoes’ or ‘sneaker’ all refer to the same athletic footwear but will be heard with varying frequency depending on the geographic location). In the case of voice assistants, particularly within the music domain, lexical differences and regionalisms do not pose many issues given the short and straightforward nature of interactions. In a similar way, syntactic features (such as the use of ’done’ as an auxiliary verb in Southern English to express the past tense: I done had enough) do not pose many issues to speech recognition within voice assistant domains.
Regional varieties are also reflected in specific phonetic phenomena, such as non-rhoticity (dropping of the /r/ consonant in all environments except before a vowel, sometimes heard in Boston or New York), PIN-PEN merger (the two vowel sounds /I/ and /E/ merge before nasal sounds to sound the same, found in standard Southern American dialect), or COT-CAUGHT merger (/\tipaencodingA/ and /\tipaencodingO/ vowels to sound alike, heard in most of the country). Vowel quality and, more generally, phenomena related to the sound system of English pose more issues to voice recognition, especially in the music domain. Depending on how speakers pronounce music values and general queries, recognition may vary.
Identifying dialectal regions for any area or language is always imprecise. While what is defined in our data is one way of interpreting American English, there are of course many different ways of dividing regionality and the features that exist within these groups. Within any dialectal region, the prominence of the specific features of that dialect will vary greatly. While some may be inclined to further divide into even more specific groups, having data that represents multiple ages, genders and demographics within each dialectal region was also of importance.
The definition of dialectal region was also impacted by the necessity for adequate representation from each category, while also adhering to other constraints such as time and budget. Creating more dialectal groups would potentially impede the velocity of data collection or skew sample sizes.
Selecting these dialectal regions also facilitated easy identification of a user within a group. Without being able to listen to or speak with individuals to ‘verify’ their dialectal region selection, having no more than six dialectal groups facilitated data collection with straight-forward parameters based on geographic location.
The Asian and LatinX categories were defined by identifying other large speaker groups in the US that may interact with voice assistants. These two user groups were defined as follows: home country must be in Latin America for LatinX, in Southern or Eastern Asia for Asian native language must be Spanish for LatinX, any Asian language for Asian The definition of the LatinX group is different from the definition one may use for Chicano English (also known as Mexican-American English or Spanish English). Chicano English is primarily spoken by Mexican Americans in south-western states whose first language is English. We were interested in a larger pool than only Mexican American speakers. The speakers in our LatinX group are native Spanish speakers from any Latin American country. However, many of the features in Chicano English are also exhibited in the LatinX participant’s speech. For example, /\tipaencodingD/ stopping, or the replacing of the -th- sound with /\tipaencodingd/ in words like ‘there’ (‘dere’) was still prevalent. The distinction between /\tipaencodingI/ and /\tipaencodingi/ in some speakers is lost, making words like ‘fit’ and ‘feet’ sound alike.
General monophthongization, which may be directly due to the quality of vowels in Spanish, is another quality of Chicano English that was seen in the LatinX group. The motivation behind criteria based on language and country was again largely due to time constraints, as it can be difficult to find enough speakers when more constraints are applied to dialectal definitions. It also facilitated the identification of speakers - being able to identify based on home country and native language is easier for participants than asking if they think they speak a certain dialect of a language. The Asian group included Southern and Eastern Asian countries, in order to account for large populations of both regions in the US. While the Asian group has much more linguistic diversity within the speakers themselves, no further division was implemented based on budgeting and time constraints. Looking back, if we were to reproduce this approach, Indian English should probably have been separated from the other Asian groups.
A.2. Ontology description
Among all splits, there are unique transcripts, for PlayMusic and for Transport Control. Table 3 provide the number of unique slot values for each slot name, e.g. there are different radio names.
| Slot name | # of unique values |
|---|---|
| abs_volume | 13 |
| activity | 8 |
| album_name | 1626 |
| artist_name | 1715 |
| call_sign | 404 |
| container_qualif_after_artist | 7 |
| container_qualif_before_artist | 9 |
| container_type | 5 |
| content_type | 16 |
| destination_group | 1 |
| destination_target | 21 |
| except | 2 |
| frequency | 230 |
| genre | 272 |
| implicit_content | 1 |
| instead | 2 |
| library | 22 |
| location | 66 |
| mood | 2 |
| only | 1 |
| origin_target | 12 |
| personal_container_name | 58 |
| playback_mode | 8 |
| playlist | 599 |
| program | 86 |
| provider | 12 |
| radio_name | 221 |
| rel_volume | 10 |
| shuffle | 1 |
| song_name | 2643 |
| target | 298 |
| target_exception | 32 |
| too | 3 |
| volume_down_subj | 8 |
| volume_obj | 111 |
| volume_set_subj | 28 |
| volume_shift_subj | 9 |
| volume_up_subj | 6 |
List of available slot names per intent in the proposed dataset.
| Intent | Corresponding slot names |
| \ST@nextAddToLibrary | personal_container_name provider library content_type target |
| Intent | Corresponding slot names |
| ChangeMusic | provider content_type target |
| Intent | Corresponding slot names |
| ChangeTarget | instead container_type origin_target destination_target |
| Intent | Corresponding slot names |
| CheckBattery | target |
| Intent | Corresponding slot names |
| FollowArtist | provider |
| Intent | Corresponding slot names |
| Forward | provider target |
| Intent | Corresponding slot names |
| GetInfos | provider content_type target |
| Intent | Corresponding slot names |
| GroupTargets | only target_exception too except destination_group target |
| Intent | Corresponding slot names |
| Like | provider content_type target |
| Intent | Corresponding slot names |
| Mute | container_type only target_exception too provider except target |
| Intent | Corresponding slot names |
| NextSong | provider container_type target |
| Intent | Corresponding slot names |
| Pause | provider container_type target |
| Intent | Corresponding slot names |
| Play | container_type only volume_obj target_exception too volume_down_subj provider except volume_set_subj instead target |
| Intent | Corresponding slot names |
| PlayMusic | container_type only container_qualif_after_artist genre target_exception radio_name activity call_sign program artist_name frequency container_qualif_before_artist except implicit_content shuffle song_name album_name target playlist playback_mode mood too location volume_obj provider volume_set_subj library instead |
| Intent | Corresponding slot names |
| PreviousSong | provider target |
| Intent | Corresponding slot names |
| RemoveFromLibrary | personal_container_name provider library content_type target |
| Intent | Corresponding slot names |
| Repeat | provider content_type target |
| Intent | Corresponding slot names |
| RestartSong | provider container_type target |
| Intent | Corresponding slot names |
| Resume | provider container_type target |
| Intent | Corresponding slot names |
| Rewind | provider target |
| Intent | Corresponding slot names |
| Shuffle | provider target |
| Intent | Corresponding slot names |
| Stop | container_type only target_exception too provider except target |
| Intent | Corresponding slot names |
| StopAndStartTarget | instead container_type origin_target destination_target |
| Intent | Corresponding slot names |
| StopMode | playback_mode provider target |
| Intent | Corresponding slot names |
| UnfollowArtist | provider |
| Intent | Corresponding slot names |
| UngroupTargets | only target_exception too except target |
| Intent | Corresponding slot names |
| Unlike | provider content_type target |
| Intent | Corresponding slot names |
| Unmute | container_type only target_exception too provider except target |
| Intent | Corresponding slot names |
| VolumeDown | container_type only abs_volume target_exception too volume_shift_subj rel_volume volume_down_subj provider except volume_set_subj target |
| Intent | Corresponding slot names |
| VolumeSet | container_type only volume_obj target_exception too except volume_set_subj target |
| Intent | Corresponding slot names |
| VolumeUp | container_type only abs_volume volume_up_subj target_exception too volume_shift_subj rel_volume provider except volume_set_subj target |
| Intent | Corresponding slot names |
Table 3 provides the complete list of available slot names of each intent available in the SVC Bias Assessment Dataset.
A.3. Additional descriptive statistics per split
In this subsection of the appendix, we provide additional figures showing the distribution, in terms of both samples and speakers in each of the provided split in the Sonos Voice Control Bias Assessment Dataset.
A.3.1. Test split
Fig. 4 displays the speaker distribution in the test split for each demographic group.
A.3.2. Train split
Fig. 5 displays the audio sample distribution in the train split for each demographic group.
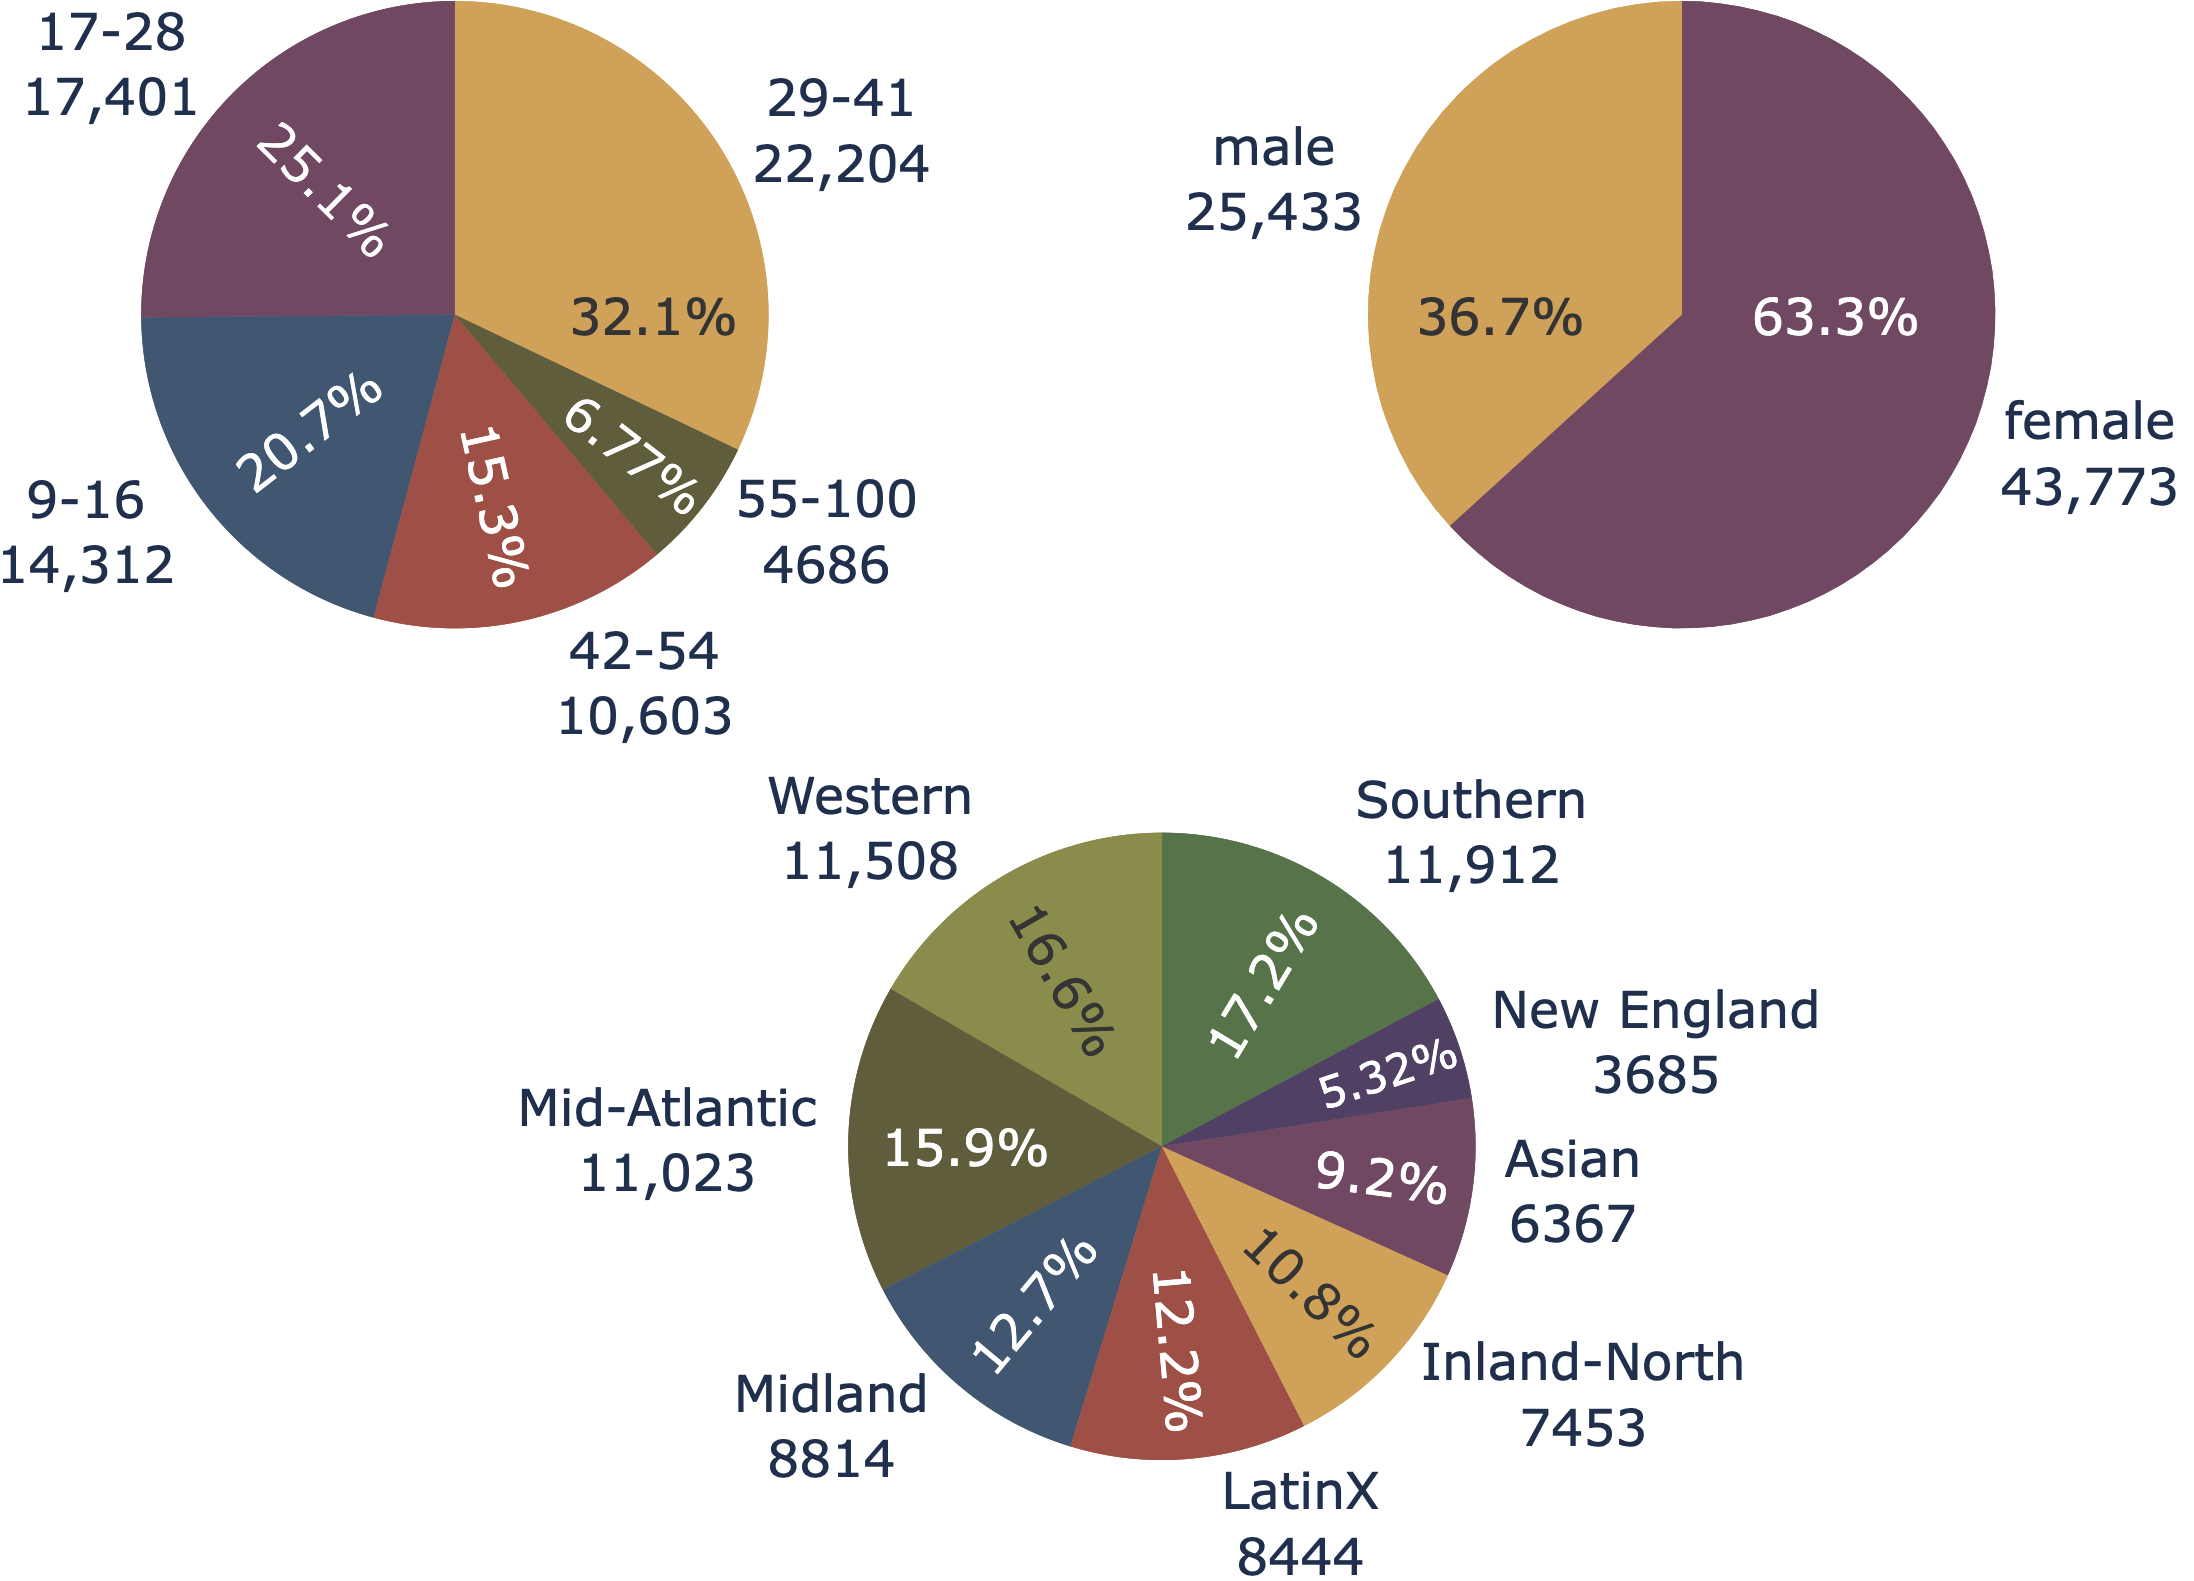
Fig. 6 displays the speaker distribution in the test split for each demographic group.
A.3.3. Development split
Fig. 7 displays the audio sample distribution in the development split for each demographic group.
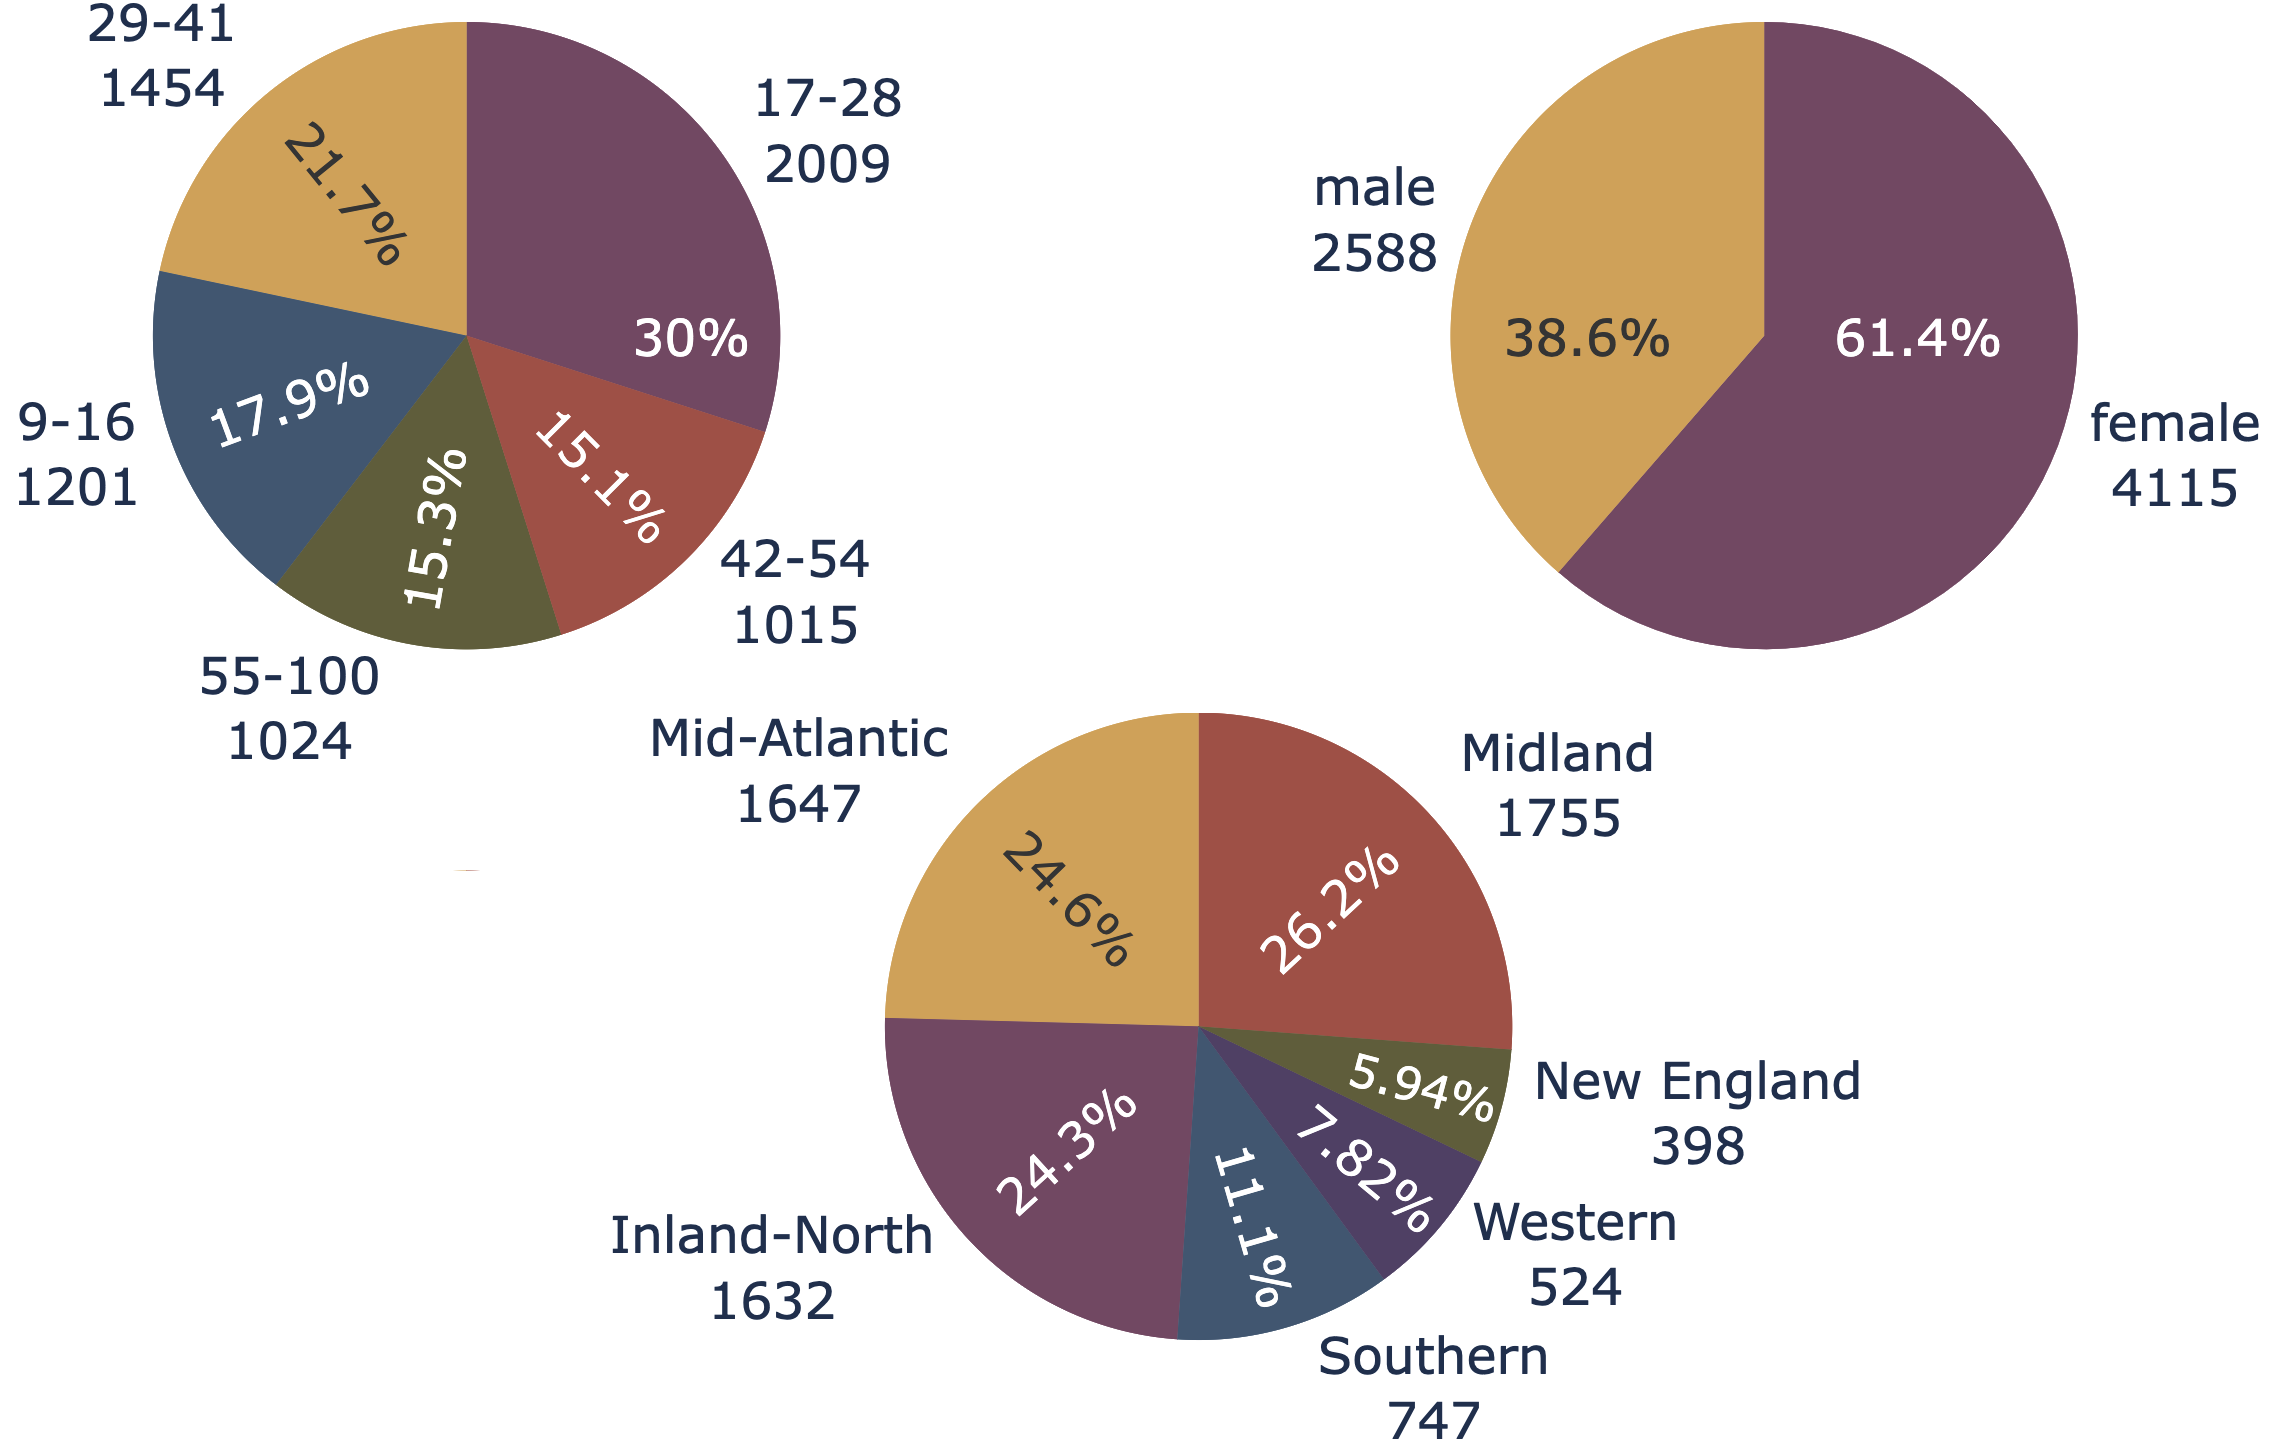
Fig. 8 displays the speaker distribution in the development split for each demographic group.
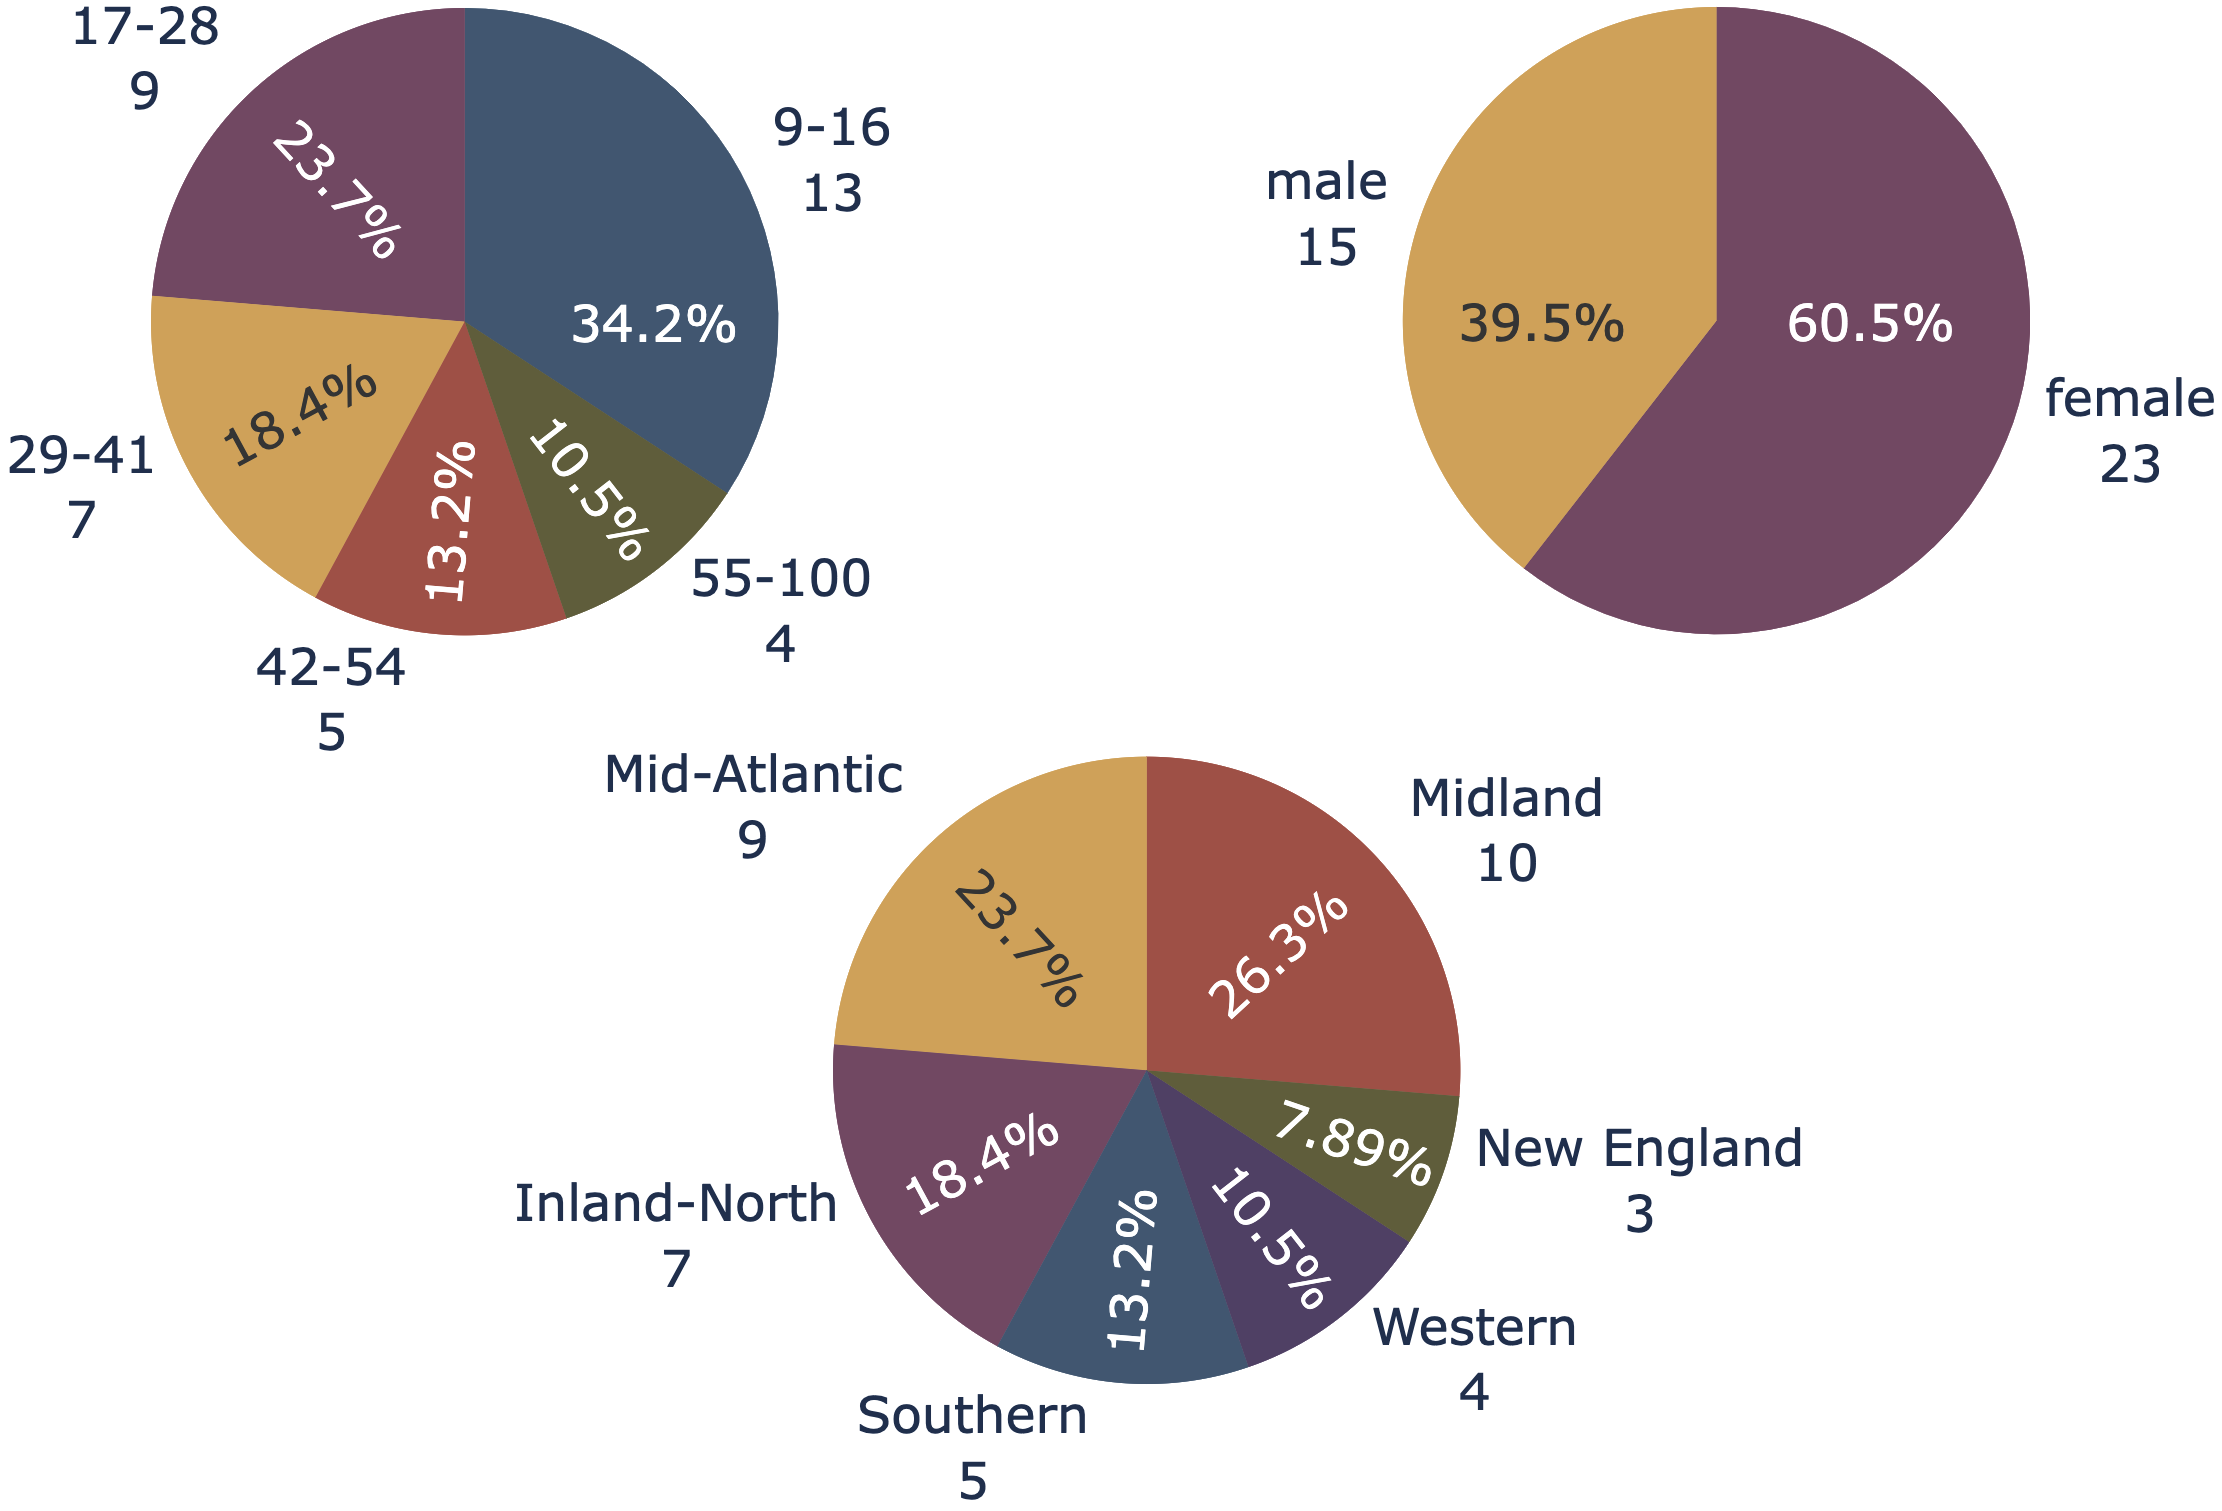
There is no non-native speaker (Asian or LatinX). This is primarily due to the small size of this set comprising only speakers.
A.4. Ethnicity dataset
Race and ethnicity are inherently difficult to define, as these words can mean different things to different people. There are also constraints on what can be asked or assumed of participants when working with third party providers. For these reasons, users were asked to self-identify and we operated under the assumption that a person of any racial or ethnic group would know their own identification better than us enforcing any strict parameters. It should also be noted that dialects such as African American Vernacular English (AAVE) are social dialects and are therefore not tied to geographical location. While not all members of an ethnic group, such as African American/Black, will exhibit features of the associated dialect, for example AAVE, this approach was agreed upon with the third party provider in charge of hiring speakers.
The ethnicity tag was only reported in the second campaign that we launched for which speakers have been recruited: Caucasian and African American speakers. We refer to this smaller dataset, only present in the test split, as the ethnicity dataset.
Fig. 9 displays the audio samples distribution in the ethnicity subset for each demographic group.
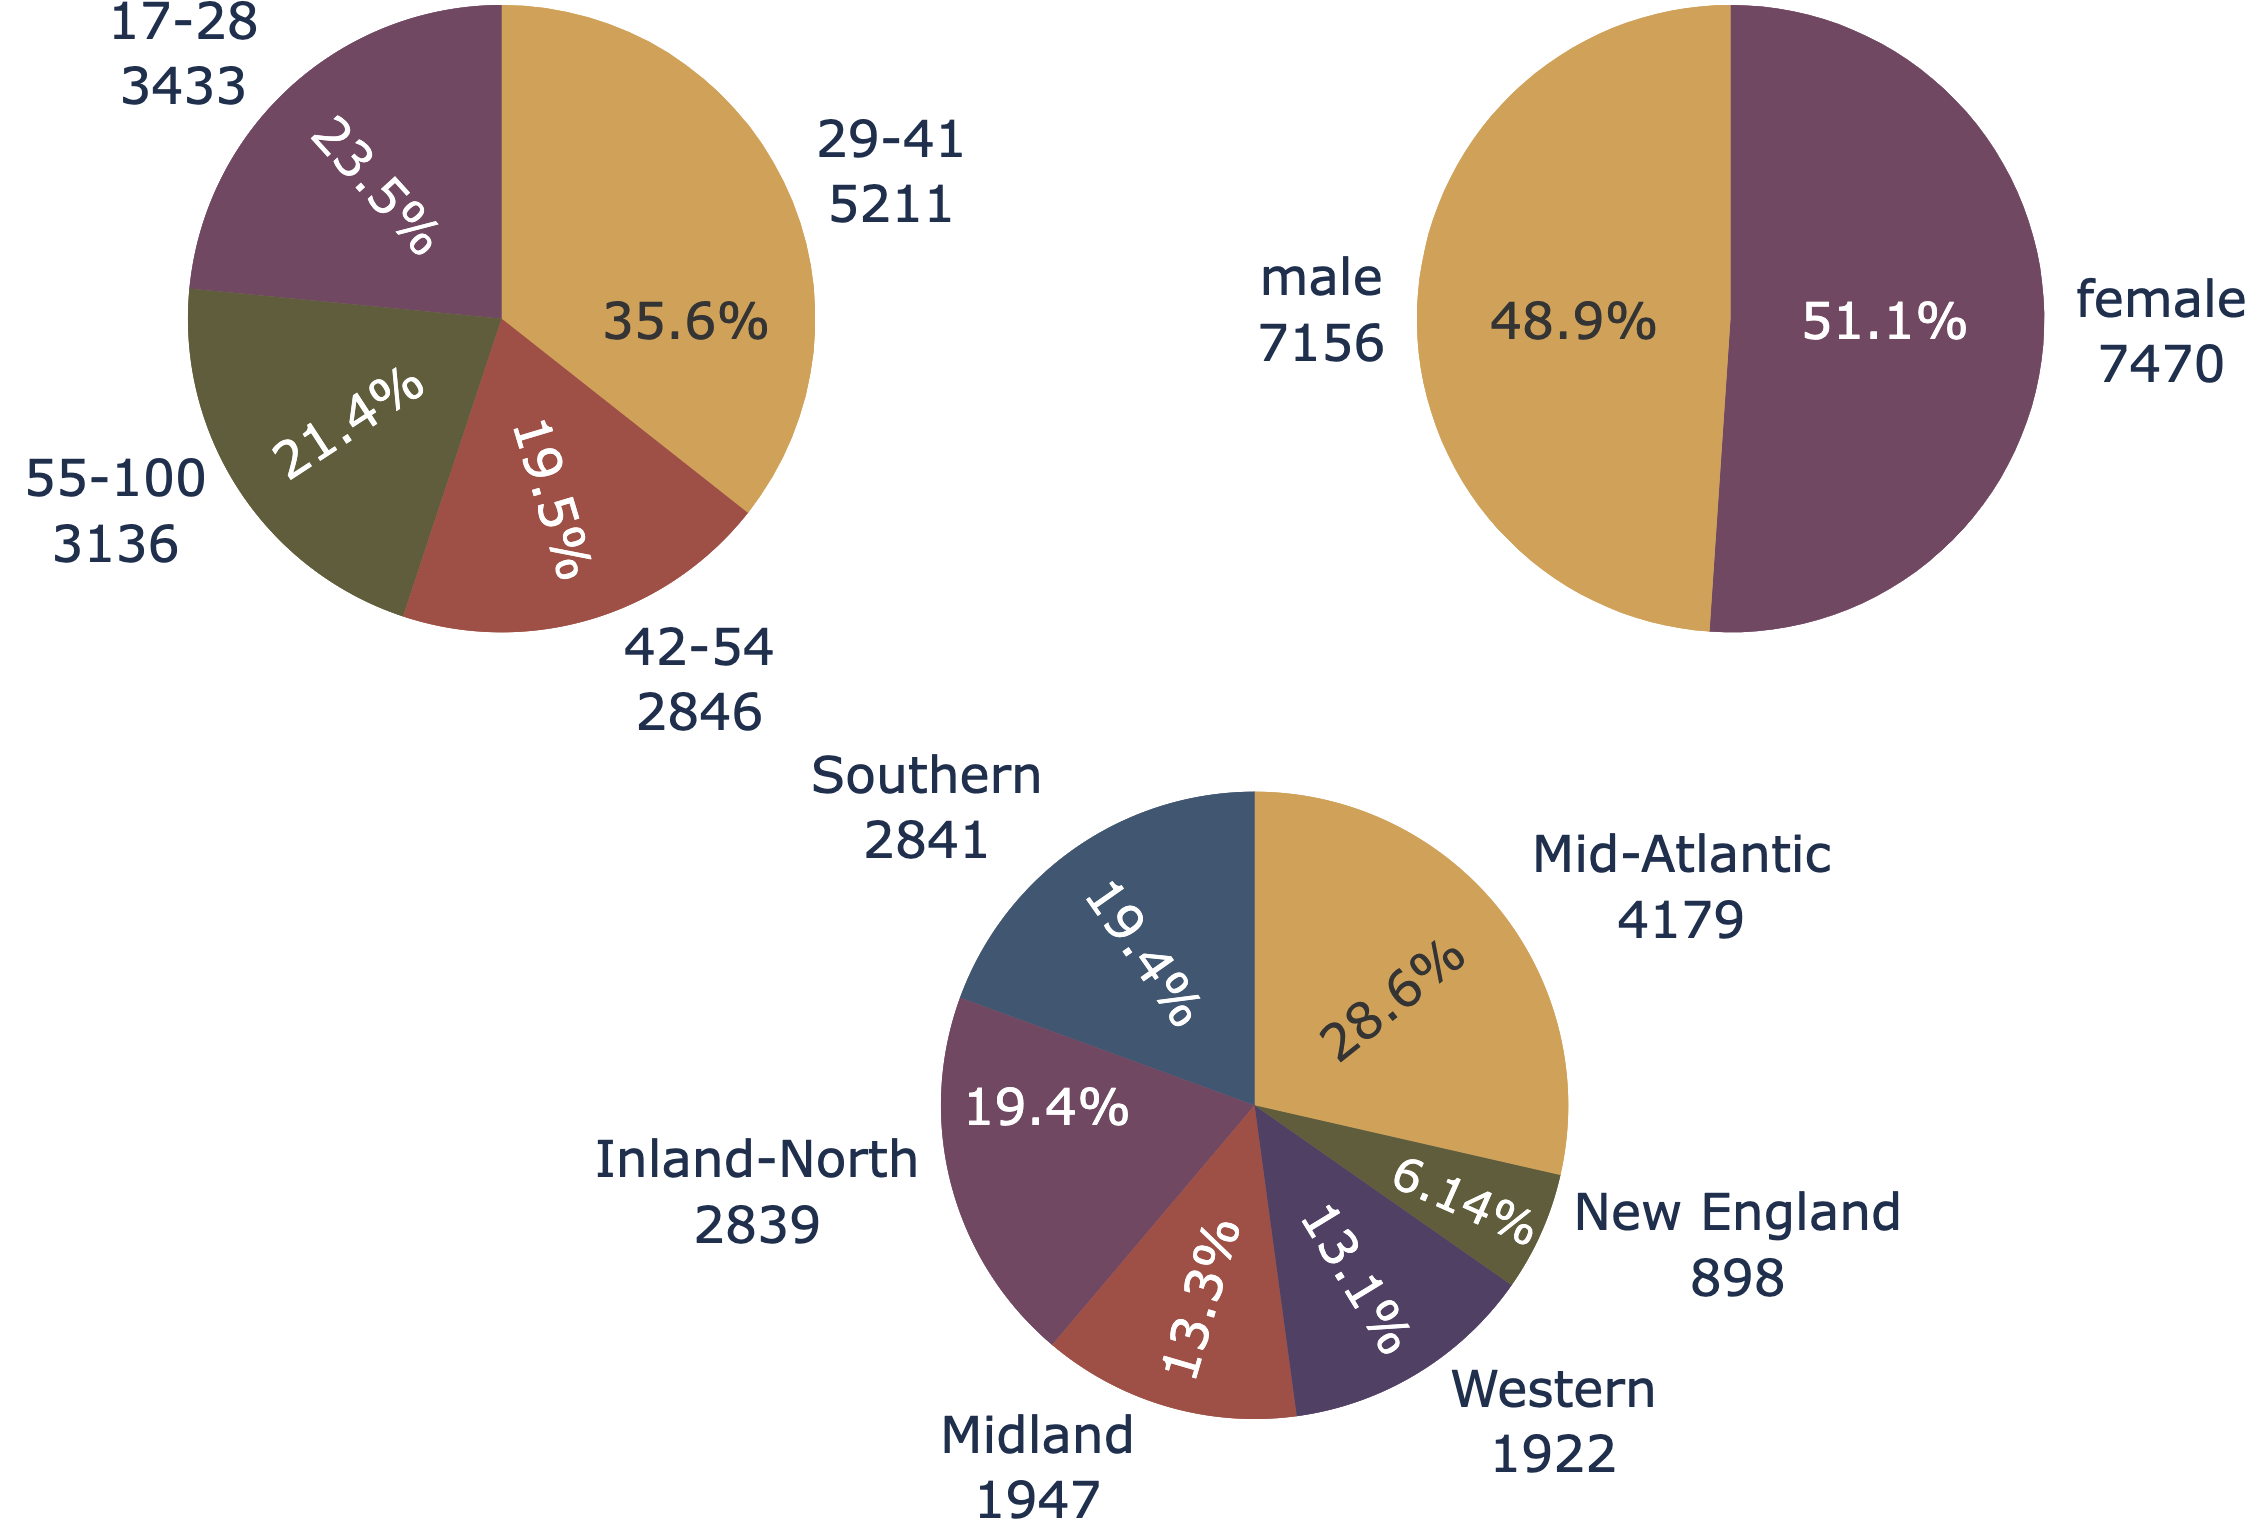
Fig. 10 displays the speaker distribution in the ethnicity subset for each demographic group.
There is no children in this dataset as their recruitment proved difficult. The distribution among the dialectal regions is similar as the one of the original test split. It is also balanced in terms of gender ( of male and of female speakers).
Appendix B Appendix B: Confusion bias
In this section of the Appendix, we provide the complete confusion bias analysis.
B.1. Age
Similarly as in Table 2, Table 5 provides the gender and dialectal region distribution for each age group in the test split. In bold, we highlight the categories for which there are less than of data points.
| Age group | Samples | Speakers | Gender distribution | Dialectal region distribution | ||||||||||
|---|---|---|---|---|---|---|---|---|---|---|---|---|---|---|
| 9-16 |
|
|
||||||||||||
| 17-28 |
|
|
||||||||||||
| 29-41 |
|
|
||||||||||||
| 42-54 |
|
|
||||||||||||
| 55-100 |
|
|
B.2. Gender
The following Table 6 provides the age and dialectal region distribution for each gender in the test split. In bold, we highlight the categories for which there are less than of data points.
| Gender | Samples | Speakers | Age distribution | Dialectal region distribution | |||||||||||||
|---|---|---|---|---|---|---|---|---|---|---|---|---|---|---|---|---|---|
| Female |
|
|
|||||||||||||||
| Male |
|
|
B.3. Ethnicity
Table 7 provides the age, gender and dialectal region distribution for each ethnicity group in the test split.
| Ethnicity | African American | Caucasian | |||||||||||
|---|---|---|---|---|---|---|---|---|---|---|---|---|---|
| Samples | |||||||||||||
| Speakers | |||||||||||||
| Age distrib. |
|
|
|||||||||||
| Gender distrib. |
|
|
|||||||||||
| Dialectal region distrib. |
|
|
Appendix C Appendix C: Experiments – Exhaustive statistical analysis
We display here additional results obtained with the off-the-shelf ASR model wav2vec2.0 and JointBERT SLU model, demonstrating the capabilities of our proposed dataset and methodology to quantify demographic bias in voice assistants. Consequently, we remind the reader that the ASR and SLU models have not been particularly optimized for bias mitigation.
C.1. Univariate tests
While results of all univariate logistic regressions were given in Section 5.2, we also performed additional, but not mandatory, univariate tests that can be seen as complementary to the logistic regression.
C.1.1. Logistic regression on the ethnicity subset
The speakers for which we have an ethnicity tag recorded audio samples forming the ethnicity subset of the released dataset.
Performing univariate logistic regression for variable on this subset revealed interesting results.
No evidence of demographic bias based on age and gender was found. However, the univariate logistic regression for dialectal region is statistically significant at the -level. Looking deeper in the statistical results, we see that the p-value is close to the threshold () and only the coefficient of Mid-Atlantic has a p-value below this threshold (). For all the other dialects, there is no evidence of statistical bias with respect to the reference category (Inland-North). Looking at the odds-ratio, speakers belonging to the Mid-Atlantic group have 0.6 times less chance to be recognized than speakers from the Inland-North group.
C.1.2. Chi2 contingency test
The chi-squared test ( Pearson (1900)) is a statistical hypothesis test used to test for the independence of several categories within a given population. However, unlike the univariate logistic regression, one cannot infer the direction of the bias since there are no coefficient or odd ratios associated to this test.
Applied on the released test split, the chi-squared tests confirm what the univariate logistic regressions uncovered. All tests are statistically significant at the -level: gender (p-value ), age (p-value ), dialect (p-value ), ethnicity (p-value ).
C.1.3. One-way ANOVA test
Another complementary univariate test is the One-way ANOVA test (notably used in Meyer et al. (2020) on the Character Error Rate). This test is also known as the "analysis of variance". It compares the means of at least 2 independent groups to assess whether there is statistical evidence that the associated population means are significantly different.
With this test, we only found significant evidence of bias for age (p-value ) and dialectal region (p-value ).
C.2. Multivariate tests
Regarding potential mixed effects, we highlighted the ones found in Section 5.2. Here we provide the exhaustive and systematic analysis of all multivariate tests.
First, gender is not a confounding factor for age: the test is statistically significant () but the p-values of the multivariate and the univariate tests are very close, therefore we cannot conclude that gender is a confounding factor for age. The conclusion is similar for age on gender: the test is statistically significant at the -level () but the p-values and odds-ratios are very close, therefore there is no confounding factor.
Similarly, there is no evidence that age is a confounding factor for dialectal region as even if the test is statistically significant (), the p-values and odds-ratios are close, maintaining the conclusions of the univariate test unchanged. We reach the same conclusion for dialectal region with the age variable ().
Gender is not a confounding factor for dialectal region since the test is not significant (). The test is however significant the other way around () and the coefficient for male is no longer significant at the -level. We conclude that dialectal region is a confounding factor for gender.
Each of the previous analysis are done on the smaller ethnicity dataset in order to evaluate potential mixed effects linked with ethnicity.
First, age is not a confounding factor for ethnicity as the test is not significant (). The adjustment test of ethnicity on age is significant () but there is no change on the conclusions about age (still no significant age coefficients).
Similarly as above, gender is not a confounding factor for ethnicity (). Even the adjustment test is significant the other way around (), conclusions for gender are unchanged (still not significant). Therefore ethnicity is not a confounding factor for gender.
Again, the conclusion is similar for dialectal region and ethnicity. The dialect is not a confounding factor for ethnicity (). And ethnicity is not a confounding factor for the dialect ( but the conclusions of the univariate test remain unchanged).
C.3. Word Error Rate
We obtained a WER of with the fine-tuned w2v Baevski et al. (2020). Fig. 11 displays the variation of WER per demographic group.
 |
 |
| (a) Age group | (b) Dialectal region |
 |
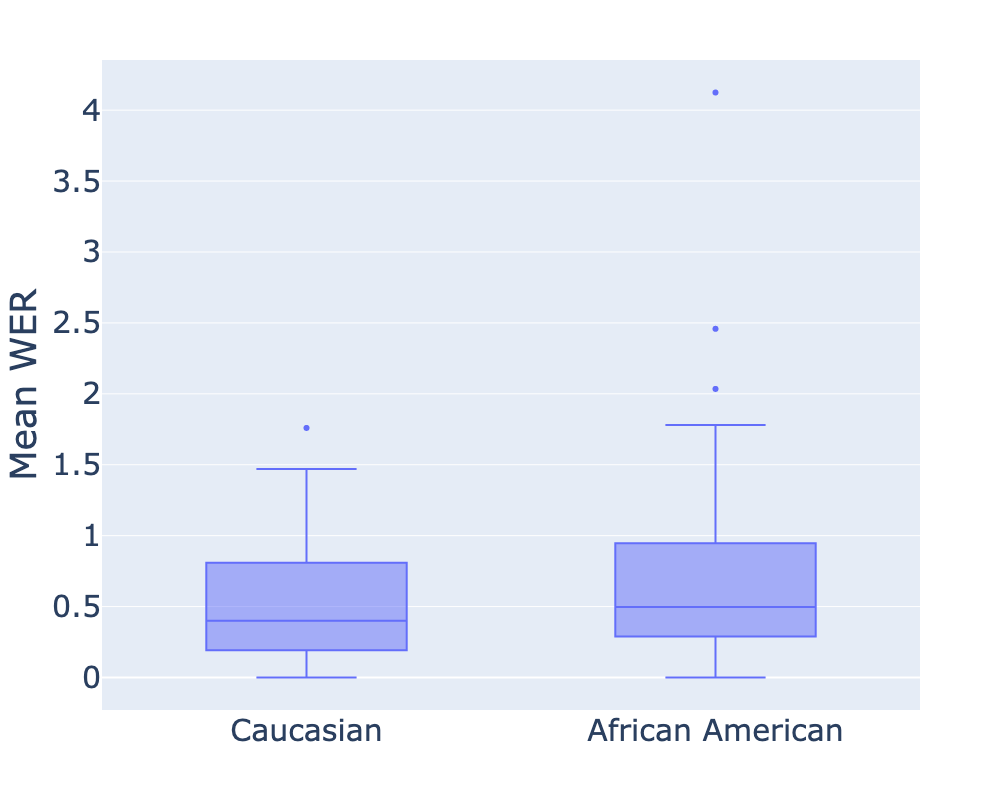 |
| (c) Gender | (d) Ethnicity |
Similarly as in Fig. 2, there are some cases of high standard deviation.
C.4. Speaker variability
Fig. 2 in the main text, as well as Fig. 11 in the previous section, showcase high standard deviations in EMR and WER per speaker. Some individual speakers (outlier points) are much less well understood than others in the same demographic group. This is consistent with the literature (for instance Tatman and Kasten (2017); Tatman (2020) also observe much larger WERs for some individuals). Feng et al. (2024) note that the recognition performance is affected by the large variability both in the pronunciation and in language use within a given speaker group.
Though it is not always possible to identify the cause just by listening to the corresponding audio clips, some speakers may have slight disfluencies or hesitations when recording. Hesitation is difficult to perfect in the world of speech recognition, as other constraints such as endpointing rules may come into play and end recognition before the user is finished speaking. Other speakers that simply utter at a slower pace may also be less consistently understood.
Lisps and other speech impediments are a third example. Most speakers in the dataset do not have any speech impediments, but it should be noted that this can greatly affect the quality of transcription. Most training data does not comprise atypical speech and therefore it is expected that these cases would be less consistently understood.