X-ray and Radio campaign of the Z-source GX 3400: discovery of X-ray polarization and its implications
Abstract
We present the discovery of X-ray polarization from the neutron star low-mass X-ray binary and Z-source, GX 3400, using an Imaging X-ray Polarimetry Explorer (IXPE) observation in March 2024. Along with the IXPE observation, we conducted an extensive X-ray and radio monitoring campaign to ascertain the source properties during and around the IXPE observation. The source appeared to be on the horizontal branch throughout the multi-wavelength campaign. We measured a significant X-ray polarization in 2–8 keV with polarization degree (PD) = % and polarization angle (PA) = . The energy-dependent polarization indicates that in the 2–2.5 keV energy range, the PA is much lower, , while other energy bands are consistent with the PA found over 2.5–8 keV. The simultaneous AstroSat-IXPE spectro-polarimetric observations provide some evidence for independent polarization from various spectral components, hinting at a disparity in the PA from the accretion disk and the Comptonized emission while suggesting an unpolarized emission from the blackbody component. Radio observations in the 0.7–9 GHz frequency range reveal a non-detection of radio emission in 0.7–1.5 GHz and a significant detection in 5.5–9 GHz, suggesting the presence of a spectral break in 1.5–5.5 GHz. Using ATCA observation, we place upper limits on the radio polarization at 6% on the linear polarization and 4% on the circular polarization at 3 level. We discuss the origin of the X-ray polarization and its implications on the geometry of the spectral components.
1 Introduction
Z-sources are bright, low-mass X-ray binaries (LMXB) with a neutron star (NS) as the compact object. They show a unique ‘Z’ shaped track on their X-ray hardness-intensity diagram (HID) and the color-color diagram (CCD; Hasinger & van der Klis, 1989). The track itself is divided into the Horizontal branch (HB), the Normal branch (NB) and the Flaring branch (FB), with the hard apex joining the HB and the NB and the soft apex joining the NB and the FB. These sources host a weak magnetic field NS (typically G) and accrete close to the Eddington rate. The transitions across different branches are smooth, always passing through the apexes. There are two subclasses of the Z-sources, depending on the shape of the ‘Z’ traced: Cyg-like sources (which include Cyg X-2, GX 3400, and GX 51) and Sco-like sources (which include Sco X-1, GX 172, and GX 3492). The evolution along the track is often linked to strong changes in the mass accretion rate (Homan et al., 2007; Lin et al., 2009; Homan et al., 2010; Chakraborty et al., 2011; Ng et al., 2024).
The repetitive track of a Z-source on the HID indicates that there is a clear and specific way of spectral evolution as the source evolves. To understand what is causing the spectral evolution, one needs to investigate the components involved in the emission. The persistent Z sources mentioned above have been extensively probed using the spectro-timing analysis, which yielded a crude picture with many degeneracies in the geometrical configuration. Historically, there has been a dichotomy in the modeling of the X-ray spectrum. The emission in 2–20 keV energy range is well modeled as a combination of a thermal and a Comptonization component with thermal component being an accretion disk (Mitsuda et al., 1989), a blackbody component (Church et al., 2006) or a combination of two thermal components with harder non-thermal component (Lin et al., 2007, 2009, 2012). The Comptonized emission (also referred to as corona) arises from the Compton up-scattering of photons by a hot plasma of electrons (Mitsuda et al., 1989; Zdziarski et al., 1996; Church et al., 2006; Seifina et al., 2013; Bhargava et al., 2023). The investigations of the source using simultaneous soft X-ray instruments demonstrate the presence of a tail of soft thermal component, which can be modeled as a blackbody (e.g. Seifina et al., 2013) or a disk emission (e.g. Bhargava et al., 2023).
The polarimetric observation of Z-sources has already provided new insights into the orientation of various emission components. In the case of Cyg X-2, only the NB was observed, and a 2–8 keV polarization degree (PD) of % (Farinelli et al., 2023) was measured. The spectro-polarimetric investigation of Cyg X-2 indicates that the polarization angles (PA) of the emissions from the disk and the corona may have an angle of 90 between them. GX 51 was observed in HB and NB, and the PD in HB (%) was observed to be significantly higher than that in NB (%; Fabiani et al., 2024). This is possibly due to a higher contribution of the coronal emission in HB as compared to NB (Church et al., 2012). GX 51 also hinted towards a difference in the PA of the spectral components, which is not as distinct as observed in Cyg X-2. The transient Z-source XTE J1701462 demonstrated a variable X-ray polarization when observed during the HB and NB transition of the source (Cocchi et al., 2023). During the HB, the source showed a PD of %, while during the NB, the PD dropped to %. Sco X-1 was observed with IXPE in NB and FB, and the emission from the source has a lower polarization (La Monaca et al., 2024) as compared to NB polarization in either Cyg X-2 or GX 51 indicating that as we go along the Z-track the X-ray polarization declines. Cir X-1 (which also shows intermittent Z-source-like behavior) indicated a variation in the PA as a function of the X-ray hardness, indicating a clear interplay of spectral components (Rankin et al., 2024). Additionally, spectro-polarimetric simulations for weakly magnetized sources predict a typical X-ray polarization of 4% with the energy dependence of PD/PA breaking the degeneracies in the spectral decomposition of such sources (Gnarini et al., 2022).
GX 3400 is one of the bright, persistent sources which demonstrate a complete trace of the Z-track (Mitsuda et al., 1989; Jonker et al., 1998, 2000; Gilfanov et al., 2003; Lavagetto et al., 2004; Iaria et al., 2006; Bałucińska-Church et al., 2010; Seifina et al., 2013) The source is known to traverse through all of the branches in a relatively short (a few days) period (Jonker et al., 2000). The source is obscured in optical wavelengths but can be associated with a possible infra-red counterpart (Miller et al., 1993). The radio emission from the source has been detected (Penninx et al., 1993) and was found to be strongly correlated to the X-ray flux (Oosterbroek et al., 1994; Berendsen et al., 2000). The binary inclination of the source is unknown due to a lack of optical measurements, but since the source doesn’t exhibit any dips (in contrast with Cyg X-2), the inclination is expected to be (Frank et al., 1987). The reflection modeling of the Fe K feature indicate that the inclination of the source is (D’Aì et al., 2009; Miller et al., 2016). In contrast to the estimates of inclination from reflection, Seifina et al. (2013) suggest that the inclination of the system is high (i.e. we view the system close to edge-on), and the Z-track evolution is caused by the changing size of the Comptonizing medium.
One of the important unanswered questions about this source is the nature of the corona and its geometry, whether it covers the disk (Bhargava et al., 2023) or it is a puffed up optically thin medium close to the NS surface (Seifina et al., 2013) or it aligns with the radio emission (Oosterbroek et al., 1994). To understand the geometry of various components of the system, we conducted the first IXPE observation of GX 3400 supported by an extensive campaign using various X-ray and radio observatories. In this letter, we report the results from the X-ray polarimetric, spectral, and timing observations of the source, as well as supporting radio observations.
2 Data analysis & Results
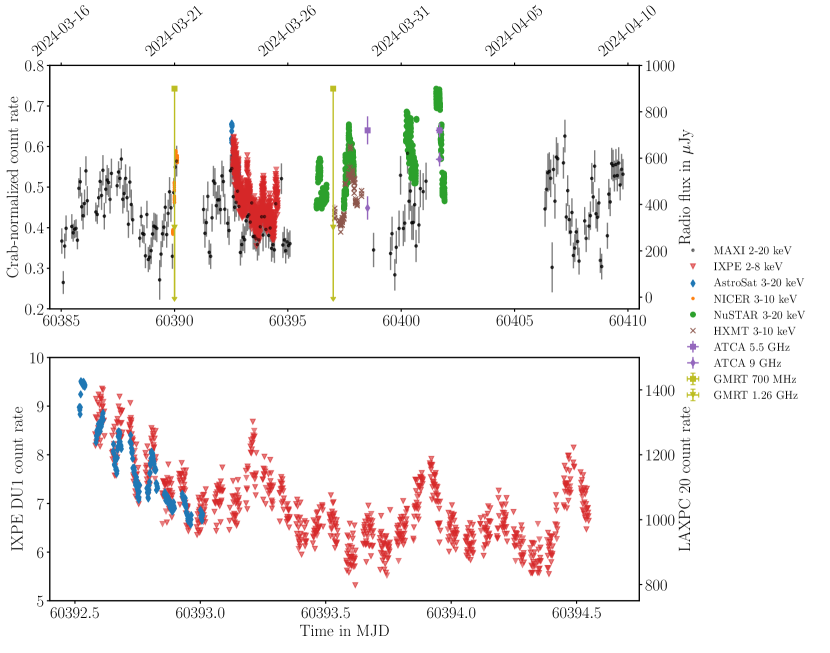
IXPE observed the source during the latter half of March 2024 as detailed in Table 1. Since GX 3400 is variable on a much shorter timescale, it is paramount to have simultaneous observations with instruments with spectro-timing capabilities to identify the exact state and investigate the branch-resolved polarization. We coordinated a multi-wavelength campaign of the source to observe the source simultaneously or at least contemporaneously with IXPE. The details of these observations are noted in Table 1, and a combined lightcurve of the campaign is shown in Figure 1. To plot in the same scale, the X-ray lightcurves have been background-subtracted and normalized with the Crab count rates for each respective instrument, except for the IXPE lightcurve, which is scaled by a factor of 15 (the reason for scaling the IXPE observation is described in section A.1) The details of the data reduction for individual observatories and instruments are mentioned in various subsections of Appendix A.
| Epoch | Observatory | Instrument | Observation ID | Start Time | Stop Time | Exposure (in ks) |
| 0 | NICER | XTI | 7108010101-2 | 2024-03-20 22:14:20 | 2024-03-21 03:01:08 | 2.4 |
| GMRT | – | ddtC332 | 2024-03-20 22:30:00 | 2024-03-21 01:30:00 | 3.54 | |
| 1 | IXPE | GPD (DU1–3) | 03003301 | 2024-03-23 13:56:24 | 2024-03-25 13:09:44 | 99.0 |
| AstroSat | SXT | 9000006138 | 2024-03-23 12:23:48 | 2024-03-24 00:15:28 | 14.2 | |
| LAXPC | 2024-03-23 12:24:50 | 2024-03-24 00:13:10 | 23.1 | |||
| 2 | NuSTAR | FPMA/B | 91002313002 | 2024-03-27 06:24:26 | 2024-03-27 16:53:46 | 12.4 |
| Insight-HXMT | LE | P061437700101- | 2024-03-28 01:33:25 | 2024-03-29 06:04:41 | 6.46 | |
| ME | P061437700109 | 2024-03-28 01:32:54 | 2024-03-29 06:53:30 | 13.98 | ||
| GMRT | – | ddtC332 | 2024-03-27 22:30:00 | 2024-03-28 01:30:00 | 3.54 | |
| NuSTAR | FPMA/B | 91002313004 | 2024-03-28 11:15:40 | 2024-03-28 21:45:00 | 12.5 | |
| ATCA | – | CX566 | 2024-03-29 11:29:40 | 2024-03-29 13:18:20 | 6.0 | |
| 2+ | NuSTAR | FPMA/B | 91002313006 | 2024-03-31 04:57:17 | 2024-03-31 16:13:33 | 11.4 |
| NuSTAR | FPMA/B | 91002313008 | 2024-04-01 13:00:41 | 2024-04-01 21:54:01 | 10.9 | |
| ATCA | – | CX566 | 2024-04-01 12:43:20 | 2024-04-01 20:25:30 | 14.04 |
2.1 Model-independent X-ray polarimetric analysis
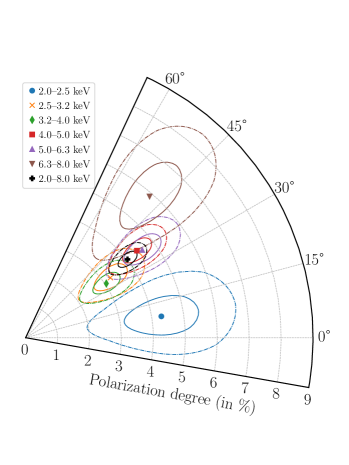
We investigated the polarimetric properties of the source by extracting the pcube using ixpeobssim in various energy bands from the filtered events after appropriate weighting (see section A.1 for details). The pcube encapsulates the normalized Stokes Q and U information as a function of energy. In the full energy band (2–8 keV), we detected a significantly polarized emission with PD = % and PA = (black point in the left panel of Figure 2). The confidence intervals reported in the text correspond to intervals unless indicated otherwise. In a model-independent fashion, we probed the energy dependence of the polarization by extracting the pcube in six logarithmically spaced bins in 2–8 keV (depicted in the left panel of Figure 2 and noted in Table 2). Most of the energy bands have a similar PA as the full bands, with the exception of 2–2.5 keV, which has a slightly lower PA. The PD of different energy bands hint at a slight increase towards higher energies but are consistent within the confidence level. The larger error on the PA in 2–2.5 keV energy band is due to a lower modulation fraction of individual detector units (Di Marco et al., 2022). Similar uncertainties have been seen in previous IXPE observations of other sources (e.g. Rawat et al., 2023).
| Model-independent-PCUBE | ||
|---|---|---|
| Energy band (keV) | PD (%) | PA () |
| 2.0–8.0 | ||
| 2.0–2.5 | ||
| 2.5–3.2 | ||
| 3.2–4.0 | ||
| 4.0–5.0 | ||
| 5.0–6.3 | ||
| 6.3–8.0 | ||
| Count rate resolved in 2–8 keV | ||
| Count rate range | PD (%) | PA () |
| 5.1–6.8 | ||
| 6.8–9.5 | ||
| Spectro-polarimetric analysis | ||
| Component | PD (%) | PA () |
| Disk | ||
| Blackbody | ||
| Corona | ||
| Assuming blackbody emission is unpolarized | ||
| Disk | ||
| Corona | ||
We investigated the polarization properties of the source as a function of the count rate by dividing the IXPE observation into two subsets (high and low), using the median count rate ( counts/s in DU1). The 2–8 keV polarization for these subsets (PD/PA for high: %/ and for low: %) are consistent with each other within 2 confidence interval (also noted in Table 2).
2.2 Identification of the branch
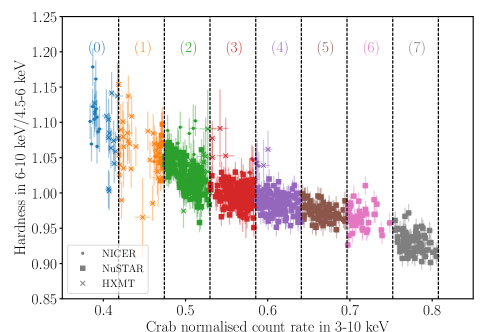
GX 3400 shows a strong evolution of the spectro-timing properties as a function of the Z-track position. Thus, to compare the properties of the source across various observations, we constructed the HID of the source in various energy bands for different X-ray instruments (Figure 3). In all the cases, the source is observed to follow a track similar to the HB (see Bhargava et al., 2023, for example). We verify the nature of the branch by investigating the timing properties of the source, in particular the 3–20 keV power density spectrum (PDS) in from AstroSat-LAXPC and the 3–30 keV co-spectrum from NuSTAR-FPMA/B. The details of the HID-resolved timing analysis are discussed in section B.1. The presence of the quasi-periodic feature in 20–42 Hz (see Table 3) is a clear indication that the source is in HB (Jonker et al., 2000; Bhargava et al., 2023; Pahari et al., 2024). Additionally, after the end of the AstroSat observation, the IXPE DU1 count rate never goes beyond the 9 counts/s. For a transition to the NB the source has to go through the hard apex (Bhargava et al., 2023). Comparing the Crab-normalized NuSTAR count rates and scaled IXPE count rates, it is evident that during the IXPE observation, the source stayed in zone 6 or lower (see the zone divisions in the HID; Figure 3). Therefore, for the duration of IXPE observation GX 3400 stayed in HB.
2.3 Spectro-polarimetric investigation using AstroSat and IXPE
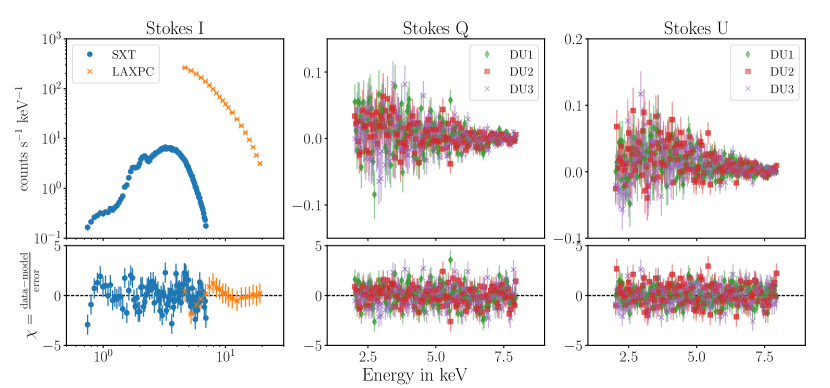
The marginally different PA from 2–2.5 keV emission suggests that different spectral components could have different PA (also seen for other Z-sources; Farinelli et al., 2023; Fabiani et al., 2024). Motivated by this, we conducted a spectro-polarimetric analysis using the simultaneous AstroSat and IXPE observations. The last three orbits of the SXT observations indicated an abnormal excess in count rate, which is not seen in the same bands in LAXPC or IXPE. Thus, we excluded those orbits from both LAXPC and SXT spectra. For spectro-polarimetric modeling, we used the statistic and have reported confidence intervals unless stated otherwise. We use xspec v12.14.0 to model the spectra. We modeled the SXT+LAXPC spectra with the spectral decomposition from Bhargava et al. (2023) (which corresponds to a similar source state). The spectral model, tbabs*(diskbb+bbodyrad+nthcomp), assumed that the seed photon temperature for Comptonization is tied to the diskbb temperature and the input spectrum for nthcomp assumed to be disk-like. Similar to (Bhargava et al., 2023), we note that the inner temperature of the accretion disk ( keV) is lower than the blackbody component ( keV). The absorption column is found to be consistent with 1023 cm-2 (Bhargava et al., 2023) with the abundances from Wilms et al. (2000) and cross-sections from Verner et al. (1996). The authors would like to refer the readers to Figure 2 of (Bhargava et al., 2023), which depicts the spectral decomposition of the source assumed for this work. This model is sufficient to describe the spectra (with a /degrees of freedom or dof of 153.0/109). The parameters of the additive components are found to be consistent with those in Bhargava et al. (2023). The reduced here is slightly higher than Bhargava et al. (2023), possibly due to spectral information from multiple HID zones being averaged for the spectro-polarimetric analysis. We also conducted f-tests to determine the necessity of three additive components to describe the spectra (as prescribed in Bhargava et al. (2023)) and concluded that for an optimal description of the spectra, tbabs*(diskbb+bbodyrad+nthcomp) is sufficient. We also include cross-normalization constants between LAXPC and SXT, which are consistent within 10% (Bhargava et al., 2019, 2023).
We included the Stokes Q and U spectra for all the detector units to conduct the spectro-polarimetric tests. We included these spectra by grouping them with LAXPC spectra. We checked if the observation is consistent with a single polarization for all the components by fitting the spectra to tbabs*polconst*(diskbb+bbodyrad+nthcomp). Since we intended to estimate polarization properties assuming the inherent spectral model as discussed above, we kept the spectral parameters fixed while estimating the PD/PA. We found that assuming a constant polarization results in an acceptable fit (/dof=941.3/1009) and a PD/PA of %/. Since the model-independent analysis indicated a possible change in the PA as a function of energy, we replaced the constant polarization with linear polarization (pollin) and kept the slope of the PD fixed and the slope of the PA free. It resulted in a slightly lower /dof = 935/1008. To determine which model is statistically better, we computed the Akaike Information Criterion (AIC) and Bayesian Information Criterion (BIC) for both models. The AIC prefers pollin with positive evidence for polconst (AIC = 4.78) while the BIC suggests that both models are equally good (BIC=0.12, with BIC of polconst lower than pollin). Since either criterion is not able to distinguish between the models overwhelmingly (i.e. AIC or BIC ), we prefer the simpler model, i.e. the polarization is constant with energy.
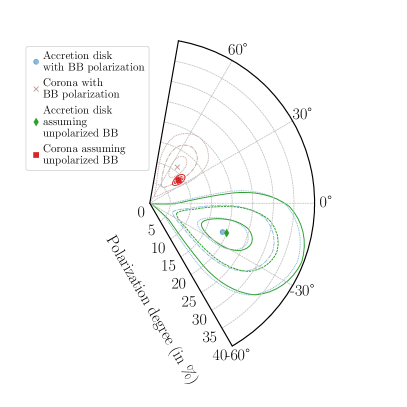
Other Cyg-like Z-sources have hinted at a possible difference in PA of additive components (Farinelli et al., 2023; Fabiani et al., 2024). Therefore, we tested the same hypothesis by applying polconst individually to diskbb, bbodyrad and nthcomp. We found that there is a detection of polarization from accretion disk (PD = %, PA = ) and a detection from the Comptonizing medium (PD = %, PA = ) while the PD of blackbody component (%) is consistent with zero within confidence interval (/dof=923.3/1005). Notably, the PA of the accretion disk component is significantly different from that of the Comptonizing medium (at a confidence of 5.7). If we assume that there is no polarization from the blackbody emission, then we obtain stricter limits on the PD/PA for disk (PD = %, PA = ) and Comptonized emission (PD = %, ) for a similar fit (/dof=926.2/1007). The confidence on the disk polarization increased to level while the Comptonized emission shows a highly significant polarization (), and the PA between them is different at confidence level. We depict the count spectra from AstroSat (equivalent to Stokes I), Q and U spectra from IXPE with residuals for the model assuming an unpolarized blackbody emission in the Figure 4.
To compare if the polarization from individual components is statistically different than single polarization from all components, we compute the AIC and BIC for case a) free blackbody PD and case b) blackbody PD fixed at 0% and compare it with the AIC and BIC for model tbabs*polconst*(diskbb+bbodyrad+nthcomp). For case a), the AIC overwhelmingly prefers individual polarization components (AIC=11.5) over a single polarization component, while the BIC prefers a single polarization component over individual components strongly (BIC=8.1). For case b), both AIC and BIC prefer individual components over the single component but with varying degrees of acceptance (AIC=12.3 and BIC=2.5). Additionally, comparing case a) and b) with AIC and BIC indicates that both criteria prefer case b) with different degrees of acceptance (AIC=0.8 and BIC=10.6). Based on the information criteria we claim that there is reasonable evidence for individual components having different polarization properties and the blackbody emission being unpolarized.
2.4 Modeling the Iron-line
For each of the zone-resolved NuSTAR spectra defined in Figure 3, we employed the same phenomenological model described above, i.e., with tbabs*(diskbb+bbodyrad+nthcomp) (the details of the continuum modeling are described in section B.2). This allows for a fair comparison with the AstroSat and IXPE results above. However, we found that there was a residual asymmetric feature in all of the six zone-resolved spectra, which we interpret as a relativistic Fe emission line. Previous observations with XMM-Newton and Chandra/HETGS have also revealed the presence of the relativistic Fe K emission line (D’Aì et al., 2009; Cackett et al., 2010; Miller et al., 2016). To fit for the emission line, we performed preliminary fits and tried a simple Gaussian, a diskline model, a relline model, and replaced the nthcomp component with a relxillCp to account for the Comptonized component and Fe line feature (Fabian et al., 1989; Zdziarski et al., 1996; Życki et al., 1999; Dauser et al., 2010). We found that the relline model is the best description for the asymmetric line, as determined by the between the inclusion and exclusion of the model (Dauser et al., 2010). The high-resolution X-ray observations with Chandra/HETGS constrained the disk inclination to be , so in what follows, we fix the disk inclination parameter in the relline model to (Miller et al., 2016).
Across the six zone-resolved NuSTAR spectra, we found that the rest-frame centroid energy did not significantly shift as a function of the HID zone. We found energies between 6.36 keV to 6.58 keV, consistent within . However, the line normalization decreased (though not monotonic) from in zone 2 to in zone 7.
3 Discussion
During the campaign, the source stayed primarily in the HB. The HID from various X-ray instruments, the timing analysis of AstroSat and NuSTAR observations (which showed QPOs at frequencies typical of HB oscillations) and the spectral properties of the source provide ample evidence for the state of the source. The HB oscillation evolved across the HB in a typical manner, i.e., going down the HB, from 21.2–23.4 Hz to 43.2 Hz while fractional rms amplitude of the QPO decreased. Similar timing evolution have been reported using various fast-timing instruments earlier (Jonker et al., 2000, 2002; Bhargava et al., 2023; Pahari et al., 2024). The hard apex is expected to show a frequency of Hz (Jonker et al., 2000) and all QPOs we observe are lower in frequency, which indicates during AstroSat, NuSTAR, and by extension IXPE epochs, the source was in the HB. The broadband spectra also seem to reiterate previous findings, i.e., the detection of three spectral components varying along the Z-track (Iaria et al., 2006; Seifina et al., 2013; Bhargava et al., 2023). GX 3400 staying in one state for a duration of 13 days is quite unusual as the source has traced the complete HID over a time scale of few days (Jonker et al., 2000) or flit between HB and NB in the same time scale (Bhargava et al., 2023). It is possible that during the intervals where we did not have pointed X-ray observations, it may have visited NB/FB, but the MAXI/GSC monitoring of the source is unable to discern such visits.
3.1 Discovery & Nature of X-ray Polarization in GX 340+0
The first IXPE observation of GX 3400 revealed a significant X-ray polarization in 2–8 keV. The PD of source in HB is % in the HB, and a similar PD was observed in GX 51 (Fabiani et al., 2024) and XTE J1701462 (Cocchi et al., 2023). The PA for polarized emission in the full band is measured to be .
The energy-resolved polarization study indicates that the lowest energy bin (i.e. 2–2.5 keV) has a different PA as compared to the PA of the rest of the emission (albeit a marginal difference, see Figure 2 left panel). Previous spectral studies of the source revealed that in softer X-rays (typically below 3 keV), the emission has three active components which could contribute to the polarization in this band (e.g. Lavagetto et al., 2004; Iaria et al., 2006; Lin et al., 2007, 2009, 2012; Seifina et al., 2013; Bhargava et al., 2023). In the higher energy bands, two of these components dominate mainly. The model-independent observation of polarization indicates that in the higher bands ( keV) all the emission aligns in PA. These components have been modeled as a combination of accretion disk+Comptonized emission (for Cyg X-2; Done et al. 2002), blackbody+Comptonized emission (Church et al., 2006; Bhargava et al., 2023), or a combination of two Comptonized emissions of different electron temperatures (Seifina et al., 2013). Since we do not observe a significant variation of PA with energy in 2.5–8 keV, we can infer that either both components have an aligned emission or one component has a stronger contribution to the polarization, which dictates the observed polarization properties. In the 2–2.5 keV band, due to the presence of a third component (i.e. accretion disk), the net PA of the emission changes marginally. Simulations by Gnarini et al. (2022) for a slab-like corona predicts a change in the observed PA similar to what is observed in GX 3400 (i.e. lower PA in softer X-rays) for various inclination angles.
For a spectro-polarimetric analysis, we have assumed that the emission comprises of accretion disk, blackbody and a corona, which is fed by photons from the accretion disk. Assuming constant polarization from individual components, we estimate that the disk emission has a relatively high degree of polarization albeit with low detection significance (Table 2). The simulations of the accretion disk predict that due to the light bending effect in the strong gravity regime, the inner emission of the accretion disk is expected to have a polarization of a few per cent at the high inclination of the accretion disk (Schnittman & Krolik, 2009). The PA of the disk emission in GX 3400 is also observed to deviate by 59–75 with respect to the Comptonized emission. Similar differences in the PA of disk and Comptonized emission are also seen in other Z-sources (Cocchi et al., 2023; Fabiani et al., 2024), which could indicate that it might be an intrinsic property of the HB of the Cyg-like Z-sources. We note that the present observation seems to indicate that the blackbody emission is consistent with zero PD, and if the PD from the blackbody component is assumed to be zero, then we obtain strong constraints on the PD from the coronal emission, and the disk emission is estimated to have a polarization at confidence. This would favor an interpretation of the blackbody component as a symmetrical emission from the surface of the NS, perhaps a hotspot, while the comptonised emission is covering the accretion disk in a slab like geometry (see figure 1 of Gnarini et al., 2022, for a schematic).
3.2 Radio emission from GX 3400
Our IXPE observations of GX 3400 were accompanied by a supporting quasi-simultaneous radio campaign with the upgraded Giant Metrewave Radio Telescope (GMRT) and the Australia Telescope Compact Array (ATCA). See Appendix A for complete details on the observations, data reduction, and analysis. The GMRT observations were carried out on two epochs, on 2024-03-20/21 and 2024-03-27/28 at central frequencies of 750 MHz and 1.26 GHz (see Table 1). On both dates, in both frequency bands, no radio counterpart to GX 3400 was detected by the GMRT.
ATCA observations occurred on 2024-03-29 and 2024-04-01, where data were taken at 5.5 GHz and 9 GHz (under project code CX566). A bright radio source was detected at both frequencies on both dates with flux densities of Jy at 5.5 GHz and Jy at 9 GHz on 2024-03-29, and Jy at 5.5 GHz and Jy at 9 GHz on 2024-04-01. These fluxes are brighter than limits placed at similar frequencies previously (Berendsen et al., 2000). On 2024-04-01, we were also able to place constraints on the linear and circular polarization (LP and CP, respectively) of the source. While no LP or CP was detected, stacking the two frequencies together gives 3 upper limits of 6% on the LP and 4% on the CP (centred at 7250 MHz). Such constraints are consistent with expectations for the radio emission from an accreting X-ray binary (e.g., Fender, 2006).
The non-detection of GX 3400 in the GMRT observations but detection by the ATCA observations suggest a break in the radio spectrum, lying between the 1.26 GHz GMRT band and the 5.5 GHz ATCA band. Such a break can be a result of either synchrotron self-absorption or free-free absorption (e.g., Gregory & Seaquist, 1974; Seaquist, 1976; Miller-Jones et al., 2004; Chauhan et al., 2021). However, due to the non detection in the lower frequency bands (2000 MHz) we are unable to determine which mechanism is responsible for the spectral turnover (e.g., Rybicki & Lightman, 1986). We also note that the radio source would be expected to vary as the accretion properties evolve on relatively short timescales, as seen in the evolution of radio flux at 9 GHz across two ATCA observations. As the GMRT and ATCA observations are not exactly simultaneous, it is, therefore, possible that the source state has changed between the observations. However, during both GMRT observations, we have simultaneous X-ray coverage (NICER during the first and Insight-HXMT during the second, see Figure 1) and the X-ray HID in Figure 3 clearly indicates during both these epochs the source was on the HB. The second ATCA observation is strictly simultaneous with NuSTAR and thus determines that the source was on the HB as well. Previous investigations in radio wavelengths have suggested that radio emission is also highly variable (and correlated with X-ray variability). A non-detection (with upper-limits of 200 Jy) with ATCA (Berendsen et al., 2000) and with current non-detection in 0.7–1.5 GHz with GMRT suggests that the radio emission is variable between states (as shown by historical Very Large Array detections of 1.0–1.5 Jy at 1.4 GHz on the NB Oosterbroek et al. 1994 and current detection by ATCA in 5.5–9 GHz on the HB). Hence, simultaneous observations of GX 3400 are paramount to determine the behavior of the source.
4 Conclusion
Here, we summarize the key results from our X-ray and radio investigation of GX 3400 primarily with IXPE to investigate the polarization properties.
-
•
The source stayed in the horizontal branch throughout the epochs of observations, which spanned roughly 13 days.
-
•
For the first time, we detect X-ray polarization in GX 3400 in 2–8 keV with the PD = % and PA = . We also detect significant polarization in various energy bands, with the 2–2.5 keV polarization indicating a different PA (at a confidence) as compared to the PA of other energy bands (which all have similar PA).
-
•
The spectral parameters are typically consistent with previously reported works, with broadband spectra requiring 3 components (accretion disk, blackbody, and Comptonised emission) to describe the spectra. The accretion disk is found to have a low temperature (0.2 keV) and is assumed to be the source of the seed photons for Comptonization. The blackbody component is roughly at 1 keV. Additionally, NuSTAR spectra show an asymmetric iron line feature consistent with previous reports of reflection features which varies as the source move along the HB.
-
•
Due to almost all energy bands depicting a similar PA, a constant polarization (i.e. no dependence of PD/PA on energy) is able to fit the spectro-polarimetric data. If we assume that the blackbody component is not polarized, then disk polarization is greater than 3 while Comptonised emission has a highly significant detection ().
-
•
In radio wavelengths, the source is not detected at 700-1500 MHz (3 upper limit at 0.9 mJy) and is significantly detected in higher frequencies (5.5-9 GHz). This indicates that there is a spectral break between 1.5-5.5 GHz.
Appendix A Data Reduction
A.1 IXPE
IXPE (Weisskopf et al., 2022) observed GX 3400 for an exposure of ks from 2024-03-23 13:56:24 to 2024-03-25 13:09:44 using all three gas pixel detector units (referred as DU1, DU2 and DU3). Due to a spacecraft anomaly, some of the engineering data could not be recovered, and the data was estimated by extrapolating the rest of the data. Hence, for the observation, a special processing was conducted by the instrument team, and thus, level 2 files as provided by the instrument team were utilized for the analysis.
We use ixpeobssim software (v31.0.1) to process the observations and extract the polarization properties of the source (Kislat et al., 2015; Baldini et al., 2022). We select the source events from a circular region of radius 1.6 and the background region from an annular region of inner radius of 2.5 and outer radius of 5. We bin the selected events using different algorithms viz. pcube, phaq, phau to generate polarization cubes, Q spectra, and U spectra, respectively, for each DU. The calibration files version v13 obssim20240101_alpha075 were used to extract appropriately weighted data products. For the model-independent analysis, the polarization information from the detectors was combined and depicted in Figure 2.
To plot the IXPE lightcurve in the same scale as all instruments in Figure 1, we scale the IXPE count rates by a factor of 15. GX 3400 appears as a point source in the IXPE image, while the Crab observation shows a structure of a pulsar wind Nebula. This causes a strong dependence of the count rate on the region size, and using a region of 1.6 in Crab yielded a significantly higher count rate, resulting in a lower Crab-normalized count rate for IXPE. Since the purpose of the figure is to show the simultaneous evolution of the source, we scale the light curve by a factor of 15. We depict the actual count rate of the source in the bottom panel of Figure 1.
A.2 NICER
NICER (Gendreau et al., 2016) observed GX 3400 simultaneously with the first epoch of GMRT observation (i.e. 2024 March 20-21) to characterize the source state. The source was observed for 4 segments of s each per International Space Station orbit ( min). The data was processed using the standard filtering criteria: a) excluding detectors 14 and 34, b) excluding South Atlantic Anomaly passages, c) Elevation angle for the bright Earth limb , and d) Undershoot and Overshoot rates of 0–500 and 0–30, respectively, with the tool nicerl2 distributed as part of nicerdas 2024-02-09_V012 (heasoft v6.33). The light curves and spectra were extracted using the nicerl3-lc and nicerl3-spect with the background model scorpeon (Markwardt et al., 2024) which also allows for estimation of the background count rate in various energy bands. For normalizing the light curve with Crab, a similar analysis was conducted on a Crab observation from December 2023 21 (observation id: 6013010117).
A.3 AstroSat
Coordinating with the epoch of IXPE observation, AstroSat (Singh et al., 2014) observed the source with Large Area X-ray Proportional Counter (LAXPC; Yadav et al., 2016, 2017) as a primary instrument and Soft X-ray telescope (SXT; Singh et al., 2016, 2017) simultaneously. The AstroSat observation covered a total duration of 45 ks with a net exposure of 23.1 ks in LAXPC and 14.2 ks in SXT. The details of data reduction procedures for each instrument are summarized in the following sub-sections.
A.3.1 LAXPC
The orbit-wise level 1 data was downloaded from AstroBrowse111https://astrobrowse.issdc.gov.in/astro_archive/archive/Home.jsp and the data was processed using the LAXPCsoftware22Aug15222http://astrosat-ssc.iucaa.in/uploads/laxpc/LAXPCsoftware22Aug15.zip (Antia et al., 2021; Misra et al., 2021). LAXPCsoftware22Aug15 includes the relevant calibration files, responses and software to generate higher-level data products, including the merged event file for the full observation (laxpc_make_event). The intervals corresponding to Earth occultation and South Atlantic anomaly passages were excluded using the routine laxpc_make_stdgti. Using the built-in routines, the energy-dependent light curves, spectra, associated responses, background spectrum, and background light curves were extracted. For the analysis, we consider the data from the top layer (layer 1) due to its minimal background in 3–20 keV thus limiting the spectral analysis to the same energy range. For the analysis, the data from LAXPC 20 was considered as the other two units were not suitable for spectral analysis (LAXPC 10 has shown abnormal gain, and LAXPC 30 suffered a gas leak early in the mission). For the spectral analysis of the data, we assume a 3% systematic error (Bhargava et al., 2019, 2023).
A.3.2 SXT
The orbit-wise level 2 processed data was procured from AstroBrowse333https://astrobrowse.issdc.gov.in/astro_archive/archive/Home.jsp which has been processed with the latest version of the SXT pipeline (AS1SXTLevel2-1.5). The individual orbits were merged using the Julia tool SXTMerger as suggested by the SXT Payload Operation Centre (POC). The standard products (i.e. spectra and lightcurves) were extracted using xselect (v2.5b from heasoft v6.32.1) for a circular region of 14. For the extraction of the spectral products, only the grade 0 events were selected, and the appropriate response matrix was obtained from the POC. The standard ancillary response file was modified for the selected region using the sxtARFModule tool provided by the POC. For the spectral analysis, we assume a 1.5% systematic error (Sridhar et al., 2019; Bhargava et al., 2023).
A.4 NuSTAR
NuSTAR (Harrison et al., 2013) carried out four Target of Opportunity (ToO) observations of GX 3400 on 2024 March 27, 28, 31, and April 1, for a total of 47.3 ks of filtered exposure (details of the observations are mentioned in Table 1). The data were processed using the standard NuSTAR Data Analysis Software (NuSTARDAS) version 2.1.2 available under HEASoft 6.33, and with the CALDB version 20240405. We extracted the source events with a circular region of 120 in radius with the centroid coordinates RA = 16h 45m 47.7s, DEC = -45 36 40.0. We also defined a background region in a source-free region with a circular region of radius 120 with the centroid coordinates RA = 16h 46m 20.1184s, DEC = -45 29 33.231. We ran the nupipeline task to process the data and nuproducts to generate light curves and spectra. The light curves were binned with 128 s bins, and the spectra were regrouped to have a minimum of 30 counts per spectral bin. To facilitate comparison between the different instruments, we generated Crab-normalized light curves in different energy bands. We utilized the observation from 2024 March 18 (ObsID 11002303004, exposure=4.983 ks) and extracted the source region with centroid coordinates RA = 5h 34m 30.9s, DEC = +22 00 53.0 with a 200 radius, and a background region with centroid coordinates RA = 5h 34m 21.1461s, DEC = +21 52 55.149, with a 150 radius.
A.5 Insight-HXMT
Insight-HXMT (Zhang et al., 2020) observed GX 3400 from 2024-03-28 01:21:40 to 2024-03-29 07-28:35. The data are extracted from all three instruments using the Insight-HXMT Data Analysis software (HXMTDAS) v2.06444The data analysis software is available from http://hxmten.ihep.ac.cn/software.jhtml., and filtered with the following standard criteria: (1) pointing offset angle less than ; (2) Earth elevation angle larger than ; (3) the value of the geomagnetic cutoff rigidity larger than 8 GV;(4) at least 300 s before and after the South Atlantic Anomaly passage. To avoid possible contamination from the bright Earth and nearby sources, we only use data from the small field of view (FoV) detectors (Chen et al., 2018; Yang et al., 2022). The HE data are not used in our spectral analysis as the HE spectra are dominated by the background. The energy bands adopted for spectral analysis are 2-10 keV for LE and 10-20 keV for ME.
A.6 GMRT
We observed GX 3400 with the wideband receiver backend of GMRT in two frequency bands - in the frequency band 4 (central frequency 750 MHz, bandwidth 400 MHz) and band 5 (central frequency 1260 MHz, bandwidth 400 MHz) spread over two epochs on 2024 March 20-21 and 2024 March 27-28 (Proposal ddtC332). The raw data were downloaded in the FITS format and converted to the CASA (CASA Team et al., 2022) measurement set format. Then the data was calibrated (3C286 was used for flux calibration, and J1717-398 was used for phase calibration) and imaged using the automated continuum imaging pipeline CASA-CAPTURE (Kale & Ishwara-Chandra, 2021). Eight rounds of self-calibration were done within each pipeline run. No sources were detected at the position of GX 3400 in both frequency bands and at both epochs. So, we place 3 upper limits of 900 Jy in band 4 (750 MHz) and 300 Jy in band 5 (1.3 GHz) by computing the RMS flux density in a large source-less region in the final image.
A.7 ATCA
GX 3400 was observed by the Australia Telescope Compact Array (ATCA) on 2024-03-29 and 2024-04-01 under project code CX566. Observations on 2024-03-29 ran between 11:29:40 UT and 13:18:20 UT, while on 2024-04-01, GX 3400 was observed between 12:43:20 UT and 20:25:30 UT. Data were recorded at central frequencies of 5.5 GHz and 9 GHz, with 2 GHz of bandwidth at each frequency. For both epochs, we used PKS B1934638 for primary bandpass and flux calibration, and J16314345 for gain calibration. Data were calibrated and imaged, following standard procedures with the Common Astronomy Software Application (CASA version 5.1.2; CASA Team et al., 2022). Imaging used a Briggs robust parameter of zero, balancing sensitivity and angular resolution, as well as suppressing sidelobes from bright sources in the field. GX 3400 was detected on both epochs. Fitting for a point source in the image plane, we measure flux densities of Jy at 5.5 GHz and Jy at 9 GHz on 2024-03-29 and Jy at 5.5 GHz and Jy at 9 GHz on 2024-04-01. Our ATCA observation taken on 2024-04-01 had sufficient hour angle coverage that we can measure the radio polarization. To do so, we used the unpolarised PKS B1934638 to solve for antenna leakages and the CASA task qufromgains to model the polarization angle of the gain calibrator. No linear (or circular) polarization was detected at either frequency. Stacking the 5.5 GHz and 9 GHz data together to provide our deepest limits gives 3 upper limits of 6% on linear polarization and 4% on the circular polarization (at 7.25 GHz).
Appendix B HID-resolved analysis
To verify the branch, we divide all instrument HID into multiple zones based on the Crab-normalized count rates (shown as vertical lines in Figure 3). Various observations sample a subset of these zones, e.g. NICER samples zones 0–4 while NuSTAR samples zones 2–7. Based on the HID division, we determined the time intervals corresponding to each zone and used them to extract the HID-resolved products using the techniques mentioned in section A.
B.1 HID-resolved timing analysis
From AstroSat-LAXPC observation, we have extracted rms-normalized and Poisson-noise subtracted power density spectrum (PDS) in the 3–30 keV energy range after removing data gaps and count drops due to telemetry losses. Each PDS is fitted separately using a combination of power-law and multiple Lorentzians in the frequency range of 0.05–100 Hz. From the best-fit model components, total fractional rms, QPO frequencies, and their fractional rms are calculated. Fitted parameter values for PDS corresponding to different zones are provided in Table 3.
To ensure consistency and to corroborate the branch-resolved spectroscopic results from NuSTAR, we analyzed the 3–30 keV NuSTAR cospectra for each of the zones (Huppenkothen & Bachetti, 2018). The cospectrum is the real part of the cross-spectrum, and these were generated using 32 s segments with Stingray utilizing data from the two independent detectors (FPMA and FPMB); in this case, uncorrelated variability such as dead time effects, which can be significant for NuSTAR, is eliminated (Huppenkothen & Bachetti, 2018; Huppenkothen et al., 2019a, b). The cospectra were well described by the combination of a zero-centred Lorentzian (i.e., centroid frequency of Hz) to describe the broadband noise and a Lorentzian to describe the QPO. In the case of Zone 6, where QPO parameters were unconstrained, perhaps due to low statistics. We report the timing parameters from the cospectra in Table 3.
| Zone | Observed QPO Frequency (Hz) | Observed QPO rms (%) | ||
|---|---|---|---|---|
| Number | AstroSat | NuSTAR | AstroSat | NuSTAR |
| Zone 2 | ||||
| Zone 3 | ||||
| Zone 4 | ||||
| Zone 5 | ||||
| Zone 6 | ||||
B.2 HID-resolved spectral modeling
In section 2.4, we described the modeling of the Fe K emission line. Here, we describe briefly the modeling of the continuum, where we fit with tbabs*(diskbb+bbodyrad+nthcomp) as with the AstroSat and IXPE joint fit (and relline for the Fe K emission line). We jointly fit the FPMA and FPMB spectra with the same model and included a cross-calibration constant. The cross-calibration constant was around 0.98 for all six zone-resolved spectra. Given the higher energy coverage of NuSTAR, we fixed the inner disk temperature () at 0.28 keV. We also set the temperature of the seed photons for the Comptonization component to be the inner disk temperature and assumed that the seed photons were provided by the accretion disk. We found a higher disk blackbody normalization value of (–, where is the apparent inner disk radius in km, is the source distance in units of 10 kpc, and is the disk inclination. We also found a higher blackbody temperature of – as opposed to values around (Bhargava et al., 2023). Finally, while we also found an electron temperature of around –, we found a higher power-law photon index of instead of –. In all individual spectral fits for the six zones, the full model reasonably describes the spectra well, with –.
References
- Antia et al. (2021) Antia, H. M., Agrawal, P. C., Dedhia, D., et al. 2021, Journal of Astrophysics and Astronomy, 42, 32, doi: 10.1007/s12036-021-09712-8
- Astropy Collaboration et al. (2018) Astropy Collaboration, Price-Whelan, A. M., Sipőcz, B. M., et al. 2018, AJ, 156, 123, doi: 10.3847/1538-3881/aabc4f
- Baldini et al. (2022) Baldini, L., Bucciantini, N., Lalla, N. D., et al. 2022, SoftwareX, 19, 101194, doi: 10.1016/j.softx.2022.101194
- Bałucińska-Church et al. (2010) Bałucińska-Church, M., Gibiec, A., Jackson, N. K., & Church, M. J. 2010, A&A, 512, A9, doi: 10.1051/0004-6361/200913199
- Berendsen et al. (2000) Berendsen, S. G. H., Fender, R., Kuulkers, E., Heise, J., & van der Klis, M. 2000, MNRAS, 318, 599, doi: 10.1046/j.1365-8711.2000.03850.x
- Bhargava et al. (2019) Bhargava, Y., Belloni, T., Bhattacharya, D., & Misra, R. 2019, MNRAS, 488, 720, doi: 10.1093/mnras/stz1774
- Bhargava et al. (2023) Bhargava, Y., Bhattacharyya, S., Homan, J., & Pahari, M. 2023, ApJ, 955, 102, doi: 10.3847/1538-4357/acee7a
- Cackett et al. (2010) Cackett, E. M., Miller, J. M., Ballantyne, D. R., et al. 2010, ApJ, 720, 205, doi: 10.1088/0004-637X/720/1/205
- CASA Team et al. (2022) CASA Team, Bean, B., Bhatnagar, S., et al. 2022, PASP, 134, 114501, doi: 10.1088/1538-3873/ac9642
- Chakraborty et al. (2011) Chakraborty, M., Bhattacharyya, S., & Mukherjee, A. 2011, MNRAS, 418, 490, doi: 10.1111/j.1365-2966.2011.19499.x
- Chauhan et al. (2021) Chauhan, J., Miller-Jones, J. C. A., Anderson, G. E., et al. 2021, PASA, 38, e045, doi: 10.1017/pasa.2021.38
- Chen et al. (2018) Chen, Y. P., Zhang, S., Qu, J. L., et al. 2018, ApJ, 864, L30, doi: 10.3847/2041-8213/aadc0e
- Church et al. (2012) Church, M. J., Gibiec, A., Bałucińska-Church, M., & Jackson, N. K. 2012, A&A, 546, A35, doi: 10.1051/0004-6361/201218987
- Church et al. (2006) Church, M. J., Halai, G. S., & Bałucińska-Church, M. 2006, A&A, 460, 233, doi: 10.1051/0004-6361:20065035
- Cocchi et al. (2023) Cocchi, M., Gnarini, A., Fabiani, S., et al. 2023, A&A, 674, L10, doi: 10.1051/0004-6361/202346275
- D’Aì et al. (2009) D’Aì, A., Iaria, R., Di Salvo, T., Matt, G., & Robba, N. R. 2009, ApJ, 693, L1, doi: 10.1088/0004-637X/693/1/L1
- Dauser et al. (2010) Dauser, T., Wilms, J., Reynolds, C. S., & Brenneman, L. W. 2010, MNRAS, 409, 1534, doi: 10.1111/j.1365-2966.2010.17393.x
- Di Marco et al. (2022) Di Marco, A., Fabiani, S., La Monaca, F., et al. 2022, AJ, 164, 103, doi: 10.3847/1538-3881/ac7719
- Done et al. (2002) Done, C., Życki, P. T., & Smith, D. A. 2002, MNRAS, 331, 453, doi: 10.1046/j.1365-8711.2002.05195.x
- Fabian et al. (1989) Fabian, A. C., Rees, M. J., Stella, L., & White, N. E. 1989, MNRAS, 238, 729, doi: 10.1093/mnras/238.3.729
- Fabiani et al. (2024) Fabiani, S., Capitanio, F., Iaria, R., et al. 2024, A&A, 684, A137, doi: 10.1051/0004-6361/202347374
- Farinelli et al. (2023) Farinelli, R., Fabiani, S., Poutanen, J., et al. 2023, MNRAS, 519, 3681, doi: 10.1093/mnras/stac3726
- Fender (2006) Fender, R. 2006, in Compact stellar X-ray sources, Vol. 39, 381–419, doi: 10.48550/arXiv.astro-ph/0303339
- Frank et al. (1987) Frank, J., King, A. R., & Lasota, J. P. 1987, A&A, 178, 137
- Gendreau et al. (2016) Gendreau, K. C., Arzoumanian, Z., Adkins, P. W., et al. 2016, in Society of Photo-Optical Instrumentation Engineers (SPIE) Conference Series, Vol. 9905, Space Telescopes and Instrumentation 2016: Ultraviolet to Gamma Ray, 99051H, doi: 10.1117/12.2231304
- Gilfanov et al. (2003) Gilfanov, M., Revnivtsev, M., & Molkov, S. 2003, A&A, 410, 217, doi: 10.1051/0004-6361:20031141
- Gnarini et al. (2022) Gnarini, A., Ursini, F., Matt, G., et al. 2022, MNRAS, 514, 2561, doi: 10.1093/mnras/stac1523
- Gregory & Seaquist (1974) Gregory, P. C., & Seaquist, E. R. 1974, ApJ, 194, 715, doi: 10.1086/153293
- Harrison et al. (2013) Harrison, F. A., Craig, W. W., Christensen, F. E., et al. 2013, ApJ, 770, 103, doi: 10.1088/0004-637X/770/2/103
- Hasinger & van der Klis (1989) Hasinger, G., & van der Klis, M. 1989, A&A, 225, 79
- Homan et al. (2007) Homan, J., van der Klis, M., Wijnands, R., et al. 2007, ApJ, 656, 420, doi: 10.1086/510447
- Homan et al. (2010) Homan, J., van der Klis, M., Fridriksson, J. K., et al. 2010, ApJ, 719, 201, doi: 10.1088/0004-637X/719/1/201
- Huppenkothen & Bachetti (2018) Huppenkothen, D., & Bachetti, M. 2018, ApJS, 236, 13, doi: 10.3847/1538-4365/aabe38
- Huppenkothen et al. (2019a) Huppenkothen, D., Bachetti, M., Stevens, A., et al. 2019a, The Journal of Open Source Software, 4, 1393, doi: 10.21105/joss.01393
- Huppenkothen et al. (2019b) Huppenkothen, D., Bachetti, M., Stevens, A. L., et al. 2019b, ApJ, 881, 39, doi: 10.3847/1538-4357/ab258d
- Iaria et al. (2006) Iaria, R., Lavagetto, G., Di Salvo, T., et al. 2006, Chinese Journal of Astronomy and Astrophysics Supplement, 6, 257, doi: 10.1088/1009-9271/6/S1/33
- Jonker et al. (2002) Jonker, P. G., van der Klis, M., Homan, J., et al. 2002, MNRAS, 333, 665, doi: 10.1046/j.1365-8711.2002.05442.x
- Jonker et al. (1998) Jonker, P. G., Wijnands, R., van der Klis, M., et al. 1998, ApJ, 499, L191, doi: 10.1086/311372
- Jonker et al. (2000) Jonker, P. G., van der Klis, M., Wijnands, R., et al. 2000, ApJ, 537, 374, doi: 10.1086/309029
- Kale & Ishwara-Chandra (2021) Kale, R., & Ishwara-Chandra, C. H. 2021, Experimental Astronomy, 51, 95, doi: 10.1007/s10686-020-09677-6
- Kislat et al. (2015) Kislat, F., Clark, B., Beilicke, M., & Krawczynski, H. 2015, Astroparticle Physics, 68, 45, doi: 10.1016/j.astropartphys.2015.02.007
- La Monaca et al. (2024) La Monaca, F., Di Marco, A., Poutanen, J., et al. 2024, ApJ, 960, L11, doi: 10.3847/2041-8213/ad132d
- Lavagetto et al. (2004) Lavagetto, G., Iaria, R., di Salvo, T., et al. 2004, Nuclear Physics B Proceedings Supplements, 132, 616, doi: 10.1016/j.nuclphysbps.2004.04.106
- Lin et al. (2007) Lin, D., Remillard, R. A., & Homan, J. 2007, ApJ, 667, 1073, doi: 10.1086/521181
- Lin et al. (2009) —. 2009, ApJ, 696, 1257, doi: 10.1088/0004-637X/696/2/1257
- Lin et al. (2012) Lin, D., Remillard, R. A., Homan, J., & Barret, D. 2012, ApJ, 756, 34, doi: 10.1088/0004-637X/756/1/34
- Markwardt et al. (2024) Markwardt, C., Arzoumanian, Z., Gendreau, K., Hare, J., & Nicer Team. 2024, in AAS/High Energy Astrophysics Division, Vol. 21, AAS/High Energy Astrophysics Division, 105.36
- Miller et al. (1993) Miller, B. W., Margon, B., & Burton, M. G. 1993, AJ, 106, 28, doi: 10.1086/116617
- Miller et al. (2016) Miller, J. M., Raymond, J., Cackett, E., Grinberg, V., & Nowak, M. 2016, ApJ, 822, L18, doi: 10.3847/2041-8205/822/1/L18
- Miller-Jones et al. (2004) Miller-Jones, J. C. A., Blundell, K. M., Rupen, M. P., et al. 2004, ApJ, 600, 368, doi: 10.1086/379706
- Misra et al. (2021) Misra, R., Roy, J., & Yadav, J. S. 2021, Journal of Astrophysics and Astronomy, 42, 55, doi: 10.1007/s12036-021-09734-2
- Mitsuda et al. (1989) Mitsuda, K., Inoue, H., Nakamura, N., & Tanaka, Y. 1989, PASJ, 41, 97
- Ng et al. (2024) Ng, M., Hughes, A. K., Homan, J., et al. 2024, ApJ, 966, 232, doi: 10.3847/1538-4357/ad35bd
- Oosterbroek et al. (1994) Oosterbroek, T., Lewin, W. H. G., van Paradijs, J., et al. 1994, A&A, 281, 803
- Pahari et al. (2024) Pahari, M., Suman, S., Bhargava, Y., et al. 2024, MNRAS, 528, 4125, doi: 10.1093/mnras/stae309
- Penninx et al. (1993) Penninx, W., Zwarthoed, G. A. A., van Paradijs, J., et al. 1993, A&A, 267, 92
- Rankin et al. (2024) Rankin, J., La Monaca, F., Di Marco, A., et al. 2024, ApJ, 961, L8, doi: 10.3847/2041-8213/ad1832
- Rawat et al. (2023) Rawat, D., Garg, A., & Méndez, M. 2023, ApJ, 949, L43, doi: 10.3847/2041-8213/acd77b
- Rybicki & Lightman (1986) Rybicki, G. B., & Lightman, A. P. 1986, Radiative Processes in Astrophysics
- Schnittman & Krolik (2009) Schnittman, J. D., & Krolik, J. H. 2009, ApJ, 701, 1175, doi: 10.1088/0004-637X/701/2/1175
- Seaquist (1976) Seaquist, E. R. 1976, ApJ, 207, 88, doi: 10.1086/154470
- Seifina et al. (2013) Seifina, E., Titarchuk, L., & Frontera, F. 2013, ApJ, 766, 63, doi: 10.1088/0004-637X/766/1/63
- Singh et al. (2014) Singh, K. P., Tandon, S. N., Agrawal, P. C., et al. 2014, in Society of Photo-Optical Instrumentation Engineers (SPIE) Conference Series, Vol. 9144, Space Telescopes and Instrumentation 2014: Ultraviolet to Gamma Ray, ed. T. Takahashi, J.-W. A. den Herder, & M. Bautz, 91441S, doi: 10.1117/12.2062667
- Singh et al. (2016) Singh, K. P., Stewart, G. C., Chandra, S., et al. 2016, in Society of Photo-Optical Instrumentation Engineers (SPIE) Conference Series, Vol. 9905, Space Telescopes and Instrumentation 2016: Ultraviolet to Gamma Ray, ed. J.-W. A. den Herder, T. Takahashi, & M. Bautz, 99051E, doi: 10.1117/12.2235309
- Singh et al. (2017) Singh, K. P., Stewart, G. C., Westergaard, N. J., et al. 2017, Journal of Astrophysics and Astronomy, 38, 29, doi: 10.1007/s12036-017-9448-7
- Sridhar et al. (2019) Sridhar, N., Bhattacharyya, S., Chandra, S., & Antia, H. M. 2019, MNRAS, 487, 4221, doi: 10.1093/mnras/stz1476
- Verner et al. (1996) Verner, D. A., Ferland, G. J., Korista, K. T., & Yakovlev, D. G. 1996, ApJ, 465, 487, doi: 10.1086/177435
- Weisskopf et al. (2022) Weisskopf, M. C., Soffitta, P., Baldini, L., et al. 2022, Journal of Astronomical Telescopes, Instruments, and Systems, 8, 026002, doi: 10.1117/1.JATIS.8.2.026002
- Wilms et al. (2000) Wilms, J., Allen, A., & McCray, R. 2000, ApJ, 542, 914, doi: 10.1086/317016
- Yadav et al. (2017) Yadav, J. S., Agrawal, P. C., Antia, H. M., et al. 2017, Current Science, 113, 591, doi: 10.18520/cs/v113/i04/591-594
- Yadav et al. (2016) Yadav, J. S., Agrawal, P. C., Antia, H. M., et al. 2016, in Society of Photo-Optical Instrumentation Engineers (SPIE) Conference Series, Vol. 9905, Space Telescopes and Instrumentation 2016: Ultraviolet to Gamma Ray, ed. J.-W. A. den Herder, T. Takahashi, & M. Bautz, 99051D, doi: 10.1117/12.2231857
- Yang et al. (2022) Yang, Z.-x., Zhang, L., Huang, Y., et al. 2022, ApJ, 937, 33, doi: 10.3847/1538-4357/ac84d6
- Zdziarski et al. (1996) Zdziarski, A. A., Johnson, W. N., & Magdziarz, P. 1996, MNRAS, 283, 193, doi: 10.1093/mnras/283.1.193
- Zhang et al. (2020) Zhang, S.-N., Li, T., Lu, F., et al. 2020, Science China Physics, Mechanics, and Astronomy, 63, 249502, doi: 10.1007/s11433-019-1432-6
- Życki et al. (1999) Życki, P. T., Done, C., & Smith, D. A. 1999, MNRAS, 309, 561, doi: 10.1046/j.1365-8711.1999.02885.x