1]\orgdivScuola Normale Superiore, Piazza dei Cavalieri 7, I-56126 Pisa, Italy 2]\orgdivSteward Observatory, University of Arizona, 933 N. Cherry Avenue, Tucson, AZ 85721, USA 3]\orgdivKavli Institute for Cosmology, University of Cambridge, Madingley Road, Cambridge, CB3 0HA, UK 4]\orgdivCavendish Laboratory, University of Cambridge, 19 JJ Thomson Avenue, Cambridge, CB3 0HE, UK 5]\orgdivCenter for Astrophysics Harvard & Smithsonian, 60 Garden St., Cambridge MA 02138 USA 6]\orgdivCosmic Dawn Center (DAWN), Copenhagen, Denmark 7]\orgdivNiels Bohr Institute, University of Copenhagen, Jagtvej 128, DK-2200, Copenhagen, Denmark 8]\orgdivDepartment of Physics, University of Oxford, Denys Wilkinson Building, Keble Road, Oxford OX1 3RH, UK 9]\orgdivDepartment of Physics and Astronomy, University College London, Gower Street, London WC1E 6BT, UK 10]\orgdivNRC Herzberg, 5071 West Saanich Rd, Victoria, BC V9E 2E7, Canada 11]\orgdivDepartment of Astronomy and Astrophysics University of California, Santa Cruz, 1156 High Street, Santa Cruz CA 96054, USA 12]\orgdivCentro de Astrobiología (CAB), CSIC–INTA, Cra. de Ajalvir Km. 4, 28850- Torrejón de Ardoz, Madrid, Spain 13]\orgdivEuropean Space Agency (ESA), European Space Astronomy Centre (ESAC), Camino Bajo del Castillo s/n, 28692 Villanueva de la Cañada, Madrid, Spain 14]\orgdivSchool of Physics, University of Melbourne, Parkville 3010, VIC, Australia 15]\orgdivARC Centre of Excellence for All Sky Astrophysics in 3 Dimensions (ASTRO 3D), Australia 16]\orgdivSorbonne Université, CNRS, UMR 7095, Institut d’Astrophysique de Paris, 98 bis bd Arago, 75014 Paris, France 17]\orgdivEuropean Southern Observatory, Karl-Schwarzschild-Strasse 2, 85748 Garching, Germany 18]\orgdivCentre for Astrophysics Research, Department of Physics, Astronomy and Mathematics, University of Hertfordshire, Hatfield AL10 9AB, UK 19]\orgdivATG Europe for the European Space Agency, ESTEC, Noordwijk, The Netherlands 20]\orgdivEuropean Space Agency, ESTEC, Noordwijk, Netherlands 21]\orgdivDepartment of Astronomy, University of Wisconsin-Madison, 475 N. Charter St., Madison, WI 53706 USA 22]\orgdivEuropean Space Agency (ESA), European Space Astronomy Centre (ESAC), Camino Bajo del Castillo s/n, 28692 Villafranca del Castillo, Madrid, Spain 23]\orgdivAstrophysics Research Institute, Liverpool John Moores University, 146 Brownlow Hill, Liverpool L3 5RF, UK 24]\orgdivNSF’s National Optical-Infrared Astronomy Research Laboratory, 950 North Cherry Avenue, Tucson, AZ 85719, USA ] ] ] ] ] ]
A shining cosmic dawn: spectroscopic confirmation of two luminous galaxies at
Abstract
The discovery by JWST of an abundance of luminous galaxies in the very early Universe suggests that galaxies developed rapidly, in apparent tension with many standard models [Finkelstein:2023a, Harikane:2023, Casey:2023, Robertson:2023a, Donnan:2024]. However, most of these galaxies lack spectroscopic confirmation, so their distances and properties are uncertain. We present JADES JWST/NIRSpec spectroscopic confirmation of two luminous galaxies at redshifts of and . The spectra reveal ultraviolet continua with prominent Lyman- breaks but no detected emission lines. This discovery proves that luminous galaxies were already in place 300 million years after the Big Bang and are more common than what was expected before JWST. The most distant of the two galaxies is unexpectedly luminous and is spatially resolved with a radius of 260 parsecs. Considering also the steep ultraviolet slope of the second galaxy, we conclude that both are dominated by stellar continuum emission, showing that the excess of luminous galaxies in the early Universe cannot be entirely explained by accretion onto black holes. Galaxy formation models will need to address the existence of such large and luminous galaxies so early in cosmic history.
We present deep James Webb Space Telescope (JWST) NIRSpec [Jakobsen:2022] spectroscopy for three candidate galaxies at , selected within the JWST Advanced Deep Extragalactic Survey (JADES) campaigns [Rieke:2023, Eisenstein:2023]. These galaxies were photometrically identified from within the 58 square arcminute observations of the GOODS-S field through JWST observations with up to 13 NIRCam and 7 MIRI filters [Hainline:2023a, Williams:2023, Robertson:2023a]. Based on photometry from the Hubble Space Telescope (HST) and Cycle 1 JWST/NIRCam data, the probability of these galaxies being low-redshift interlopers was less than 1% [Hainline:2023a]. By happenstance, the brightest of these three candidate galaxies (hereafter: JADES-GS-z14-0) is located at a projected distance of only arcsec from a foreground galaxy, and this interloper is at a redshift where its Balmer break is spectrally coincident with the observed photometric Lyman- break of the distant galaxy. For this reason, and due to its high inferred luminosity at the photometric redshift, JADES-GS-z14-0 was previously considered a low-redshift interloper with a peculiar spectral energy distribution [Hainline:2023a, Williams:2023]. The “low-redshift solution” was later disfavored from the analysis [Robertson:2023a] of the JWST/NIRCam observations carried out in the JADES Origins Field program [Eisenstein:2023], which included additional deep medium-band NIRCam observations that substantially strengthened the case for the source being at high redshift.
The three galaxies were observed with NIRSpec in multi-object spectroscopic mode [Ferruit:2022], within a single NIRSpec field of view of 9 square arcmin, with both the low-resolution prism and all three medium-resolution gratings probing the wavelength range with spectral resolving powers and , respectively. Owing to both the low luminosity of the source and NIRSpec slit losses, the faintest candidate is not significantly detected in the NIRSpec observations (see Methods), so hereon we focus on the other two galaxies, JADES-GS-z14-0 and JADES-GS-z14-1, which have been unambiguously detected in the prism spectra.
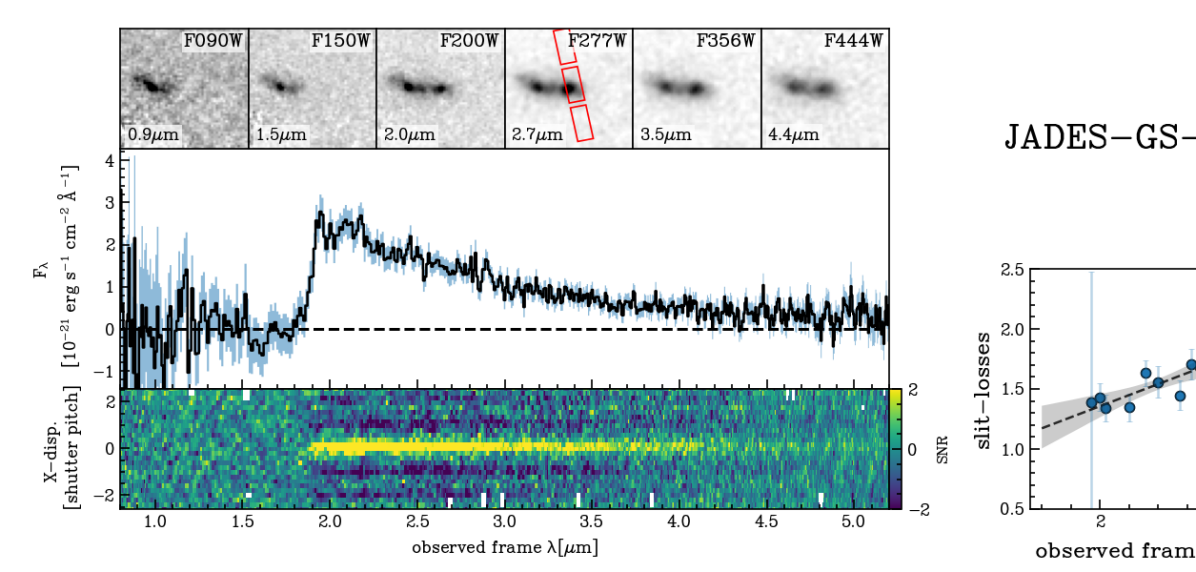
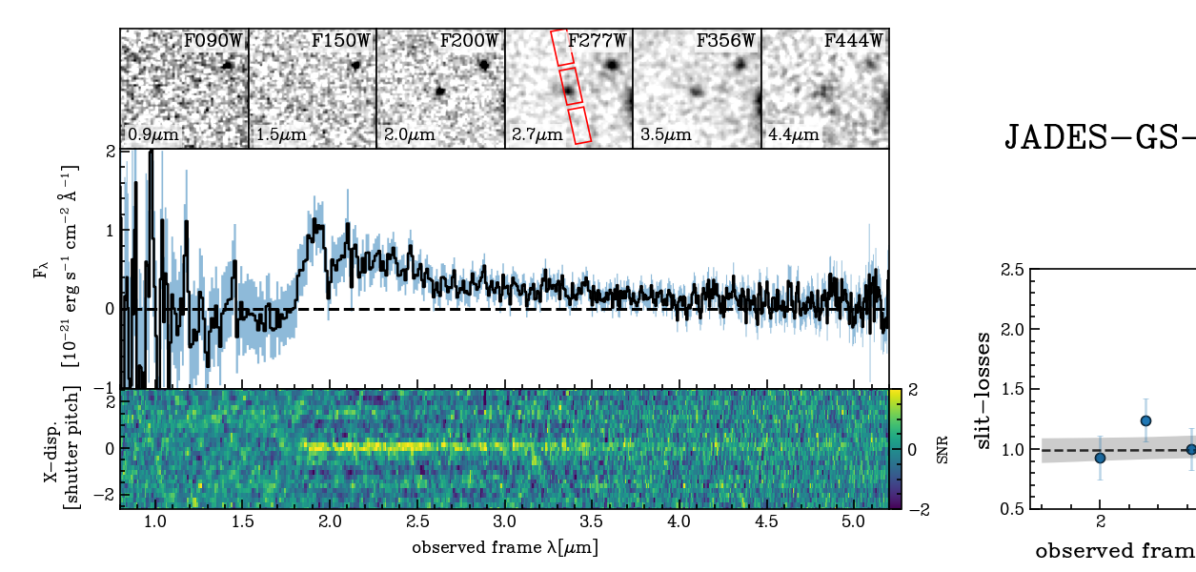
Figure 1 shows the prism spectra of JADES-GS-z14-0 and JADES-GS-z14-1; there are no prominent emission lines, but both galaxies display a clear break in the flux density, with no flux detected blueward of 1.85 m; the sharpness of which (flux ratio between m and m higher than 9) can only be explained as a Lyman- break [Curtis-Lake:2023, Wang:2023], placing both galaxies at .
We have also obtained the spectrum of the low-redshift galaxy arcsec East of JADES-GS-z14-0, which has revealed multiple prominent emission lines (e.g. [OIII]4959,5007 and H) placing this projected nearby source at a redshift of (see Methods). At this redshift, its Balmer break is at 1.62 m, excluding the possibility that the sharp break in the flux density at 1.85 m observed in the spectrum of JADES-GS-z14-0 is caused by contamination from the nearby foreground source. The presence of the nearby low-redshift galaxy, however, mildly boosts the luminosity of JADES-GS-z14-0 via gravitational lensing. We have verified that the magnification factor is less than a factor of 1.2 (see Methods).
JADES-GS-z14-0
JADES-GS-z14-1
A redshift determination for galaxies within the Epoch of Reionization based solely on the Lyman- break is sensitive to the absorption of neutral hydrogen along the line of sight [Curtis-Lake:2023, DEugenio:2023, Hainline:2024]. Recent studies have shown that the profile of the Ly spectral break does not depend only on intergalactic medium absorption but can also be modulated by: a) neutral gas in the galaxy or in the surrounding medium [Heintz:2023, DEugenio:2023, Heintz:2024]; b) the presence of a local ionized bubble [Saxena:2023, Witstok:2024]; c) Ly line emission which would enhance the flux of spectral channels containing the line in the low-resolution data [Keating:2023]. We have thus estimated the redshift of the two galaxies by parameterizing the rest-frame UV continuum emission with a power law of the form and taking into account the multiple physical processes that can shape the Lyman break profile in the prism spectra (see Methods). The redshifts we have recovered from our best-fitting models are and for JADES-GS-z14-0 and JADES-GS-z14-1, respectively.
In the redshift range inferred by fitting the Lyman break profile, we have also found a tentative detection of CIII] (hereafter: CIII]) emission at 2.89 m in JADES-GS-z14-0 (see Methods) at a level of significance of 3.6. If confirmed in future NIRSpec observations, this line yields a redshift of and the presence of damped Lyman- absorption (DLA) with a neutral hydrogen column density of is necessary to match the wavelength and shape of the Lyman- break. Similarly dense DLAs have already been observed in other galaxies, and their existence is not surprising given the neutral gas reservoirs in the early Universe [Heintz:2023, DEugenio:2023, Heintz:2024, Hainline:2024].
These are the earliest galaxies with spectroscopically confirmed redshifts, exceeding the previous high marks of [Curtis-Lake:2023, Hainline:2024] and [Wang:2023]. Additionally, these two galaxies are luminous with a rest-frame UV absolute luminosity at 1500 Å of and , respectively. We particularly highlight JADES-GS-z14-0, which despite its redshift is the third most UV luminous of the 700 candidates in JADES, two times more luminous than GHZ2 [Castellano:2024, Zavala:2024], and only a factor of two less luminous than GN-z11 [Oesch:2016, Bunker:2023]. We illustrate the distribution of UV luminosity and redshift in Fig. 2. We stress that the high luminosity is particularly important in view of the rapidly evolving halo mass function expected in cold-dark-matter cosmology. From a N-body simulation run with Abacus [Maksimova:2021], we estimate that the halo mass threshold required to yield a fixed comoving abundance varies as for this region of mass and redshift. A dimensional scaling for luminosity would be halo mass divided by the age of the Universe, which is scaling as , yielding a simple baseline that luminosities might scale as . Overplotting such a scaling on Fig. 2 shows how remarkable JADES-GS-z14-0 is: it shows most dramatically that some astrophysical processes are creating a deviation from the dimensional scaling of halo mass and the Hubble time. Even JADES-GS-z14-1, while more similar in to the lower redshift family, is distinctively luminous by this metric. We, therefore, argue that these two galaxies, and particularly JADES-GS-z14-0, provide a crisp spectroscopic confirmation to the trend that has been inferred several times from photometric samples [Casey:2023, Finkelstein:2023a, Donnan:2024, Robertson:2023a] that the galaxy UV luminosity function evolves slowly, with more luminous galaxies at high redshift than predicted in a variety of pre-JWST predictions. Having established the remarkable redshifts and luminosities of these sources, we now turn to a more detailed analysis of them.
From the spectrum redward of the break, we measure a power-law index , also known as the UV slope, of and for JADES-GS-z14-0 and JADES-GS-z14-1, respectively. These results indicate that the emission is dominated by a relatively young ( Myr) stellar population and low dust attenuation [Tacchella:2022, Cullen:2023, Topping:2023]. We note that the the stellar UV slope could be also modified by two-photon and free-bound nebular continuum emission [Tacchella:2022, Cullen:2023, Topping:2023, Cameron:2023]. However, we can rule out a strong two-photon contribution in our galaxies due to the lack of the characteristic peak at 1500 Å [Cameron:2023]. The absence of emission lines disfavors free-bound emission, but this possibility cannot be fully ruled out because, at , NIRSpec does not cover the Balmer break nor any Balmer emission lines.
Both the upper limits on the emission lines and the tentative detection of CIII] in JADES-GS-z14-0, with a rest-frame equivalent width Å, are consistent with those observed in lower-luminosity galaxies at [Curtis-Lake:2023, Hainline:2024]. On the other hand, if we compare JADES-GS-z14-0 with the most luminous galaxies at , such as GN-z11 [Bunker:2023a] and GHZ2 [Castellano:2024], we would expect to detect both CIII] and CIV in the prism spectra of our galaxies. This spectral difference may be due to an extremely low metallicity () or a large escape fraction of ionizing photons which reduces the emission by the gas in the interstellar medium [Curtis-Lake:2023, Hainline:2024] or a different nature of the dominant ionizing flux [Maiolino:2023].
| ID | JADES-GS-z14-0 | JADES-GS-z14-1 |
|---|---|---|
| extended ID | JADES-GS-53.08294-27.85563 | JADES-GS-53.07427-27.88592 |
| NIRCam ID | 183348 | 18044 |
| RA[ICRS] | 3:32:19.9049 | 3:32:17.8251 |
| DEC[ICRS] | -27:51:20.265 | -27:53:09.338 |
| redshift | ||
| UV slope | ||
| UV radius () [pc] | ||
| ] | ||
| ] | ||
| ] | ||
| [mag] | ||
The physical properties of the two galaxies have been inferred via spectro-photometric modeling of their spectral energy distributions (SEDs) within a Bayesian framework. The details of the modeling and the posterior distribution of free parameters are discussed in the Methods section, while the galaxy properties are reported in Table 1. The inferred star-formation history indicates that these galaxies have grown their masses over the last 100 Myr, implying that the observed stellar population started forming at with a rapid growth up to [Helton:2024]. We also note that the SED modeling favors a high escape fraction of ionizing photons () to reproduce the blue UV slopes and the absence of emission lines in both galaxies.

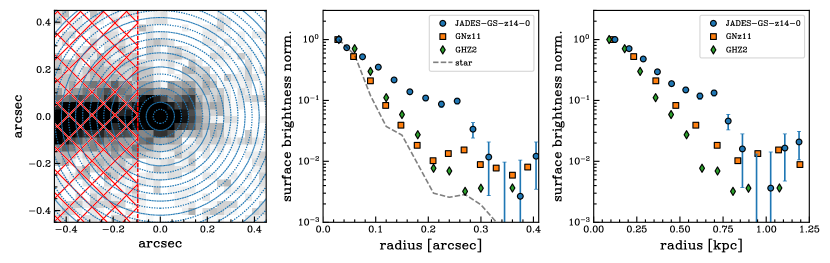
The NIRCam images of JADES-GS-z14-0 clearly show that the source is extended, while JADES-GS-z14-1 is more compact. Fig. 3 shows the radial profile of the emission at 2 m of the two galaxies. The radial surface brightness profile of JADES-GS-z14-0 exhibits emission extended up to 1 kpc, significantly beyond the point spread function of JWST. We also note that the profile is significantly more extended than the UV emission of the two more luminous galaxies at : GN-z11 [Bunker:2023, Maiolino:2023] and GHZ2 [Castellano:2024, Zavala:2024]. Using ForcePho (see Methods) to fit the imaging, we find that the galaxy is well fit by an elliptical exponential profile with a deconvolved half-light radius () of arcsec and pc. This large size implies that the UV light of JADES-GS-z14-0 is produced mainly by a spatially extended stellar population, excluding a dominant contribution by an active galactic nucleus (AGN). This differs from other more compact high-luminosity galaxies, where some studies have suggested that an unobscured AGN is dominating the UV light [Maiolino:2023, Harikane:2024].
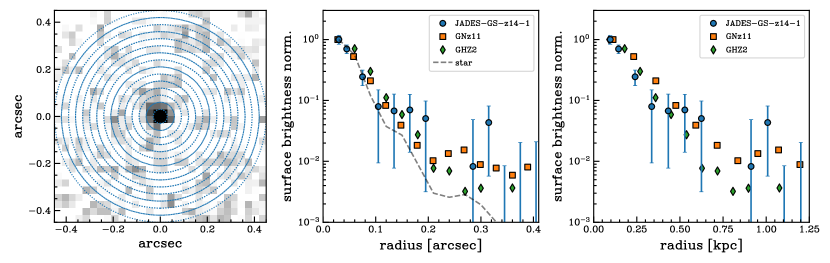
The rest-frame UV emission of JADES-GS-z14-1 appears compact and marginally resolved by the NIRCam point-spread function. The forward modeling of the light profile returns an upper limit on pc, which agrees with the compact size determined for other low-luminosity galaxies [Robertson:2023, Robertson:2023a, Hainline:2024]. For this galaxy, the morphological analysis is not sufficient to exclude the presence of a luminous AGN, but the inferred UV slope of –2.71 suggests that the light is mainly emitted by stars in the galaxy. The slope expected for the emission of an AGN accretion disk is, on average, of the order of –2.3 or shallower [Shakura:1973, Cheng:2019], and there are no mechanisms that are able to reproduce a steeper profile without invoking a strong contribution from the emission of a young ( Myr) stellar population [Tacchella:2022, Cullen:2023, Topping:2023].
The best-fitting SED models presented in Table 1 indicate a modest but non-zero amount of reddening by dust, with an of 0.2–0.3 mag for both galaxies. These results are in agreement with recent models proposed to explain the presence of luminous galaxies such as JADES-GS-z14-0 and JADES-GS-z14-1 at early times [Ferrara:2023, Donnan:2023]. Such models expect that galaxies have lower dust content in the interstellar medium than equal-mass galaxies at lower redshifts, despite the rapid ( Myr) dust enrichment from supernovae [Schneider:2023]. Indeed, if our massive galaxies had a stellar-to-dust ratio of about 0.002, similar to those observed in galaxies [Witstok:2023], the dust attenuation would be a factor at least 4 times higher ( mag), due to their compact UV size, than what is observed [Ferrara:2023]. The moderate dust attenuation in our galaxies can be explained by different scenarios: 1) a large amount of dust distributed on large scales due to galactic outflows, reducing the observed dust attenuation [Ziparo:2023, Ferrara:2023]; 2) a different dust composition [Markov:2024] and so dust mass absorption coefficient; 3) a high destruction rate of pre-existing dust grains due to shock waves generated by supernovae explosions [Schneider:2023]. Independently from the proposed scenarios, our observations indicate that the properties of galaxies appear to change rapidly in only 600 Myr (i.e. from to ).
In conclusion, the presented spectroscopic observations of JADES-GS-z14-0 and JADES-GS-z14-1 confirm that bright and massive galaxies existed already only 300 Myr after the Big Bang, and their number density [Robertson:2023a] is more than ten times higher than extrapolations based on pre-JWST observations [Bouwens:2021]. The morphology and UV slope analysis help rule out a significant AGN contribution for either galaxy. Other potential explanations, such as dust content [Ferrara:2023], star-formation processes [Dekel:2023, Donnan:2024], and a top-heavy initial mass function [Yung:2023, Woodrum:2023], must be investigated to explain the excess of luminous galaxies in the early Universe.
In the context of future observations, we stress that JADES-GS-z14-0 is unexpectedly and remarkably luminous. The spectroscopic confirmation of this source implies the existence of many similar galaxies – particularly when considering the relatively small survey area of JADES. Galaxies like this are sufficiently luminous for follow-up observations with ALMA and MIRI, promising to open the view to the rest-frame optical and far-infrared at Cosmic Dawn, the period where the first galaxies were born.
Methods
Cosmology model and definitions
Throughout this study, we adopt the following cosmological parameters: = 70 km s Mpc, = 0.3 and = 0.7. 1 arcsec at corresponds to a physical scale of 3.268 kpc. All magnitudes are presented in the AB systems, and the term SFR refers to the star formation rate averaged over the past 10 Myr. Equivalent widths of emission lines are quoted in the rest-frame. The absolute UV magnitude is estimated at the rest-frame wavelength of 1500 Å.
NIRSpec observations and data reduction
| JADES-GS-z14-0 | JADES-GS-z14-1 | JADES-GS-53.10763-27.86014 | |
| PRISM/CLEAR | 33612s | 67225s | 67225s |
| G140M/F070LP | 8403s | 16806s | 16806s |
| G235M/F170LP | 8403s | 16806s | 16806s |
| G395M/F290LP | 8403s | 16806s | 16806s |
| G395H/F290LP | 8403s | 16806s | 16806s |
The NIRSpec data used in this work are part of the Guaranteed Time Observations program ID 1287. The observations were carried out between January 10 and 12, 2024. Three consecutive visits were scheduled for the program, but the visit 2 was not performed because of a loss of lock on the guide star.
The two obtained visits, 1 and 3, differed in their pointing by arcsec and adopted different microshutter array (MSA) configurations. JADES-GS-z14-1 was observed in both visits, while JADES-GS-z14-0 was observed only in the visit 1, as the visit 3 was set up to observe the nearby low-redshift galaxy to exclude contamination.
The disperser-filter configurations employed in the program were PRISM/CLEAR, G140M/F070LP, G235M/F170LP, G395M/F290LP and G395H/F290LP. The first four spectral configurations provided spectroscopic data with spectral resolving power of and in the wavelength range between 0.6 m and 5.2 m. The G395H/F290LP disperser-filter configuration covered the wavelength range 2.87–5.27 m with spectral resolving power of .
For the PRISM/CLEAR configuration, four sequences of three nodded exposures were used for each pointing, while one sequence of three nodded exposures was used for the spectral configuration of the gratings. Each nodded exposure sequence consisted of six integrations of 19 groups in NRSIRS2 readout mode[Rauscher:2012], resulting in an exposure time of 8403.2 seconds. The total exposure times for each target are reported in Table 2.
We made use of the NIRSpec GTO pipeline (Carniani et al. in prep.) to process the data. The pipeline was developed by the ESA NIRSpec Science Operations Team and the NIRSpec GTO Team. A general overview of the data processing is reported in [Bunker:2023] and [DEugenio:2024]. To optimize the signal-to-noise ratio of the data, we used the 1D spectra extracted from an aperture of 3 pixels, corresponding to 0.3 arcsec, located at the target position in the 2D spectra.
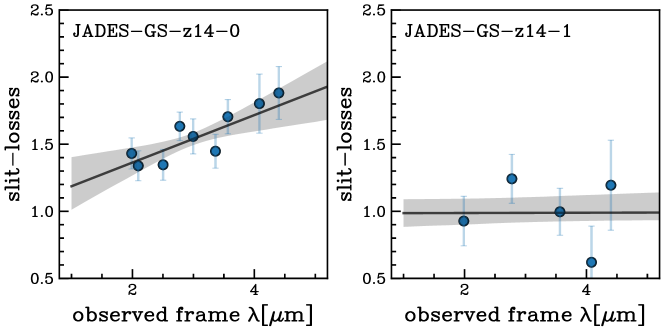
The pipeline applies a wavelength-dependent slit-loss correction to the measured flux, based on the position of the source inside the micro-shutter and assuming a point-source geometry. To verify the quality of this correction, we compare the pipeline-corrected fluxes to the NIRCam photometric measurements. For JADES-GS-z14-0, which is patially extended, we used the NIRCam measurements derived with ForcePho (See Sec. Imaging data, Fig. 4). We found that () of the total flux is lost at 2(5) m in the NIRSpec data. We employed a first-order polynomial to fit the slit losses as a function of wavelength () and found , .
For JADES-GS-z14-1, the NIRCam fluxes inferred from an aperture of 0.2 arcsec are consistent with the NIRSpec spectrum, indicating that the slit-loss correction applied by the GTO pipeline is sufficient to recover the total light of this compact source. In this case we estimated , .
Imaging data
| JADES-GS-z14-0 | JADES-GS-z14-01 | |
|---|---|---|
| [nJy] | [nJy] | |
| F090W | ||
| F115W | ||
| F150W | ||
| F162M | ||
| F182M | ||
| F200W | ||
| F210M | ||
| F250M | ||
| F277W | ||
| F300M | ||
| F335M | ||
| F356W | ||
| F410M | ||
| F444W | ||
| F770W |
Note: from Helton:2024.
Photometry for the three candidate galaxies studied in this work was taken from JWST/NIRCam imaging catalogs of JADES [Rieke:2023], with supplemental imaging data from the First Reionization Epoch Spectroscopic COmplete Survey (FRESCO; [Oesch:2023]) and JADES Origins Field (JOF; [Eisenstein:2023a]) programs. These data were reduced together following the procedure outlined in ref. [Eisenstein:2023]. The resulting mosaics include both observations taken in late 2022 as well as additional JADES observations taken in late 2023, and reach 5 observational depths of nJy in F200W using a diameter aperture. We present NIRCam thumbnails centered on JADES-GS-z14-0 and JADES-GS-z14-1 in the top panels of Fig. 1.
The sources were initially selected from the modelling of the photometry presented in [Hainline:2023a]. Two of the sources we explore, JADES-GS-z14-1 (JADES-GS-53.07427-27.88592 in [Hainline:2023a]), and the faintest galaxy described herein (JADES-GS-53.10763-27.86014) were part of the primary sample of galaxies in [Hainline:2023a], with photometric redshifts of and , respectively. JADES-GS-z14-0 (JADES-GS-53.08294-27.85563) was presented in [Hainline:2023a] (at ) but initially rejected in that study due to the morphology, brightness, and the proximity of the source to the neighboring galaxy with photometric evidence of a Balmer break at m.
In October 2023, JADES-GS-z14-0 and JADES-GS-53.10763-27.86014 were also observed as part of the JOF program, which included a NIRCam pointing of 104 hours of total exposure spread between six medium-band filters (F162M, F182M, F210M, F250M, F300M, F335M). These filters were chosen to help refine high-redshift galaxy selection in this ultra-deep region of the JADES footprint. NIRCam medium bands can be used to trace the galaxy stellar continuum and aid in rejecting sources at low redshift with strong emission lines that have similar wide-filter colors to high-redshift galaxies [Naidu:2022, Zavala:2023, Arrabal-Haro:2023a]. In Robertson:2023a, the authors used JOF photometry to select a sample of nine candidate galaxies at , including JADES-GS-z14-0. The additional medium-band observations for this source had a best-fit photometric redshift of , and fits at were effectively ruled out because of the lack of flux observed shortward of the Lyman- break, the strength of the break implied by the F182M – F210M color, and the F250M flux tracing the UV continuum. The authors also estimated a UV slope of and a size of pc, which are consistent with those inferred in this study. Robertson:2023a also presented the evolution of the UV luminosity function and cosmic star formation rate density at inferred from observations of JADES-GS-z14-0, and we refer the reader there for more details.
For the present analysis, we fit JADES-GS-z14-0 using ForcePho (Johnson B. et al., in prep.) in order to properly disentangle the flux of this source from the neighbor. For JADES-GS-z14-1, as this source was isolated and much more compact, we extracted fluxes using aperture photometry with an aperture, and applied an aperture correction assuming a point source. In a companion paper [Helton:2024], our team presents JWST/MIRI photometry of JADES-GS-z14-0 from ultra-deep 43 hr F770W imaging from Program ID 1180. This measures F770W to be nJy, mildly above the 3–5 m photometry of 47 nJy, likely due to the presence of strong emission lines in F770W. Helton:2024 discusses the implications of this rest-optical finding.
The third candidate JADES-GS-53.10763-27.86014
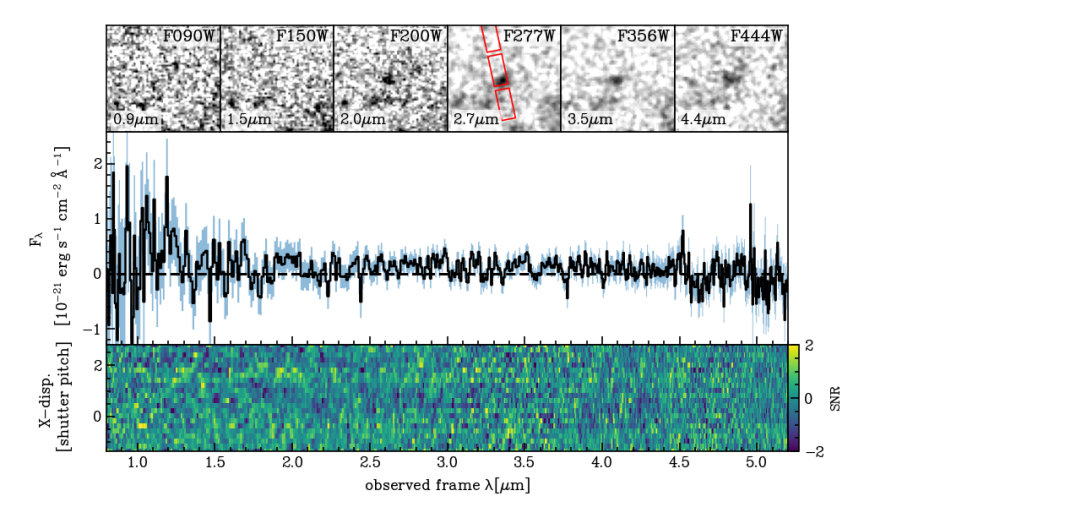
Fig. 5 shows the 1D and 2D spectra of the candidate galaxy JADES-GS-53.10763-27.86014 identified by [Hainline:2023a] and [Robertson:2023a]. The NIRCam images display a clear dropout in bluer filters, yielding a photometric redshift of 14.6. Only a faint continuum emission is barely detected in the NIRSpec spectrum with a significance level less than . The signal is not sufficient to confirm or rule out the photometric redshift determined by NIRCam images. We believe that the NIRSpec slit-losses contribute to the low signal-to-noise ratio of the data. The target is located at the edge of the shutter, and, despite its compact size, we expect that about 20% of the light is lost at 2 m and 35% at 5 m. The slit losses are two times higher than those of JADES-GS-z14-1, which is also 1.6 times more luminous than JADES-GS-53.10763-27.86014. In conclusion, the low sensitivity of these observations does not allow us to confirm or rule out the photometric redshift for this target.
The low-redshift galaxy close to JADES-GS-z14-0
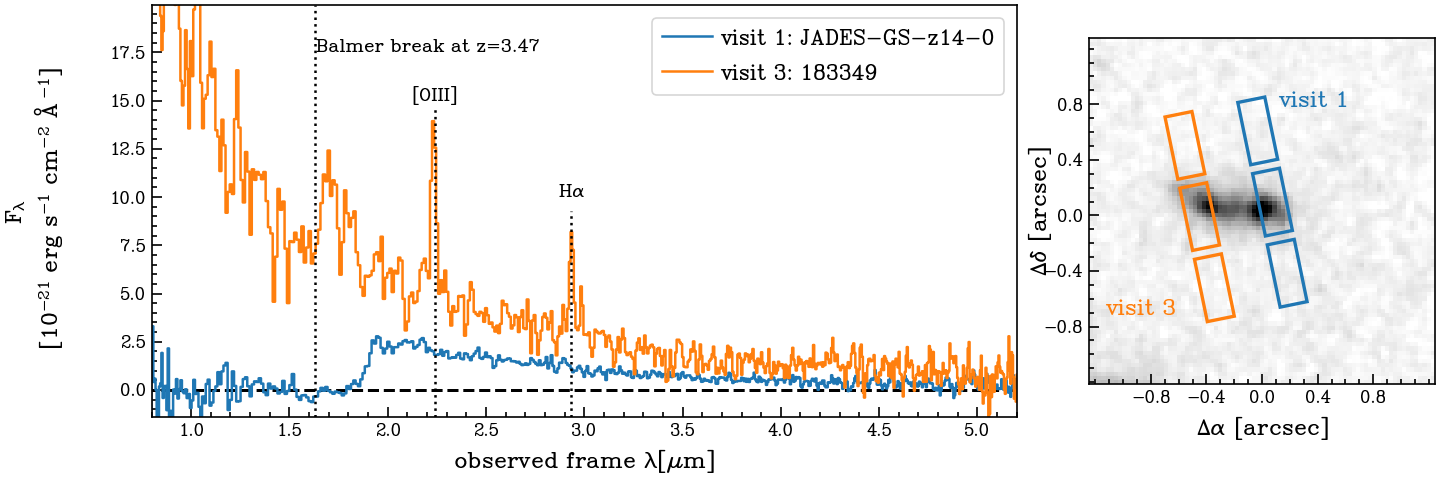
The identification of the neighboring galaxy with NIRCam ID 183349 at 0.4 arcsec from JADES-GS-z14-0 initially raised several doubts about the photometric redshift of the high-redshift target as the potential Lyman- break for this object could be a Balmer break if these two sources are associated at similar redshifts. Therefore we dedicated the visit 3 of the NIRSpec program 1287 to observe the neighboring galaxy and assess any possible contamination and constrain the gravitational lensing effect. Figure 6 shows the spectrum of the target 183349. The doublet [OIII] and H emission lines are detected with a high level of significance in both prism and grating spectra, yielding a secure spectroscopic redshift of (in agreement with the photometric redshift from Hainline:2023a). The spectrum also reveals a clear Balmer break feature at m. Therefore, we can rule out the drop at m observed in JADES-GS-z14-0 being due to the contamination of the neighboring galaxy. Finally, 183349 has no bright emission lines at observed wavelengths at 2.89 m, where we detect tentative CIII] emission in JADES-GS-z14-0. We can thus rule out that the tentative CIII] is due to contamination from 183349.
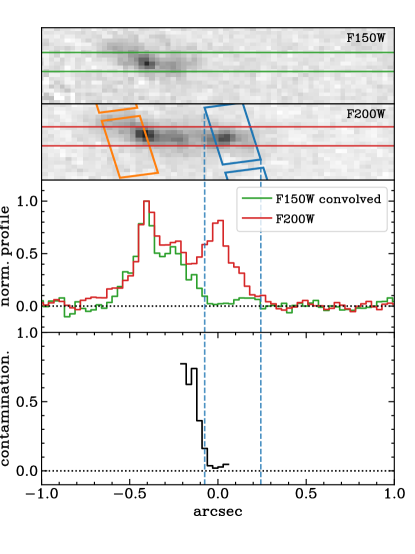
As the foreground galaxy might contaminate the spectrum of the JADES-GS-z14-0, we analyze the surface brightness profile of the two galaxies. Figure 7 shows the light profiles from the F150W and F200W NIRCam images extracted from a slit-oriented East-West and as large as 0.15 arcsec so that the slit includes both galaxies. JADES-GS-z14-0 is absent in the F150W NIRCam image, and thus, we used the F150W profile to quantify the contamination. Before the extraction, F150W NIRCam was smoothed to the same angular resolution of F200W data. Figure 7 reports the light profiles in the two filters normalized to the peak at the location of the foreground source (i.e., arcsec from the JADES-GS-z14-0). Assuming that the surface brightness profile of the foreground galaxy in the F200W image is similar to that at F150W wavelengths, we estimated a contamination of less than 10% at the location of JADES-GS-z14-0. The last panel of Fig. 7 indeed illustrates the ratio between the light profile in F200W filter and that in F150W from –0.2 arcsec (i.e., –0.6255 kpc) to 0.0 arcsec with respect to the center of JADES-GS-z14-0. This spatial range corresponds to the region in which the light of the two galaxies might overlap. The contamination is of the order of 70% at 650 pc from the center of JADES-GS-z14-0 and drops rapidly to less than 20% at 350 parsecs from the galaxy. As the top-left edge of the NIRSpec shutter is located at –0.08 arcsec from the center of JADES-GS-z14-0, we concluded that the contamination of the light of the foreground galaxy is negligible in the NIRSpec spectrum. Therefore, the contamination of the low- galaxy on the NIRSpec spectrum is lower than 10%.
We have also verified that the magnification provided by the foreground galaxies to JADES-GS-z14-0 is limited (). We use the software lenstool [Jullo:2007] to construct lens model of ID 183349 and another galaxy, JADES-GS-53.08324-27.85619 (ID 182698; ) that is 2.2 arcsec from JADES-GS-z14-0. Based on HST/ACS and JWST/NIRCam SED, we infer stellar mass and for ID 183349 and 182698, respectively. We then derived integrated velocity dispersions of 53 and 100 km s assuming the stellar-mass Tully-Fisher Relation measured at [Uebler:2017]. Assuming a singular isothermal spherical distribution of matter in these two foreground potentials, we derive a modest lensing magnification factor of at the location of JADES-GS-z14-0. Such a magnification factor is corrected for when we derived the physical properties, e.g., luminosities and masses.
Redshift determination


The photometric redshifts of JADES-GS-z14-0 and JADES-GS-z14-1 are [Robertson:2023a] and [Hainline:2023a], respectively . The strong Lyman breaks observed by NIRSpec in both JADES-GS-z14-0 and JADES-GS-z14-1 confirm both galaxies to be at a redshift of about . To determine the spectroscopic redshift, we model the continuum emission with a power-law function (), which well reproduces the rest-frame UV continuum emission in galaxies with young stellar populations [Schaerer:2005, Tacchella:2022, Cullen:2023, Topping:2023], and absorption of neutral hydrogen following the prescriptions discussed in Witstok et al. (2024)[Witstok:2024] and Hainline et al. (2024) [Hainline:2024]. The IGM transmission is modeled following Mason & Gronke (2020)[Mason:2020] and depends on two free parameters: the global neutral gas fraction () and the ionized bubble size (). We assumed a flat prior for the neutral gas fraction over the range and a flat prior distribution for the ionized bubble size over the range proper Mpc. These are the expected values for a typical galaxy with a at [Neyer:2023]. As the Lyman- drop profile can also be caused by dense neutral gas in the circumgalactic medium and located along the line of sight (i.e., damped Lyman- absorption) following [DEugenio:2023] and [Hainline:2024], we parametrized this additional absorption by the column density of neutral hydrogen, and assumed a flat prior . Finally, recent studies [Keating:2023, Jones:2024] have also shown that the Ly emission line can modify the prism spectra and so alter the redshift measurement. Therefore we added a mock spectroscopically unresolved emission line in our model to represent the Ly emission. The line model was parametrized by the rest-frame equivalent width () and velocity shift with respect to systemic (). This latter mimics the effects of outflows and resonant scattering on Ly line emission [Orsi:2012].
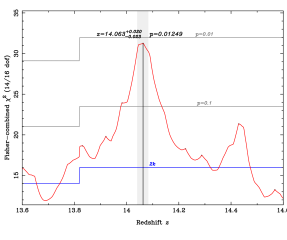
Figure 8 shows the posterior distributions of the free parameters used to fit the data of JADES-GS-z14-0 and JADES-GS-z14-1. The posteriors of the parameters , , and are flat for both galaxies and are not reported in the corner plot. The best-fit redshifts are and , respectively for the two targets. The profile of the posterior distributions of exclude the presence of dense DLA with , but does not preclude less dense absorbing systems along the line of sight. The results also indicate that the rest-frame equivalent width of the Lyman- line is lower than 10 Å.
Emission lines
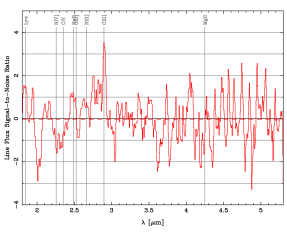
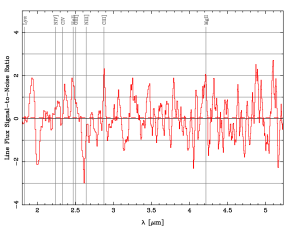
We inspected the prism and grating 1D and 2D spectra to identify any rest-frame ultraviolet emission lines above the level of the noise in both targets. We estimated emission line fluxes and equivalent widths from the continuum-subtracted spectra over five spectral channels. The uncertainties on line fluxes and equivalent width were determined by repeating the measurements on a sample of 2000 spectra obtained by combining the spectra of the individual integrations with a bootstrap resampling technique.
Given the uncertainties on the redshift based only on the Lyman-break, we estimated the statistical significance of a set of emission lines (see Table 4) at different redshifts. In particular we inferred the one-sided -value for each line at different redshifts. We then determined the combined -value of the set of lines by using Fisher’s method and used it to quantify the statistical significance of the spectroscopic redshifts (see details in [Hainline:2024]).
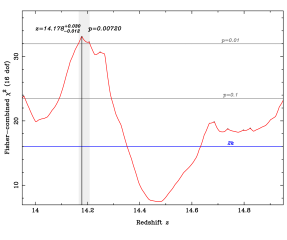
In the prism spectrum for JADES-GS-z14-0, we identified only a potential CIII]() emission line at with a level of significance of 3.6 and the combined -value for the inferred redshift is 0.00363. The redshift is consistent within the error with that determined from the fitting of the Lyman-break profile, but follow-up observations are fundamental to confirm the emission line. We note that the presence of only carbon line in the rest-frame UV spectrum is consistent with other low redshift studies concluding that CIII] might be the strongest rest-UV line after the Ly line [Shapley:2003, Feltre:2020].
The rest-frame equivalent width of the line is Å (Table 4) that is below the redshift-EW(CIII]) relation inferred by [Roberts-Borsani:2024] for the general distant galaxy population and expected to be 20 Å at . The estimated EW(CIII]) for JADES-GS-z14-0 is 2-3 times lower than what was observed in GS-z12-0 [DEugenio:2023] and GHZ2 [Castellano:2024]. In the grating we did not find any lines and the upper limits, which were estimated by using the bootstrap resampling technique, are reported Table 4.
| JADES-GS-z14-0 | JADES-GS-z14-1 | |||
| Emission line | Flux | Flux | ||
| [] | [Å] | [] | [Å] | |
| Prism | Prism | |||
| 1486 | ||||
| 1548 | ||||
| 1640 | ||||
| 1660 | ||||
| 1750 | ||||
| 1908 | () | () | ||
| 2795 | ||||
| Gratings | Gratings | |||
| 1240 | ||||
| 1486 | ||||
| 1548 | ||||
| 1640 | ||||
| 1660 | ||||
| 1750 | ||||
| 1908 | ||||
| 2795 | ||||
Note: Fluxes are in units of , rest-frame equivalent widths () are in (rest-frame) Å. We adopted 3 upper limits and emission line fluxes have been estimated over a resolution element of 5 spectral channels of R1000 data.