Deep Learning-based Epicenter Localization
using Single-Station Strong Motion Records
Abstract
This paper explores the application of deep learning (DL) techniques to strong motion records for single-station epicenter localization. Often underutilized in seismology-related studies, strong motion records offer a potential wealth of information about seismic events. We investigate whether DL-based methods can effectively leverage this data for accurate epicenter localization. Our study introduces AFAD-1218, a collection comprising more than 36,000 strong motion records sourced from Turkey. To utilize the strong motion records represented in either the time or the frequency domain, we propose two neural network architectures: deep residual network and temporal convolutional networks. Through extensive experimentation, we demonstrate the efficacy of DL approaches in extracting meaningful insights from these records, showcasing their potential for enhancing seismic event analysis and localization accuracy. Notably, our findings highlight significant reductions in prediction error achieved through the exclusion of low signal-to-noise ratio records, both in nationwide experiments and regional transfer-learning scenarios. Overall, this research underscores the promise of DL techniques in harnessing strong motion records for improved seismic event characterization and localization.
Geophysical Research Letters
Dept. of Modeling and Simulation, Graduate School of Informatics, METU, Türkiye Dept. of Systems Engineering, Turkish Aerospace Inc., Türkiye Dept. of Systems Engineering, ASELSAN Inc., Türkiye Dept. Civil Engineering, Kadir Has University, Türkiye
Melek Türkmenturkmen.melek@metu.edu.tr
In this paper, deep learning techniques are applied to strong motion records in order to locate epicenters at single stations.
This study examines whether strong motion records, which are rarely used for seismology-related studies, contain information about an earthquake’s characteristics, and whether DL-based methods can benefit from them.
We introduce a large-scale strong motion record collection, AFAD-1218, which contains over 36,000 strong motion records from Turkey.
1 Introduction
The sudden rupture of faults beneath the earth’s surface cause seismic waves that propagate towards the earth’s surface. The waves reaching the ground surface may cause weak to strong shaking of the ground called earthquakes (EQ). Vibrations resulting from earthquakes are recorded by instruments placed at various locations on the Earth’s surface. These recordings are used by seismologists and engineers to better understand earthquakes and their effects on the built environment.
The expanding number of available earthquake recordings has lead to seismic source parameters such as origin time, location, and magnitudes of individual earthquakes being calculated automatically using various computational algorithms and thereby increasing the speed and accuracy of the estimated parameters. Furthermore, the rise in the number of recordings has also paved the way for applying data-driven methods to estimate source parameters. The availability of various artificial intelligence methods and their successful application to different areas in science coupled with the volume of earthquake recordings has allowed the number of research in this area to grow exponentially in recent years. Moreover, there is also curiosity on earthquake features that may be extracted from data using advanced AI methods. Most of the recent research covers a variety of topics including event detection, epicenter localization, magnitude detection, earthquake early warning systems (EEW) [Mousavi \BBA Beroza (\APACyear2023)].
The earlier AI methods used in seismology and earthquake engineering included various machine learning techniques (ML) such as artificial neural networks (ANN), support vector machines (SVM), and decision trees [Jiao \BBA Alavi (\APACyear2020)]. [Bose \BOthers. (\APACyear2008)], [M Böse (\APACyear2012)] proposed multi-station and single-station-based ANN algorithms respectively, to determine earthquake sources and ground motion parameters to be used as a part of EEW systems. \citeAOchoa2018 built a Support Vector Machine Regression (SVMR) model to implement an EEW for the city of Bogota using recordings from a single station. Recently, \citeAYANG2021 used conventional machine learning techniques as well as Convolutional Neural Networks (CNN) to distinguish between deep and shallow micro-seismic events. In another recent study, \citeAMcBrearty2022 uses graphical neural networks (GNN) to estimate the location and magnitude of earthquakes and compare to traditional methods.
ML algorithms used in the studies above are confined to modeling and generalizing limited-scale data sets due to their reliance on fixed, hand-crafted feature representations. The advantage of deep learning algorithms, on the other hand, is their ability to automatically learn hierarchical representations directly from earthquake recordings, which enables them to process high-dimensional and complex datasets more efficiently.
The DL-based approaches to earthquake signal processing are pioneered by \citeAPerol2018, which proposes a CNN-based model for rough localization (i.e. classifying into region clusters) and event detection, based on a relatively small-scale dataset (3k events). Following this study, DL-based approaches have increasingly been utilized in event detection for EEW [Kuyuk \BBA Susumu (\APACyear2018), Lomax \BOthers. (\APACyear2019), Mousavi \BOthers. (\APACyear2020), Münchmeyer \BOthers. (\APACyear2020), Yano \BOthers. (\APACyear2021), Bilal \BOthers. (\APACyear2022)], event classification [Kim \BOthers. (\APACyear2022), Nakano \BBA Sugiyama (\APACyear2022)], ground response estimation [Hong \BOthers. (\APACyear2021)], EQ phase picking [Pardo \BOthers. (\APACyear2019), Mousavi \BOthers. (\APACyear2020)], magnitude estimation [Jozinović \BOthers. (\APACyear2020), van den Ende \BBA Ampuero (\APACyear2020), Münchmeyer \BOthers. (\APACyear2020), Zhang \BOthers. (\APACyear2021), Ristea \BBA Radoi (\APACyear2022), Saad \BOthers. (\APACyear2021), Bloemheuvel \BOthers. (\APACyear2022)], EQ origin time estimation [Mousavi \BBA Beroza (\APACyear2020), Saad \BOthers. (\APACyear2021)], epicenter location classification [Kuyuk \BBA Susumu (\APACyear2018), Lomax \BOthers. (\APACyear2019), Kriegerowski \BOthers. (\APACyear2018), Saad \BOthers. (\APACyear2021)], epicentral distance estimation [Ristea \BBA Radoi (\APACyear2022), Yoma \BOthers. (\APACyear2022)], depth prediction [Kriegerowski \BOthers. (\APACyear2018), Mousavi \BBA Beroza (\APACyear2020), van den Ende \BBA Ampuero (\APACyear2020), Zhang \BOthers. (\APACyear2021), Ristea \BBA Radoi (\APACyear2022), Saad \BOthers. (\APACyear2021), Bilal \BOthers. (\APACyear2022)], and epicenter coordinates prediction [Zhang \BOthers. (\APACyear2020), Mousavi \BBA Beroza (\APACyear2020), van den Ende \BBA Ampuero (\APACyear2020), Zhang \BOthers. (\APACyear2021), Bilal \BOthers. (\APACyear2022)].
All the above-mentioned studies, while addressing different problems of earthquake engineering, have in common the fact that they aim to learn hierarchical representations directly from a relatively large corpus of seismic waveforms. Several of these studies [Kuyuk \BBA Susumu (\APACyear2018), Lomax \BOthers. (\APACyear2019), Zhang \BOthers. (\APACyear2020), Zhang \BOthers. (\APACyear2021), Saad \BOthers. (\APACyear2021), Sugiyama \BOthers. (\APACyear2021), Yoma \BOthers. (\APACyear2022), Nakano \BBA Sugiyama (\APACyear2022)] utilize relatively medium-scale local datasets (5k earthquake events) as inputs to their experiments, similarly to [Perol \BOthers. (\APACyear2018)]. The question of whether such a scale of data is sufficient for building high-level representations in DL models is difficult to answer. A large-scale corpus containing hundreds of thousands of EQ events did not exist until very recently. To meet this demand, [Mousavi \BOthers. (\APACyear2019)] published the Stanford Earthquake Dataset (STEAD), which included more than a million three-component waveforms that belong to 450k recorded seismic events. The same group used a subset of this dataset in their subsequent studies, first using a Bayesian DNN to detect P-arrival times and localize epicenters [Mousavi \BBA Beroza (\APACyear2020)], and then using a transformer and LSTM-included architecture for event and phase picking [Mousavi \BOthers. (\APACyear2020)]. Some other studies also utilized large-scale sets, such as [Pardo \BOthers. (\APACyear2019), Nakano \BBA Sugiyama (\APACyear2022), Kim \BOthers. (\APACyear2022)], but not for earthquake localization as we intend in this paper, but rather for phase picking or event classification.
In seismology and engineering, two types of instruments play a significant role in providing the necessary dataset scale for DL-based applications: seismometers and accelerometers. Seismometers measure ground velocity, offering insights into seismic wave characteristics and earthquake magnitude. These sensors constitute the majority of large-scale datasets found in the literature, including the STEAD dataset, primarily because seismometers are capable of detecting long-distance vibrations such as earthquakes or volcano tremors. Accelerometers, on the other hand, measure ground acceleration, providing detailed information on the intensity of shaking experienced by structures. While seismometer records contribute to understanding earthquake propagation, accelerometer records are essential for evaluating structural response and guiding earthquake-resistant design practices. Despite not being typically utilized for seismology-focused studies in the literature, questions arise regarding whether these strong motion records contain valuable information about an earthquake’s characteristics and whether DL-based methods can learn from them.
1.1 Problem Definition
From a machine learning standpoint, the aforementioned DL-based approaches all utilize supervised algorithms and can be broken down into three main problem categories, namely detection, classification, and regression. Detection-based studies aim to identify the earthquake event [Kuyuk \BBA Susumu (\APACyear2018), Lomax \BOthers. (\APACyear2019), Mousavi \BOthers. (\APACyear2020), Münchmeyer \BOthers. (\APACyear2020), Yano \BOthers. (\APACyear2021), Bilal \BOthers. (\APACyear2022)], or the phase instant [Pardo \BOthers. (\APACyear2019), Mousavi \BOthers. (\APACyear2020)], such as the primary (P) or secondary (S) wave starting time. Classification-based studies, on the other hand, are either an extension of a detection problem, such as classifying an event into multiple categories such as earthquake, tremor, or noise [Kim \BOthers. (\APACyear2022), Nakano \BBA Sugiyama (\APACyear2022)]; or a simplification of a regression problem such as localizing an epicenter into pre-clustered regions [Kuyuk \BBA Susumu (\APACyear2018), Lomax \BOthers. (\APACyear2019), Kriegerowski \BOthers. (\APACyear2018), Saad \BOthers. (\APACyear2021)]. Regression-based approaches aim at estimating a parameter of an event such as the origin time [Mousavi \BBA Beroza (\APACyear2020), Saad \BOthers. (\APACyear2021)], epicentral distance [Ristea \BBA Radoi (\APACyear2022), Yoma \BOthers. (\APACyear2022)], epicentral orientation [Lomax \BOthers. (\APACyear2019), Saad \BOthers. (\APACyear2021)], epicentral coordinates [Zhang \BOthers. (\APACyear2020), Mousavi \BBA Beroza (\APACyear2020), van den Ende \BBA Ampuero (\APACyear2020), Zhang \BOthers. (\APACyear2021), Bilal \BOthers. (\APACyear2022)], depth [Kriegerowski \BOthers. (\APACyear2018), Mousavi \BBA Beroza (\APACyear2020), van den Ende \BBA Ampuero (\APACyear2020), Zhang \BOthers. (\APACyear2021), Ristea \BBA Radoi (\APACyear2022), Saad \BOthers. (\APACyear2021), Bilal \BOthers. (\APACyear2022)] or magnitude [Jozinović \BOthers. (\APACyear2020), van den Ende \BBA Ampuero (\APACyear2020), Münchmeyer \BOthers. (\APACyear2020), Zhang \BOthers. (\APACyear2021), Ristea \BBA Radoi (\APACyear2022), Saad \BOthers. (\APACyear2021), Bloemheuvel \BOthers. (\APACyear2022)]. Undoubtedly, regression problems are more challenging to solve, and hence they cover the most recent literature. In this paper, we specifically focus on the epicentral coordinates prediction problem, basically finding the projection of the focus of the earthquake on the surface of the earth in world coordinates. Coordinate prediction differs from epicentral distance estimation, which is finding the distance from the receiving sensor to the epicenter, or epicentral orientation prediction, which is finding the angular orientation of the epicenter relative to the receiving sensor location; however, it is a superset of both. Hence, it is considered a complete problem definition for epicenter localization.
There are a considerable number of studies that attack the epicentral location in world coordinates problem in the literature. The majority of these studies [Kriegerowski \BOthers. (\APACyear2018), Zhang \BOthers. (\APACyear2020), van den Ende \BBA Ampuero (\APACyear2020), Zhang \BOthers. (\APACyear2021), Bilal \BOthers. (\APACyear2022)] utilize a limited-sized dataset or rely on auxiliary information such as seismic phase arrival times and/or multiple stations distribution within a network. Although there is one study [Mousavi \BBA Beroza (\APACyear2020)] that utilizes a large-scale dataset suitable for a DL-based study, they use auxiliary information of P phase arrival times and study seismometer (broadband) sensors. In their recent work, [Cağlar \BOthers. (\APACyear2024)] examine whether these models can effectively learn solely from raw seismometer records, without relying on auxiliary information such as seismic phase arrival times and station distribution within a network.
In this paper, we focus on analyzing a large-scale dataset consisting solely of strong motion records and employing them with two distinct DL models for predicting epicentral coordinates. To the best of our knowledge, no previous studies have investigated the DL capabilities of strong motion records for earthquake-related tasks, particularly epicenter localization. Our study aims to determine the extent to which strong motion records can provide information about an earthquake’s characteristics through DL techniques.
The representation domain of the raw time-series strong motion waveforms is a crucial consideration when feeding these signals into DL-based models. While the ML-based approaches heavily pre-process waveforms, DL-based approaches aim at building end-to-end models that rely on the raw waveform for their primary objective of developing hierarchical representations. Alternatively, the short-term Fourier transform (STFT), or spectrogram, of the signal is used in some DL-based studies [Ristea \BBA Radoi (\APACyear2022), Yoma \BOthers. (\APACyear2022), Nakano \BBA Sugiyama (\APACyear2022)] as the input, whereas the majority use the raw time signal. Regarding the behavior of a DL-model with respect to the domain of the input signal used, there are only two comparative studies. In [Ristea \BBA Radoi (\APACyear2022)], authors compare complex vs real spectrograms so as to discuss the advantages of additionally feeding the phase of the frequency-domain signal into the DL-model for epicenter localization. Similarly in [Nakano \BBA Sugiyama (\APACyear2022)], a time vs frequency domain comparison using CNNs for long-duration waveforms (150 sec.) is carried out. On the general discussion about whether a time or frequency-domain signal should be fed into a DL model, [Nossier \BOthers. (\APACyear2020)] studies various architectures that utilize audio signals.
In order to answer these research questions, we design a series of comparative experiments. These experiments hinge on the selection of input representations, encompassing both the time and frequency domains, to unravel the influence of signal representation on our results. In addition, we introduce a large-scale strong motion record set, namely the AFAD-1218, a substantial collection comprising over 36,000 Turkish strong motion records. In order to investigate the influence of DL models, we employ two prevalent CNN architectures as encoders: the ResNet [He \BOthers. (\APACyear2015)] and the TCN [Oord \BOthers. (\APACyear2016)].
The remainder of the paper is as follows. Next, we introduce AFAD-1218 set, and how it is preprocessed for use in our DL models. Detailed descriptions of the DL models used in our experiments are presented in Section 3. Section 4 describes the experimental setup and discusses the experiment’s findings. The final section concludes the paper and procures future directions.
2 AFAD-1218
The raw strong motion waveforms, i.e. waveforms for earthquake events having a magnitude larger than 3.5, collected for this study are publicly available and presented by AFAD [Republic of Turkey \BBA Emergency Management Authority (\APACyear2024)]. At the time of the construction of the dataset, AFAD had 799 strong motion stations across Turkey that are located in different regions. Strong motion events collected at these stations since the 1990s are included in the public dataset. For every record, it is possible to access the time, epicenter coordinates, depth, magnitude, station number recording the earthquake, the coordinate of that station, and three-channel accelerometer waveforms recorded for the whole event in all directions. Since 2012, AFAD’s recording sensors have been converted to digital, giving them a much wider dynamic range and higher data quality than analog stations [Boore \BBA Bommer (\APACyear2005)].
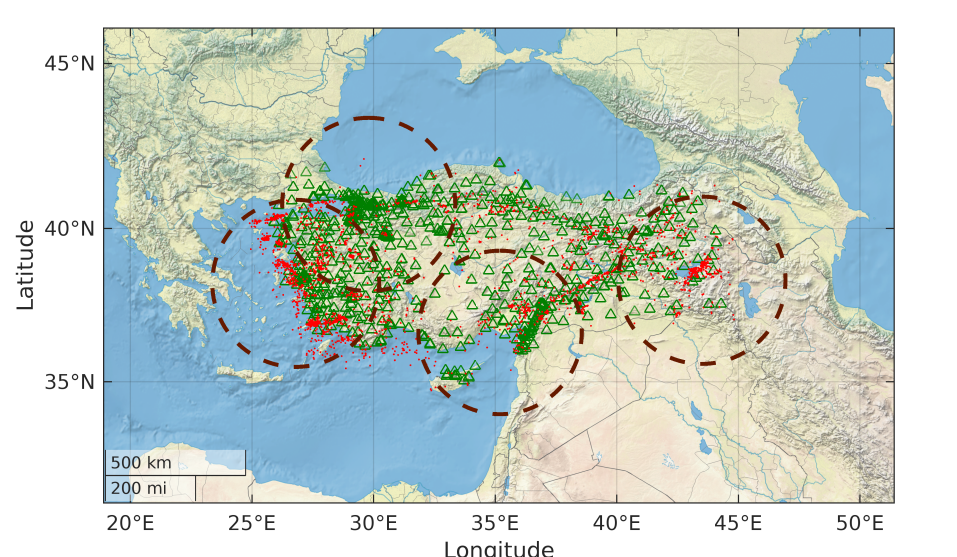
In this study, we utilize 36,418 three-channel waveforms that belong to 3,655 separate events collected by 718 of AFAD’s stations for 8 years, between 02.01.2012 and 19.12.2018. We name this dataset AFAD-1218 and utilize our experiments on this set. In Figure 1, all 3,655 events (red dots) and the station coordinated (green triangles) included in AFAD-1218 dataset are shown on a map of Turkey.
There is wide variation in the duration of events in the AFAD-1218 dataset, which ranges from 5 to 300 seconds. We use only a short duration ( = 15, 30 or 60 seconds) interval of the entire waveform to locate the epicenter. All records are in 100Hz sampling rate, hence the input signals either have 1500, 3000 or 6000 sample points.
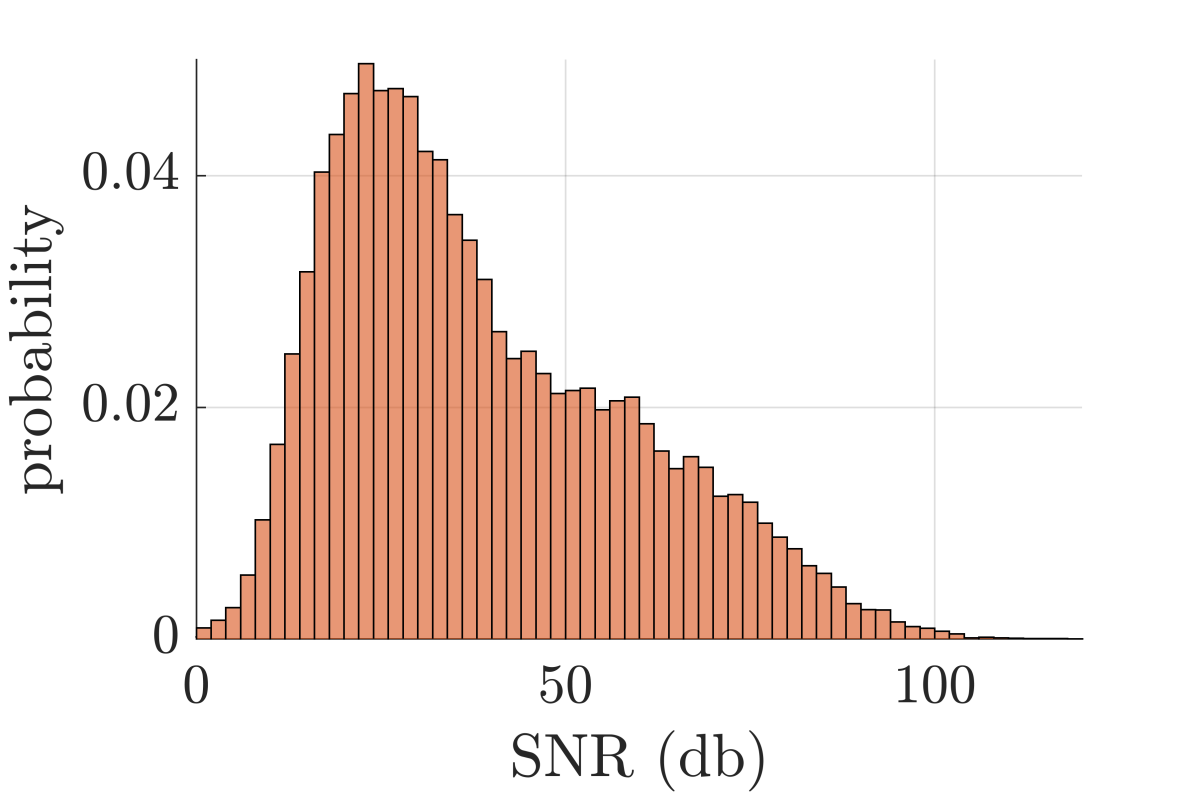
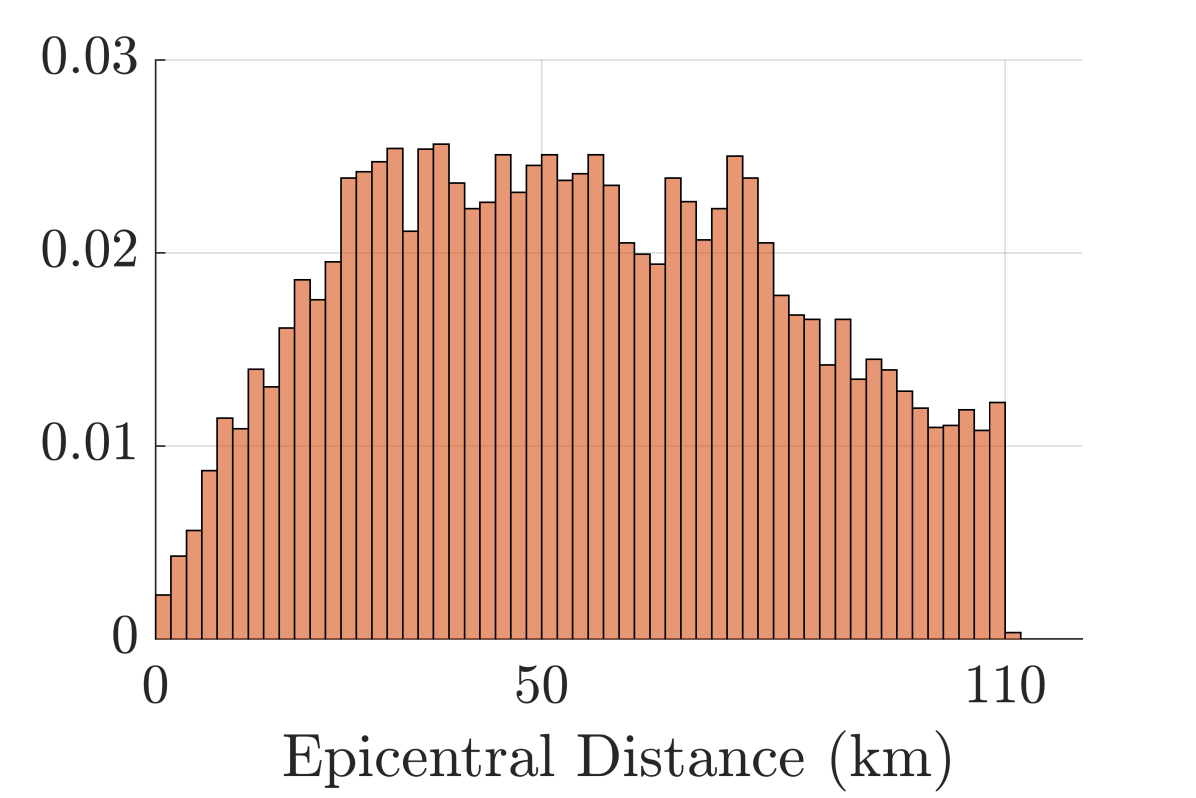
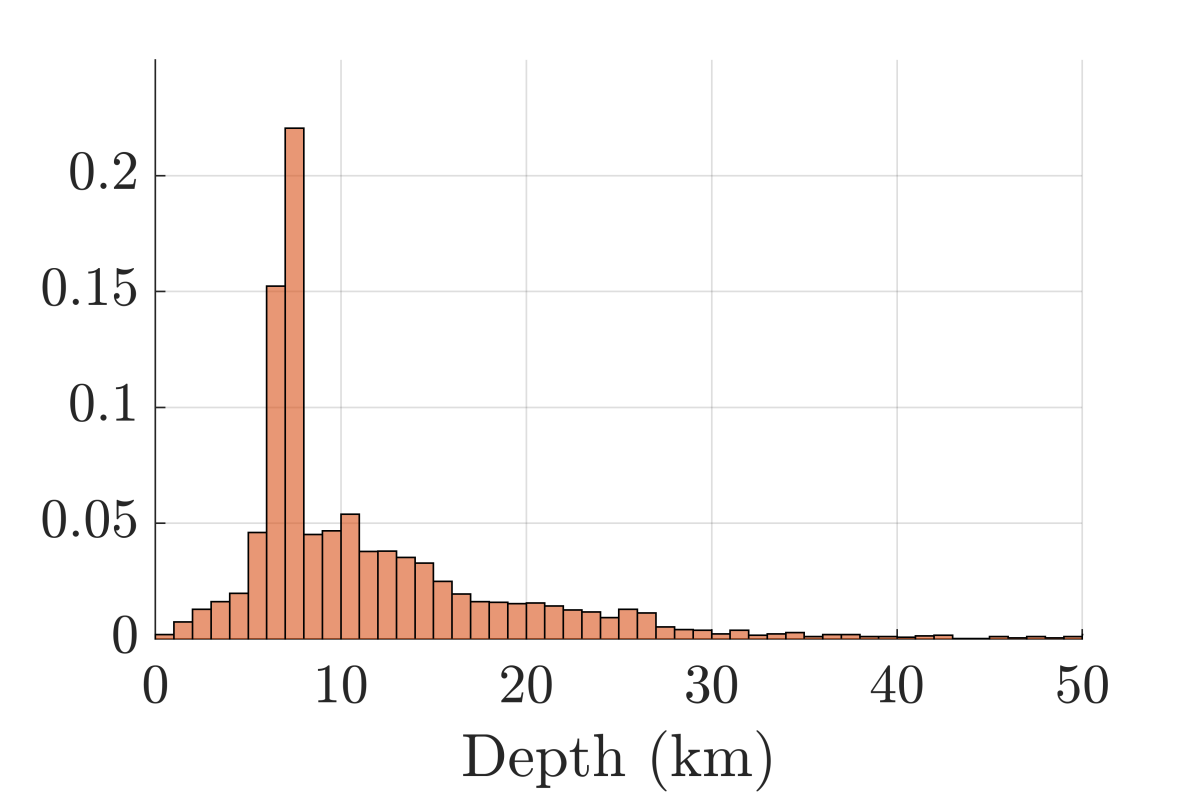
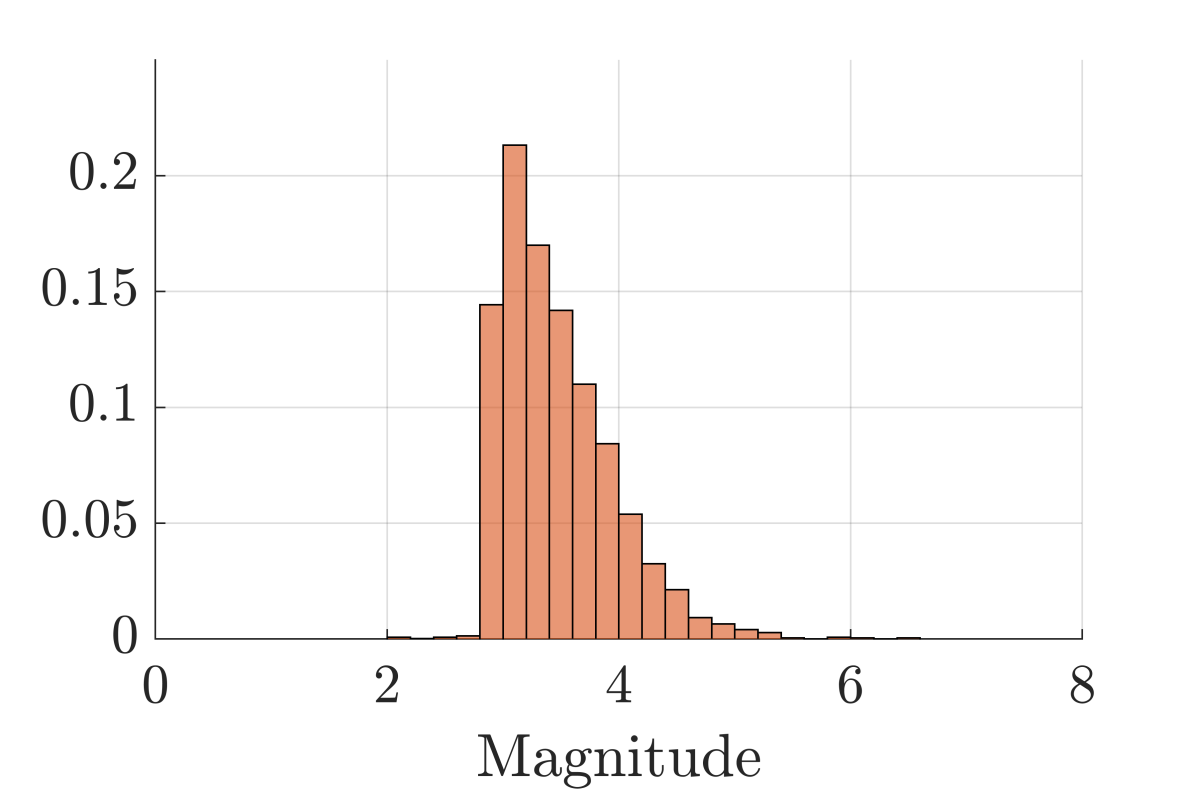
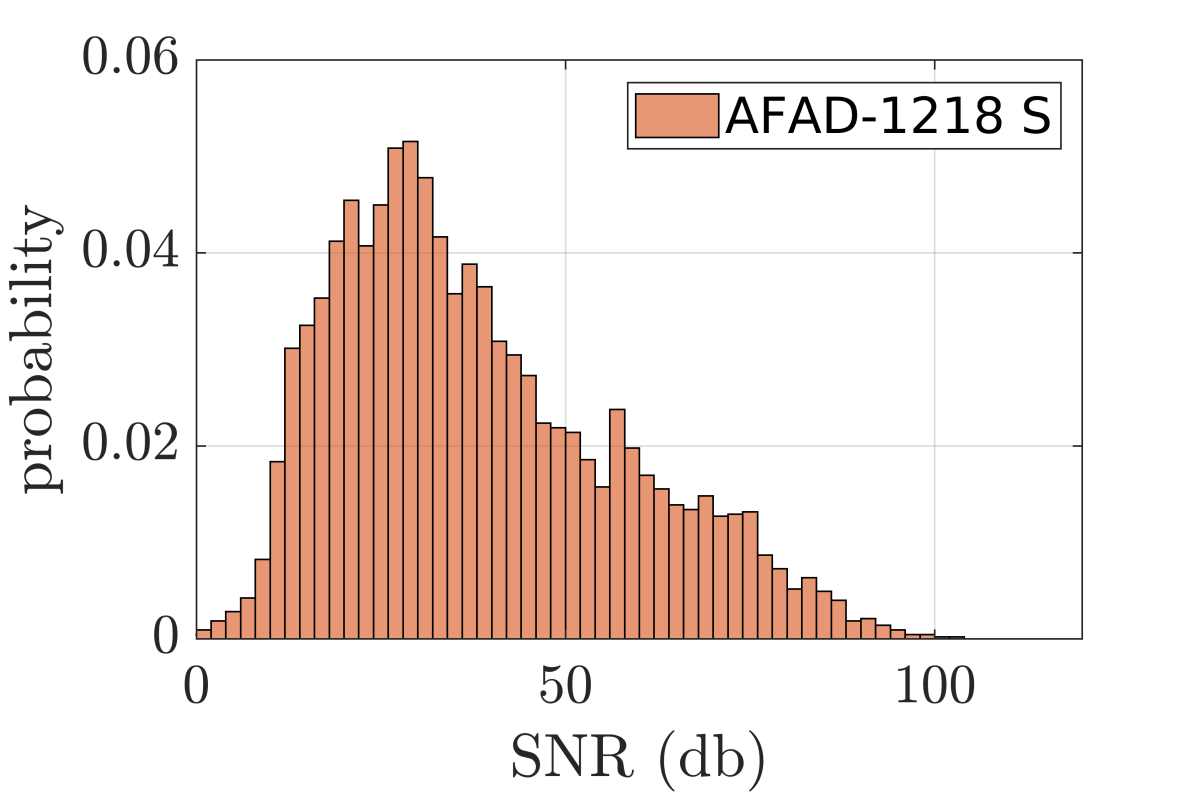
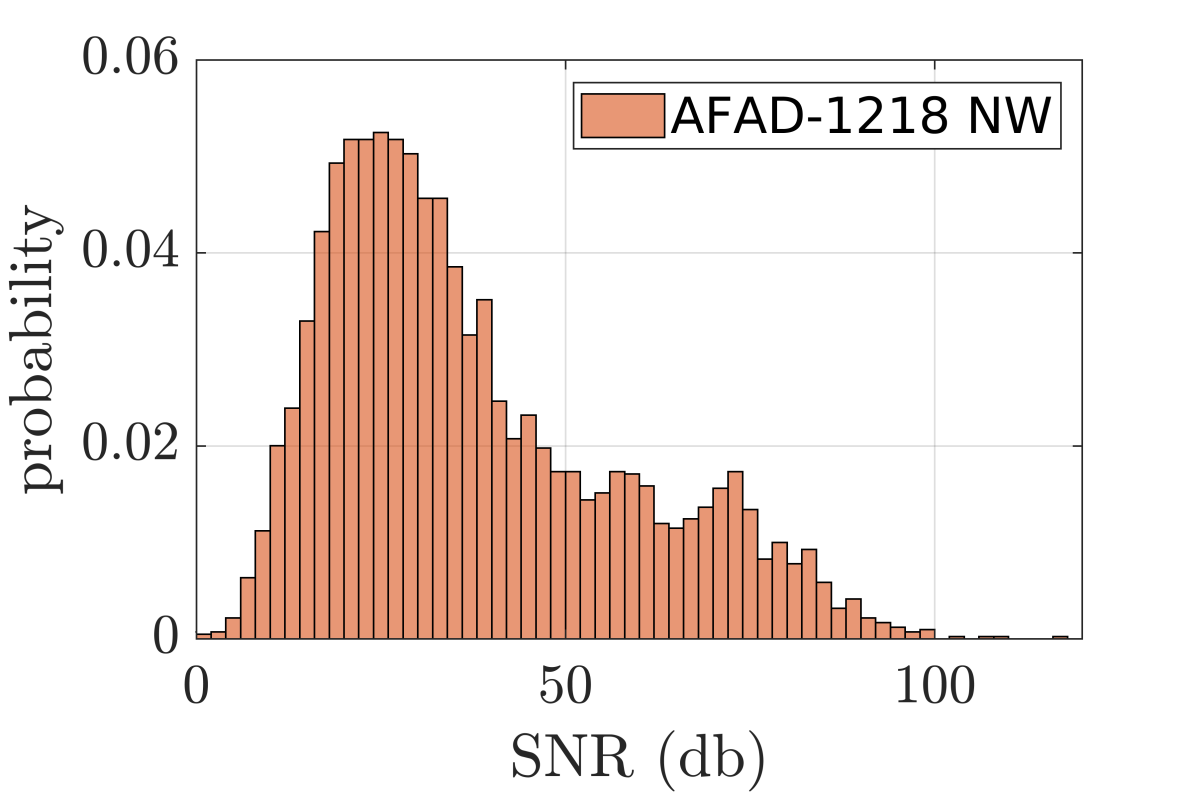
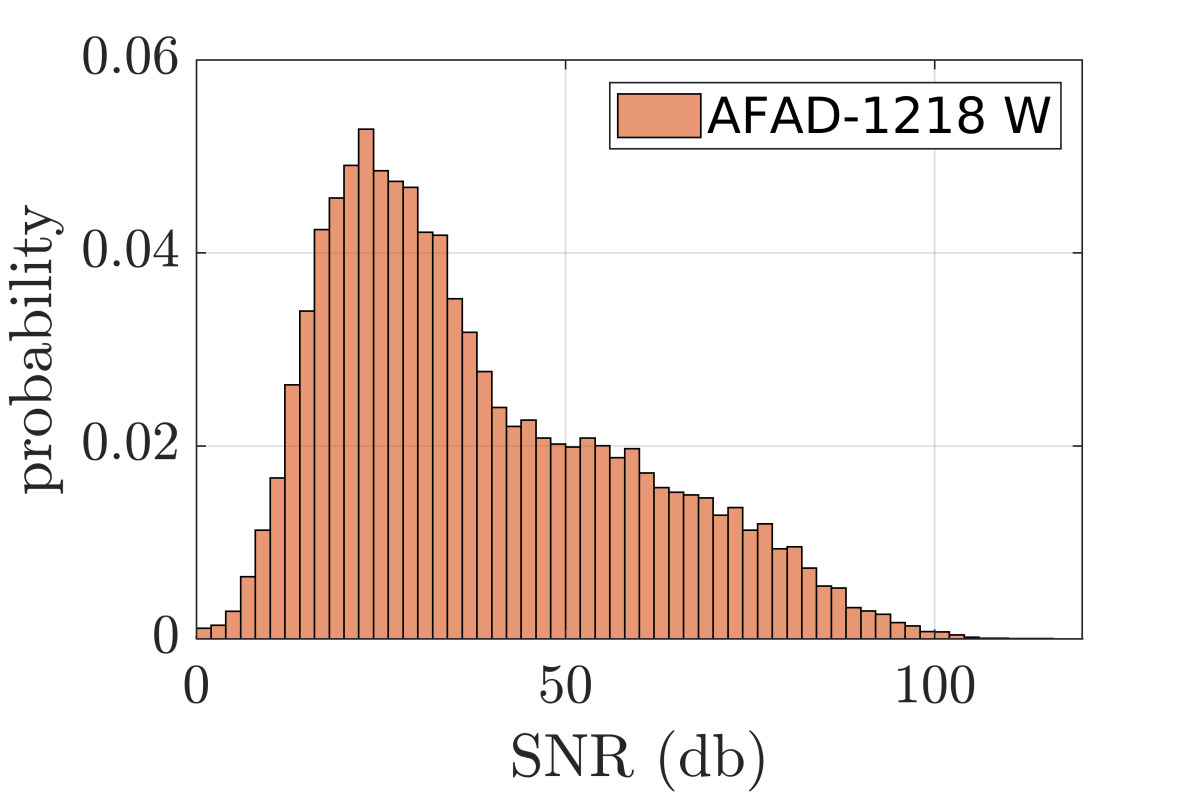
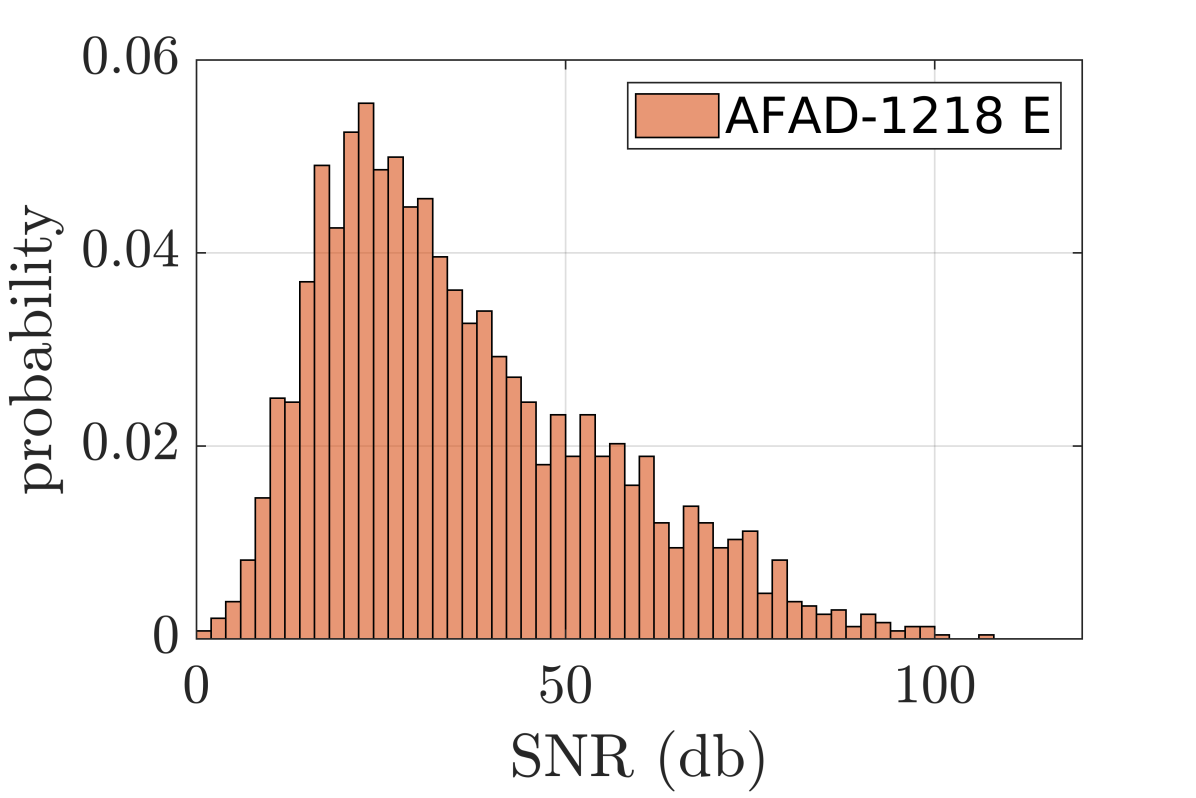
In Figure 2, the statistical properties of the utilized AFAD-1218 dataset is provided. As seen from the figure, the set contains signals of varying SNR values as low as a few dBs and as high as 100dB. In addition, the SNR distributions of the four regions containing spatially extensive fault planes in Turkey, represented in Figures from 2e to 2h, show no distinct dissimilarities. In Figure 2b, the probability distribution of the epicentral distances for each set is depicted. Following the general approach in the literature (as in the study by \citeAMousavi2020a), in our experiments we also exclude waveforms that were received at epicentral distances greater than 110km, leaving us with the 27,185 waveforms of the entire AFAD-1218 set. The event-wise properties of the set are depicted in Figures 2c and 2d. AFAD-1218 contains events of diverse depths and magnitudes larger than 3.
2.1 Peak Ground Acceleration Feature
An accelerogram’s Peak Ground Acceleration (PGA) represents the largest absolute acceleration measured at a specific site during an earthquake, calculated from the raw waveform for each direction separately. For this purpose, we define as the median value of the PGA time instants computed for each channel separately. Finally by segmenting the -seconds waveform centered around the calculated , the input to our DL model is obtained. We chose PGA as the reference point because it can be easily calculated from a signal without the need for developing a model, and it is a fundamental parameter that is related to the intensity of the earthquake and represents the region where the signal is strongest, thus maximizing the likelihood of finding the most informative part of the data for strong motion. While there are studies that attack the same problem (i.e. epicenter localization) and select the P-wave arrival as the anchor point [Mousavi \BBA Beroza (\APACyear2020)], for the the aforementioned reasons, we focused on PGA here. It is worth mentioning that although PGA might not be the primary reference point chosen for earthquake localization studies, the higher earthquake intensity and improved signal-to-noise ratio around this parameter allow for potentially useful information around its vicinity. This setup also provides an opportunity to test our hypothesis regarding extracting valuable information from regions of the signal with increased signal clarity and significance in motion analysis.
In our experiments, the short-duration signals are collected around the of a given waveform. For example, for a seconds signal ( having values of [15, 30, 60] seconds in this paper), the region between - to + seconds is selected as input. For cases, the is too early or too late in the signal (i.e. - or +), the first or the last seconds of the waveform is selected as input.
2.2 Spectrogram Calculation
As previously mentioned in the Introduction, we conduct comparative analyses by using time and frequency domains as inputs in our experiments. For this purpose, the magnitude squared of the Short-Time Fourier Transform (STFT) , namely the magnitude spectrogram of the seconds signal is created.
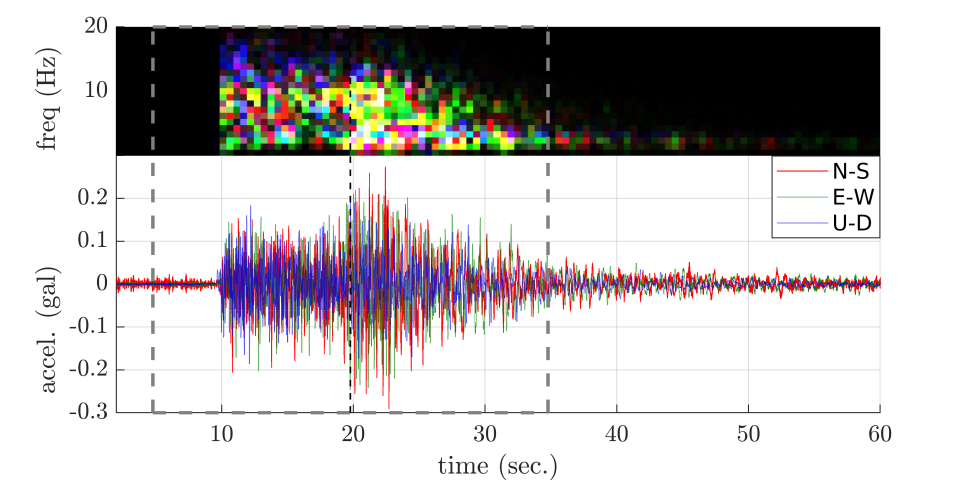
The spectrogram is a seconds long sequence with three channels, where corresponds to each one of the orthogonal directions of the recorded event. For each direction , the spectrogram is calculated separately. The size of the window function used in STFT calculation is selected as 1 second (i.e. 100 sample points for 100Hz). Since the 1-second window function designates the size of the calculated Fourier transforms, for 100 samples in 100Hz, we obtained a frequency range of 0 to 50Hz (i.e. providing a -long frequency resolution). The window function is propagated with a traditional = 0.5 s. hop, hence giving a time resolution of 2-1 (i.e. for =15 s. and for = 30 s.). As a result, the input spectrograms are of size (2-1) . In Figure 3, the entire spectrogram of a sample event is provided. In Figure 3, the three directional channels of are mapped to RGB false color (E-W as red, N-S as green, U-D as blue). The instant and the = 30 seconds region around are also depicted.
3 The Methodology
This section presents brief information on the utilized models and elucidates the training and parameter optimization phases.
3.1 The models
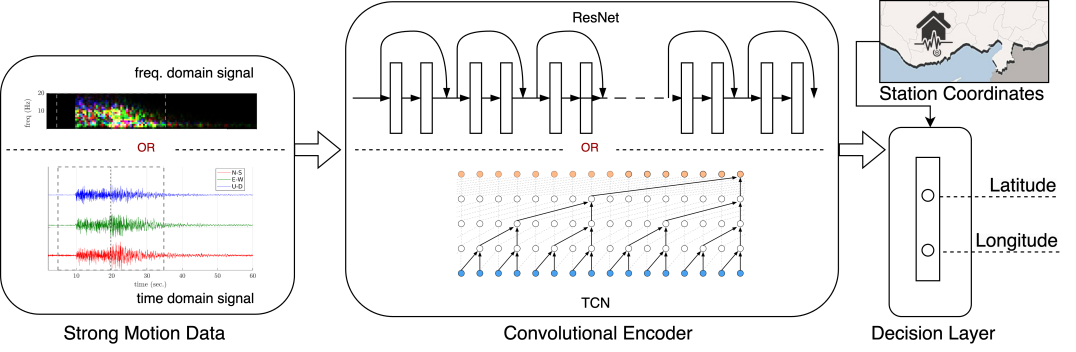
In order to utilize the strong motion records represented in either the time or the frequency domain, we propose two neural network architectures for operation. Both architectures operate in the form outlined in Figure 4. The models are comprised of an encoder, followed by a decision layer that outputs the latitude and longitude (i.e. epicenter) of the event. As the encoder, we employ either deep residual network or the temporal convolutional networks (TCN) to find the best architecture of choice for capturing seismic features out of strong motion records.
In addition to the seismic features extracted from the strong motion records via the convolutional encoders, the station latitude and longitude are concatenated to the first decision layer (Figure 4). By doing so, we expect the model to associate its input signals to source regions and deduce the arrival direction, allowing the model to better elucidate the local generation mechanisms rather than just identifying the presence of an event.
Fully-connected decision layers reshape this input into two regression nodes, which predict the relative latitude and the longitude of the epicenter. The decision layer is chosen as a simple fully-connected layer that consists of two output neurons and Rectified Linear Unit (ReLU) activations for comparability against the existing literature such as [Perol \BOthers. (\APACyear2018), Lomax \BOthers. (\APACyear2019), Kriegerowski \BOthers. (\APACyear2018)]. By “relative”, we mean the relative location of the epicenter with respect to the recording station location. For this purpose, in both architectures, the ground truth g is not the actual epicenter coordinates, but the difference between the epicenter location and the station coordinates (Eq. 1).
| (1) |
The following subsections provide a detailed description of the utilized convolutional architectures.
3.1.1 Deep Residual Networks
The first encoder we utilize is based on the ResNet architecture [He \BOthers. (\APACyear2015)], which has been applied to seismic waveforms in [Ristea \BBA Radoi (\APACyear2022)]. We extend the architecture and propose a new layer model designed to extract features from recordings of a single station.
The encoder consists of convolutional and residual blocks. The convolutional block processes a dx51x3 dimensional volume of input when operating in the frequency domain, or dxsx1 size of input when operating in the time domain by 32 convolving kernels of height to width ratio of 7/3 with stride 1, and zero padding with [3,1] for the same convolution, followed by a max pooling layer with spatial extent of 3 and stride [1,2].
The two convolutional layers are followed by three residual blocks, each of which consists of three convolutional layers stacked in tandem and a max pooling layer to achieve richer hierarchical representations. Each residual block starts with 1x1 convolution operation to adapt depths without losing spatial information, uses batch normalization before pooling operation, and contains a skip connection to the input of that layer and passes it to two layers ahead, allowing the network to reuse information throughout the architecture. The kernel sizes range from 3x3 to 7x3, and convolutional layers are stacked to grow the receptive field while keeping the model small.
3.1.2 Temporal Convolutional Networks
Strong motion records are by definition time series data and hence have a sequential nature. In the literature, processing sequential data, instead of a spatial signal such as an image, is carried out with a special family of convolutional networks, namely the Temporal Convolutional Networks (TCN) [Oord \BOthers. (\APACyear2016)]. TCNs are a part of the autoregressive feedforward model family that utilizes causal dilated convolutions and residual connections, and are highly effective for sequential modeling. Their distinct features allow for the efficient management of time-related relationships.
In their recent work, [Mousavi \BOthers. (\APACyear2019)] utilize TCNs to process broadband seismic waveforms for epicentral distance prediction. The original model, which we also utilize for our time domain experiments, receives a three-channel time signal with a dimension of 6000x3, where each minute encompasses 100 samples per second. We modify this architecture and apply it also to frequency domain signals. For this purpose, we append max-pooling layers to the end of the first three skip connections in the TCN architecture.
3.2 Two-phase learning
The geological diversity across Turkey results in varying seismicity around the county. To address this, we suggest a hybrid, two-stage training approach that employs ResNet and TCN-based encoders as feature-sharing layers, each in its own stage. In the first phase, the entire data set is fed to the base architecture to capture generalized representations across Turkey. In the second phase, we leverage the pre-trained model to transfer the features acquired in the first phase to four high seismic hazard regions of Turkey: Eastern, Western, Southern, and North-Western, each of which exhibits distinct event characteristics. The four regions were selected based on SNR of the recordings, faults and distribution of the earthquakes in the dataset. By freezing the weights of the decision layer and allowing only the FC layers to be optimized, we anticipate the model which initially trained on data from the entire country to fine-tune itself to capture the seismic pattern and regimes of these high-activity regions.
We split the data into training and test sets, with the training set comprising historical data from January 2012 to August 2017, and the test set assessing model performance using subsequent data. By doing this, we aim to enable the system to use historical data for predicting future event locations and to make it applicable in real-world scenarios, we employ a cross-validation approach that maintains the chronological order of events. This ensures that the model reflects real-world performance and reveals any time-dependent features.
3.3 Parameter optimization
For parameter optimization, each model trained on datasets of 15, 30, or 60-second signals, using a convolution operator applied to batches of 64 inputs. Dropout was applied to the final decision layers at a rate and 50% to improve generalization capability. We utilized the Adam optimizer, starting from 1e-5 and reducing the learning rate by 0.9 every [5, 10, 20] epochs for [100, 200, 300] epochs. Learning was based on either Mean Squared Error (MSE) or Mean Absolute Error (MAE) to assess the impact of the chosen loss metric.
4 Experiments and Results
In our experiments, we compare and present the relative functionalities of the proposed models in a number of facets: such as the input representation domain as time or frequency, input signal duration anchored around the PGA value, network architecture and SNR value of a given input signal. For this purpose, we train 120 different models on input data of 15, 30, and 60 seconds in length, separately in frequency and time domains, utilizing both the ResNet and TCN architectures. This training is conducted for the entire AFAD-1218 dataset and four subsets corresponding to four seismic regions of Turkey. Each of the 120 experiments includes its own hyperparameter search, totaling approximately 500 different experiments and 5000 GPU hours.
| SNR >0 | SNR >25 | ||||
| Domain | Duration (s) | ResNet | TCN | ResNet | TCN |
| Time | 15 | 65.26 | 65.77 | 54.40 | 53.56 |
| Frequency | 15 | 71.73 | 65.50 | 60.74 | 53.03 |
| Time | 30 | 66.45 | 66.11 | 53.31 | 53.77 |
| Frequency | 30 | 75.44 | 65.43 | 59.53 | 53.68 |
| Time | 60 | 71.57 | 68.53 | 58.33 | 58.00 |
| Frequency | 60 | 74.45 | 68.20 | 62.16 | 57.94 |
| Mean | 70.8 | 66.6 | 58.1 | 55.0 | |
| Standard Deviation | 3.8 | 1.3 | 3.2 | 2.1 | |
The results of the experiments trained using the entire set are shown in Table 1. In this table, we see that the model performances tend to decline as the input duration increases (e.g., 60), possibly suggesting that models struggle to extract information beyond the most informative parts of the signals. Another significant finding is the clear impact of signal-to-noise ratio (SNR), with notably improved results when SNR exceeds 25 dB. In this initial phase of our experiments, we observe no significant difference in performance between the ResNet and TCN architectures.
| Architecture | ResNet | TCN | ||||||||||
|---|---|---|---|---|---|---|---|---|---|---|---|---|
| Domain | Frequency | Time | Frequency | Time | ||||||||
| Duration (s) | 15 | 30 | 60 | 15 | 30 | 60 | 15 | 30 | 60 | 15 | 30 | 60 |
| Eastern | 52.82 | 53.29 | 56.96 | 52.8 | 55.25 | 57.04 | 53.15 | 53.39 | 55.93 | 53.13 | 53.47 | 56.05 |
| Southern | 75.82 | 73.92 | 75.22 | 69.35 | 66.25 | 71.1 | 66.75 | 67.52 | 72.17 | 67.23 | 67.79 | 72.34 |
| North-Western | 69.69 | 69.98 | 74.13 | 64.33 | 62.99 | 63.3 | 65.95 | 65.71 | 64.85 | 66.02 | 65.99 | 65.32 |
| Western | 75.57 | 73.93 | 73.22 | 66.03 | 67.84 | 70.25 | 65.13 | 65.55 | 67.41 | 65.33 | 65.97 | 67.54 |
In the following phase, we proceed with experiments using regional samples by transferring the weights from the models trained using the entire set. We designate four regions in Turkey, roughly spanning Western, Eastern, Southern and North-Western parts of the country. The results for this phase of the experiments are displayed in Table 2. Similarly to Table 1, shorter input durations tend to perform better. We note performance discrepancies, potentially arising from the intricate geological characteristics of each seismic region. For these experiments, we continue to include lower than 25 dB SNR samples while transferring model parameters to regional models.
| Architecture | ResNet | TCN | ||||||||||
|---|---|---|---|---|---|---|---|---|---|---|---|---|
| Domain | Frequency | Time | Frequency | Time | ||||||||
| Duration (s) | 15 | 30 | 60 | 15 | 30 | 60 | 15 | 30 | 60 | 15 | 30 | 60 |
| Eastern | 53.39 | 52.9 | 54.65 | 49.07 | 50.71 | 52.57 | 49.55 | 49.91 | 52.98 | 49.39 | 50.19 | 52.68 |
| Southern | 67.36 | 68.32 | 72.53 | 58.23 | 56.39 | 61.51 | 60.12 | 60.82 | 66.18 | 60.53 | 61.12 | 66.35 |
| North-Western | 55.80 | 52.19 | 63.70 | 47.73 | 48.59 | 50.76 | 46.86 | 47.46 | 50.29 | 47.11 | 47.57 | 50.38 |
| Western | 59.97 | 50.87 | 61.98 | 51.88 | 53.86 | 58.12 | 51.76 | 52.39 | 56.14 | 52.24 | 52.39 | 56.32 |
To assess the impact of SNR in the transfer-learning experiments, we replicate the previous experiment by excluding low SNR samples, specifically using samples with SNR values higher than 25. The results of the experiments are provided in Table 3. We observe that performance differences between regions are mitigated, and the impact of SNR persists in the transfer-learning experiments. Excluding low SNR records resulted in an 18% reduction in mean prediction error in experiments utilizing the entire set and a 14.9% reduction in the average of all transfer (i.e. regional) experiments.
| SNR >= 25 | Region | Eastern | North-Western | Western | Southern | ||||
| Mean | Std | Mean | Std | Mean | Std | Mean | Std | ||
| Overall | 51.50 | 1.81 | 50.70 | 4.64 | 54.83 | 3.48 | 63.29 | 4.56 | |
| Network | ResNet | 52.22 | 1.83 | 53.13 | 5.40 | 56.11 | 4.16 | 64.06 | 5.77 |
| TCN | 50.78 | 1.47 | 48.28 | 1.47 | 53.54 | 1.91 | 62.52 | 2.67 | |
| Duration | 15 s | 50.35 | 1.76 | 49.38 | 3.72 | 53.96 | 3.47 | 61.56 | 3.46 |
| 30 s | 50.93 | 1.17 | 48.95 | 1.92 | 52.38 | 1.06 | 61.66 | 4.28 | |
| 60 s | 53.22 | 0.84 | 53.78 | 5.73 | 58.14 | 2.35 | 66.64 | 3.91 | |
| Domain | Frequency | 52.23 | 1.86 | 52.72 | 5.75 | 55.52 | 4.23 | 65.89 | 4.31 |
| Time | 50.77 | 1.42 | 48.69 | 1.40 | 54.14 | 2.33 | 60.69 | 3.09 | |
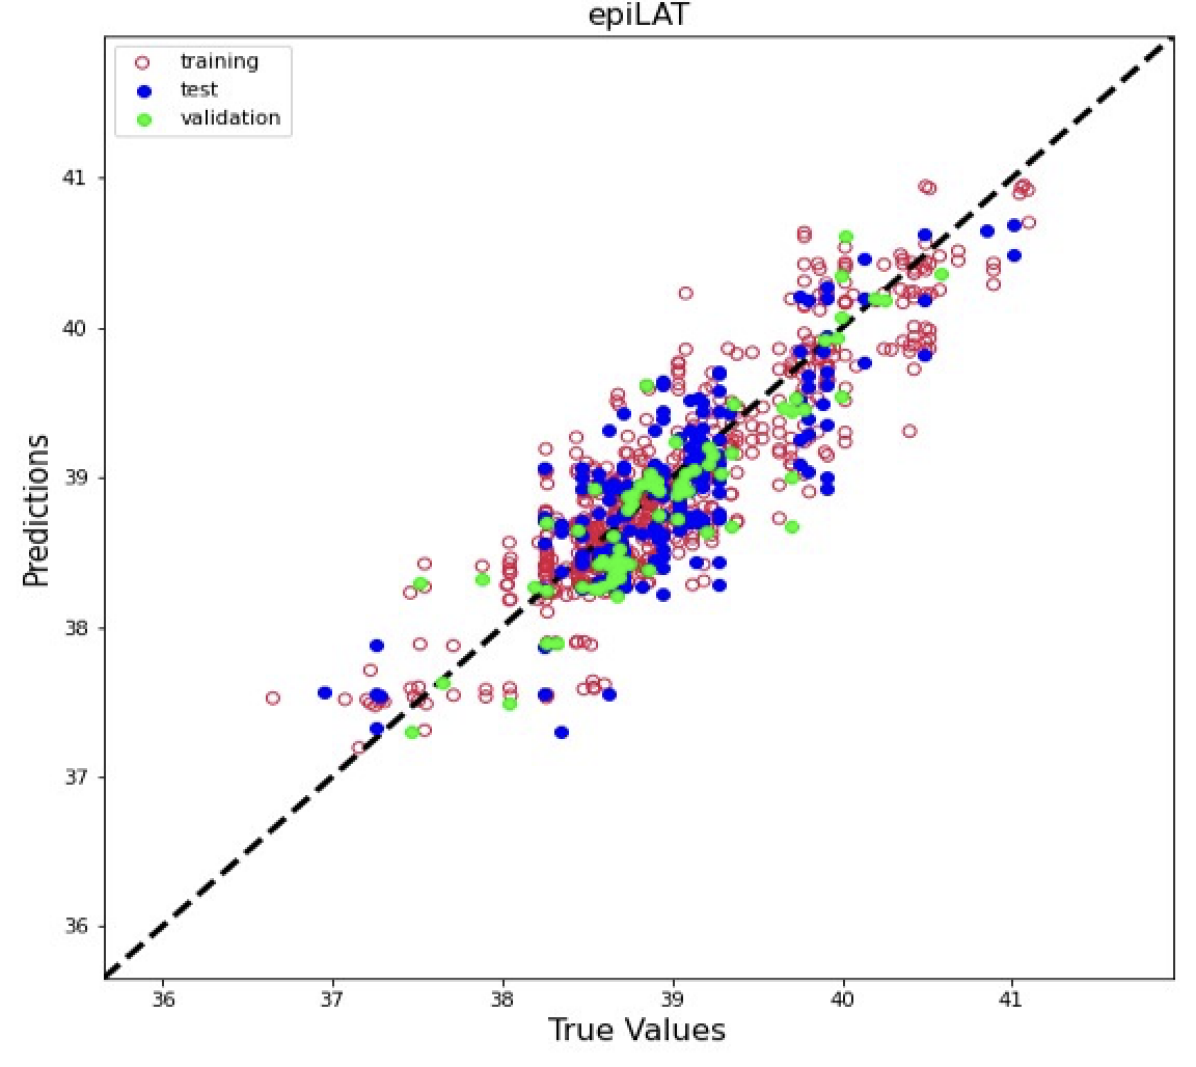
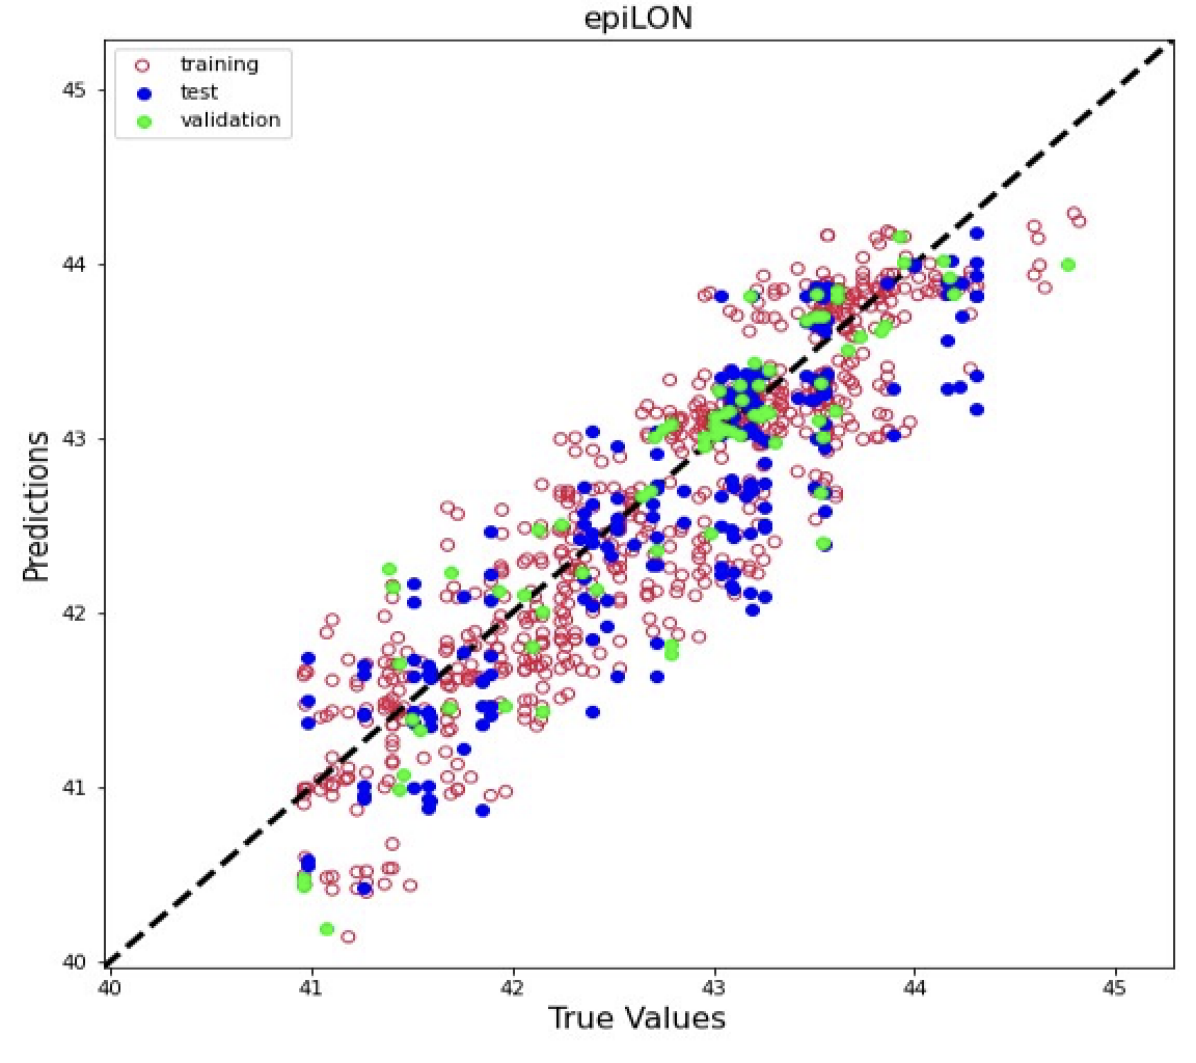
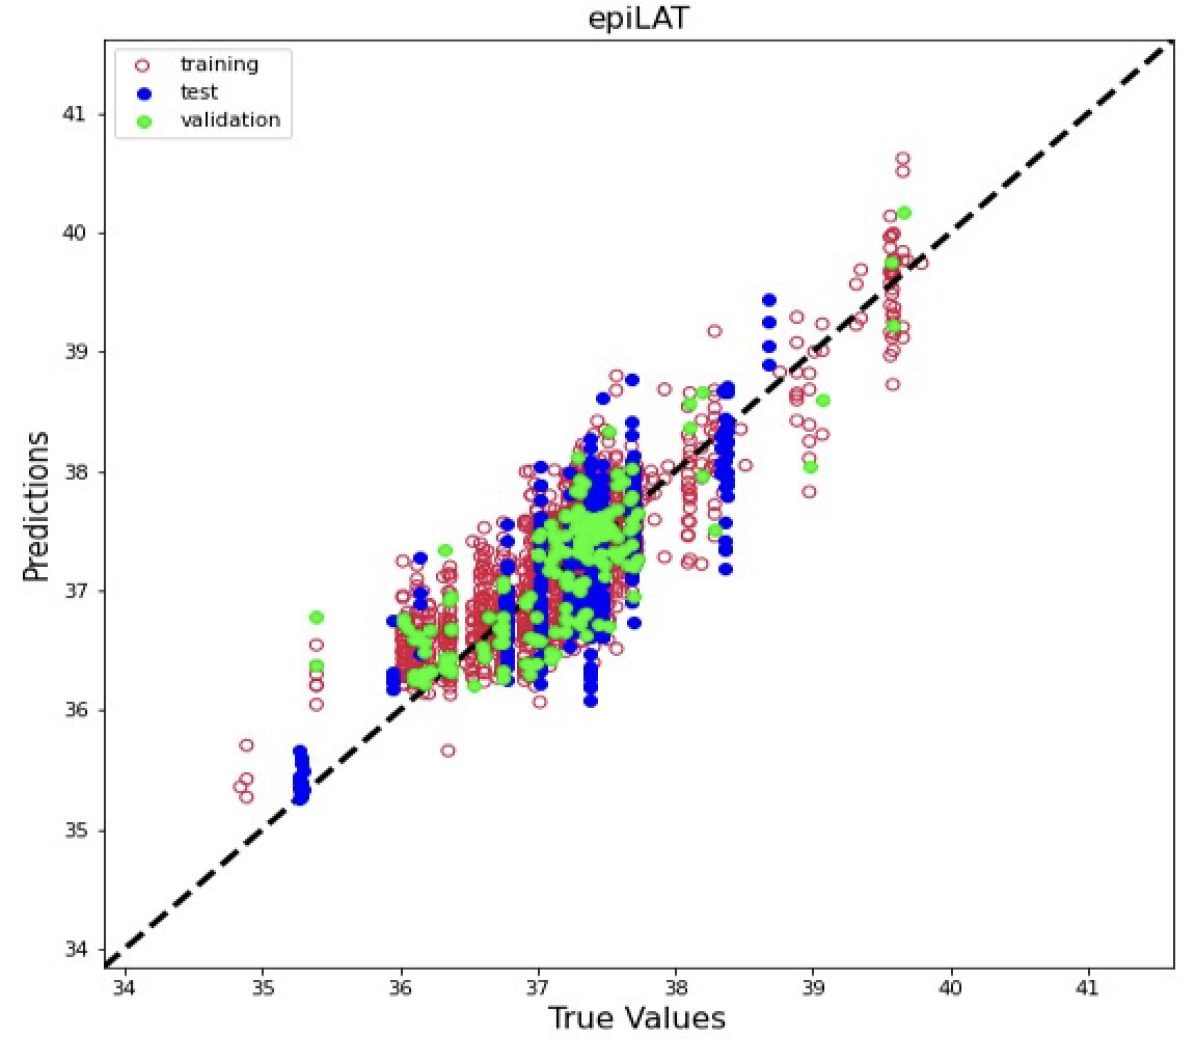
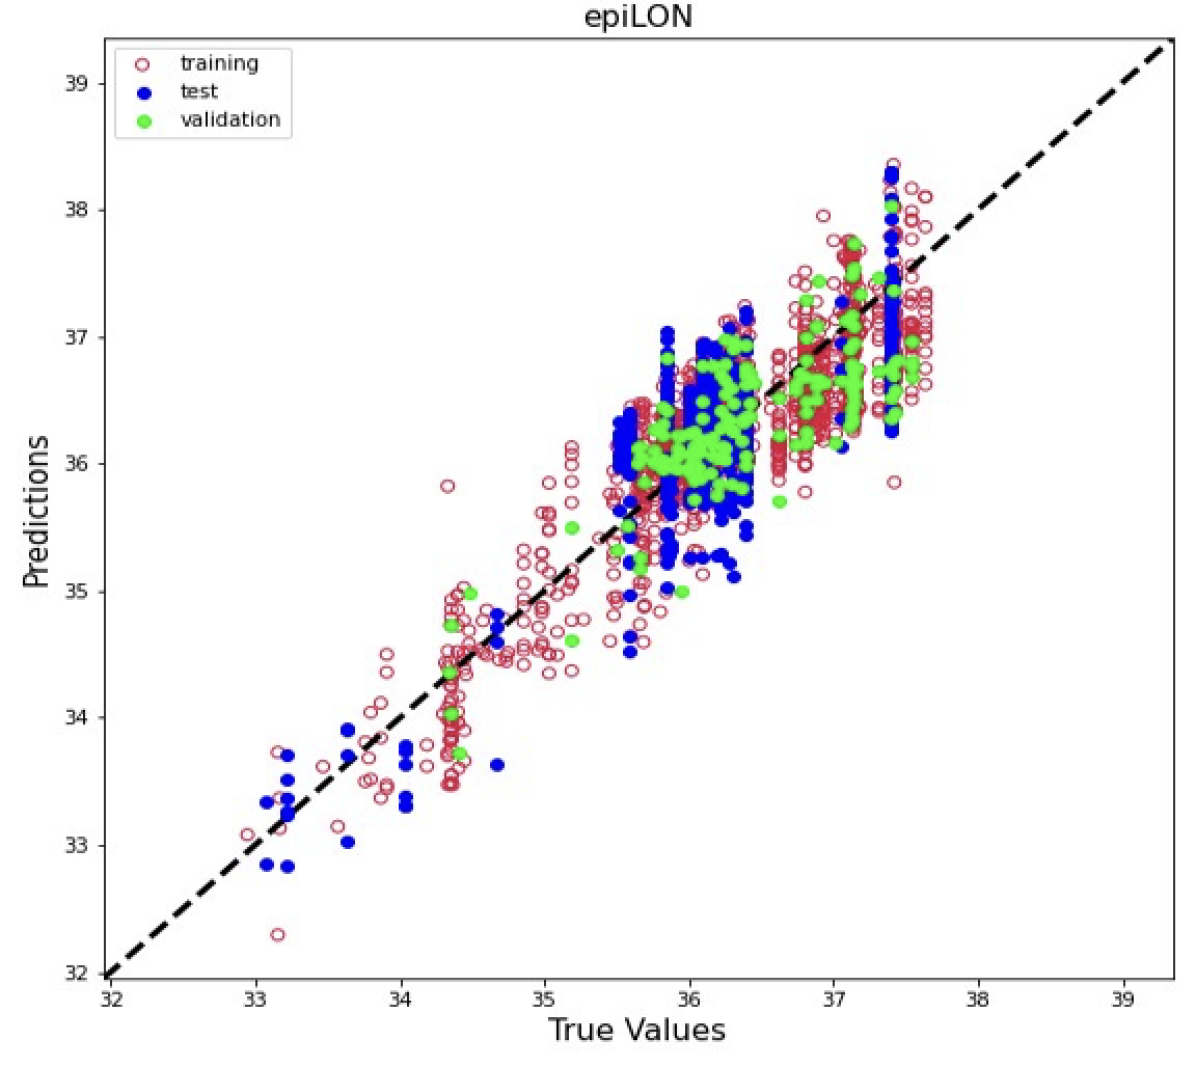
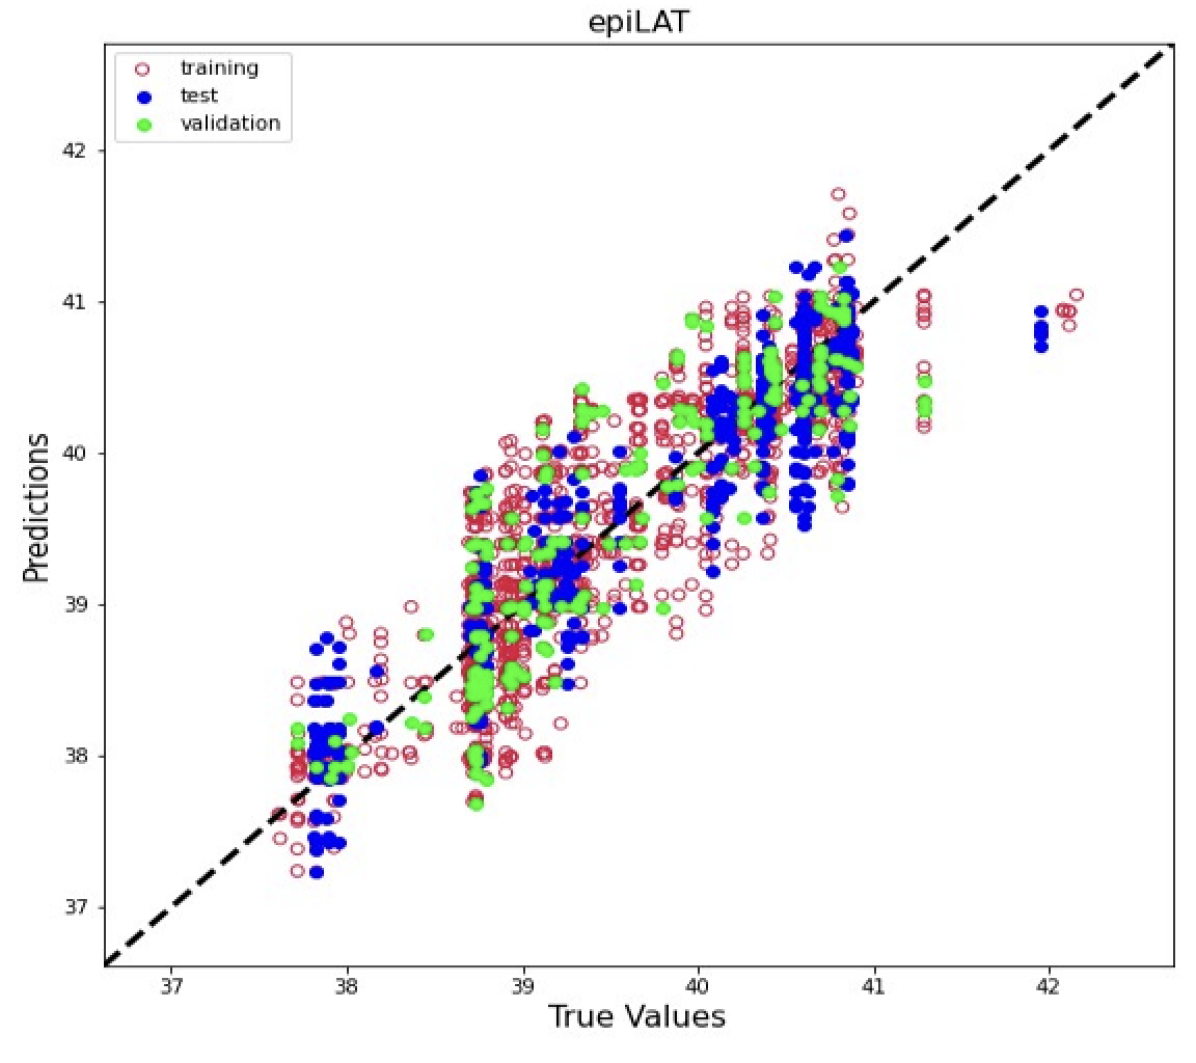
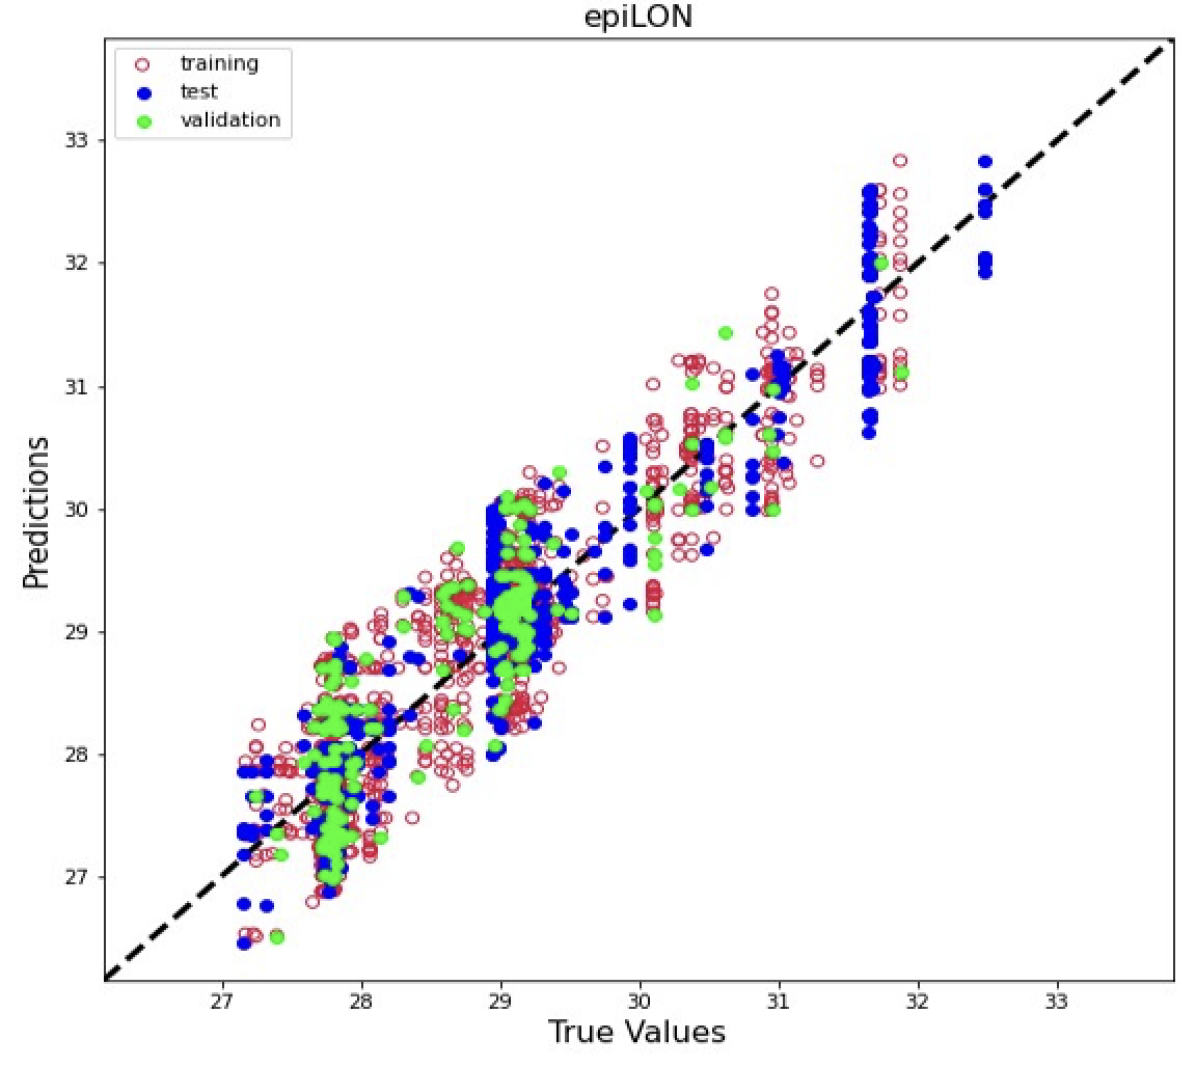
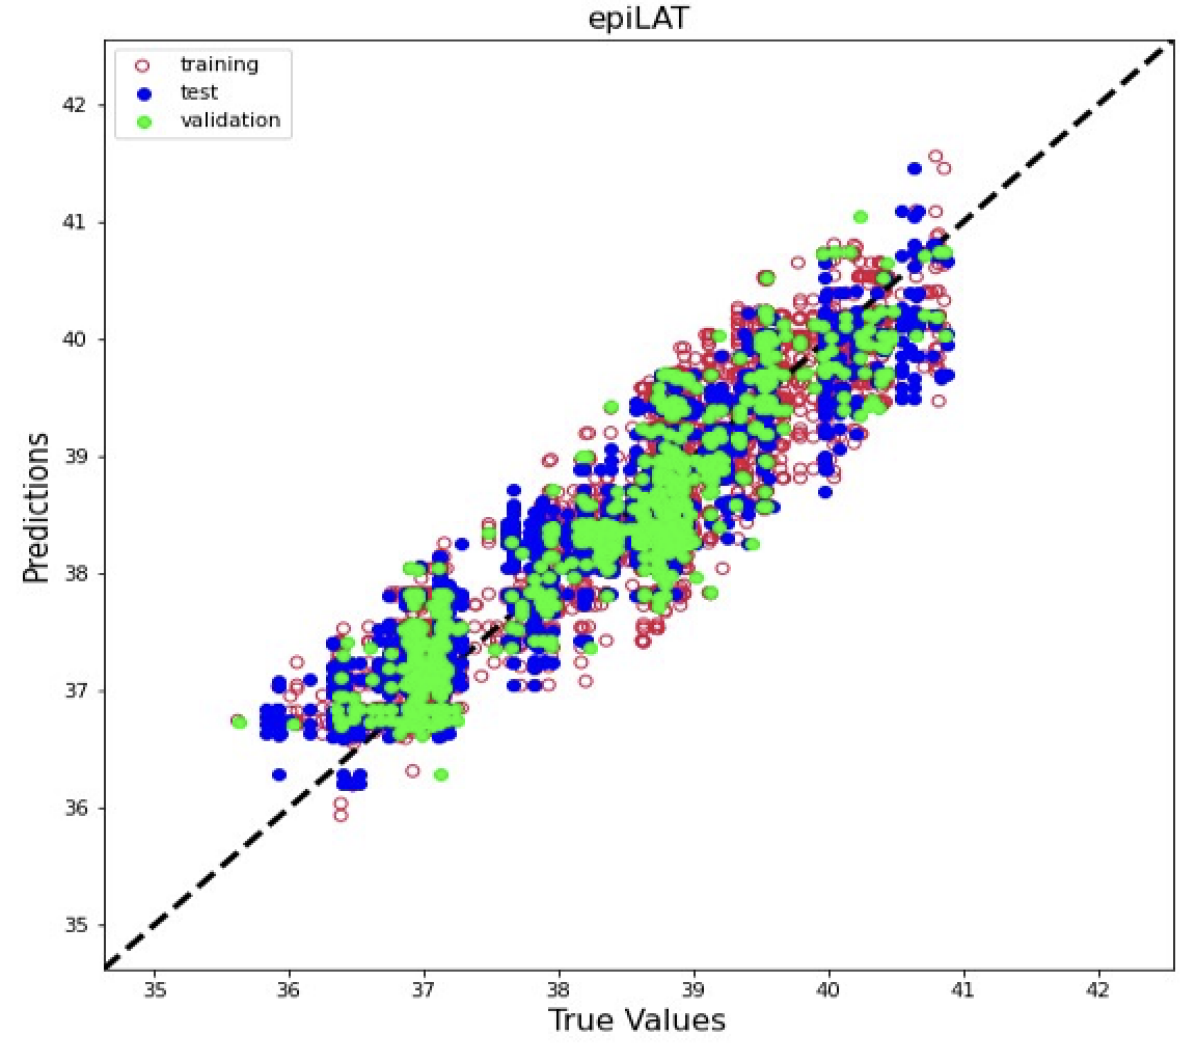
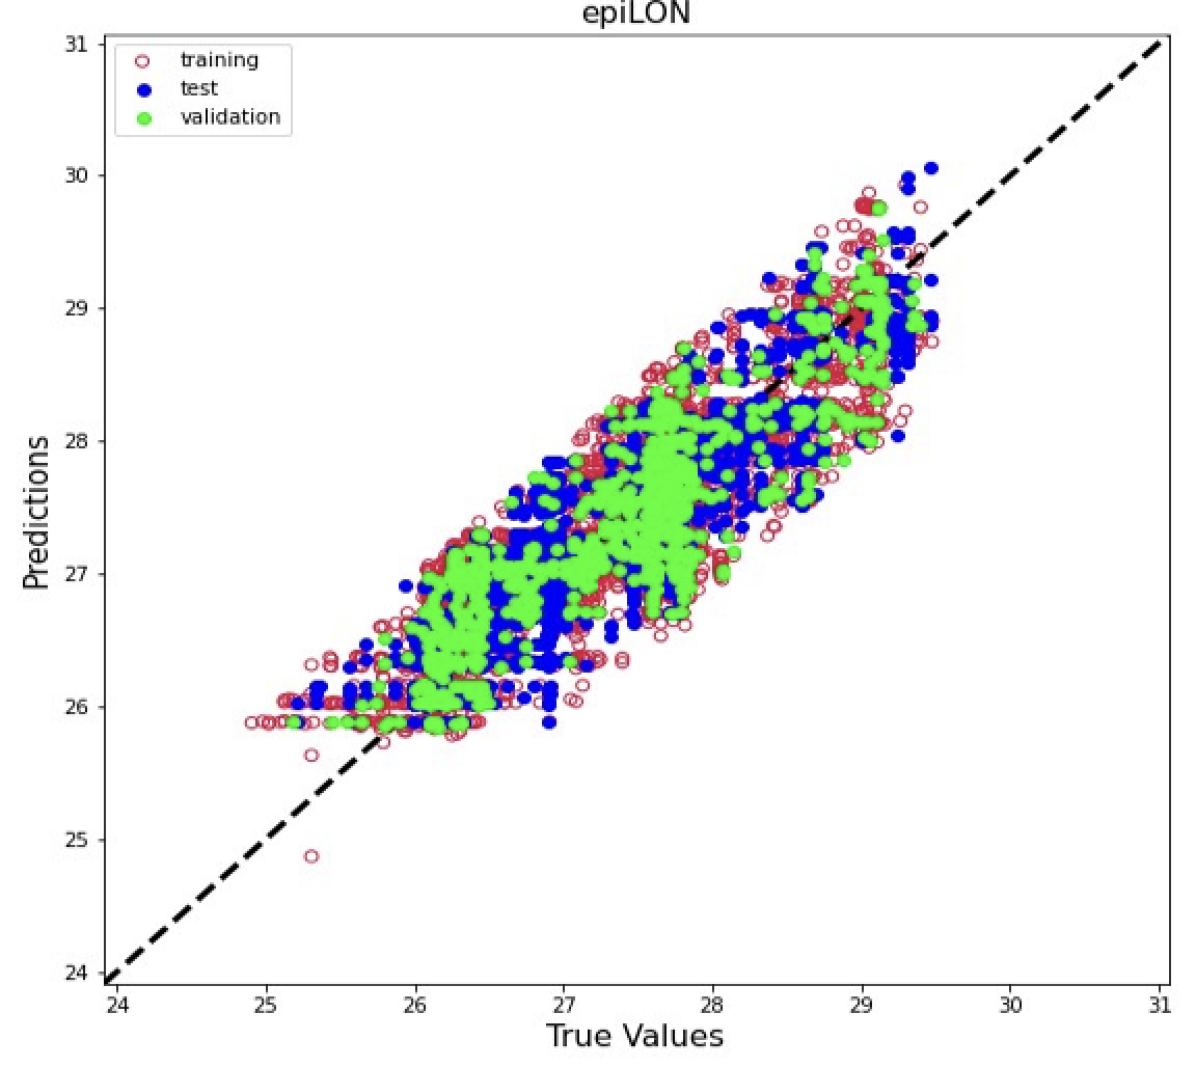
In Figure 5, prediction results of the transfer learning experiments for each trianing (red), validation (green) and test (blue) sample is presented. In these figures all samples, with both low and high SNR are included. Paralel to Tables 2 and 3, transfer learning experiments that belong to Eastern and Southern regions provide better prediction distributions. This further underscores the influence of regional geological and geophysical characteristics on our results.
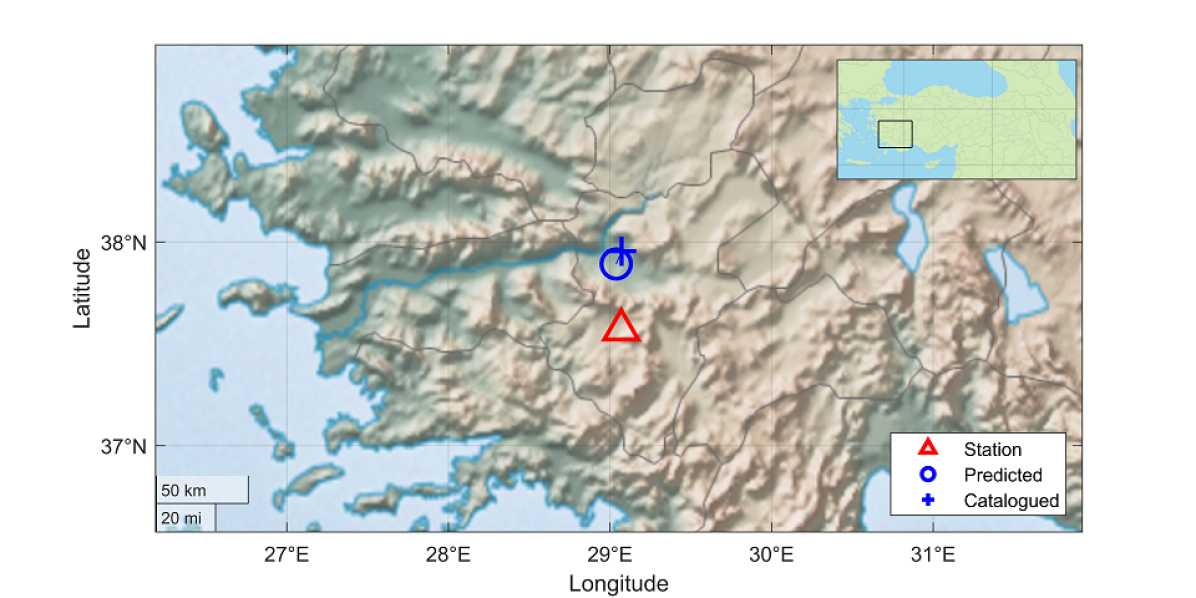
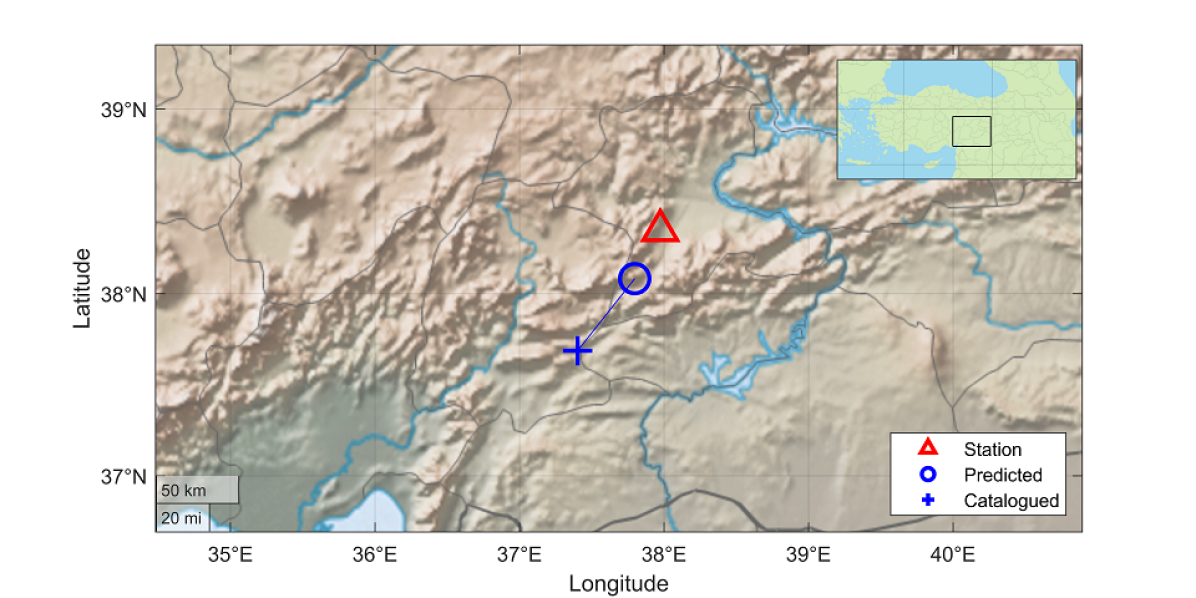
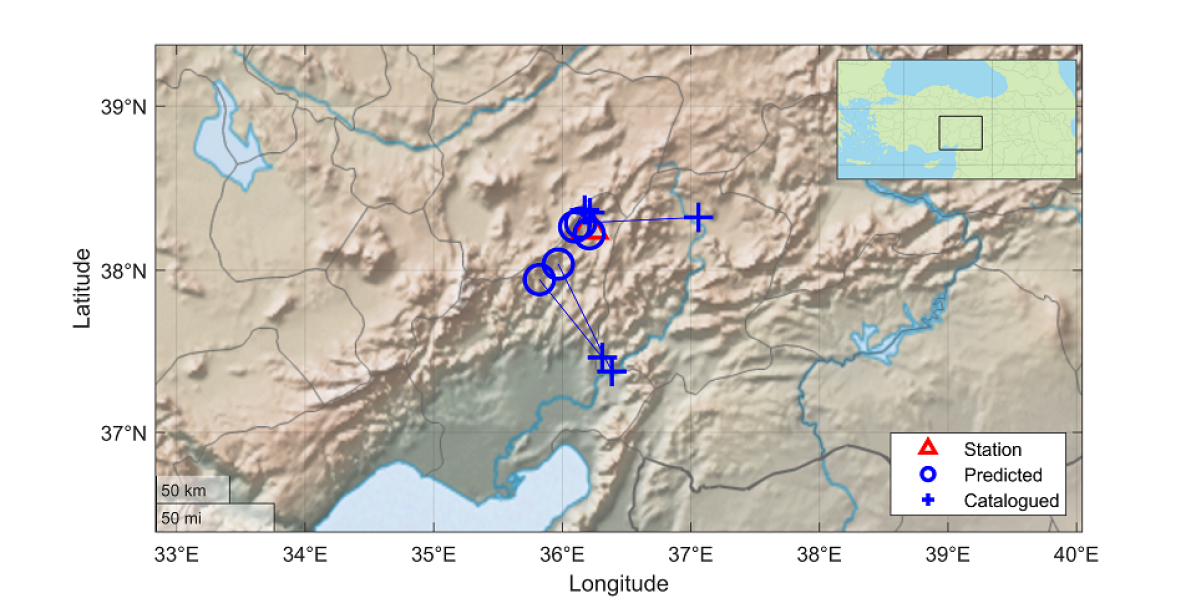
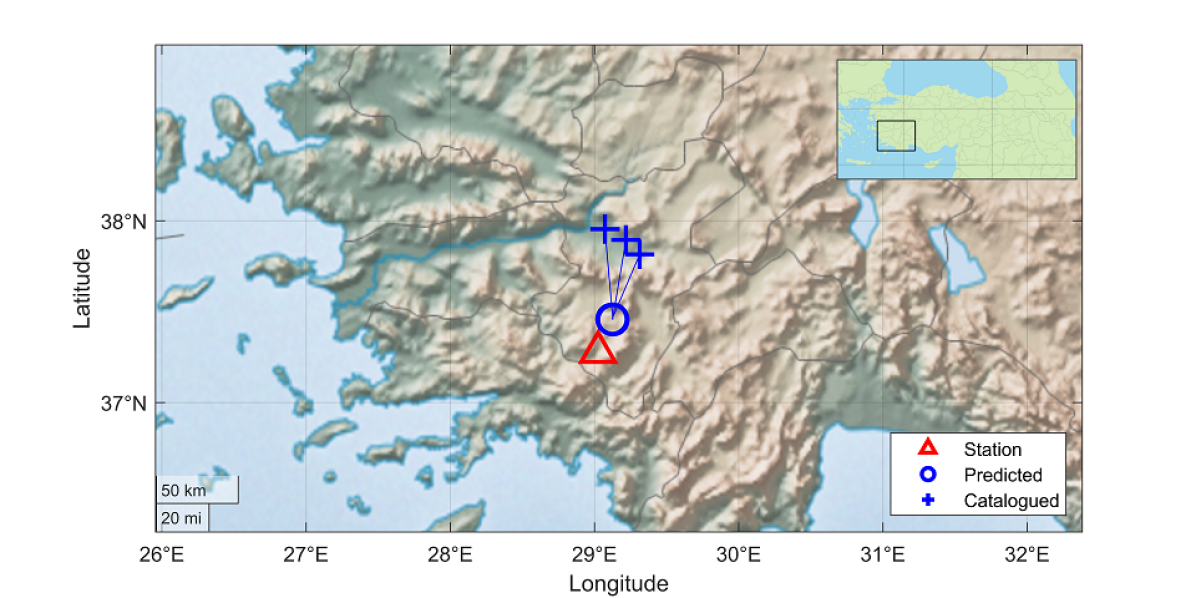
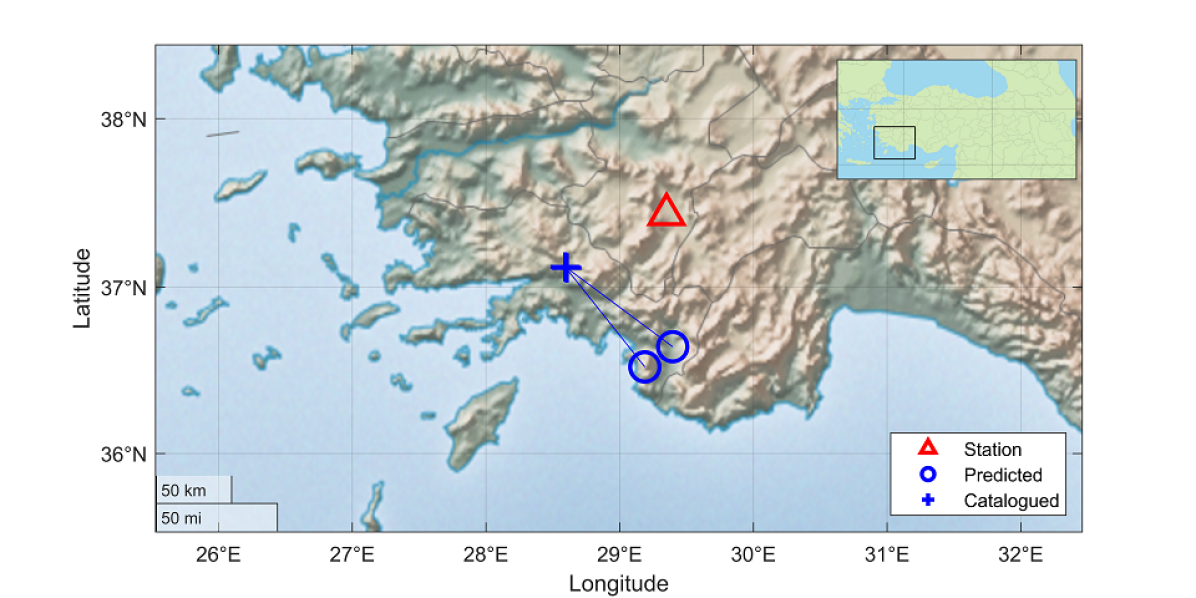
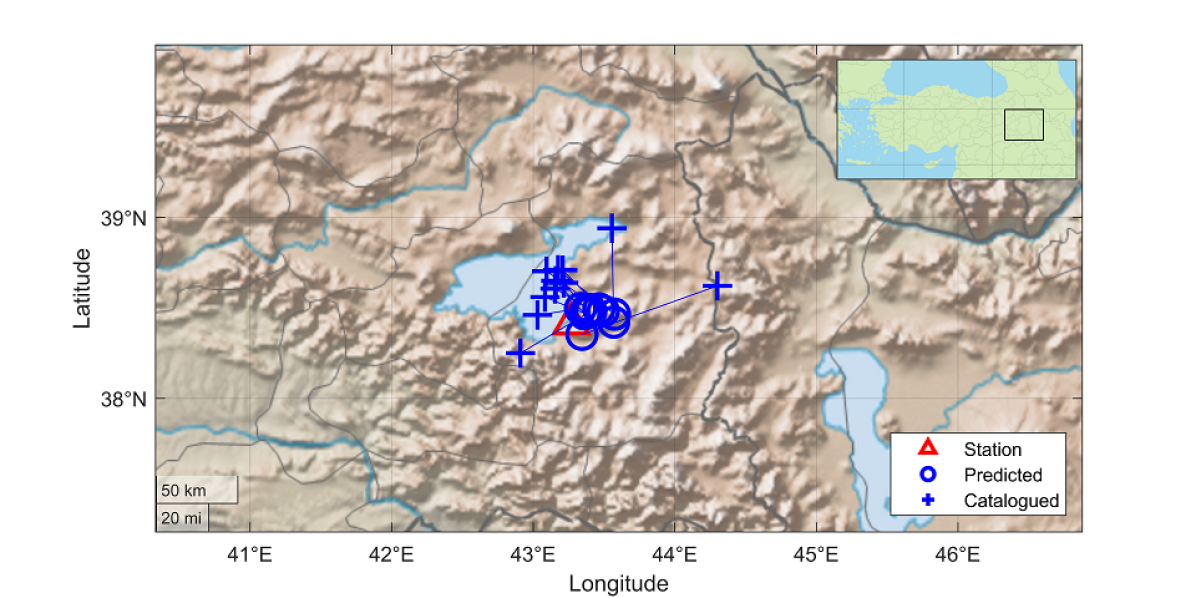
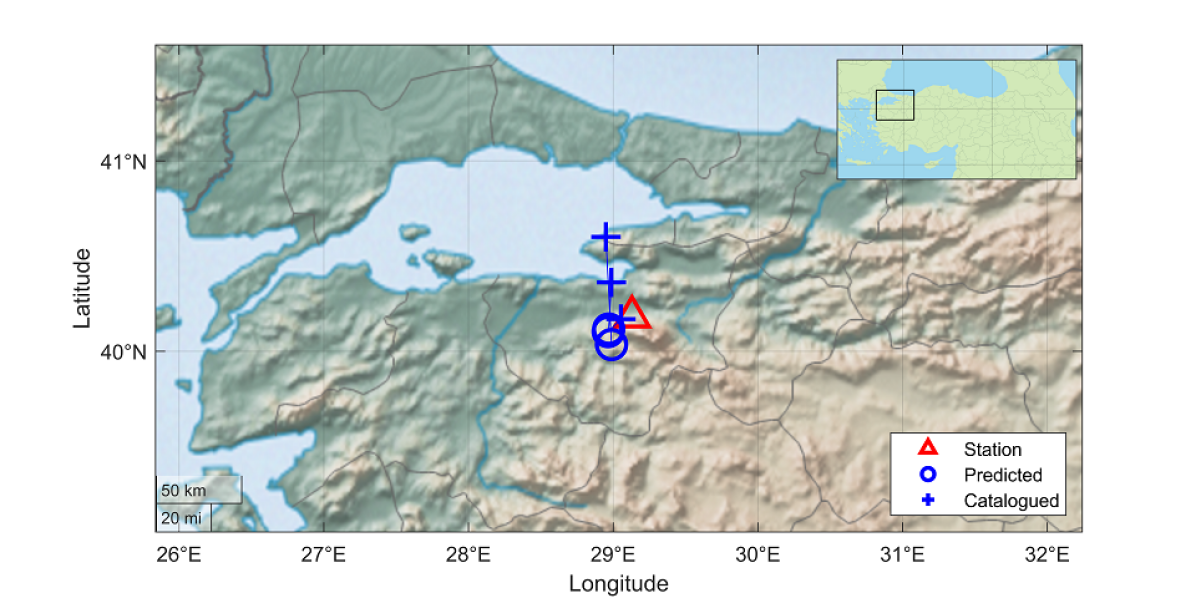
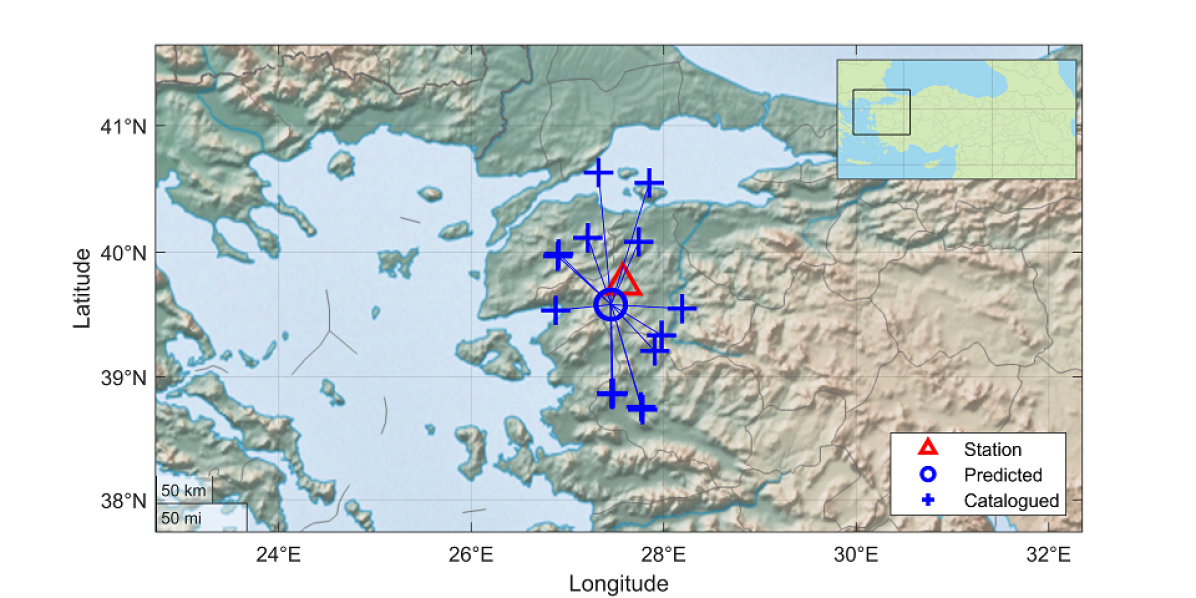
For an overall assessment of all results, Table 4 presents the averages of all transfer learning experiments for each region in the ”Overall” row (third row). All experiments in this table are conducted using records with SNR values higher than 25 dB and with decision layers having a dropout rate of 0.5 (similarly to previous experiments). Subsequent rows of this table present average errors for specific parameters, again individually for each region. For instance, the ”ResNet” row (fourth row) represents the average results for all experiments that utilize this convolutional encoder. It is evident that the 15-seconds and 30-seconds regions centered around the PGA value yields superior results, consistent with our findings. There is a slight performance preference for time-domain experiments. Regarding network architecture, TCN performs slightly better, in consistent with the results reported in [Cağlar \BOthers. (\APACyear2024)]. Performance results indicate that predictions for Eastern and North-Western provinces have lower tendency to deviate from its observations then Western and Southern regions. The common ground between the two seismic zones is the station coverage. From the results, we observe that regions of spatially homogenous seismic activity requires either more records or additional directional information for the model to match the variability of waveforms and divulge any particular relevance to the earthquake sources. For example, the stations in Eastern and North-Western regions are aligned in an eastward and a northeastward direction, respectively. This implicitly gives a sense of arrival direction to the model as exemplified in Figure 6, in which all the predictions are directed towards the large fault at southwest of Station 1620. Results for different stations are presented in Figure 6, where predicted and catalouged epicenter locations with the station coordinates are depicted on map. We observe that for certain regions (Figure 6a), the prediction errors are minimal, typically within a few kilometers. However, for other regions, the results exhibit varying levels of accuracy.
5 Conclusions and Future Directions
In this paper, we aim to locate the epicenter of an earthquake in world coordinates using strong motion records collected at a single station. We address whether strong motion records from a single station contain earthquake location information and whether deep learning models can extract this information effectively. On different input signal durations, convolutional encoders, and signal-to-noise ratio (SNR) levels, we carry out several experiments. We introduce a large-scale strong motion dataset comprising over 36,000 three-channel records collected from Turkish earthquake stations and conduct both nationwide and regional experiments.
From our experiments, we draw significant conclusions regarding the necessary SNR level for epicenter localization and the impact of input signal duration. We find that focusing only on the strongest part of the signal yields crucial information for pinpointing the epicenter. Additionally, we note that regional seismic characteristics play a crucial role in model performance, indicating the feasibility of deploying such models in specific regions.
However, we also encounter challenges in training such models. While some individual results show precise localization within a radius of 5 km, the average success of the models is lower than anticipated. This is consistent with recent studies such as [Cağlar \BOthers. (\APACyear2024)], which suggest that DL methods struggle to extract high-level seismic features when fed with only a single station record as input, without additional auxiliary information. The lower-than-expected success in our results, aligning with existing literature, underscores the absence of a readily available deep encoder for seismic signals. It is worth noting that early vision encoders required millions of images for training. We believe that a crucial future direction involves gathering an extensive ground or strong motion records dataset (of possibly millions of records) to train DL models, thereby improving accuracy and developing universal seismic deep encoders.
Open Research Section
The raw strong motion waveforms employed in this study, gathered for earthquakes with a magnitude exceeding 3.5, are publicly accessible through the Turkish Disaster and Emergency Management Authority (AFAD) (https://tadas.afad.gov.tr/). AFAD managed 799 strong motion stations across Turkey, distributed throughout various regions, during dataset compilation. This dataset encompasses strong motion events recorded at these stations since the 1990s, containing detailed information such as occurrence time, epicenter coordinates, depth, magnitude, station number recording the earthquake, station coordinates, and three-channel accelerometer waveforms capturing the entire event in all directions. The dataset utilized in our investigation comprises 36,418 three-channel waveforms corresponding to 3,655 distinct events, gathered from 718 of AFAD’s stations over a 8-year period, spanning from January 2, 2012, to December 19, 2018.
Acknowledgements.
This work is supported by The Scientific and Technological Research Council of Turkey (TÜBİTAK) as a part of the TÜBİTAK 1001 funded project, Project No.121M732, titled ”Deep Learning and Machine Learning Based Dynamic Soil and Earthquake Parameter Estimation Using Strong Ground Motion Station Records”.References
- Bilal \BOthers. (\APACyear2022) \APACinsertmetastarBilal2021{APACrefauthors}Bilal, M\BPBIA., Ji, Y., Wang, Y., Akhter, M\BPBIP.\BCBL \BBA Yaqub, M. \APACrefYearMonthDay2022. \BBOQ\APACrefatitleEarly Earthquake Detection Using Batch Normalization Graph Convolutional Neural Network (BNGCNN) Early earthquake detection using batch normalization graph convolutional neural network (bngcnn).\BBCQ \APACjournalVolNumPagesApplied Sciences1215. {APACrefURL} https://www.mdpi.com/2076-3417/12/15/7548 {APACrefDOI} 10.3390/app12157548 \PrintBackRefs\CurrentBib
- Bloemheuvel \BOthers. (\APACyear2022) \APACinsertmetastarBloemheuvel2022{APACrefauthors}Bloemheuvel, S., van den Hoogen, J., Jozinović, D., Michelini, A.\BCBL \BBA Atzmueller, M. \APACrefYearMonthDay2022Aug30. \BBOQ\APACrefatitleGraph neural networks for multivariate time series regression with application to seismic data Graph neural networks for multivariate time series regression with application to seismic data.\BBCQ \APACjournalVolNumPagesInternational Journal of Data Science and Analytics. {APACrefURL} https://doi.org/10.1007/s41060-022-00349-6 {APACrefDOI} 10.1007/s41060-022-00349-6 \PrintBackRefs\CurrentBib
- Boore \BBA Bommer (\APACyear2005) \APACinsertmetastarBoore2005{APACrefauthors}Boore, D\BPBIM.\BCBT \BBA Bommer, J\BPBIJ. \APACrefYearMonthDay2005. \BBOQ\APACrefatitleProcessing of strong-motion accelerograms: needs, options and consequences Processing of strong-motion accelerograms: needs, options and consequences.\BBCQ \APACjournalVolNumPagesSoil Dynamics and Earthquake Engineering25293-115. {APACrefURL} https://doi.org/10.1016/j.soildyn.2004.10.007 \PrintBackRefs\CurrentBib
- Bose \BOthers. (\APACyear2008) \APACinsertmetastarBöse2008{APACrefauthors}Bose, M., Wenzel, F.\BCBL \BBA Erdik, M. \APACrefYearMonthDay2008. \BBOQ\APACrefatitlePreSEIS: A Neural Network-Based Approach to Earthquake Early Warning for Finite Faults Preseis: A neural network-based approach to earthquake early warning for finite faults.\BBCQ \APACjournalVolNumPagesBulletin of the Seismological Society of America98366–382. {APACrefURL} http://doi.org/10.1785/0120070002 {APACrefDOI} 10.1785/0120070002 \PrintBackRefs\CurrentBib
- Cağlar \BOthers. (\APACyear2024) \APACinsertmetastarCaglar2024{APACrefauthors}Cağlar, U\BPBIM., Yilmaz, B., Türkmen, M., Akagündüz, E.\BCBL \BBA Tileylioglu, S. \APACrefYearMonthDay2024. \BBOQ\APACrefatitleExploring Challenges in Deep Learning of Single-Station Ground Motion Records Exploring challenges in deep learning of single-station ground motion records.\BBCQ \APACjournalVolNumPagesarXiv: 2403.07569. \PrintBackRefs\CurrentBib
- He \BOthers. (\APACyear2015) \APACinsertmetastarHe2015{APACrefauthors}He, K., Zhang, X., Ren, S.\BCBL \BBA Sun, J. \APACrefYearMonthDay2015. \APACrefbtitleDeep Residual Learning for Image Recognition. Deep residual learning for image recognition. \PrintBackRefs\CurrentBib
- Hong \BOthers. (\APACyear2021) \APACinsertmetastarHong2021{APACrefauthors}Hong, S., Nguyen, H\BHBIT., Jung, J.\BCBL \BBA Ahn, J. \APACrefYearMonthDay2021. \BBOQ\APACrefatitleSeismic Ground Response Estimation Based on Convolutional Neural Networks (CNN) Seismic ground response estimation based on convolutional neural networks (cnn).\BBCQ \APACjournalVolNumPagesApplied Sciences1122. {APACrefURL} https://www.mdpi.com/2076-3417/11/22/10760 {APACrefDOI} 10.3390/app112210760 \PrintBackRefs\CurrentBib
- Jiao \BBA Alavi (\APACyear2020) \APACinsertmetastarPengcheng2020{APACrefauthors}Jiao, P.\BCBT \BBA Alavi, A\BPBIH. \APACrefYearMonthDay2020. \BBOQ\APACrefatitleArtificial intelligence in seismology: Advent, performance and future trends Artificial intelligence in seismology: Advent, performance and future trends.\BBCQ \APACjournalVolNumPagesGeoscience Frontiers113739-744. \PrintBackRefs\CurrentBib
- Jozinović \BOthers. (\APACyear2020) \APACinsertmetastarJozinović2020{APACrefauthors}Jozinović, D., Lomax, A., Štajduhar, I.\BCBL \BBA Michelini, A. \APACrefYearMonthDay202005. \BBOQ\APACrefatitleRapid prediction of earthquake ground shaking intensity using raw waveform data and a convolutional neural network Rapid prediction of earthquake ground shaking intensity using raw waveform data and a convolutional neural network.\BBCQ \APACjournalVolNumPagesGeophysical Journal International22221379-1389. {APACrefURL} https://doi.org/10.1093/gji/ggaa233 {APACrefDOI} 10.1093/gji/ggaa233 \PrintBackRefs\CurrentBib
- Kim \BOthers. (\APACyear2022) \APACinsertmetastarKim2022{APACrefauthors}Kim, G., Ku, B., Ahn, J\BHBIK.\BCBL \BBA Ko, H. \APACrefYearMonthDay2022. \BBOQ\APACrefatitleGraph Convolution Networks for Seismic Events Classification Using Raw Waveform Data From Multiple Stations Graph convolution networks for seismic events classification using raw waveform data from multiple stations.\BBCQ \APACjournalVolNumPagesIEEE Geoscience and Remote Sensing Letters191-5. {APACrefDOI} 10.1109/LGRS.2021.3127874 \PrintBackRefs\CurrentBib
- Kriegerowski \BOthers. (\APACyear2018) \APACinsertmetastarKriegerowski2019{APACrefauthors}Kriegerowski, M., Petersen, G\BPBIM., Vasyura‐Bathke, H.\BCBL \BBA Ohrnberger, M. \APACrefYearMonthDay201812. \BBOQ\APACrefatitleA Deep Convolutional Neural Network for Localization of Clustered Earthquakes Based on Multistation Full Waveforms A Deep Convolutional Neural Network for Localization of Clustered Earthquakes Based on Multistation Full Waveforms.\BBCQ \APACjournalVolNumPagesSeismological Research Letters902A510-516. {APACrefURL} https://doi.org/10.1785/0220180320 {APACrefDOI} 10.1785/0220180320 \PrintBackRefs\CurrentBib
- Kuyuk \BBA Susumu (\APACyear2018) \APACinsertmetastarKuyuk2018{APACrefauthors}Kuyuk, H\BPBIS.\BCBT \BBA Susumu, O. \APACrefYearMonthDay2018. \BBOQ\APACrefatitleReal-Time Classification of Earthquake using Deep Learning Real-time classification of earthquake using deep learning.\BBCQ \APACjournalVolNumPagesProcedia Computer Science140298-305. \APACrefnoteCyber Physical Systems and Deep Learning Chicago, Illinois November 5-7, 2018 {APACrefDOI} https://doi.org/10.1016/j.procs.2018.10.316 \PrintBackRefs\CurrentBib
- Lomax \BOthers. (\APACyear2019) \APACinsertmetastarLomax2019{APACrefauthors}Lomax, A., Michelini, A.\BCBL \BBA Jozinović, D. \APACrefYearMonthDay201902. \BBOQ\APACrefatitleAn Investigation of Rapid Earthquake Characterization Using Single‐Station Waveforms and a Convolutional Neural Network An Investigation of Rapid Earthquake Characterization Using Single‐Station Waveforms and a Convolutional Neural Network.\BBCQ \APACjournalVolNumPagesSeismological Research Letters902A517-529. {APACrefURL} https://doi.org/10.1785/0220180311 {APACrefDOI} 10.1785/0220180311 \PrintBackRefs\CurrentBib
- M Böse (\APACyear2012) \APACinsertmetastarBose2012{APACrefauthors}M Böse, E\BPBIH., T. Heaton. \APACrefYearMonthDay201204. \BBOQ\APACrefatitleRapid Estimation of Earthquake Source and Ground-Motion Parameters for Earthquake Early Warning Using Data from a Single Three-Component Broadband or Strong-Motion Sensor Rapid estimation of earthquake source and ground-motion parameters for earthquake early warning using data from a single three-component broadband or strong-motion sensor.\BBCQ \APACjournalVolNumPagesThe Bulletin of the Seismological Society of America102738-750. {APACrefDOI} 10.1785/0120110152 \PrintBackRefs\CurrentBib
- McBrearty \BBA Beroza (\APACyear2022) \APACinsertmetastarMcBrearty2022{APACrefauthors}McBrearty, I\BPBIW.\BCBT \BBA Beroza, G\BPBIC. \APACrefYearMonthDay2022. \BBOQ\APACrefatitleEarthquake Location and Magnitude Estimation with Graph Neural Networks Earthquake location and magnitude estimation with graph neural networks.\BBCQ \BIn \APACrefbtitle2022 IEEE International Conference on Image Processing (ICIP) 2022 ieee international conference on image processing (icip) (\BPG 3858-3862). {APACrefDOI} 10.1109/ICIP46576.2022.9897468 \PrintBackRefs\CurrentBib
- Mousavi \BBA Beroza (\APACyear2020) \APACinsertmetastarMousavi2020a{APACrefauthors}Mousavi, S\BPBIM.\BCBT \BBA Beroza, G\BPBIC. \APACrefYearMonthDay2020. \BBOQ\APACrefatitleBayesian-Deep-Learning Estimation of Earthquake Location From Single-Station Observations Bayesian-deep-learning estimation of earthquake location from single-station observations.\BBCQ \APACjournalVolNumPagesIEEE Transactions on Geoscience and Remote Sensing58118211-8224. {APACrefDOI} 10.1109/TGRS.2020.2988770 \PrintBackRefs\CurrentBib
- Mousavi \BBA Beroza (\APACyear2023) \APACinsertmetastarMousavi2023{APACrefauthors}Mousavi, S\BPBIM.\BCBT \BBA Beroza, G\BPBIC. \APACrefYearMonthDay2023. \BBOQ\APACrefatitleMachine Learning in Earthquake Seismology Machine learning in earthquake seismology.\BBCQ \APACjournalVolNumPagesAnnual Review of Earth and Planetary Sciences511105-129. {APACrefDOI} 10.1146/annurev-earth-071822-100323 \PrintBackRefs\CurrentBib
- Mousavi \BOthers. (\APACyear2020) \APACinsertmetastarMousavi2020b{APACrefauthors}Mousavi, S\BPBIM., Ellsworth, W\BPBIL., Zhu, W., Chuang, L\BPBIY.\BCBL \BBA Beroza, G\BPBIC. \APACrefYearMonthDay2020Aug07. \BBOQ\APACrefatitleEarthquake transformer—an attentive deep-learning model for simultaneous earthquake detection and phase picking Earthquake transformer—an attentive deep-learning model for simultaneous earthquake detection and phase picking.\BBCQ \APACjournalVolNumPagesNature Communications1113952. {APACrefDOI} 10.1038/s41467-020-17591-w \PrintBackRefs\CurrentBib
- Mousavi \BOthers. (\APACyear2019) \APACinsertmetastarMousavi2019{APACrefauthors}Mousavi, S\BPBIM., Sheng, Y., Zhu, W.\BCBL \BBA Beroza, G\BPBIC. \APACrefYearMonthDay2019. \BBOQ\APACrefatitleSTanford EArthquake Dataset (STEAD): A Global Data Set of Seismic Signals for AI Stanford earthquake dataset (stead): A global data set of seismic signals for ai.\BBCQ \APACjournalVolNumPagesIEEE Access7179464-179476. {APACrefDOI} 10.1109/ACCESS.2019.2947848 \PrintBackRefs\CurrentBib
- Münchmeyer \BOthers. (\APACyear2020) \APACinsertmetastarMünchmeyer2020{APACrefauthors}Münchmeyer, J., Bindi, D., Leser, U.\BCBL \BBA Tilmann, F. \APACrefYearMonthDay202012. \BBOQ\APACrefatitleThe transformer earthquake alerting model: a new versatile approach to earthquake early warning The transformer earthquake alerting model: a new versatile approach to earthquake early warning.\BBCQ \APACjournalVolNumPagesGeophysical Journal International2251646-656. {APACrefURL} https://doi.org/10.1093/gji/ggaa609 {APACrefDOI} 10.1093/gji/ggaa609 \PrintBackRefs\CurrentBib
- Nakano \BBA Sugiyama (\APACyear2022) \APACinsertmetastarNakano2022{APACrefauthors}Nakano, M.\BCBT \BBA Sugiyama, D. \APACrefYearMonthDay2022Sep08. \BBOQ\APACrefatitleDiscriminating seismic events using 1D and 2D CNNs: applications to volcanic and tectonic datasets Discriminating seismic events using 1d and 2d cnns: applications to volcanic and tectonic datasets.\BBCQ \APACjournalVolNumPagesEarth, Planets and Space741134. {APACrefDOI} 10.1186/s40623-022-01696-1 \PrintBackRefs\CurrentBib
- Nossier \BOthers. (\APACyear2020) \APACinsertmetastarNossier2020{APACrefauthors}Nossier, S\BPBIA., Wall, J., Moniri, M., Glackin, C.\BCBL \BBA Cannings, N. \APACrefYearMonthDay2020. \BBOQ\APACrefatitleA Comparative Study of Time and Frequency Domain Approaches to Deep Learning based Speech Enhancement A comparative study of time and frequency domain approaches to deep learning based speech enhancement.\BBCQ \BIn \APACrefbtitle2020 International Joint Conference on Neural Networks (IJCNN) 2020 international joint conference on neural networks (ijcnn) (\BPG 1-8). {APACrefDOI} 10.1109/IJCNN48605.2020.9206928 \PrintBackRefs\CurrentBib
- Ochoa Gutierrez \BOthers. (\APACyear2018) \APACinsertmetastarOchoa2018{APACrefauthors}Ochoa Gutierrez, L\BPBIH., Vargas Jimenez, C\BPBIA.\BCBL \BBA Niño Vasquez, L\BPBIF. \APACrefYearMonthDay2018ene.. \BBOQ\APACrefatitleFast estimation of earthquake epicenter distance using a single seismological station with machine learning techniques Fast estimation of earthquake epicenter distance using a single seismological station with machine learning techniques.\BBCQ \APACjournalVolNumPagesDYNA85204161–168. {APACrefURL} https://revistas.unal.edu.co/index.php/dyna/article/view/68408 {APACrefDOI} 10.15446/dyna.v85n204.68408 \PrintBackRefs\CurrentBib
- Oord \BOthers. (\APACyear2016) \APACinsertmetastarTCN2016{APACrefauthors}Oord, A., Dieleman, S., Zen, H., Simonyan, K., Vinyals, O., Graves, A.\BDBLKavukcuoglu, K. \APACrefYearMonthDay201609. \BBOQ\APACrefatitleWaveNet: A Generative Model for Raw Audio Wavenet: A generative model for raw audio.\BBCQ \PrintBackRefs\CurrentBib
- Pardo \BOthers. (\APACyear2019) \APACinsertmetastarPardo2019{APACrefauthors}Pardo, E., Garfias, C.\BCBL \BBA Malpica, N. \APACrefYearMonthDay2019. \BBOQ\APACrefatitleSeismic Phase Picking Using Convolutional Networks Seismic phase picking using convolutional networks.\BBCQ \APACjournalVolNumPagesIEEE Transactions on Geoscience and Remote Sensing5797086-7092. {APACrefDOI} 10.1109/TGRS.2019.2911402 \PrintBackRefs\CurrentBib
- Perol \BOthers. (\APACyear2018) \APACinsertmetastarPerol2018{APACrefauthors}Perol, T., Gharbi, M.\BCBL \BBA Denolle, M. \APACrefYearMonthDay2018. \BBOQ\APACrefatitleConvolutional neural network for earthquake detection and location Convolutional neural network for earthquake detection and location.\BBCQ \APACjournalVolNumPagesScience Advances42e1700578. {APACrefDOI} 10.1126/sciadv.1700578 \PrintBackRefs\CurrentBib
- Republic of Turkey \BBA Emergency Management Authority (\APACyear2024) \APACinsertmetastarAFAD{APACrefauthors}Republic of Turkey, D., Ministry of Interior\BCBT \BBA Emergency Management Authority. \APACrefYearMonthDay2024last access: 14.12.2022. \APACrefbtitle(AFAD) - Turkish Accelorometric Database and Analysis System. (AFAD) - Turkish Accelorometric Database and Analysis System. {APACrefURL} https://tadas.afad.gov.tr \PrintBackRefs\CurrentBib
- Ristea \BBA Radoi (\APACyear2022) \APACinsertmetastarRistea2022{APACrefauthors}Ristea, N\BHBIC.\BCBT \BBA Radoi, A. \APACrefYearMonthDay2022. \BBOQ\APACrefatitleComplex Neural Networks for Estimating Epicentral Distance, Depth, and Magnitude of Seismic Waves Complex neural networks for estimating epicentral distance, depth, and magnitude of seismic waves.\BBCQ \APACjournalVolNumPagesIEEE Geoscience and Remote Sensing Letters191-5. {APACrefDOI} 10.1109/LGRS.2021.3059422 \PrintBackRefs\CurrentBib
- Saad \BOthers. (\APACyear2021) \APACinsertmetastarSaad2021{APACrefauthors}Saad, O\BPBIM., Hafez, A\BPBIG.\BCBL \BBA Soliman, M\BPBIS. \APACrefYearMonthDay2021. \BBOQ\APACrefatitleDeep Learning Approach for Earthquake Parameters Classification in Earthquake Early Warning System Deep learning approach for earthquake parameters classification in earthquake early warning system.\BBCQ \APACjournalVolNumPagesIEEE Geoscience and Remote Sensing Letters1871293-1297. {APACrefDOI} 10.1109/LGRS.2020.2998580 \PrintBackRefs\CurrentBib
- Sugiyama \BOthers. (\APACyear2021) \APACinsertmetastarSugiyama2021{APACrefauthors}Sugiyama, D., Tsuboi, S.\BCBL \BBA Yukutake, Y. \APACrefYearMonthDay2021. \BBOQ\APACrefatitleApplication of Deep Learning-Based Neural Networks Using Theoretical Seismograms as Training Data for Locating Earthquakes in the Hakone Volcanic Region Application of deep learning-based neural networks using theoretical seismograms as training data for locating earthquakes in the hakone volcanic region.\BBCQ \APACjournalVolNumPagespreprint (Version 1) available at Research Square. {APACrefDOI} https://doi.org/10.21203/rs.3.rs-295787/v1 \PrintBackRefs\CurrentBib
- van den Ende \BBA Ampuero (\APACyear2020) \APACinsertmetastarEnde2020{APACrefauthors}van den Ende, M\BPBIP\BPBIA.\BCBT \BBA Ampuero, J\BHBIP. \APACrefYearMonthDay2020. \BBOQ\APACrefatitleAutomated Seismic Source Characterization Using Deep Graph Neural Networks Automated seismic source characterization using deep graph neural networks.\BBCQ \APACjournalVolNumPagesGeophysical Research Letters4717e2020GL088690. \PrintBackRefs\CurrentBib
- Yang \BOthers. (\APACyear2021) \APACinsertmetastarYANG2021{APACrefauthors}Yang, D\BHBIH., Zhou, X., Wang, X\BHBIY.\BCBL \BBA Huang, J\BHBIP. \APACrefYearMonthDay2021. \BBOQ\APACrefatitleMirco-earthquake source depth detection using machine learning techniques Mirco-earthquake source depth detection using machine learning techniques.\BBCQ \APACjournalVolNumPagesInformation Sciences544325-342. \PrintBackRefs\CurrentBib
- Yano \BOthers. (\APACyear2021) \APACinsertmetastarYano2021{APACrefauthors}Yano, K., Shiina, T., Kurata, S., Kato, A., Komaki, F., Sakai, S.\BCBL \BBA Hirata, N. \APACrefYearMonthDay2021. \BBOQ\APACrefatitleGraph-Partitioning Based Convolutional Neural Network for Earthquake Detection Using a Seismic Array Graph-partitioning based convolutional neural network for earthquake detection using a seismic array.\BBCQ \APACjournalVolNumPagesJournal of Geophysical Research: Solid Earth1265e2020JB020269. \PrintBackRefs\CurrentBib
- Yoma \BOthers. (\APACyear2022) \APACinsertmetastarYoma2022{APACrefauthors}Yoma, N\BPBIB., Wuth, J., Pinto, A., de Celis, N., Celis, J., Huenupan, F.\BCBL \BBA Fustos-Toribio, I\BPBIJ. \APACrefYearMonthDay2022. \BBOQ\APACrefatitleEnd-to-end LSTM based estimation of volcano event epicenter localization End-to-end lstm based estimation of volcano event epicenter localization.\BBCQ \APACjournalVolNumPagesJournal of Volcanology and Geothermal Research429107615. {APACrefDOI} https://doi.org/10.1016/j.jvolgeores.2022.107615 \PrintBackRefs\CurrentBib
- Zhang \BOthers. (\APACyear2020) \APACinsertmetastarZhang2020{APACrefauthors}Zhang, X., Zhang, J., Yuan, C., Liu, S., Chen, Z.\BCBL \BBA Li, W. \APACrefYearMonthDay2020Feb06. \BBOQ\APACrefatitleLocating induced earthquakes with a network of seismic stations in Oklahoma via a deep learning method Locating induced earthquakes with a network of seismic stations in oklahoma via a deep learning method.\BBCQ \APACjournalVolNumPagesScientific Reports1011941. {APACrefURL} https://doi.org/10.1038/s41598-020-58908-5 {APACrefDOI} 10.1038/s41598-020-58908-5 \PrintBackRefs\CurrentBib
- Zhang \BOthers. (\APACyear2021) \APACinsertmetastarZhang2021{APACrefauthors}Zhang, X., Zhang, M.\BCBL \BBA Tian, X. \APACrefYearMonthDay2021. \BBOQ\APACrefatitleReal-Time Earthquake Early Warning With Deep Learning: Application to the 2016 M 6.0 Central Apennines, Italy Earthquake Real-time earthquake early warning with deep learning: Application to the 2016 m 6.0 central apennines, italy earthquake.\BBCQ \APACjournalVolNumPagesGeophysical Research Letters4852020GL089394. {APACrefURL} https://agupubs.onlinelibrary.wiley.com/doi/abs/10.1029/2020GL089394 \APACrefnote2020GL089394 2020GL089394 {APACrefDOI} https://doi.org/10.1029/2020GL089394 \PrintBackRefs\CurrentBib