Mechanistic insights into Z-ring formation and stability: A Langevin dynamics approach to FtsZ self-assembly
Abstract
The tubulin-like protein FtsZ is crucial for cytokinesis in bacteria and many archaea, forming a ring-shaped structure called the Z-ring at the site of cell division. Despite extensive research, the formation of Z-rings is not entirely understood. We propose a theoretical model based on FtsZ’s known filament structures, treating them as semiflexible polymers with specific mechanical properties and lateral inter-segment attraction that can stabilize ring formations. Our Langevin dynamics simulations reveal various morphological phases, including open helices, chains, rings, and globules, capturing experimental observations in the fission yeast model using FtsZ from different bacterial species or mutants of Escherichia coli. Using the theoretical model, we explore how treadmilling activity affects Z-ring stability and identify a spooling mechanism of ring formation. The active ring produces contractile, shear, and rotational stresses, which intensify before the Z-ring transitions to an open helix at high activity.
I Introduction
FtsZ is one among the diverse family of bacterial cytoskeletal proteins that exhibits distinct homologies to eukaryotic tubulin [1, 2, 3, 4]. In prokaryotic cells, e.g., bacteria and many archaea, FtsZ (filamenting temperature-sensitive mutant Z) proteins assemble into a ring, the Z-ring, at the future division site, and it attaches to the cell membrane [5, 6]. This ring provides the backbone for the formation of divisome [7, 8], a complex multi-protein structure that recruits other proteins required for septum formation between dividing cells. Moreover, the Z-ring itself may generate a constriction force helping cytokinesis [9].
Assembly of FtsZ into a ring-like structure requires polymerization of the monomeric units of FtsZ, which, like tubulin, depends on the binding of the nucleotide GTP [10, 11, 12, 13, 14]. Although GTP hydrolysis triggers the disassembly of FtsZ filaments, the assembly and polymerization of FtsZ itself is required for the GTPase activity. This is because GTP is sandwiched in the interface between two subunits of FtsZ, and while one subunit binds GTP, the catalytic residue necessary to hydrolyze the terminal phosphate in GTP is provided by the adjoining subunit [13, 15, 16]. GTP hydrolysis rates in FtsZ polymers regulate the turnover rates of the filaments [17, 18, 19] and, more recently, have been shown to drive treadmilling activity in FtsZ filaments [20, 21, 22]. In vivo, FtsZ filaments are dynamic. They are seen to organize as spiral structures along the axis of the cell during the cell elongation and condense into a ring (Z-ring) during cytokinesis, which is tightly coupled to the cell cycle progression [23, 24, 25]. In Bacillus subtilis, such spiral FtsZ filaments have been seen to coalesce into a ring during sporulation [23]. Other studies have also suggested a spiral or helical intermediate in the formation of the cytokinetic FtsZ ring [26]. However, despite numerous earlier studies, the exact mechanisms of FtsZ ring formation are not fully understood.
FtsZ is not only indispensable for cell division but is also the first protein to localize to the division site and orchestrates the recruitment of more than a dozen other proteins required for septation [1, 27, 28, 29, 30]. FtsZ is also thought to be an ancient protein that originated as soon as cells formed during an early stage of genetic code evolution [31]. Thus, understanding FtsZ function and its assembly into the cytokinetic ring remains a fundamental question central to biology. FtsZ, therefore, has received extensive attention in the past decades, both in experiments [32, 33, 17, 34, 35] and in numerical studies [36, 37, 38, 39, 40, 41, 42]. Numerical studies in two dimensions showed that lateral attraction plays a crucial part in determining the final shape of the FtsZ filament [43]. However, this model [43] lacked spontaneous torsion, which, as shown recently in Ref. [44], is important in generating the required constriction force. In recent years, considerable advancements have been made in comprehending the role, function, and mechanisms of FtsZ, particularly how it produces constriction force on the membrane.
The FtsZ filaments constituting rings are found to be highly dynamic [32, 17, 45, 20]. Recently, it has been shown that treadmilling not only guides the cell wall synthesis machinery [22, 21, 46, 47, Schäper2024] but also plays a crucial role in FtsZ ring assembly [49]. FtsZ polymerizes and forms a large variety of dynamic structures, straight, bent, and helical filaments, which are highly dependent on the experimental conditions such as pH, the presence of various monovalent salts, crowding agents, and polycations [50]. Using the structure of crystallized Methanococcus jannaschii FtsZ dimer and numerical simulations, the torsional and bending curvatures of FtsZ filaments were extracted [51]. The intrinsic torsional curvature present in the FtsZ could deform the membranes via torsional stress and show chiral treadmilling vortices in vivo [52]. Earlier experiments also suggested that GTPase activity and concentration of free ions play an important role in the dynamics and ring formation [53, 54], and free ions favor the lateral contacts between the filaments.
While these in vivo and in vitro reconstitution experiments have generated deep insights into the assembly dynamic of FtsZ filaments, a slightly different approach to studying bacterial cytoskeleton assembly in a molecularly crowded cellular environment was taken by Balasubramanian and colleagues [19]. The authors expressed FtsZ in yeast cells, both budding yeast (Saccharomyces cerevisiae) as well as fission yeast (Schizosaccharomyces pombe), and showed that FtsZ can assemble into a ring-like structure even in the absence of all other bacterial cytokinetic proteins [19]. They further showed that the process of ring assembly involves a spooling-like mechanism, possibly driven by GTP hydrolysis and lateral associations among the FtsZ filaments.
In this paper, we aim to understand the mechanisms behind the emergence of observed FtsZ filament morphologies in both bacterial and yeast systems using a polymer model and Langevin dynamics simulations. Our theoretical approach assumes the existence of FtsZ filamentous assembly as the starting point. We model it as a tangentially active chiral semiflexible polymer characterized by finite bending and torsional rigidity, as well as intrinsic bending and torsional curvatures. A tangential activity is used to model the FtsZ treadmilling. Our primary achievements are: Our model accurately captures all experimentally observed FtsZ morphologies, such as rings, helices, filaments, and globules, observed in FtsZ from different bacterial species or FtsZ mutants of Escherichia coli. A minimal lateral attraction is necessary for ring formation, and treadmilling can flatten and widen globules into rings, displaying rotation and a spooling mechanism to ring formation. The ring state remains stable over a broad range of treadmilling activities before transitioning into the open helix (OH) through phase coexistence. We obtain a detailed phase diagram, with the phase boundaries marked by peaks in size fluctuations and extensile response. Active spinning chiral rings (SCR) induce contractile stresses, rotation, and shear that intensify near the phase boundaries.
The paper is organized as follows: In Sec. II, we first summarise the experimental results, setting the motivation for the theoretical study. In Sec. III, we present the model and simulation details. In Sec. IV, we discuss the main results, including the phase diagram, shape and size of the polymer, and stress generation. Finally, we conclude in Sec. V, summarizing our results and presenting an outlook.
II Experimental results: motivation for theory
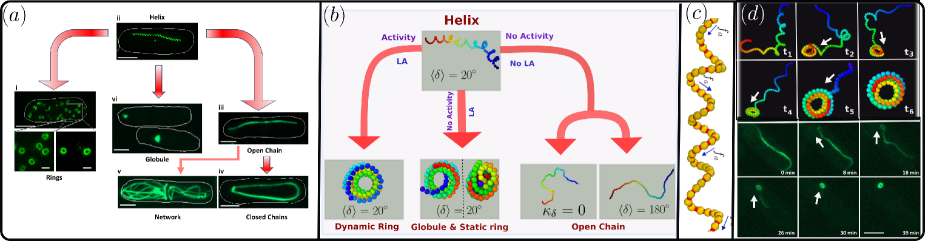
The various shapes of FtsZ assemblies, like rings, helices, filaments, and condensates that have been found in several in vitro experiments and in vivo studies in bacteria have also been observed for several kinds of FtsZs expressed in fission yeast. Fission yeast has served as a useful model to study the assembly dynamics of ring formation by FtsZ [19]. FtsZ from different bacterial species or FtsZ mutants of Escherichia coli have been shown to assemble into different forms such as helices [55] (Helicobacter pylori FtsZ or HpFtsZ), rings [19, 55] (EcFtsZ, Staphylococcus aureus SaFtsZ and EcFtsZ Q47K), globules (EcFtsZ D209A), open chains (EcFtsZ Q47K and EcFtsZ Q47KD86K), closed chains (EcFtsZ Q47KD86K) and network of polymers [19] (EcFtsZ and EcFtsZ G105S). The different forms of FtsZ assemblies that have been thus far seen upon expression in fission yeast are shown in Fig.1(). Further, since linear and helical polymers of FtsZ have been shown to undergo a transition into rings, or vice-versa in yeast and bacterial systems [19, 23, 24], the forms observed for the FtsZ mutants in yeast cells might suggest that the mutations drive and stabilize one or the other states. Dynamics of EcFtsZ Q47K ring formation in fission yeast (S. pombe) from an open chain shows a spooling mechanism.
As revealed by independent electron microscopy studies [56], the filaments observed in fluorescent microscopy Fig. 1() are typically filament bundles composed of multiple FtsZ chains bound laterally to each other. In the following section, we present a polymer model for such filament bundles.
III Model
We consider an active bead-spring chain with bending and torsional rigidity to model the FtsZ filament. The polymer is denoted by a space curve described by position vectors corresponding to beads. The bonding energy is given by where the bond vector , the rest-length of the bonds is , and is the bond stiffness. The bending energy is given by , where is the angle between two consecutive bond vectors and , and denotes the bending modulus. The non-planar nature of the space curve is described by the dihedral angle between two successive planes constituted of bond-vectors and involving three successive segments. The torsional energy of the chain is modeled by , where is the torsional modulus.
The self-avoidance and lateral attraction in the chain are modeled using an interaction potential between non-bonded monomers, with
| (1) |
A choice of makes the above potential purely repulsive, the Weeks-Chandler-Andersen (WCA) interaction. This choice can model a self-avoidance. In addition, attraction between filament segments can be incorporated by replacing the distance cutoff by the typical Lennard-Jones (LJ) choice so that monomers at a separation beyond the WCA cutoff attract each other via the LJ potential. The total energy cost is .
We model the treadmilling activity in terms of a tangential active force that acts along each bond. Here denotes a force per unit length [58]. This leads to a total self-propulsion force . We use the dimensionless Péclet number,
| (2) |
to characterize the local activity. Note that, for a chain of length , a related measure of activity that scales quadratically with the chain length has been used in recent studies of active polymers [58].
The Langevin dynamics of the chain are described by
| (3) |
where, with for and , . In the absence of active drive, the above equation obeys equilibrium fluctuation-dissipation with monomer diffusivity , and Gaussian random noise satisfying and . The length, energy, and time scales are set by , , and , where also describes the time scale for diffusion over . In these units, we choose and set , and in accordance with previous all-atom simulations that were in agreement with properties of wild-type FtsZ filaments [51]. Further, we choose , such that the ratio of the chain length to the persistence length of the polymer, , consistent with measured persistence lengths [19] (also see Appendix-A). The strength of the inter-segment attraction is tuned using the dimensionless control parameter . The Langevin dynamics simulations are performed using within the velocity-Verlet implementation in LAMMPS [59] with in-house modifications to incorporate the tangential activity.
IV Results
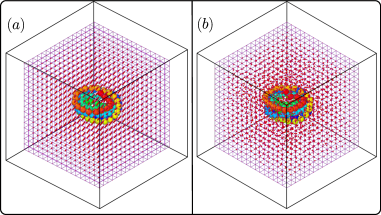
FtsZ filaments exhibit a variety of structural forms, including helices, rings, open filaments, and globules, as shown in Fig.1() and captured within our model, Fig.1(). In the absence of lateral attraction (WCA repulsion between segments) and activity, the model proposed above leads to a native state of equilibrium helical configurations [51]. This conformation can be seen in the top panel of Fig.1(). Such morphologies can relax to simple equilibrium open chains in the absence of helicity in two limits of (i) vanishing torsional rigidity or (ii) intrinsic curvature constraining polymeric fluctuations to an arbitrary plane. Examples of such conformations are shown in the bottom right panels in Fig.1(). As mentioned before, Fig.1() depicts the tangential activity implemented in our model.
On the other hand, large lateral attraction collapses the equilibrium filament into a compact globule. As mentioned before, the attraction between polymer segments is incorporated within our model by the full Lennard-Jones potential. This is similar to the well-known coil-globule transition [60]. However, the globule, in this case, comprises a compact arrangement of non-coplanar rings lying in different orientations. In contrast, at an intermediate lateral attraction, the open helix first transitions into a ring. In the presence of activity, the ring rotates in a chiral fashion to form spinning chiral rings (SCR). These dynamics distinguish them from the equilibrium rings and, as we show later, produce active contractile stress. As depicted in Fig. 1() and Supplemental Movie 1, the active helical chain at and transitions from an open helix conformation to SCR through a spooling-like mechanism capturing experimental findings, also observed before by one of us in Ref. [19].
IV.1 Equilibrium helix to ring and globule
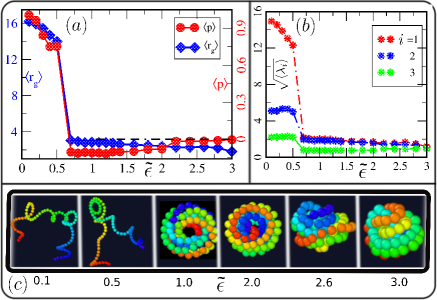
With increasing inter-segment attraction , the open helix state of the polymer first undergoes a transition to a ring. At further higher attraction, the single ring further collapses into a globule consisting of multiple internal ring-like conformations of different orientations; see Fig.2. The transitions are quantified utilizing the radius of gyration tensor [60, 61, 62, 63]
| (4) |
for a chain of beads with denoting the -th component of the position vector of -th bead. With denoting the three eigenvalues of , the principal radii of gyration, and using
| (5) |
we can estimate the mean polymer size as , and use the prolateness
| (6) |
to obtain the mean prolateness averaging over all steady-state configurations. A related positive quantity, asphericity, which vanishes for a spherically symmetric shape, is utilized later in this paper. The mean prolateness is bounded above and below: , with positive (negative) values of denoting prolate (oblate) shapes, and for isotropic conformations.
The polymer size shows a sharp drop across the transition of an open helix to an equilibrium ring at ; see Fig.2(). At higher , the size keeps on decreasing, although ever so little. This decrease in size is associated with another structural ‘transition’, from ring to compact globule. This transition is further quantified in terms of the prolateness , which grows from negative values ( at ) for the ring to vanish for the spherically symmetric globule. Note that, here, the ring state cannot be a two-dimensional object but must have a height due to the width of the filament and self-avoidance. Thus, the ring state has approximately the shape of a short pillbox with diameter and height . Within this approximation, one gets
| (7) |
linearizing for small parameter . Thus, in the limit of vanishing height with respect to the ring size, , one expects . The numerical simulation results in Fig.2() show the actual value at the transition point remains above this estimate, suggesting a non-zero , an estimate that agrees approximately with at shown in Fig.2(). With increasing beyond this transition point, increases as the ring transitions towards a globule to vanish at , identifying the spherical symmetry of the final globule state.
These transitions can be directly read off from the variation of s in Fig.2(). In the open helix state, all the eigenvalues are different from each other. At the formation of the spiral, two larger eigenvalues corresponding to the diameter of the ring become equal, , while the height of this pillbox-shape remains smaller. With increasing , shrinks, and the increases to become equal at the formation of spherical globule at . Note that the transformation of the ring state to the globule is gradual and does not show any signature of phase transition. As we show in the later section, the presence of treadmilling activity can transform a globule into a ring, thereby potentially stabilizing rings in the biological context.
IV.2 Role of treadmilling activity
The shape of the equilibrium ring formed at remains intact over a wide range of treadmilling activity . Before opening up, the ring shows chiral rotation, characterizing the non-equilibrium SCR state. However, for higher that stabilize globular structures at equilibrium, activity helps to unwind the globule to form rotating rings, thereby stabilizing SCR. At even higher , the rings do unfold into open helices. For example, at , the ring opens up into a helix above .
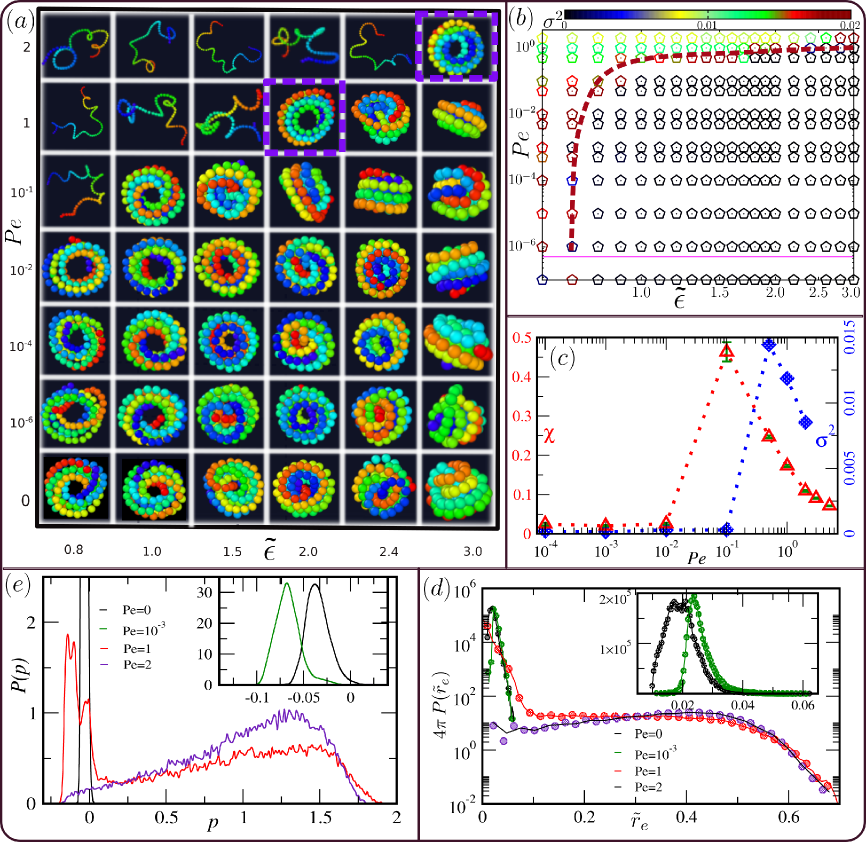
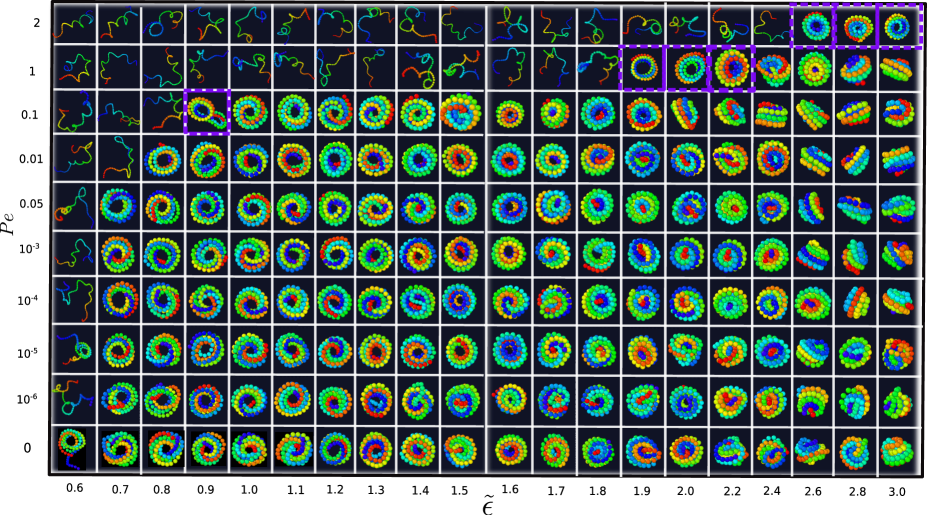
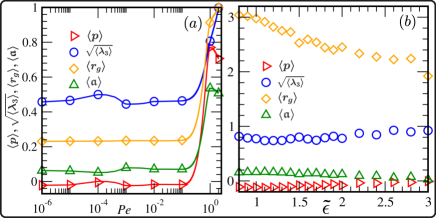
We present a comprehensive phase diagram in Fig. 3 and () as a function of treadmilling activity and lateral attraction strength . Fig. 3 illustrates representative conformations of the chain at different parameter values. This plot shows representative conformations at where the equilibrium chain is already in a ring or globule state. For a similar but more detailed phase diagram, see Appendix- B. At any given , the ring destabilizes at high enough to form an open helix. At small to intermediate , the figure suggests that the ring state remains stable over a broad range of . However, at high enough (e.g., at ), the equilibrium chain is in a globule state. With increasing , the globule first transitions to SCR before undergoing a transition to open helix at high enough () as shown in Fig. 4
In Fig. 3 (b), we present a quantitative version of the phase diagram using fluctuations in the chain’s end-to-end separation. The color bar indicates the amount of fluctuations in the scaled end-to-end separation , where is the chain length. Near the transition from ring to open helix denoted by the dashed red line in Fig. 3(b), reaches a maximum. Fig. 3(c) shows the variation of as a function of for a fixed (blue colored points and ordinate label) with the maximum at , the transition point. It sharply diminishes away from this transition point.
This figure also shows the linear response of the polymer extension under external force (see Appendix-C and Fig.9). It varies non-monotonically with and shows a maximum that precedes the maximum in , e.g., at for . The maximum is attributable to the instability of the ring structure near the transition, where even a small amount of extensile force is sufficient to destabilize the ring and open it.
In Fig. 3 and , we present the probability distributions and prolateness respectively, at various keeping fixed. The distribution functions are normalized to . At and , where the ring phase is stable, the distribution shows a single peak near ; see Fig. 3 and its inset. The compact structure at equilibrium swells under activity to become more ring-like. Near the transition point, , the chain shows bimodality in , indicating the coexistence of open helix (maximum near ) and compact ring (maximum near ). At higher , the distribution becomes unimodal with a maximum around for , corresponding to the open helix. The broad distribution characterizes large deviations around this maximum, allowing the chain to visit other conformations.
The distribution of prolateness remains unimodal at and (Fig. 3 and inset). The location of the maximum shifts towards smaller values at , with respect to equilibrium. This is due to the reorganization to a better ring via the non-equilibrium swelling. At , the multimodal distribution function displays the coexistence of ring, globule, and open helix, captured by the peaks at , , and , respectively. Moreover, at this Péclet, the distribution shows a second maximum with split peaks at . The first one near corresponds to the stable ring phase. The second one at corresponds to a more swollen ring that is formed on the way of opening up from the ring state to the open helical conformation. The reduction of with swelling can be understood using larger in Eq.(7). At a higher activity, , as the chain opens up, the distribution becomes unimodal again with one maximum near .
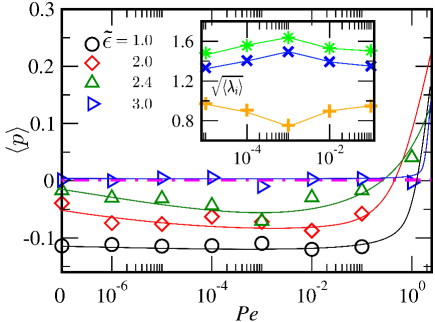
The variation of mean prolateness with corresponding to different is shown in Fig.4. The equilibrium ring state at remains relatively unaltered up to , where the ring transitions into an open helix. On the other hand, increases with at to vanish at large , as the equilibrium ring gets into globule-like shape; see Fig.2 as well. With increasing , the equilibrium globules at and become ring-like, showing a decrease in reaching a negative minimum at an intermediate value of () before increasing with activity as the rings open up. This suggests that treadmilling activity can regulate the formation of FtsZ rings. This feature is further characterized using the three principal radii of gyration with , for shown in the inset of Fig.4. At , and becomes largest as the ring widens and associated with this gets to the smallest value signifying the maximal thinning of the ring.
The change in mean size and shape of the active chiral chain can further be analyzed in terms of the mean radius of gyration, asphericity, and prolateness. For example, see Appendix-D and Fig.10.
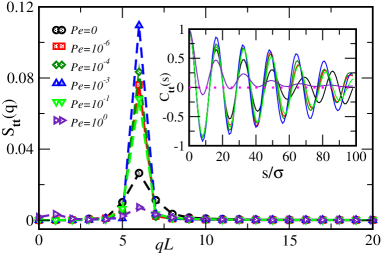
The number of turns in the SCR does not change before it opens up; however, the robustness of the ring state varies non-monotonically. This is established using the tangent-tangent correlation function along the chain contour, and its Fourier transforms ; see Fig.5. The correlation function shows periodic variation with the periodicity captured by the pronounced maximum in with the location of the maximum near denoting the number of turns . Fig.5 shows the maximum is at . As we see, this position of maximum does not change with ; however, the height of at the maximum varies non-monotonically. The initial increase with characterizes the formation of a more stable ring. The subsequent decrease of this peak height at even larger signifies the destabilization of the ring.
IV.2.1 Dynamics near the SCR-open helix phase boundary
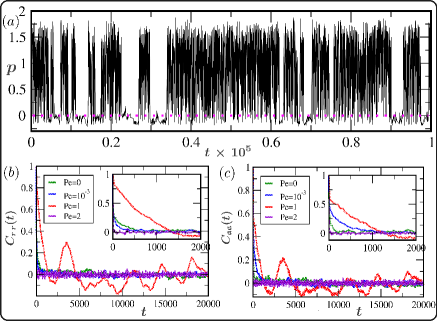
The dynamics of the chain near the spiral to open helix transition can be analyzed using the time series of the principal radii of gyration with and the prolateness ; see Fig. 6. The time series in Fig. 6() shows signatures of a coexisting compact ring (denoted by ), swelled ring (), globule (), and open helix (). The globule is characterized by and . The data at shows approximate agreement with this expectation. In the ring state, is significantly larger than and with both R1 and R2 rings having negative . For OH, and (also see Fig.11 in Appendix-E).
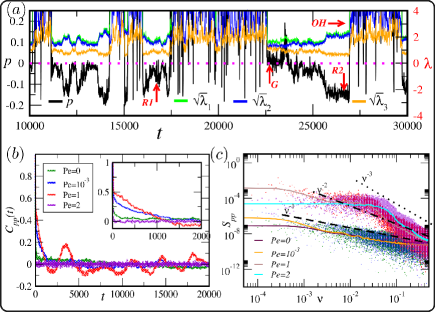
These dynamics can be further characterized in terms of two-time correlations and the corresponding power spectral density. Fig. 6() shows the correlation function with . The corresponding power spectrum is obtained by Fourier transforming the correlation function and is plotted in Fig. 6(). We used TISEAN [64] to compute the correlation and power spectrum. The apparent oscillations in at correspond to the phase coexistence. The absence of any characteristic maximum in frequency in the power spectrum characterizes the absence of any robust oscillation in the dynamics. The high frequency behavior of shows approximate power-law decay as with in the stable SCR phase ( and ), for near the transition, and for corresponding to open helix.
IV.2.2 Stress generation by the spinning chiral ring
Here, we present a direct measure of the active stress due to the spinning chiral ring (SCR). Recent advances led to derivations of swim pressure for active Brownian particles [65, 66, 67, 68]. Instead, we employ an embedding environment to calculate the stress due to the active chain.
We consider a harmonic cubic lattice of size with fixed boundaries to embed the SCR. The lattice spacing is chosen to be and such that the box size is significantly larger than the diameter of the SCR so that the distortions do not reach the boundaries. The monomers of the chain are assumed to be bonded with lattice points within the cutoff distance . To avoid introducing new parameters, we choose these bond strengths and that of the harmonic lattice to be , the same as in the active polymer.
We calculate the excess stress on the cubic lattice due to the active chiral chain
| (8) |
where denotes the number of lattice points bonded with the chain, and is the corresponding volume occupied by them. Here, stands for the -th component of the force acting on the lattice point due to the chain.
The stress tensor is fully characterized by its three irreducible parts, the excess pressure , shear , and rotation . They are expressed as
| (9) |
where is the embedding dimension. The Einstein summation convention is assumed above. The pressure is a scalar, is a traceless symmetric matrix, and is a purely antisymmetric matrix. In our study . Thus, in 3d, shear has five independent components, and rotation has three.
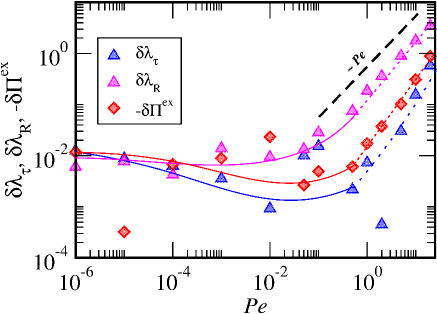
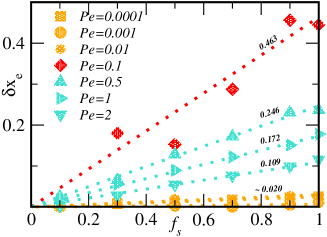
In Fig. 7, we show the dependence of the , the magnitude of the largest eigenvalues of and the largest eigenvalue of as a function of activity. We show the deviations of these quantities from equilibrium values (at ) with increasing . The deviation in excess pressure is negative, showing that the activity of the chain generates contractility, as expected from experimental observations. The deviations in shear and rotation show similar dependence on activity; see Fig. 7. For activity higher than , at which the SCR is unstable towards the open helix, all the above measures show a linear increase with .
V Conclusions
Our study addresses the pivotal question of how treadmilling and lateral attraction contribute to the formation of the FtsZ filament’s ring structure during cell division. Using a coarse-grained theoretical model that treats FtsZ filaments as tangentially active chiral semiflexible polymers, we accurately reproduced various morphological phases observed experimentally, including rings, helices, filaments, and globules. While lateral attraction stabilizes the ring structure, it fails to induce the observed net rotation without treadmilling activity. We presented a detailed phase diagram exploring ring stability as a function of activity and attraction, revealing a stable ring state over a broad range of treadmilling activity before transitioning into an open helix through phase coexistence, indicative of a first-order phase transition. In fact, treadmilling flattens and widens otherwise globule states to stabilize SCR and generates contractile stresses in their surroundings. The transition from the stable ring state to the open helix state is marked by increased size fluctuations and extensile response. While our model treats FtsZ as an assembled polymer, we recognize that the Z-ring’s structure is more intricate. It forms from multiple shorter treadmilling filaments near a curved membrane surface, merging to create the Z-ring. Models that capture this initial assembly, incorporating treadmilling rates, and account for filament ordering on a curved membrane could offer further insights into bacterial cytokinetic ring formation. Our findings, nonetheless, enhance the understanding of FtsZ ring dynamics and provide a basis for further study into bacterial cytokinesis regulation and the evolutionary link between FtsZ protofilaments and microtubule structures.
VI Acknowledgement
The numerical simulations were performed using SAMKHYA, the High-Performance Computing Facility provided by the Institute of Physics, Bhubaneswar. Image credits: Authors acknowledge Ajay Kumar Sharma and Sakshi Mahesh Poddar for FtsZ images and Mirza Salim Beg at the Center for Interdisciplinary Sciences at NISER, Jatni. We thank Amir Shee and Subhashree S Khuntia for the FtsZ persistence length analysis. DC acknowledges a research grant from the Department of Atomic Energy (DAE), India (1603/2/2020/IoP/R&D-II/150288) and thanks the International Centre for Theoretical Sciences (ICTS-TIFR), Bangalore, for an Associateship. RS acknowledges funding support from NISER, DAE.
Appendix A Persistence length of open chains
We used movies of the FtsZ mutant EcFtsZ Q47KD86K that remains in open chain conformation to extract effective persistence length by evaluating tangent-tangent correlation and fitting with over shorter length scales. We used FIJI to extract the chain conformation on which we performed the analysis. The correlation over longer separations is known to deviate from exponential to power-law decay due to, e.g., self-avoidance.
| data sets | ||||
|---|---|---|---|---|
| 1 | 250 | 63.39 | 3.93% | 3.94 |
| 2 | 290 | 60.84 | 2.57% | 4.76 |
| 3 | 376 | 65.26 | 2.42% | 5.76 |
Appendix B Configurational phase diagram
The main text presents a configurational phase diagram for a few selected parameter values in the plane. In Fig. 8, we show a full conformational phase diagram over a wider range of parameter values.
Appendix C Extensile response
In Fig. 9, we show the change in the end-to-end distance along the -direction with respect to the steady state distance () as a function of the applied stretching force at different and fixed . For all values, scale linearly with small as shown with the dotted lines in Fig. 9. The linear fits are used to calculate the extensile linear response used in the main text. Note that because of self-avoidance, compression of the rings that already have a compact structure is strongly resisted, and the slope of the response sharply changes for negative .
Appendix D Size and shape of the polymer chain
As shown in the main text, the size and shape of a polymer can be quantified using the eigenvalues of the radius of gyration tensor, specifically using the radius of gyration (Eq. 5) and prolateness (Eq. 6). In addition, here we use the asphericity of a configuration, given by
| (10) |
where . The mean asphericity is obtained by averaging over steady-state configurations. For a perfect isotropy and . The asphericity is bounded above and below .
In Fig. 10, we show the variation of all these parameters as activity increases at . For a wide range of activities ( ) rings are stable with , , remaining unchanged. Note that is a measure of ring thickness in the SCR phase. This also remains unchanged up to . At high enough activity, , intersegment attraction gets overpowered by activity to break contacts between the monomers and destabilize the ring to open a helix state. Examples of the equilibrium ring and active rotating SCR are shown in Supplemental Movie 2. In Fig. 10, we show the variation of the same size and shape parameters as a function of at a fixed . Increasing shrinks the size . A clear crossover from ring to globule is captured by the vanishing of and .
Appendix E Dynamics: Time-series and correlation
Here, we show a long-time series of prolateness near a transition point and . The value of shows large excursions between open helix (large positive ), globule , and ring states; see Fig.11(). The correlation functions for the radius of gyration and asphericity show similar features as that of shown in the main text. The apparent oscillations in the correlations at do not correspond to any specific oscillatory Fourier mode, as verified using the corresponding power spectra having features similar to shown in the main text.
Appendix F Distortion of embedding matrix
References
- Bi and Lutkenhaus [1991] E. Bi and J. Lutkenhaus, Ftsz ring structure associated with division in escherichia coli, Nature 354, 161 (1991).
- Adams and Errington [2009] D. W. Adams and J. Errington, Bacterial cell division: assembly, maintenance and disassembly of the z ring, Nat. Rev. Microbiol 7, 642 (2009).
- Erickson et al. [2010] H. P. Erickson, D. E. Anderson, and M. Osawa, Ftsz in bacterial cytokinesis: Cytoskeleton and force generator all in one, Microbiology and Molecular Biology Reviews 74, 504 (2010) .
- Lutkenhaus et al. [1980] J. F. Lutkenhaus, H. Wolf-Watz, and W. D. Donachie, Organization of genes in the ftsa-enva region of the escherichia coli genetic map and identification of a new fts locus (ftsz), J Bacteriol. 142, 615 (1980).
- Haeusser and Margolin [2016] D. P. Haeusser and W. Margolin, Splitsville: structural and functional insights into the dynamic bacterial z ring, Nat. Rev. Microbiol. 14, 305 (2016).
- Ortiz et al. [2015] C. Ortiz, P. Natale, L. Cueto, and M. Vicente, The keepers of the ring: regulators of ftsz assembly, FEMS microbiology reviews 40, 57 (2015).
- Vicente et al. [2006] M. Vicente, A. I. Rico, and J. MartÃnez-Arteaga, RocÃo an d Mingorance, Septum enlightenment: assembly of bacterial division proteins, J Bacteriol. 188, 19 (2006).
- Nanninga [1991] N. Nanninga, Cell division and peptidoglycan assembly in escherchia coli, Mol Microbiol 5, 791â (1991).
- Osawa et al. [2008] M. Osawa, D. E. Anderson, and H. P. Erickson, Reconstitution of Contractile FtsZ Rings in Liposomes, Science (80-. ). 320, 792 (2008).
- Boer et al. [1992] P. d. Boer, R. Crossley, and L. Rothfield, The essential bacterial cell-division protein FtsZ is a GTPase, Nature 359, 254 (1992).
- RayChaudhuri and Park [1992] D. RayChaudhuri and J. T. Park, Escherichia coli cell-division gene ftsZ encodes a novel GTP-binding protein, Nature 359, 251 (1992).
- Mukherjee and Lutkenhaus [1994] A. Mukherjee and J. Lutkenhaus, Guanine nucleotide-dependent assembly of FtsZ into filaments, Journal of Bacteriology 176, 2754 (1994).
- Löwe and Amos [1998] J. Löwe and L. A. Amos, Crystal structure of the bacterial cell-division protein FtsZ, Nature 391, 203 (1998).
- Nogales et al. [1998] E. Nogales, K. H. Downing, L. A. Amos, and J. Löwe, Tubulin and FtsZ form a distinct family of GTPases, Nature Structural Biology 5, 451 (1998).
- Wagstaff et al. [2017] J. M. Wagstaff, M. Tsim, M. A. Oliva, A. GarcÃa-Sanchez, D. Kureisaite-Ciziene, J. M. Andreu, and J. Löwe, A Polymerization-Associated Structural Switch in FtsZ That Enables Treadmilling of Model Filaments., mBio 8, e00254 (2017).
- Du et al. [2018] S. Du, S. Pichoff, K. Kruse, and J. Lutkenhaus, FtsZ filaments have the opposite kinetic polarity of microtubules, Proceedings of the National Academy of Sciences 115, 10768 (2018).
- Anderson et al. [2004] D. Anderson, F. J. Gueiros-Filho, and H. P. Erickson, Assembly dynamics of ftsz rings in bacillus subtilis and escherichia coli and effects of ftsz-regulating proteins, J. Bacteriol. 186, 5775â5781 (2004).
- Adams et al. [2011] D. W. Adams, L. J. Wu, L. G. Czaplewski, and J. Errington, Multiple effects of benzamide antibiotics on FtsZ function, Molecular Microbiology 80, 68 (2011).
- Srinivasan et al. [2008] R. Srinivasan, M. Mishra, L. Wu, Z. Yin, and M. K. Balasubramanian, Genes Dev. 22, 1741 (2008).
- Ramirez-Diaz et al. [2018a] D. A. Ramirez-Diaz, D. A. GarcÃa-Soriano, A. Raso, J. Mücksch, M. Feingold, G. Rivas, and P. Schwille, Treadmilling analysis reveals new insights into dynamic FtsZ ring architecture., PLoS Biology 16, e2004845 (2018a).
- Yang et al. [2017] X. Yang, Z. Lyu, A. Miguel, R. McQuillen, K. C. Huang, and J. Xiao, GTPase activity-coupled treadmilling of the bacterial tubulin FtsZ organizes septal cell wall synthesis., Science 355, 744 (2017).
- McCausland et al. [2021] J. W. McCausland, X. Yang, G. R. Squyres, Z. Lyu, K. E. Bruce, M. M. Lamanna, B. Söderström, E. C. Garner, M. E. Winkler, J. Xiao, and J. Liu, Treadmilling FtsZ polymers drive the directional movement of sPG-synthesis enzymes via a Brownian ratchet mechanism, Nature Communications 12, 609 (2021).
- Ben-Yehuda and Losick [2002] S. Ben-Yehuda and R. Losick, Asymmetric cell division in b. subtilis involves a spiral-like intermediate of the cytokinetic protein ftsz, Cell 109, 257 (2002).
- Thanedar and Margolin [2004] S. Thanedar and W. Margolin, Ftsz exhibits rapid movement and oscillation waves in helix-like patterns in escherichia coli, Curr Biol. 14, 1167 (2004).
- Fu et al. [2010] G. Fu, T. Huang, J. Buss, C. Coltharp, Z. Hensel, and J. Xiao, In Vivo Structure of the E. coli FtsZ-ring Revealed by Photoactivated Localization Microscopy (PALM), PLoS ONE 5, e12680 (2010).
- Monahan et al. [2009] L. G. Monahan, A. Robinson, and E. J. Harry, Lateral FtsZ association and the assembly of the cytokinetic Z ring in bacteria, Molecular Microbiology 74, 1004 (2009).
- Hale and Boer [1997] C. A. Hale and P. A. d. Boer, Direct Binding of FtsZ to ZipA, an Essential Component of the Septal Ring Structure That Mediates Cell Division in E. coli, Cell 88, 175 (1997).
- Pichoff and Lutkenhaus [2002] S. Pichoff and J. Lutkenhaus, Unique and overlapping roles for ZipA and FtsA in septal ring assembly in Escherichia coli, The EMBO Journal 21, 685 (2002).
- Pichoff and Lutkenhaus [2005] S. Pichoff and J. Lutkenhaus, Tethering the Z ring to the membrane through a conserved membrane targeting sequence in FtsA, Molecular Microbiology 55, 1722 (2005).
- Weiss et al. [1999] D. S. Weiss, J. C. Chen, J. M. Ghigo, D. Boyd, and J. Beckwith, Localization of FtsI (PBP3) to the septal ring requires its membrane anchor, the Z ring, FtsA, FtsQ, and FtsL., Journal of Bacteriology 181, 508 (1999).
- Davis [2002] B. K. Davis, Molecular evolution before the origin of species, Progress in Biophysics and Molecular Biology 79, 77 (2002).
- Stricker et al. [2002] J. Stricker, P. Maddox, E. Salmon, and H. P. Erickson, Rapid assembly dynamics of the escherichia coli ftsz-ring demonstrated by fluorescence recovery after photobleaching, Proc. Natl. Acad. Sci. U. S. A. 99, 3171â3175 (2002).
- Romberg and Levin [2003] L. Romberg and P. A. Levin, Assembly dynamics of the bacterial cell division protein ftsz: poised at the edge of stability, Annu. Rev. Microbiol. 57, 125â154 (2003).
- Mahone and Goley [2020] C. R. Mahone and E. D. Goley, Bacterial cell division at a glance, J Cell Sci. 133, 7 (2020).
- Walker et al. [2020] B. E. Walker, J. Männik, and J. Männik, Transient membrane-linked ftsz assemblies precede z-ring formation in escherichia coli, Curr. Biol. 30, 499â508 (2020).
- Ghosh and Sain [2008] B. Ghosh and A. Sain, Origin of contractile force during cell division of bacteria, Phys. Rev. Lett. 101, 178101 (2008).
- Lu et al. [2000] C. Lu, M. Reedy, and H. P. Erickson, Straight and curved conformations of ftsz are regulated by gtp hydrolysis, J. Bacteriol. 182, 164â170 (2000).
- Allard and Cytrynbaum [2008] J. F. Allard and E. N. Cytrynbaum, Force generation by a dynamic z-ring in escherichia coli cell division, Proc. Natl. Acad. Sci. U. S. A. 106, 145â150 (2008).
- Erickson [2009] H. P. Erickson, Modeling the physics of ftsz assembly and force generation, Proc. Natl. Acad. Sci. U. S. A. 106, 9238â9243 (2009).
- Nguyen et al. [2021] L. T. Nguyen, C. M. Oikonomou, and G. J. Jensen, Simulations of proposed mechanisms of ftsz-driven cell constriction, Journal of Bacteriology 203, e00576 (2021).
- Mateos-Gil et al. [2019] P. Mateos-Gil, P. Tarazona, and M. Vélez, Bacterial cell division: modeling FtsZ assembly and force generation from single filament experimental data., FEMS Microbiology Reviews 43, 73 (2019).
- Corbin and Erickson [2020] L. C. Corbin and H. P. Erickson, A unified model for treadmilling and nucleation of single-stranded FtsZ protofilaments., Biophysical Journal 119, 792 (2020).
- Hörger et al. [2008] I. Hörger, E. Velasco, J. Mingorance, G. Rivas, P. Tarazona, and M. Vélez, Langevin computer simulations of bacterial protein filaments and the force-generating mechanism during cell division, Phys. Rev. E 77, 011902 (2008).
- Ramirez-Diaz et al. [2021] D. A. Ramirez-Diaz, A. Merino-Salomón, F. Meyer, M. Heymann, G. Rivas, M. Bramkamp, and P. Schwille, FtsZ induces membrane deformations via torsional stress upon GTP hydrolysis, Nature Communications 12, 3310 (2021).
- Chen et al. [2005] Y. Chen, K. Bjornson, S. D. Redick, and H. P. Erickson, A Rapid Fluorescence Assay for FtsZ Assembly Indicates Cooperative Assembly with a Dimer Nucleus, Biophysical Journal 88, 505 (2005).
- Bisson-Filho et al. [2017] A. W. Bisson-Filho, Y.-P. Hsu, G. R. Squyres, E. Kuru, F. Wu, C. Jukes, Y. Sun, C. Dekker, S. Holden, M. S. VanNieuwenhze, Y. V. Brun, and E. C. Garner, Treadmilling by FtsZ filaments drives peptidoglycan synthesis and bacterial cell division., Science 355, 739 (2017).
- Whitley et al. [2024] K. D. Whitley, J. Grimshaw, D. M. Roberts, E. Karinou, P. J. Stansfeld, and S. Holden, Peptidoglycan synthesis drives a single population of septal cell wall synthases during division in Bacillus subtilis, Nature Microbiology , 1 (2024).
- Schäper et al. [2024] S. Schäper, A. D. Brito, B. M. Saraiva, G. R. Squyres, M. J. Holmes, E. C. Garner, Z. Hensel, R. Henriques, and M. G. Pinho, Cell constriction requires processive septal peptidoglycan synthase movement independent of FtsZ treadmilling in Staphylococcus aureus, Nature Microbiology , 1 (2024).
- Whitley et al. [2021] K. D. Whitley, C. Jukes, N. Tregidgo, E. Cesbron, P. Almada, Y. Cesbron, R. Henriques, C. Dekker, and S. Holden, Ftsz treadmilling is essential for z-ring condensation and septal constriction initiation in bacillus subtilis cell division, Nat. Commun. 12, 2448 (2021).
- Popp et al. [2010] D. Popp, M. Iwasa, H. P. Erickson, A. Narita, M. Y., and R. Robinson, Suprastructures and dynamic properties of mycobacterium tuberculosis, J. Biol. Chem. 285, 11281â11289 (2010).
- González de Prado Salas et al. [2014] P. González de Prado Salas, I. Hörger, F. MartÃn-GarcÃa, J. Mendieta, Ã. Alonso, M. Encinar, P. Gómez-Puertas, M. Vélez, and P. Tarazona, Torsion and curvature of ftsz filaments, Soft Matter 10, 1977 (2014).
- Ramirez-Diaz et al. [2018b] D. A. Ramirez-Diaz, D. A. GarcÃa-Soriano, A. Raso, J. Mücksch, M. Feingold, G. Rivas, and P. Schwille, Treadmilling analysis reveals new insights into dynamic ftsz ring architecture, PLOS Biology 16, e2004845 (2018b).
- Rivas et al. [2000] G. Rivas, A. López, J. Mingorance, M. J. Ferrándiz, S. Zorrilla, A. P. Minton, M. Vicente, and J. M. Andreu, Magnesium-induced linear self-association of the ftsz bacterial cell division protein monomer: The primary steps for ftsz assembly, Journal of Biological Chemistry 275, 11740 (2000).
- Monterroso et al. [2023] B. Monterroso, M. Ã. Robles-Ramos, M. Sobrinos-Sanguino, J. R. Luque-Ortega, C. Alfonso, W. Margolin, G. Rivas, and S. Zorrilla, Bacterial division ring stabilizing zapa versus destabilizing slma modulate ftsz switching between biomolecular condensates and polymers, Open Biology 13, 220324 (2023).
- Sharma et al. [2023] A. K. Sharma, S. M. Poddar, J. Chakraborty, B. S. Nayak, S. Kalathil, N. Mitra, P. Gayathri, and R. Srinivasan, A mechanism of salt bridge-mediated resistance to FtsZ inhibitor PC190723 revealed by a cell-based screen., Molecular biology of the cell 34, ar16 (2023).
- Popp et al. [2009] D. Popp, M. Iwasa, A. Narita, H. P. Erickson, and Y. Maéda, FtsZ condensates: An in vitro electron microscopy study, Biopolymers 91, 340 (2009).
- Stukowski [2010] A. Stukowski, Visualization and analysis of atomistic simulation data with OVITO-the Open Visualization Tool, Modelling and Simulation in Materials Science and Engineering 18, 10.1088/0965-0393/18/1/015012 (2010).
- Isele-Holder et al. [2015] R. E. Isele-Holder, J. Elgeti, and G. Gompper, Self-propelled worm-like filaments: spontaneous spiral formation, structure, and dynamics, Soft Matter 11, 7181 (2015).
- Plimpton [1995] S. Plimpton, J. Comput. Phys. 117, 1â19 (1995).
- de Gennes [1979] P. G. de Gennes, Scaling Concepts in Polymer Physics (Cornell University Press, New York, 1979).
- Aronovitz and Nelson [1986] J. A. Aronovitz and D. R. Nelson, Universal features of polymer shapes, J.Phys. France 47, 1445 (1986).
- Cannon et al. [1991] J. W. Cannon, J. A. Aronovitz, and P. J. Goldbart, Equilibrium distribution of shapes for linear and star macromolecules, J. Phys. I France 1, 629 (1991).
- Dima and Thirumalai [2004] R. I. Dima and D. Thirumalai, Asymmetry in the shapes of folded and denatured states of proteins, J. Phys. Chem. B 108, 6564 (2004), arXiv:0310023 [q-bio] .
- Hegger et al. [1998] R. Hegger, H. Kantz, and T. Schreiber, Practical implementation of nonlinear time series methods: The tisean package, Chaos 9, 413 (1998).
- Takatori et al. [2014] S. C. Takatori, W. Yan, and J. F. Brady, Swim pressure: Stress generation in active matter, Phys. Rev. Lett. 113, 028103 (2014).
- Yang et al. [2014] X. Yang, M. L. Manning, and M. C. Marchetti, Aggregation and segregation of confined active particles, Soft Matter 10, 6477 (2014).
- Bialké et al. [2015] J. Bialké, J. T. Siebert, H. Löwen, and T. Speck, Negative interfacial tension in phase-separated active brownian particles, Phys. Rev. Lett. 115, 098301 (2015).
- Solon et al. [2015] A. P. Solon, J. Stenhammar, R. Wittkowski, M. Kardar, Y. Kafri, M. E. Cates, and J. Tailleur, Pressure and phase equilibria in interacting active brownian spheres, Phys. Rev. Lett. 114, 198301 (2015).