A Novel Fusion Architecture for PD Detection Using Semi-Supervised Speech Embeddings
Abstract.
We present a framework to recognize Parkinson’s disease (PD) through an English pangram utterance speech collected using a web application from diverse recording settings and environments, including participants’ homes. Our dataset includes a global cohort of participants, including diagnosed with PD. Leveraging the diversity of the dataset, spanning various demographic properties (such as age, sex, and ethnicity), we used deep learning embeddings derived from semi-supervised models such as Wav2Vec 2.0, WavLM, and ImageBind representing the speech dynamics associated with PD. Our novel fusion model for PD classification, which aligns different speech embeddings into a cohesive feature space, demonstrated superior performance over standard concatenation-based fusion models and other baselines (including models built on traditional acoustic features). In a randomized data split configuration, the model achieved an Area Under the Receiver Operating Characteristic Curve (AUROC) of and an accuracy of . Rigorous statistical analysis confirmed that our model performs equitably across various demographic subgroups in terms of sex, ethnicity, and age, and remains robust regardless of disease duration. Furthermore, our model, when tested on two entirely unseen test datasets collected from clinical settings and from a PD care center, maintained AUROC scores of and , respectively. This affirms the model’s robustness and it’s potential to enhance accessibility and health equity in real-world applications.
1. Introduction
The diagnosis of Parkinson’s Disease (PD) is traditionally reliant on the clinical assessments focused on the motor symptoms of the individuals (Goetz et al., 2008). Traditional methods, while effective, often miss the subtle early symptoms of the disease, leading to delayed interventions (Morel et al., 2022). The situation is further exacerbated by the limited accessibility to specialized neurological healthcare, particularly in regions with significantly lower ratios of neurologists to the population. Study conducted in Bangladesh in 2014 (Chowdhury et al., 2014) reported that they had only neurologists for a population of over million at that time. Kissani et al. (Kissani et al., 2022) reported a more severe scenario in African nations as they have one neurologist for every three million population, with 21 countries having less than five neurologists for their whole population. Projections suggest that by 2030, the prevalence of Parkinson’s Disease will have doubled compared to 2005 levels (Dorsey et al., 2007). This global disparity in healthcare access highlights an urgent need for scalable and accessible (preferably home-based) diagnostic methods.
Recent advancements have seen a shift towards integrating digital biomarkers to develop automated AI based at-home PD detection and progression tracking tools (Rahman et al., 2021; Dorsey et al., 2016; Dubey et al., 2015; Yang et al., 2022; Islam et al., 2023). Works has been proposed to use sensors to capture nocturnal breathing signals (Yang et al., 2022) and accelerometric data (Schalkamp et al., 2023) to detect PD. However, such tools require the PD care seeking individuals to wear devices/sensors on their body, which might not be convenient to everyone, especially the elderly ones (Wang et al., 2019; Forkan et al., 2019). Facial expressions, like smile, disgust, and surprise, have also been used to gather digital facial features and classify PD (Adnan et al., 2023). However, such facial expressions recorded in front the web camera upon an instruction are not natural and might miss the nuanced facial differences crucial in PD detection.
In contrast, digital biomarkers derived from non-invasive methods such as speech analysis are gaining traction. Unlike other digital approaches that may require the physical wearing of sensors or making posed expressions, speech analysis provides a straightforward, user-friendly means of detecting PD. Traditional speech analysis in PD are built on sustained phonation datasets and their acoustic features like Mel-frequency cepstral coefficients (MFCCs) and pitch variations, which have shown potential in identifying vocal impairments indicative of PD. (Little et al., 2007; Rahman et al., 2021; Saldanha et al., 2023; Hawi et al., 2022; Upadhya et al., 2017; Cantürk and Karabiber, 2016; Rusz et al., 2011; Liu et al., 2012). Studies utilizing these features have demonstrated potential in tracking the progression of the disease by detecting changes in speech patterns associated with PD.
However, the reliance on sustained phonation tasks — where patients produce a prolonged vowel sound — though useful, does not reflect the complexities of natural speech encountered in daily conversations. To counter that, studies have been proposed to use continuous speech to develop PD classifiers using varying technologies such as a deep convolutional neural network (CNN) based (Frid et al., 2016), a time-frequency analysis (Umapathy et al., 2005), or an SVM (Khan et al., 2014). However, the common limitation of these studies are their fixed recording devices and settings with small cohorts, ranging from 20 to 60 PD or control participants.
Although classical feature engineering are interpretable, it requires the researchers to manually prepare the handcrafted feature set. In recent times, semi-supervised learning in speech models, such as WavLM (Chen et al., 2022), Wav2Vec 2.0 (Baevski et al., 2020), and ImageBind (Girdhar et al., 2023), has gained considerable attention due to their utility in myriad of applications such as automatic speech recognition (ASR) (Baevski et al., 2020; Hsu et al., 2021) and speech diarization (Chen et al., 2022). These models are trained on diverse datasets that encompass a wide range of speech variations, enabling their embeddings to capture intricate speech dynamics, which might be crucial for identifying the complex patterns associated with the neurological effects of PD. Limited work has been done to explore semi-supervised acoustic models utility in PD classification. A recent study by Klempíř et al. (Klempíř et al., 2023) investigated the application of non-finetuned Wav2Vec embeddings for Parkinson’s Disease (PD) classification across different linguistic tasks, including syllable pronunciation, English speech, and Italian speech. While the study reported promising results for the Italian speech classification, the performance markedly decreased for the English and syllable datasets. Furthermore, the scope of the study was limited, involving only 60 participants, half of whom were diagnosed with PD. On the other hand, fusion after projection of one features set into another latent space has achieved significant attention in improving feature alignment, noise reduction, and dimensionality consistency (Lin et al., 2021; Veli et al., 2022; Wang et al., 2019), simplifying the architecture and enhancing cross-modal learning capacity (Lu et al., 2019; Chen et al., 2020; Li et al., 2019). Despite the significant advancements in speech processing and disease classification, the literature has yet to fully explored the potential of combining semi-supervised deep speech embeddings with projection-based fusion models for PD classification.
In this study, we addressed the limitation of smaller participating cohorts in free-flow speech analysis for PD classification by employing a large-scale dataset collected from participants ( PD diagnosed), where they recorded themselves while uttering the English pangram starts with “the quick brown fox”. We hypothesize that by leveraging deep embeddings from the above mentioned three distinct semi-supervised speech models, and fusing them after projecting different sets of features into a common space, our developed model can better recognize and synthesize the various speech characteristics influenced by PD, leading to improved diagnostic accuracy and robustness across different patient groups and recording conditions. To ensure generalizability of the developed model, we collected the data from varied recording settings such as home environments, a clinic, and a PD care center from a participating cohort diverse in demographic properties. Notably, Using our method, participants from anywhere in the world can record their speech on a web-based framework and get a PD screening. Since a significant portion of our data are home recorded using diverse recording devices, it enables us to deploy the model at home environments to increased accessibility and minimize any unnecessary clinical visits. Figure 1 depicts our PD classification pipeline, which takes the raw videos with the speech as input and classify it as PD or not.

2. Results
2.1. Dataset
We collected our dataset from participants, comprising of them diagnosed with Parkinson’s disease (PD) and without the condition. We used PARK111https://parktest.net/ (Langevin et al., 2019), a web-based framework for data collection purpose. Using the framework, each participant recorded themselves in front of the web camera while reciting the “quick brown fox” English pangram222Full pangram: The quick brown fox jumps over the lazy dog. The dog wakes up and follows the fox into the forest, but again the quick brown fox jumps over the lazy dog.. Notably, we gathered the data at three distinct recording environments – Home Recorded, Clinical Setup, and PD Care Facility – each varying in terms of ambient noise and data collection setting and/or equipment. At the Clinical Setup, and PD Care Facility, some participants provided data samples for multiple times and we ended up having video clips having audio of “Quick Brown Fox” pangram utterance. The demographic information of the participating cohort is detailed in Table 1. Note that the PD labels of the participants from Clinical Setup and PD Care Facility cohorts are clinically validated. On the other hand, the labels of Home Recorded data are self-reported.
| Demographic Properties | With PD | Without PD | Total | |
|---|---|---|---|---|
| Number of Participants, n (%) | 392 (30.0%) | 914 (70.0%) | 1306 (100.0%) | |
| Sex, n (%) | ||||
| Female | 171 (43.6%) | 524 (57.3 %) | 695 (53.2%) | |
| Male | 218 (55.6%) | 390 (42.7 %) | 608 (46.6%) | |
| Nonbinary | 1 (0.3%) | 0 (0 %) | 1 (0.1%) | |
| Unknown | 2 (0.5%) | 0 (0 %) | 2 (0.2%) | |
| Age in years (range: 16.0–93.0, mean: 62.23), n (%) | ||||
| Below 20 | 0 (0.0%) | 8 (0.9%) | 8 (0.61%) | |
| 20–29 | 2 (0.5%) | 41 (4.5%) | 43 (3.29%) | |
| 30–39 | 3 (0.8%) | 24 (2.6%) | 27 (2.07%) | |
| 40–49 | 9 (2.3%) | 20 (2.2%) | 29 (2.22%) | |
| 50–59 | 40 (10.2%) | 160 (17.5%) | 200 (15.31%) | |
| 60–69 | 122 (31.1%) | 349 (38.2%) | 471 (36.06%) | |
| 70–79 | 142 (36.2%) | 107 (11.7%) | 249 (19.07%) | |
| 80 and above | 23 (5.9%) | 7 (0.8%) | 30 (2.3%) | |
| Unknown | 51 (13.0%) | 198 (21.7%) | 249 (19.07%) | |
| Ethnicity, n (%) | ||||
| White | 223 (56.9%) | 638 (69.8%) | 861 (65.9%) | |
| Black or African American | 6 (1.5%) | 42 (4.6%) | 48 (3.7%) | |
| American Indian or Alaska Native | 1 (0.3%) | 4 (0.4%) | 5 (0.4%) | |
| Asian | 4 (1.0%) | 55 (6.0%) | 59 (4.5%) | |
| Others | 2 (0.5%) | 5 (0.5%) | 7 (0.5%) | |
| Unknown | 156 (39.8%) | 170 (18.6%) | 326 (25.0%) | |
| Recording Environment, n (%) | ||||
| Home Recorded | 67 (17.1%) | 585 (64.0%) | 652 (49.9%) | |
| Clinical Setup | 117 (29.8%) | 235 (25.7%) | 352 (27.0%) | |
| PD Care Center | 185 (47.2%) | 85 (9.3%) | 270 (20.7%) | |
| Cohort | # of Participants | # of PD | # of Female | # of Non-White | # of ¡ 50 | # of Clinical | # of PD Care |
|---|---|---|---|---|---|---|---|
| Training Set | 916 (70.1%) | 284 (31.0%) | 481 (52.5%) | 82 (9.0%) | 71 (7.8%) | 291 (31.8%) | 214 (23.4%) |
| Validation Set | 195 (14.9%) | 54 (27.7%) | 116 (59.5%) | 19 (9.7%) | 17 (8.7%) | 25 (12.8%) | 30 (15.4%) |
| Test Set | 195 (14.9%) | 54 (27.7%) | 98 (50.3%) | 18 (9.2%) | 19 (9.7%) | 36 (18.5%) | 26 (13.3%) |
| Cohort | # of Participants | # of PD | # of Female | # of Non-White | # of ¡ 50 |
|---|---|---|---|---|---|
| Training Set: Home Recorded and PD Care Facility | 771 (59.0%) | 225 (29.2%) | 432 (56.0%) | 94 (12.2%) | 77 (10.0%) |
| Validation Set: Home Recorded and PD Care Facility | 183 (14.0%) | 50 (27.3%) | 105 (57.4%) | 19 (10.4%) | 21 (11.5%) |
| Test Set: Clinical Setup | 352 (27.0%) | 117 (33.2%) | 158 (44.9%) | 3 (0.9%) | 9 (2.6%) |
| Training Set: Home Recorded and Clinical Setupp | 837 (64.1%) | 171 (20.4%) | 448 (53.5%) | 83 (9.9%) | 67 (8.0%) |
| Validation Set: Home Recorded and Clinical Setup | 199 (15.2%) | 36 (18.1%) | 106 (53.3%) | 20 (10.1%) | 15 (7.5%) |
| Test Set: PD Care Facility | 270 (20.7%) | 185 (68.5%) | 141 (52.2%) | 13 (4.8%) | 25 (9.3%) |
2.2. Feature Extraction
In this study, we aim to objectively and quantitatively capture the nuanced speech dynamics that are crucial for differentiating characteristics of Parkinson’s Disease (PD). While classical acoustic features have been effective in PD classification according to the literature, our research primarily focuses on leveraging deep learning embeddings from speech of pangram utterance. We employed three state-of-the-art semi-supervised speech models: Wav2Vec 2.0 (Baevski et al., 2020), WavLM (Chen et al., 2022), and ImageBind (Girdhar et al., 2023). These models provided us with intermediate vector representations extracted directly from their last hidden layers, capturing sophisticated and informative features of the speech data.
To assess the efficacy of these deep embedding features relative to traditional acoustic features, we also extracted classical features using the methodology proposed by Rahman et al. (Rahman et al., 2021). We prepared four distinct feature sets for our audio datasets: –dimensional acoustic features, –dimensional Wav2Vec2 features, –dimensional WavLM features, and –dimensional ImageBind Features. Using these feature sets, we trained various deep learning models to distinguish between individuals with and without PD, exploring how different types of features contribute to the model’s performance.
2.3. Performance Evaluation on Standard Train-Validation-Test Split
We combined all four cohorts and divided the dataset into three random splits: for training, for validation, and for testing. The validation set was used to select the best-performing model, which was subsequently tested on the test set. Each subset is fairly balanced in terms of different demographic subgroups, ensuring the robustness of our model evaluation. Table 2(a) details the data split and outlines the demographic distribution across the train, validation, and test sets.
Baseline Modeling
We developed baseline models using each of our four distinct feature sets as previously described. The model trained with WavLM features significantly outperformed all other baseline models, achieving an Area Under the Receiver Operating Characteristic Curve (AUROC) of and an accuracy of . This model surpassed the closest competing model trained with ImageBind features by a margin of in terms of AUROC. Although it demonstrated a comparatively lower sensitivity (), it performed substantially good performance in other metrics with a specificity of , a Positive Predictive Value (PPV) of , and the Negative Predictive Value (NPV) of . Notably, all three models trained with deep embedding features consistently outperformed the model’s performance achieved using the acoustic features in terms of predictive performance.
Fusion Modeling
To enhance model performance by leveraging the complementary strengths of different feature sets, we developed fusion models using two different approaches: concatenation and projection-based fusion.
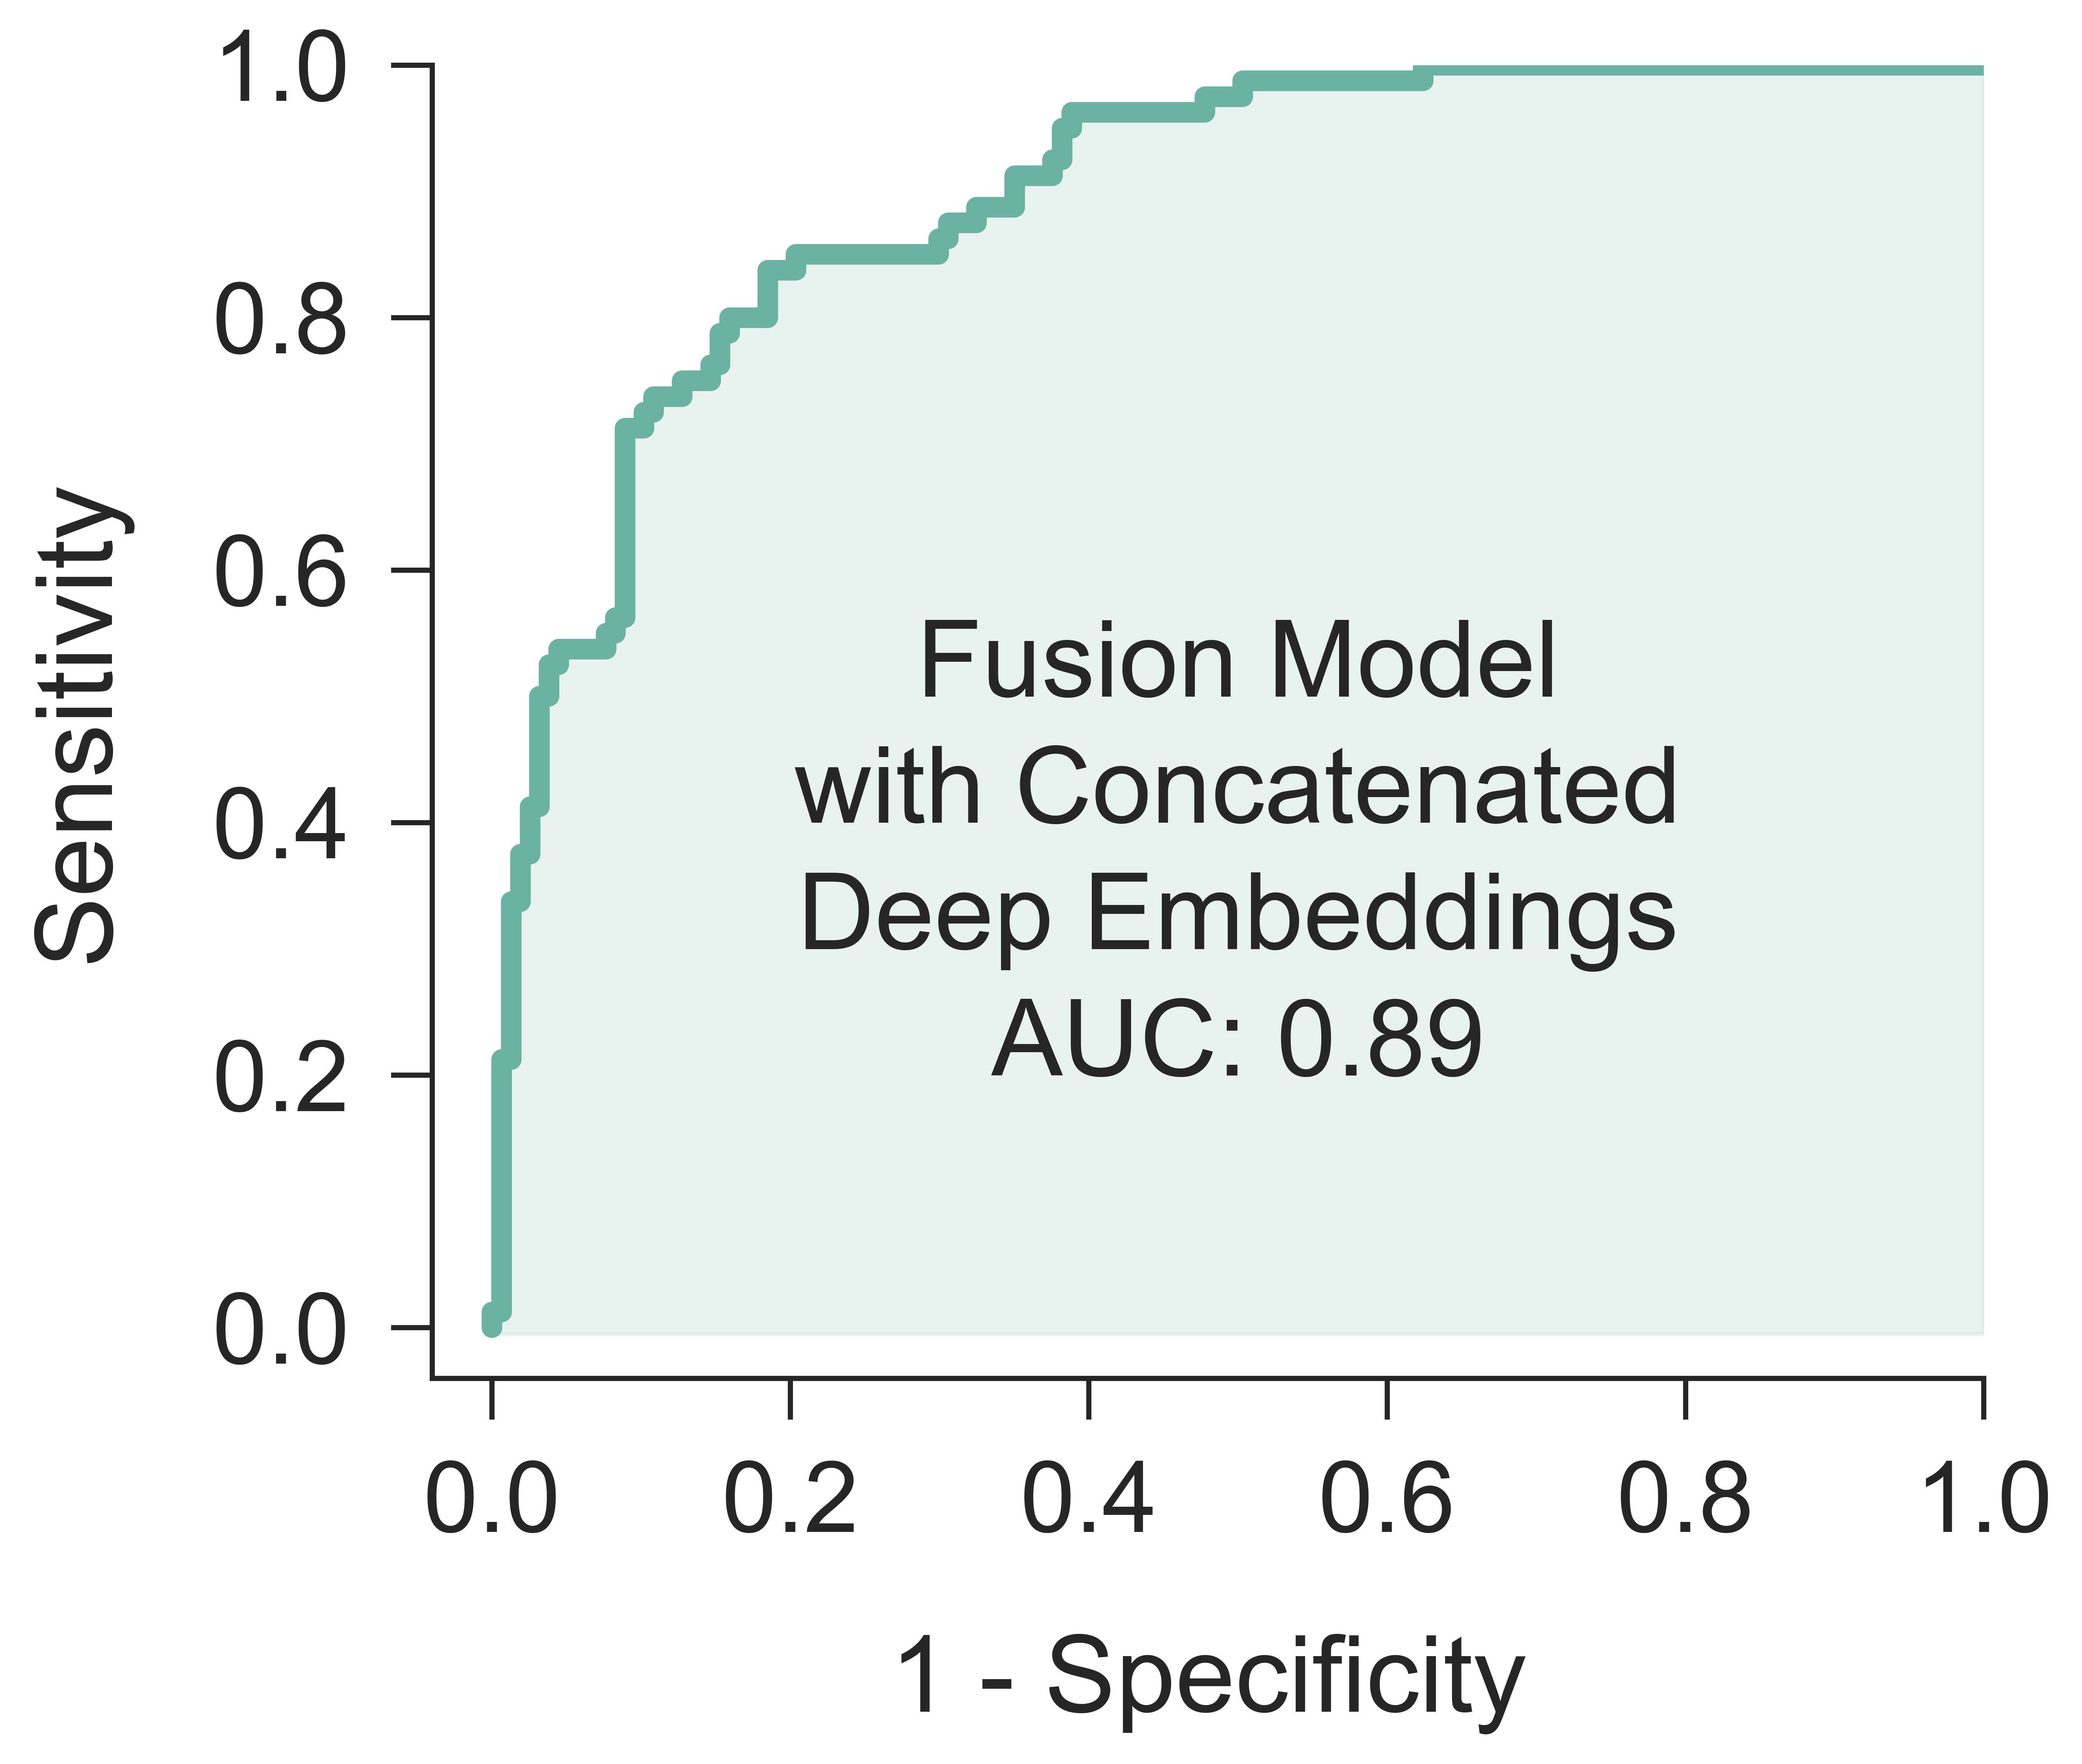
In the first approach, we concatenated four different feature sets in all possible combinations, resulting in 11 heterogeneous feature sets. We observed a consistent improvement in the evaluation metrics for all combinations involving WavLM features. The combination of all three deep embeddings (Wav2Vec2, WavLM, and ImageBind) performed best in these experimental settings, achieving an AUROC of and an accuracy of . Although this model demonstrated specificity () and PPV () slightly lower than the best baseline model ( and , respectively), it provided a significant improvement in sensitivity (75% versus 56.25%) and a higher NPV ( over ).
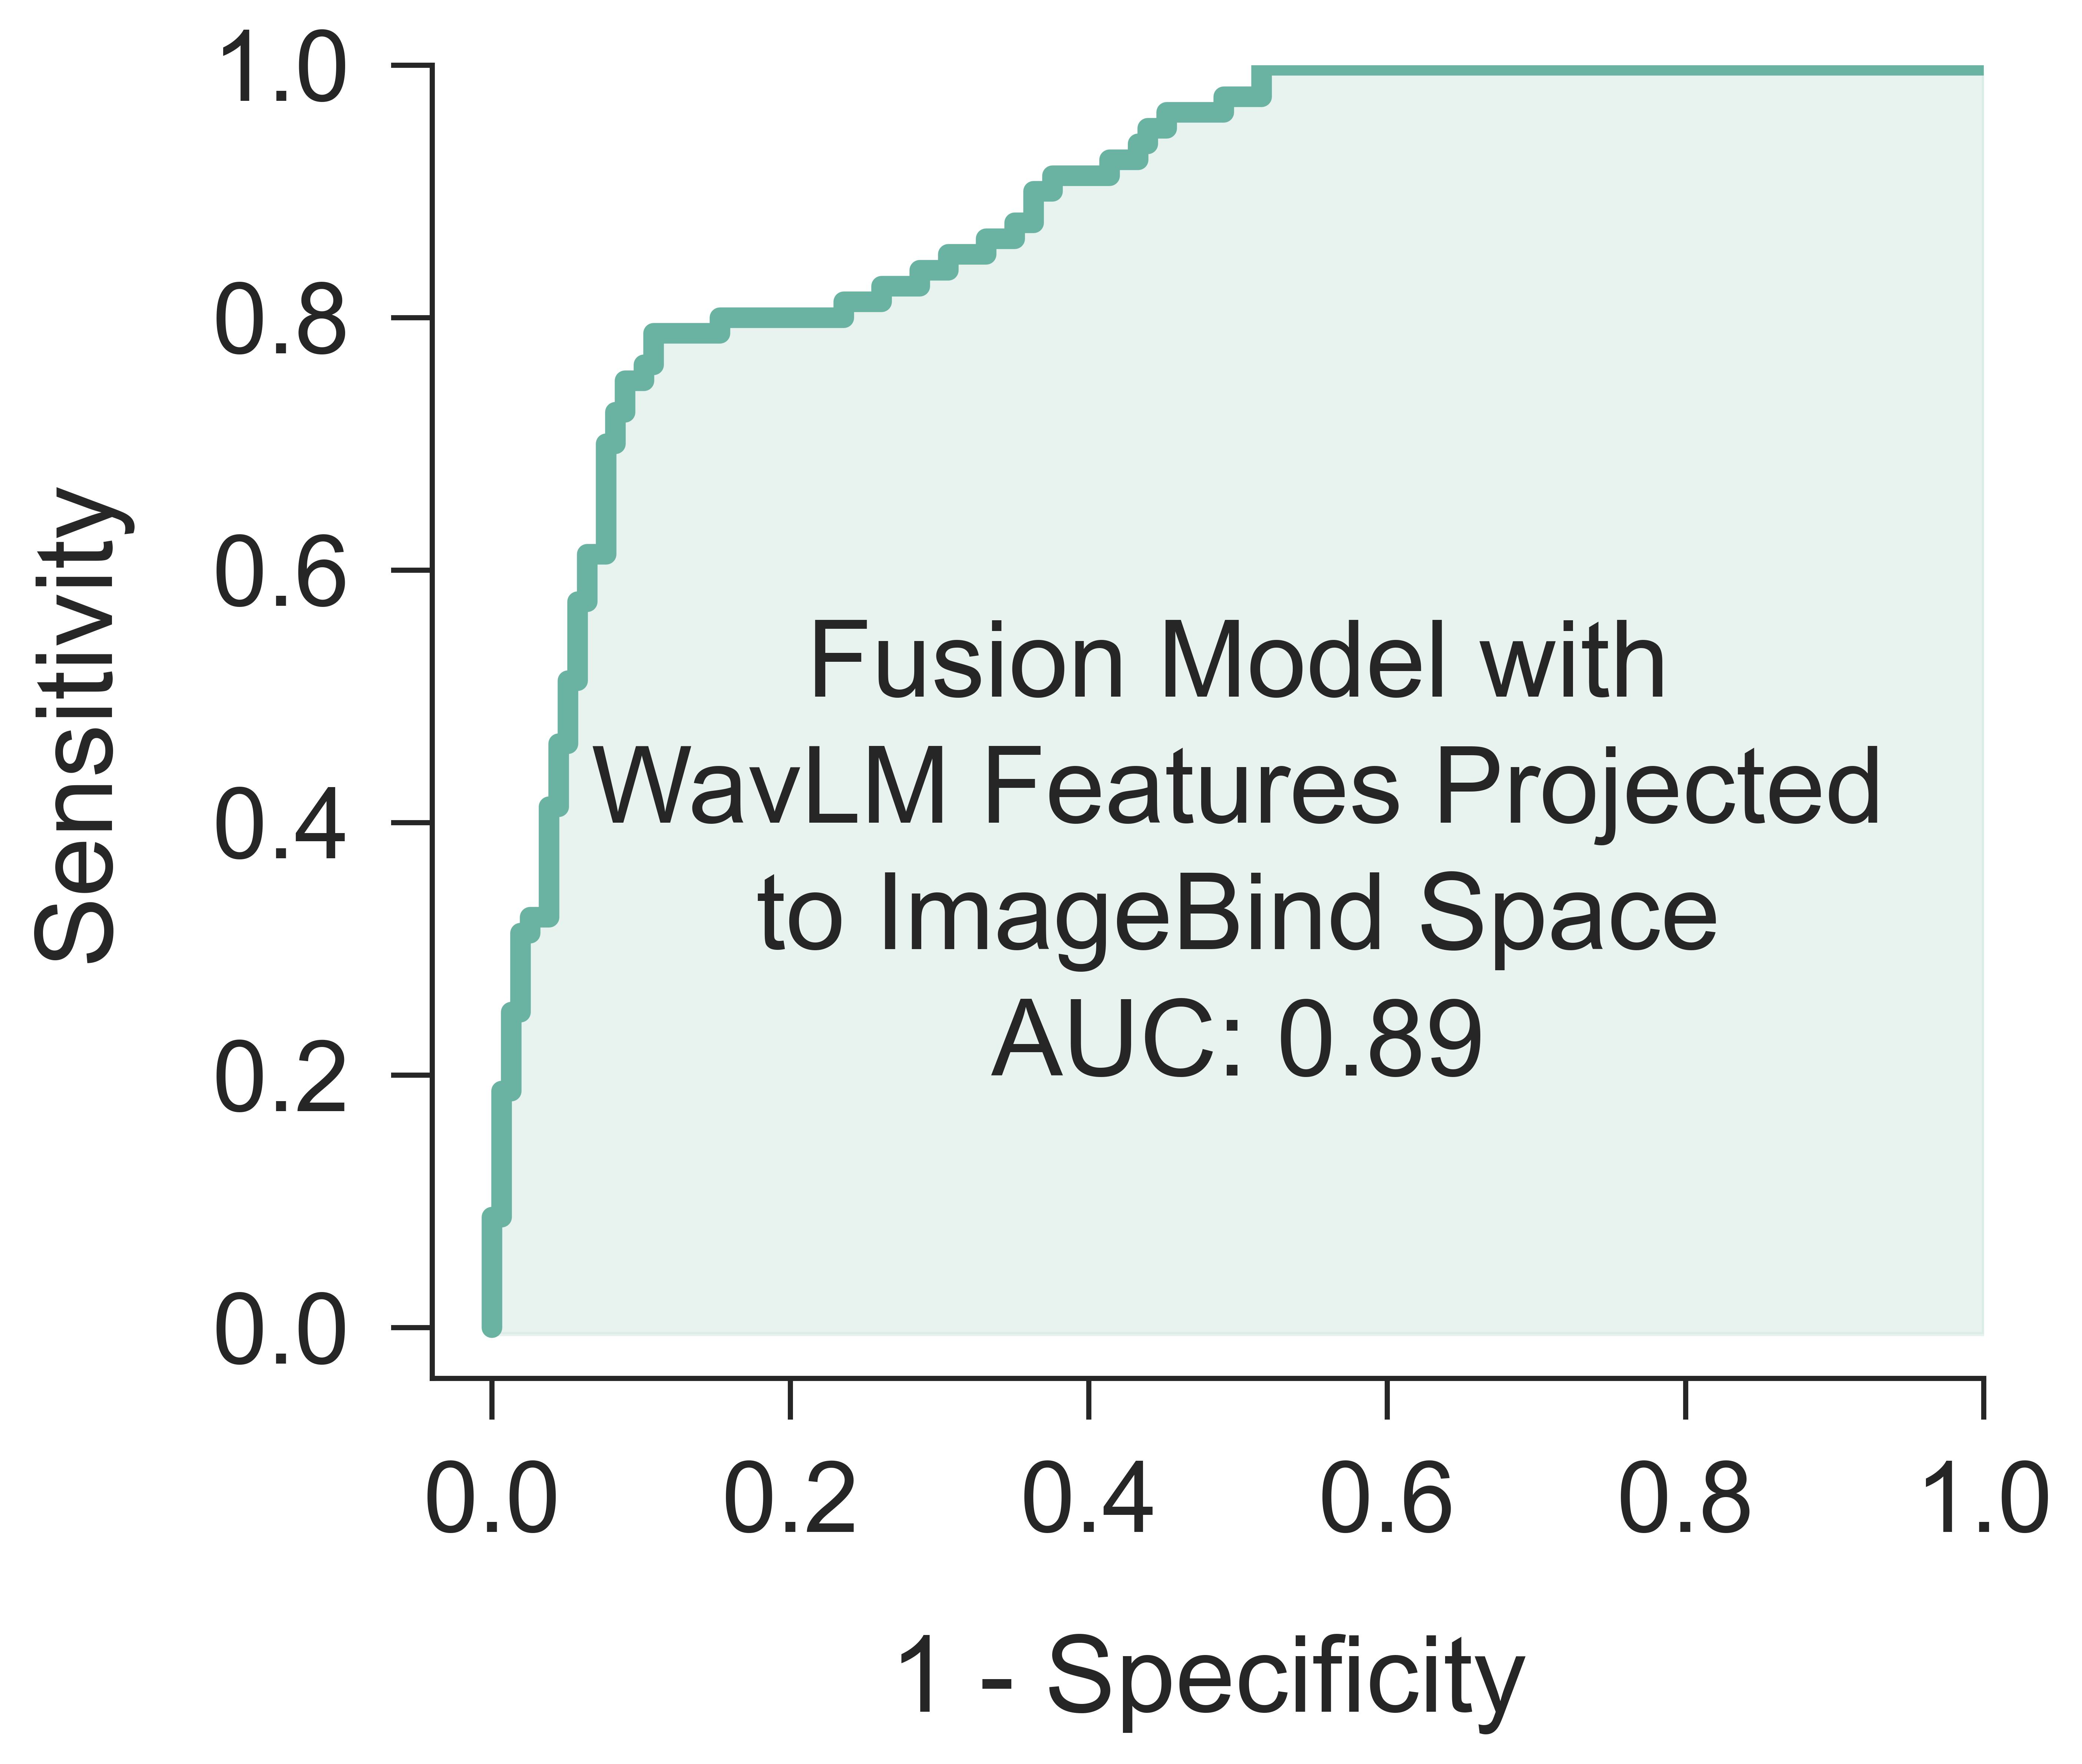
In recent years, representation learning using projection has gained significant attention in developing more effective fusion-based classifiers. Projection-based fusion involves transforming features from one feature space into the space of another feature set. Although our concatenation-based early fusions demonstrated improved performance, to maximize complementary information and reduce redundancy between feature sets, we explored projection-based fusion models for PD classification. Despite a slight decrease in AUROC ( compared to the previous best of ), the fusion model projecting WavLM features into the feature space of ImageBind features achieved a significant increase in accuracy ( compared to ). Additionally, it outperformed all other models (or achieved the similar best performance), in terms of most evaluation metrics with a sensitivity of , specificity of , PPV of , and NPV of . Figure 2 demonstrates the ROC curve and confusion matrix for our best fusion model.
2.4. Generalizability Test Across Recording Environments
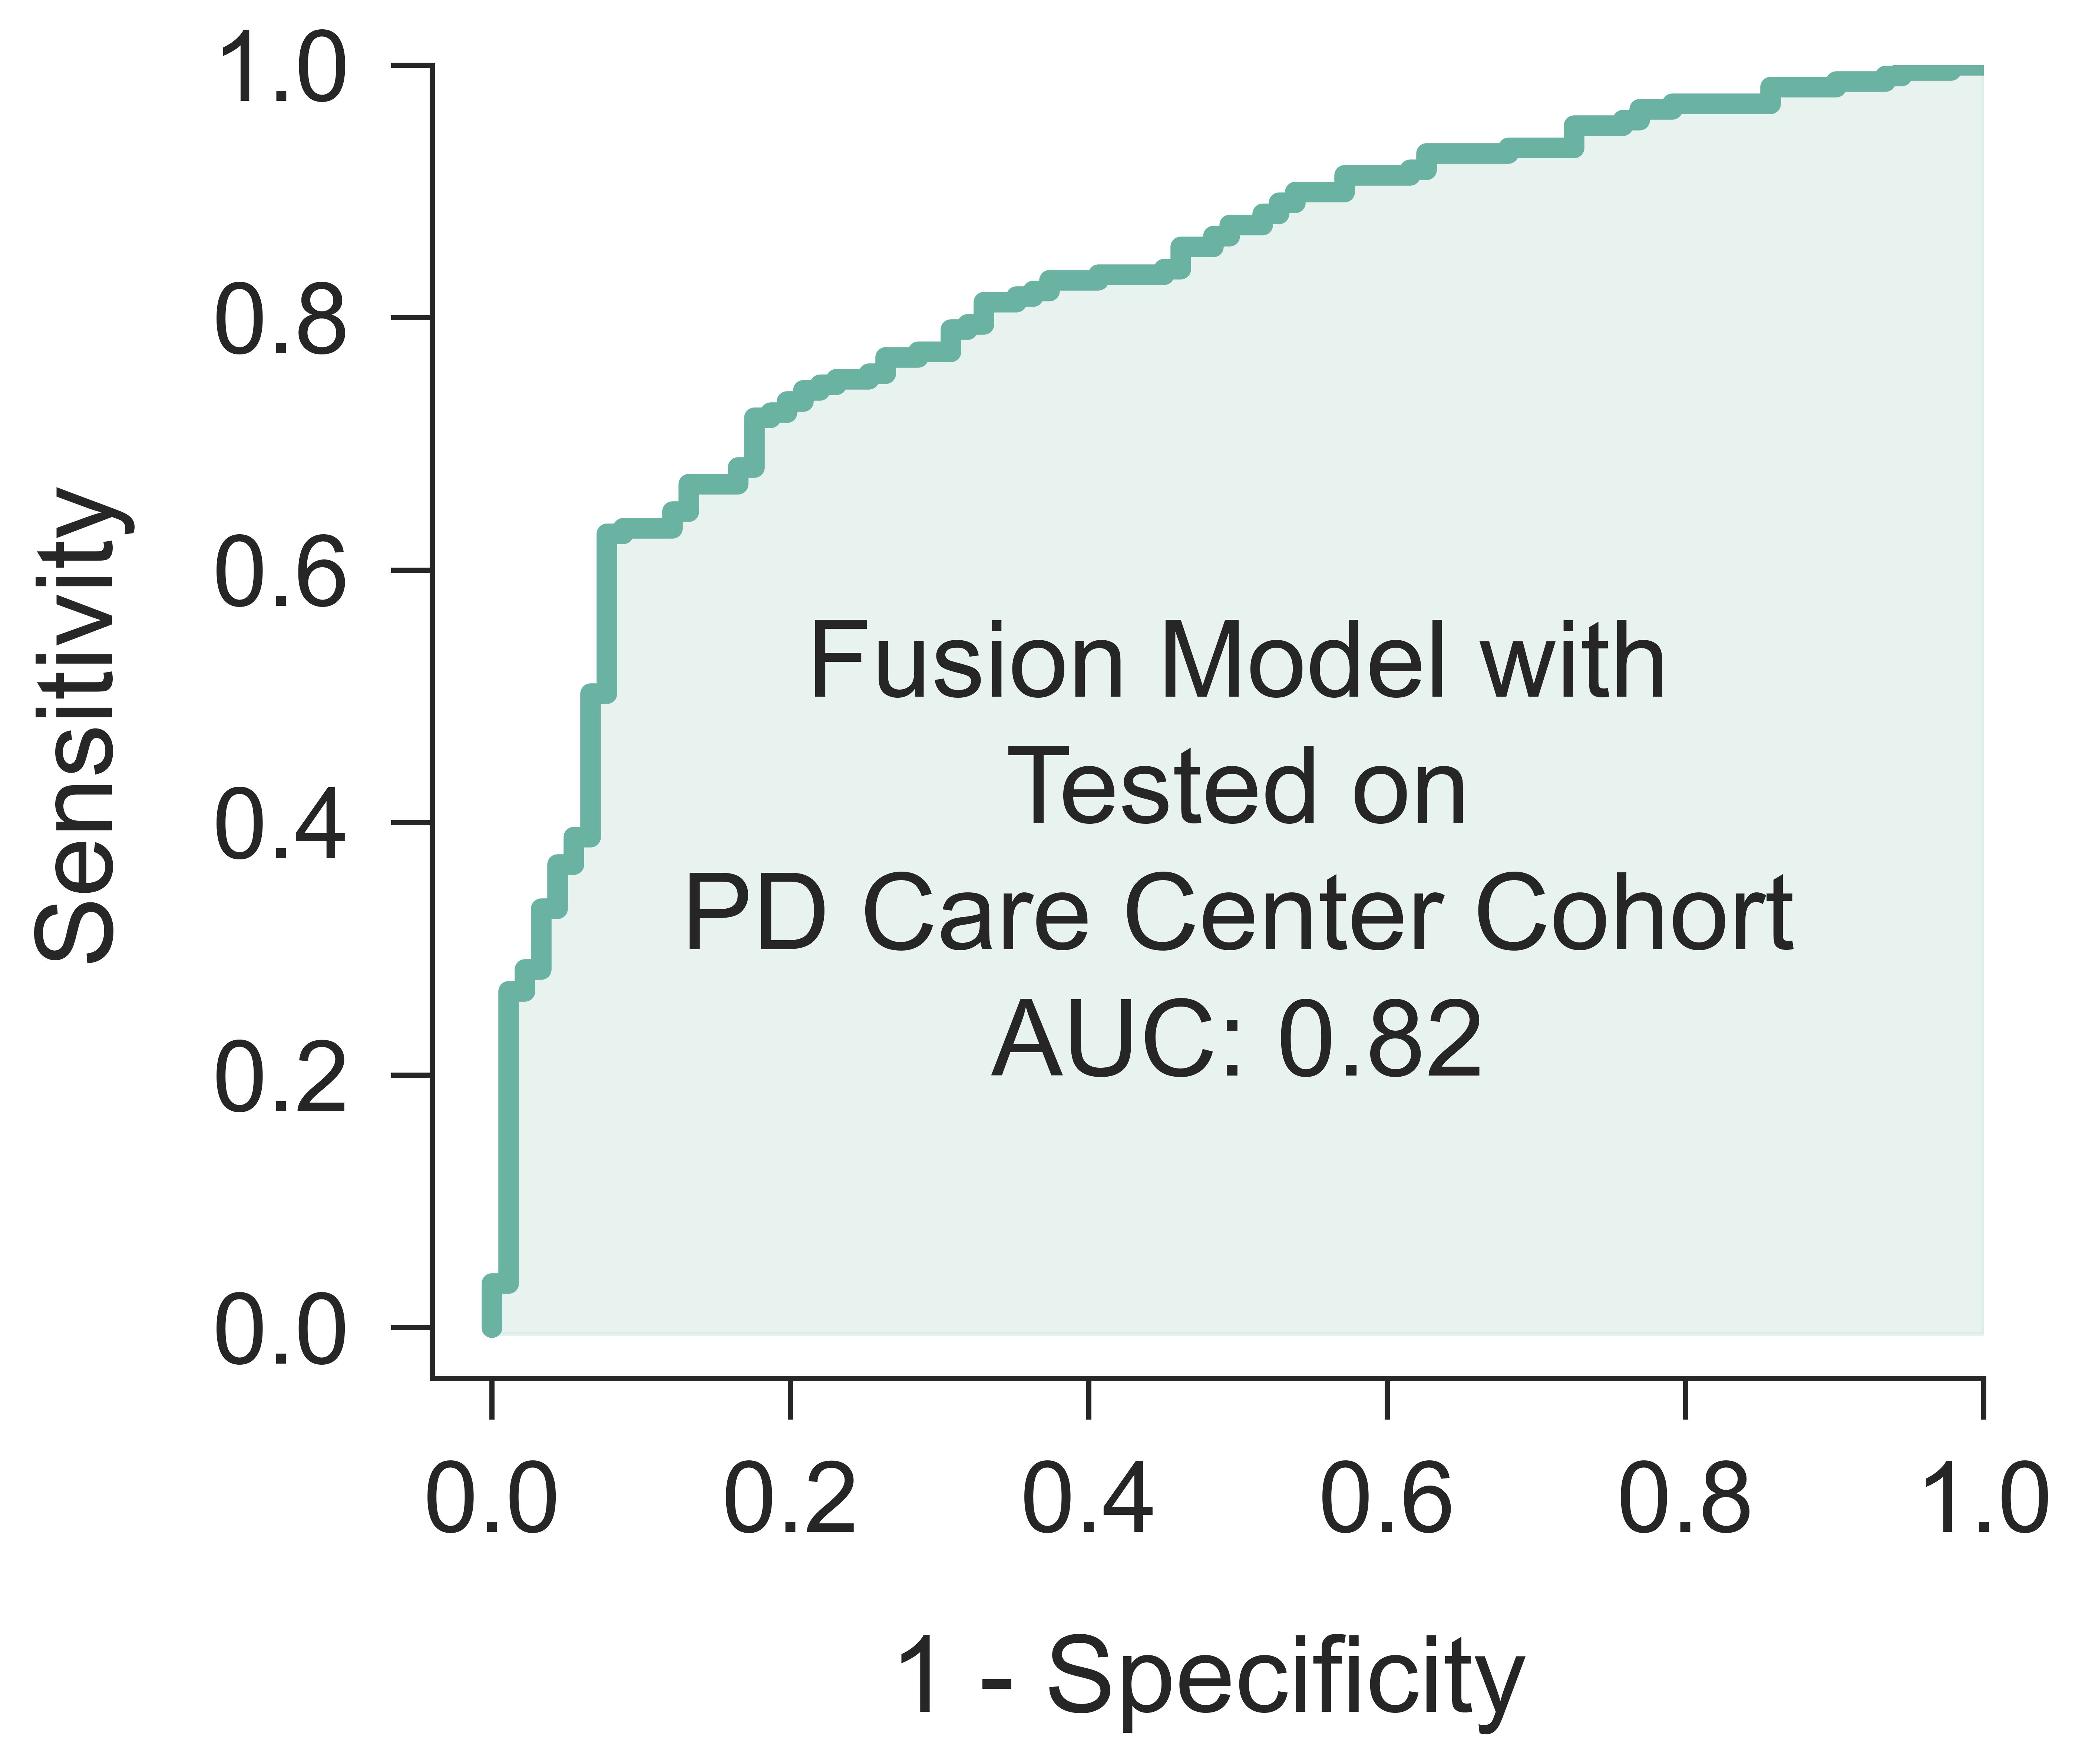
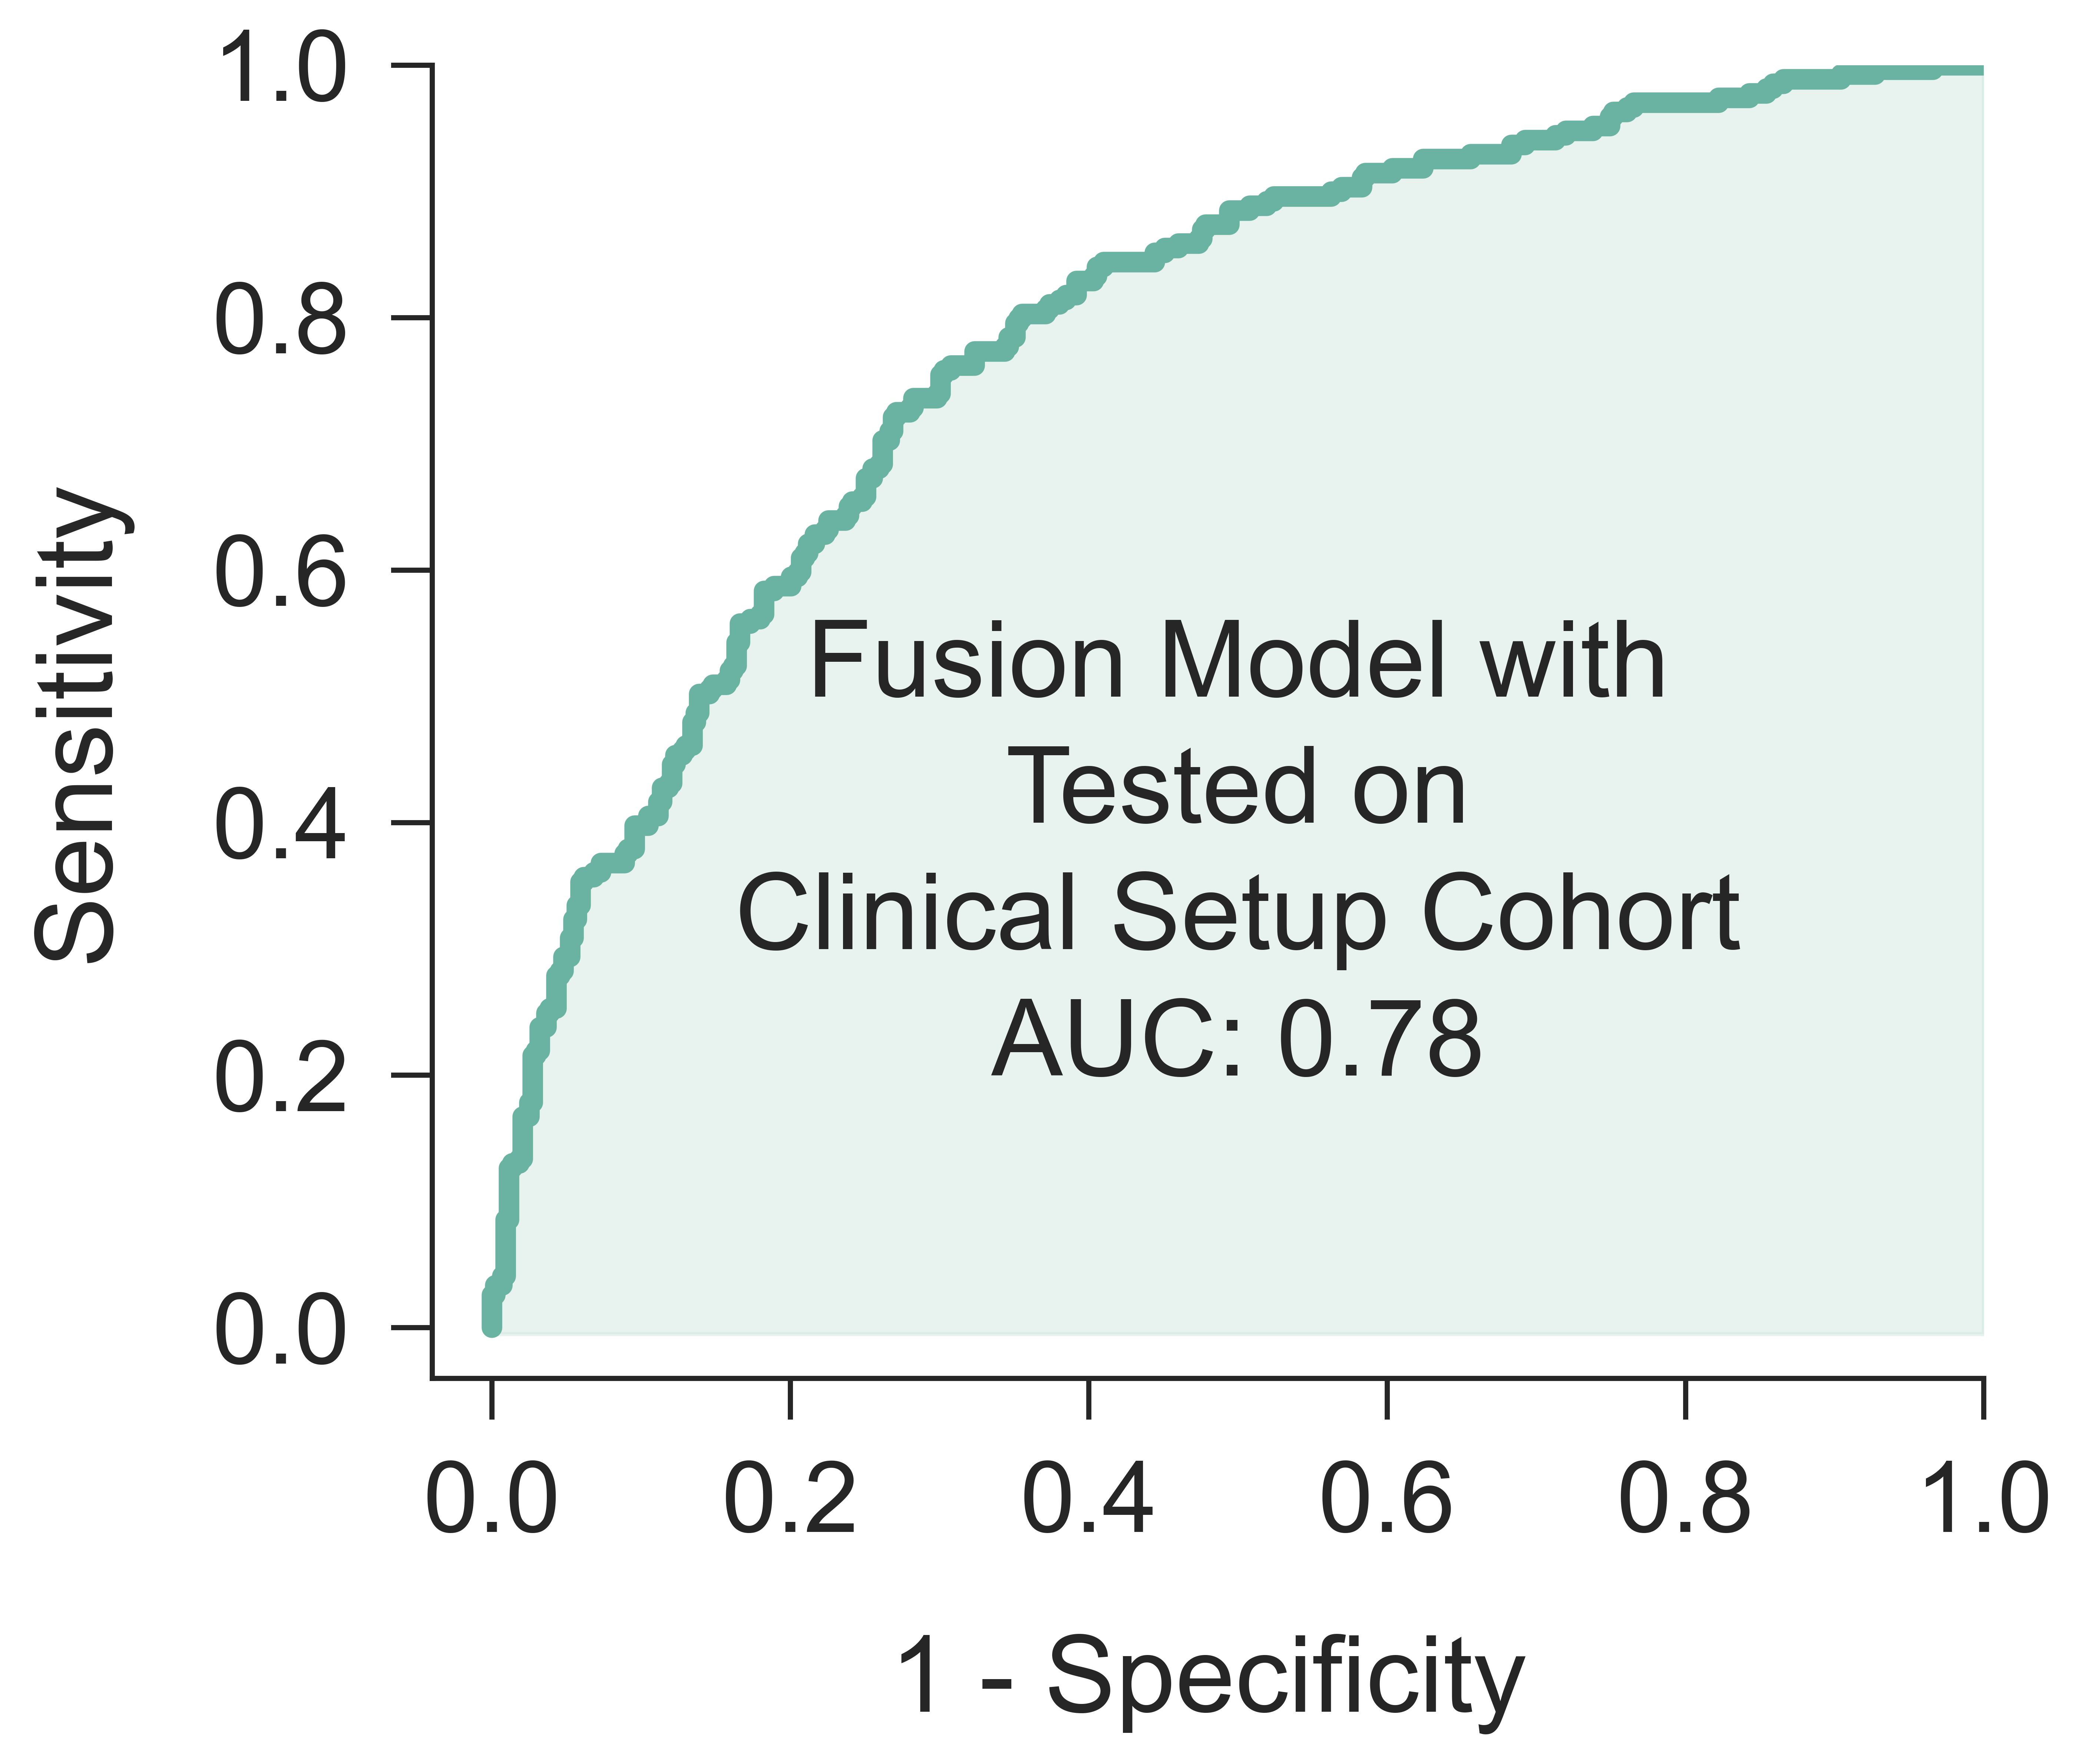
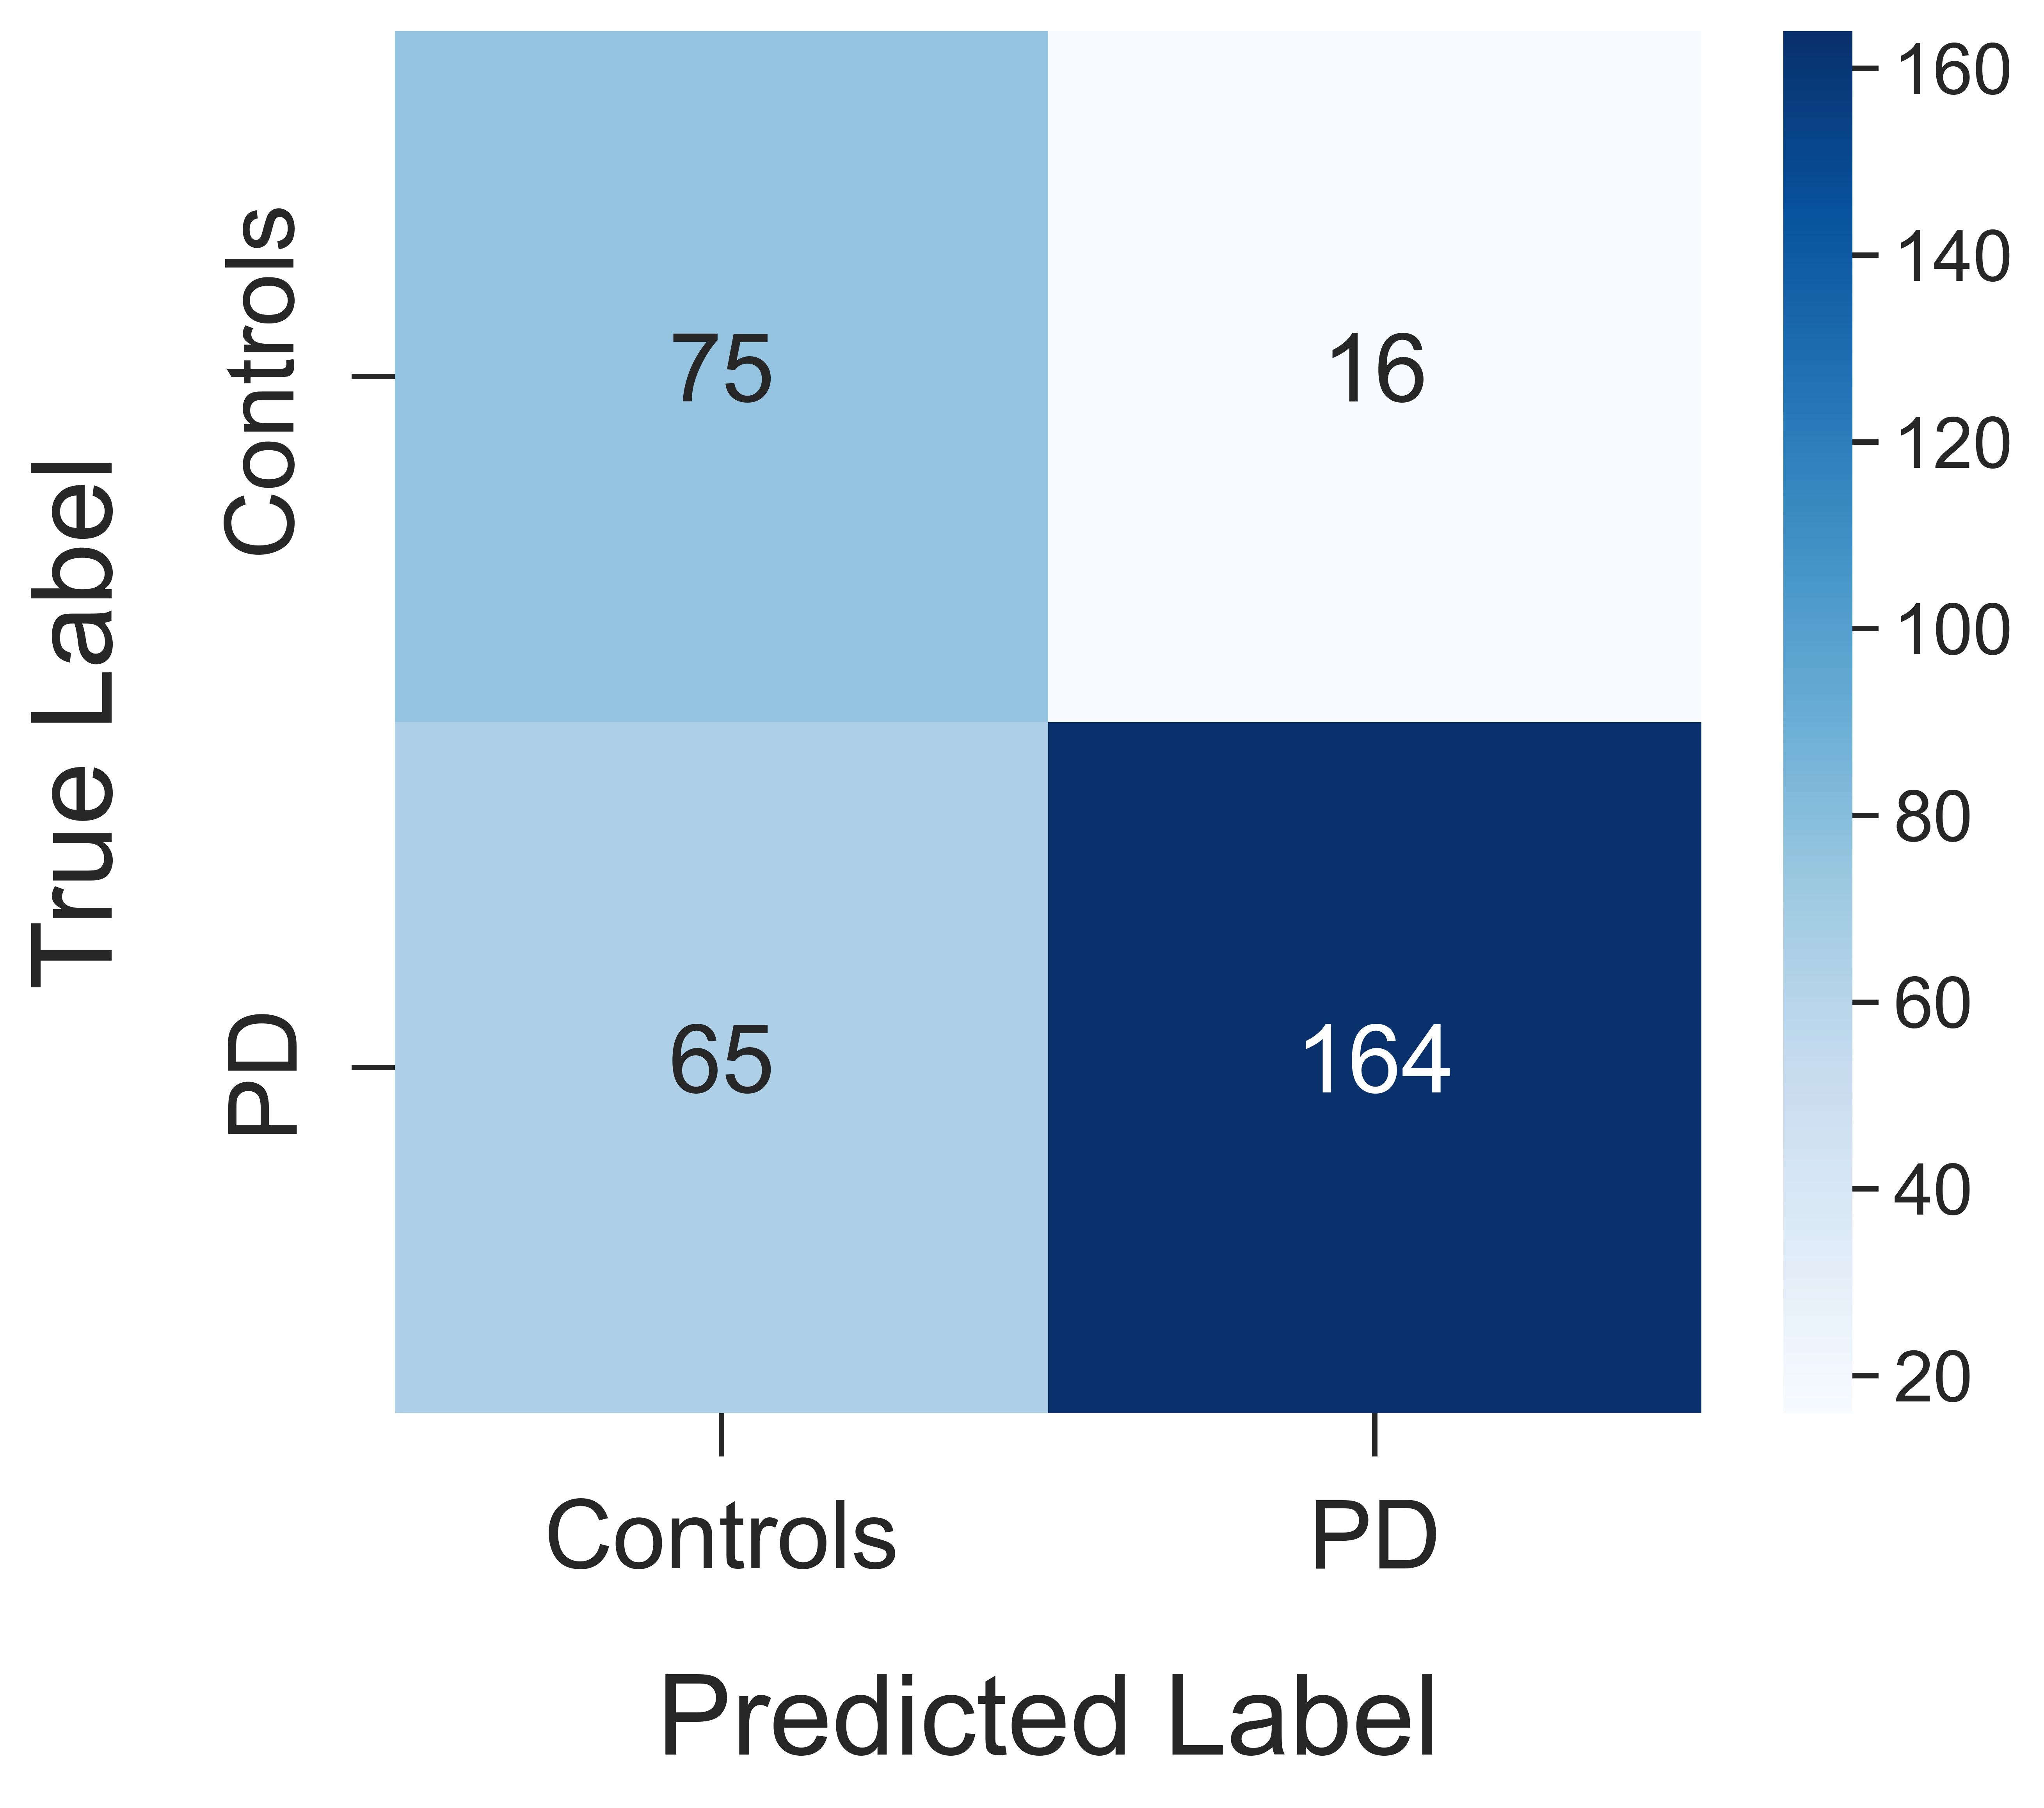
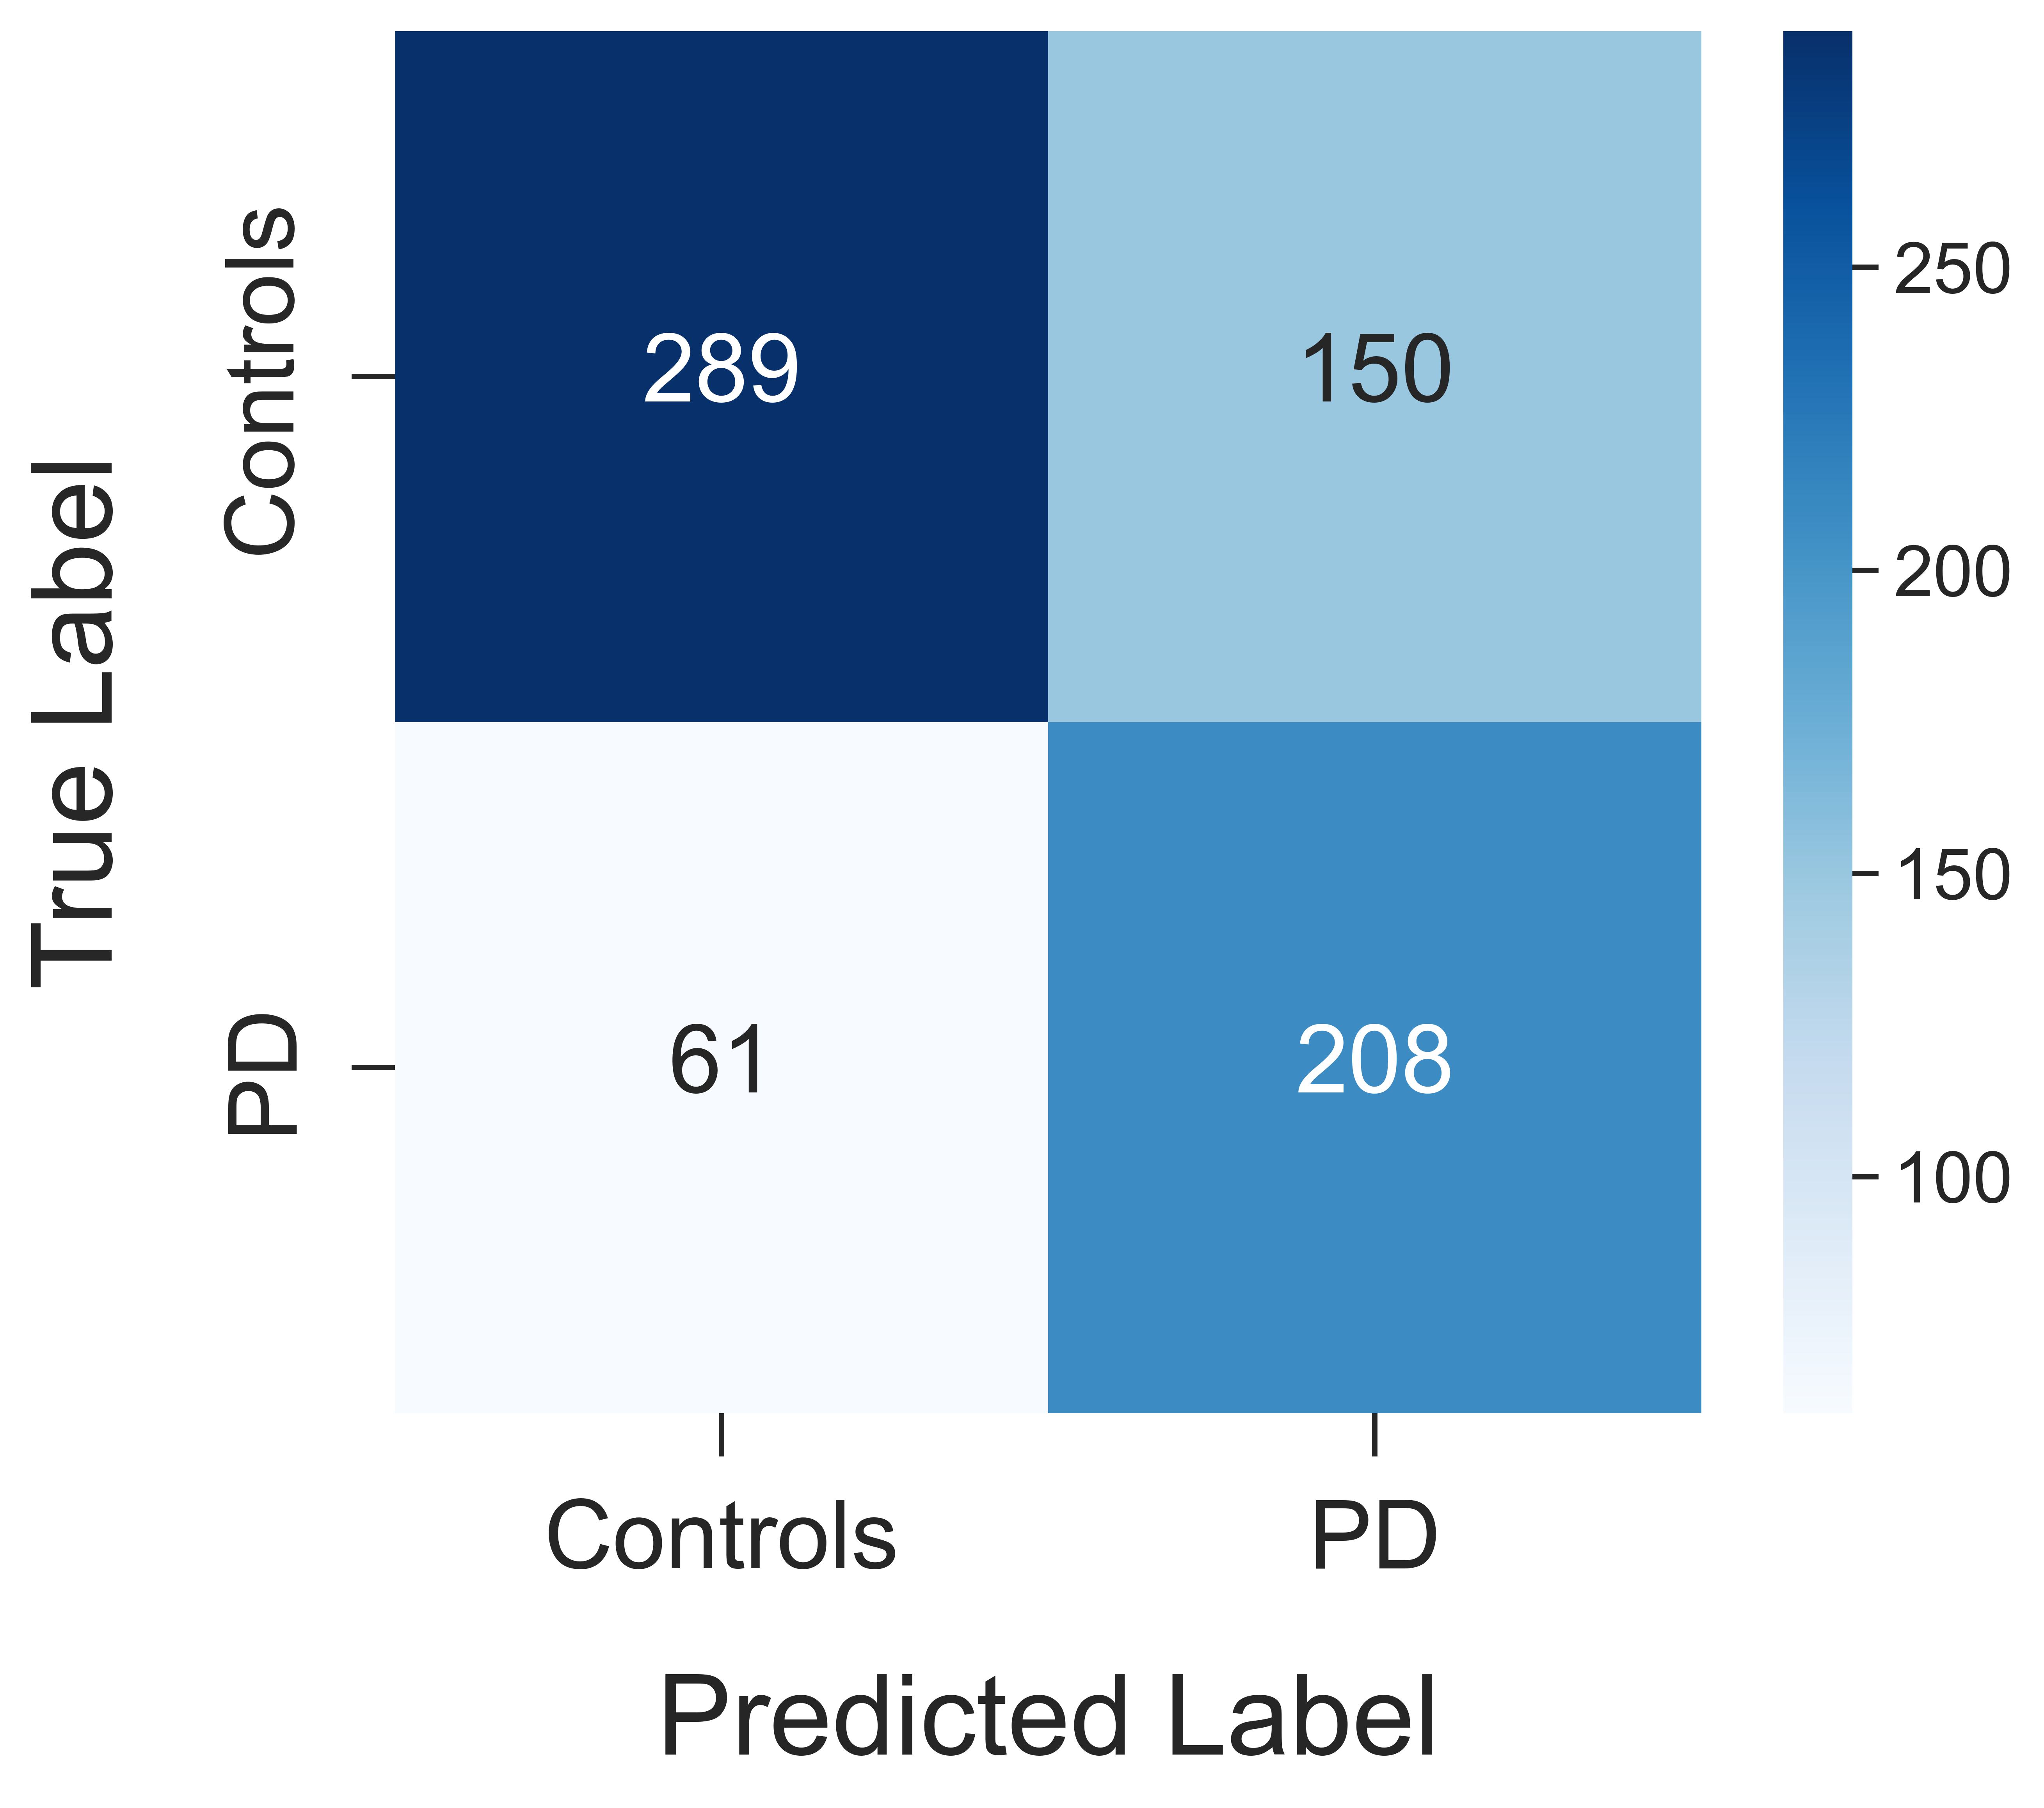
The experimental settings with a random split evaluate the model’s performance when the test data come from a distribution similar to that of the training and validation data. To assess the model’s generalizability and performance on a test set with a probable distribution shift, we used the Clinical Setup and PD Care Facility cohorts as test sets while training the model on the remaining two, including the Home Recorded cohort. However, due to the significant imbalance between the number of PD participants () and control participants () in the Home Recorded cohort, it was excluded from external testing. The demographic distribution of the training, validation, and test sets for this generalizability test is detailed in Table 2(b). It is important to note that the generalizability test was conducted using the best-performing model, which projects WavLM features into the feature space of ImageBind.
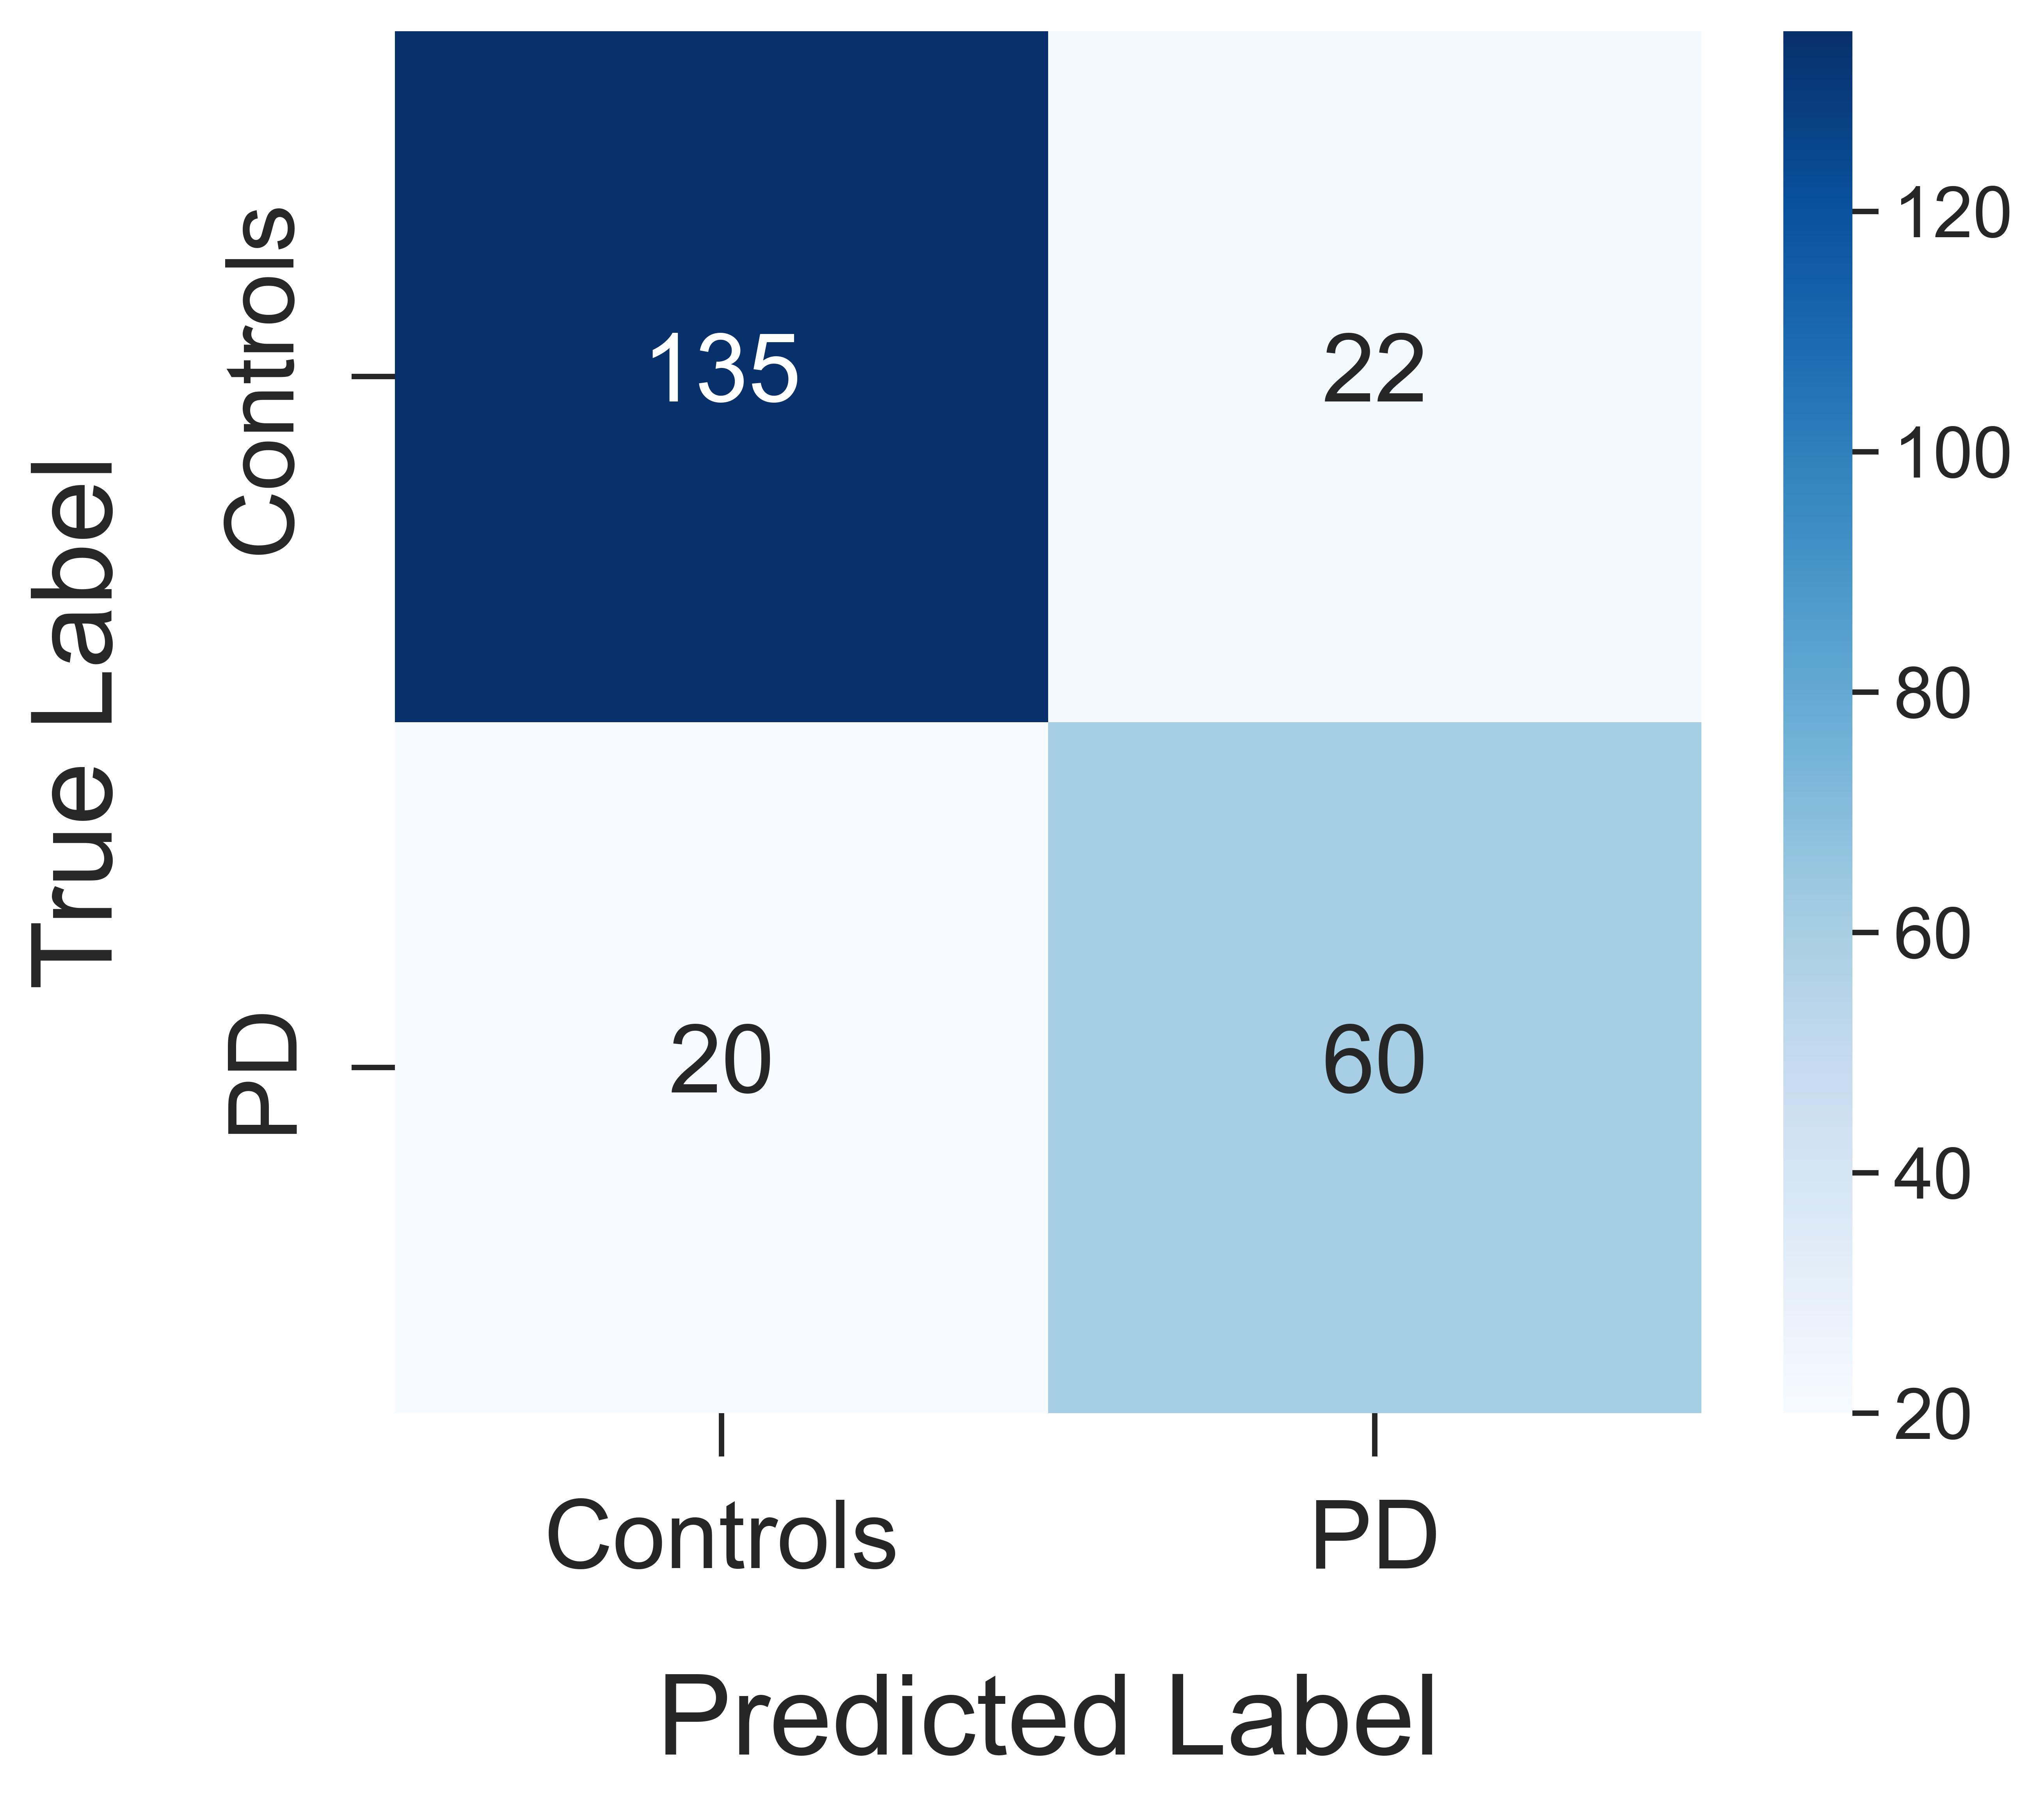
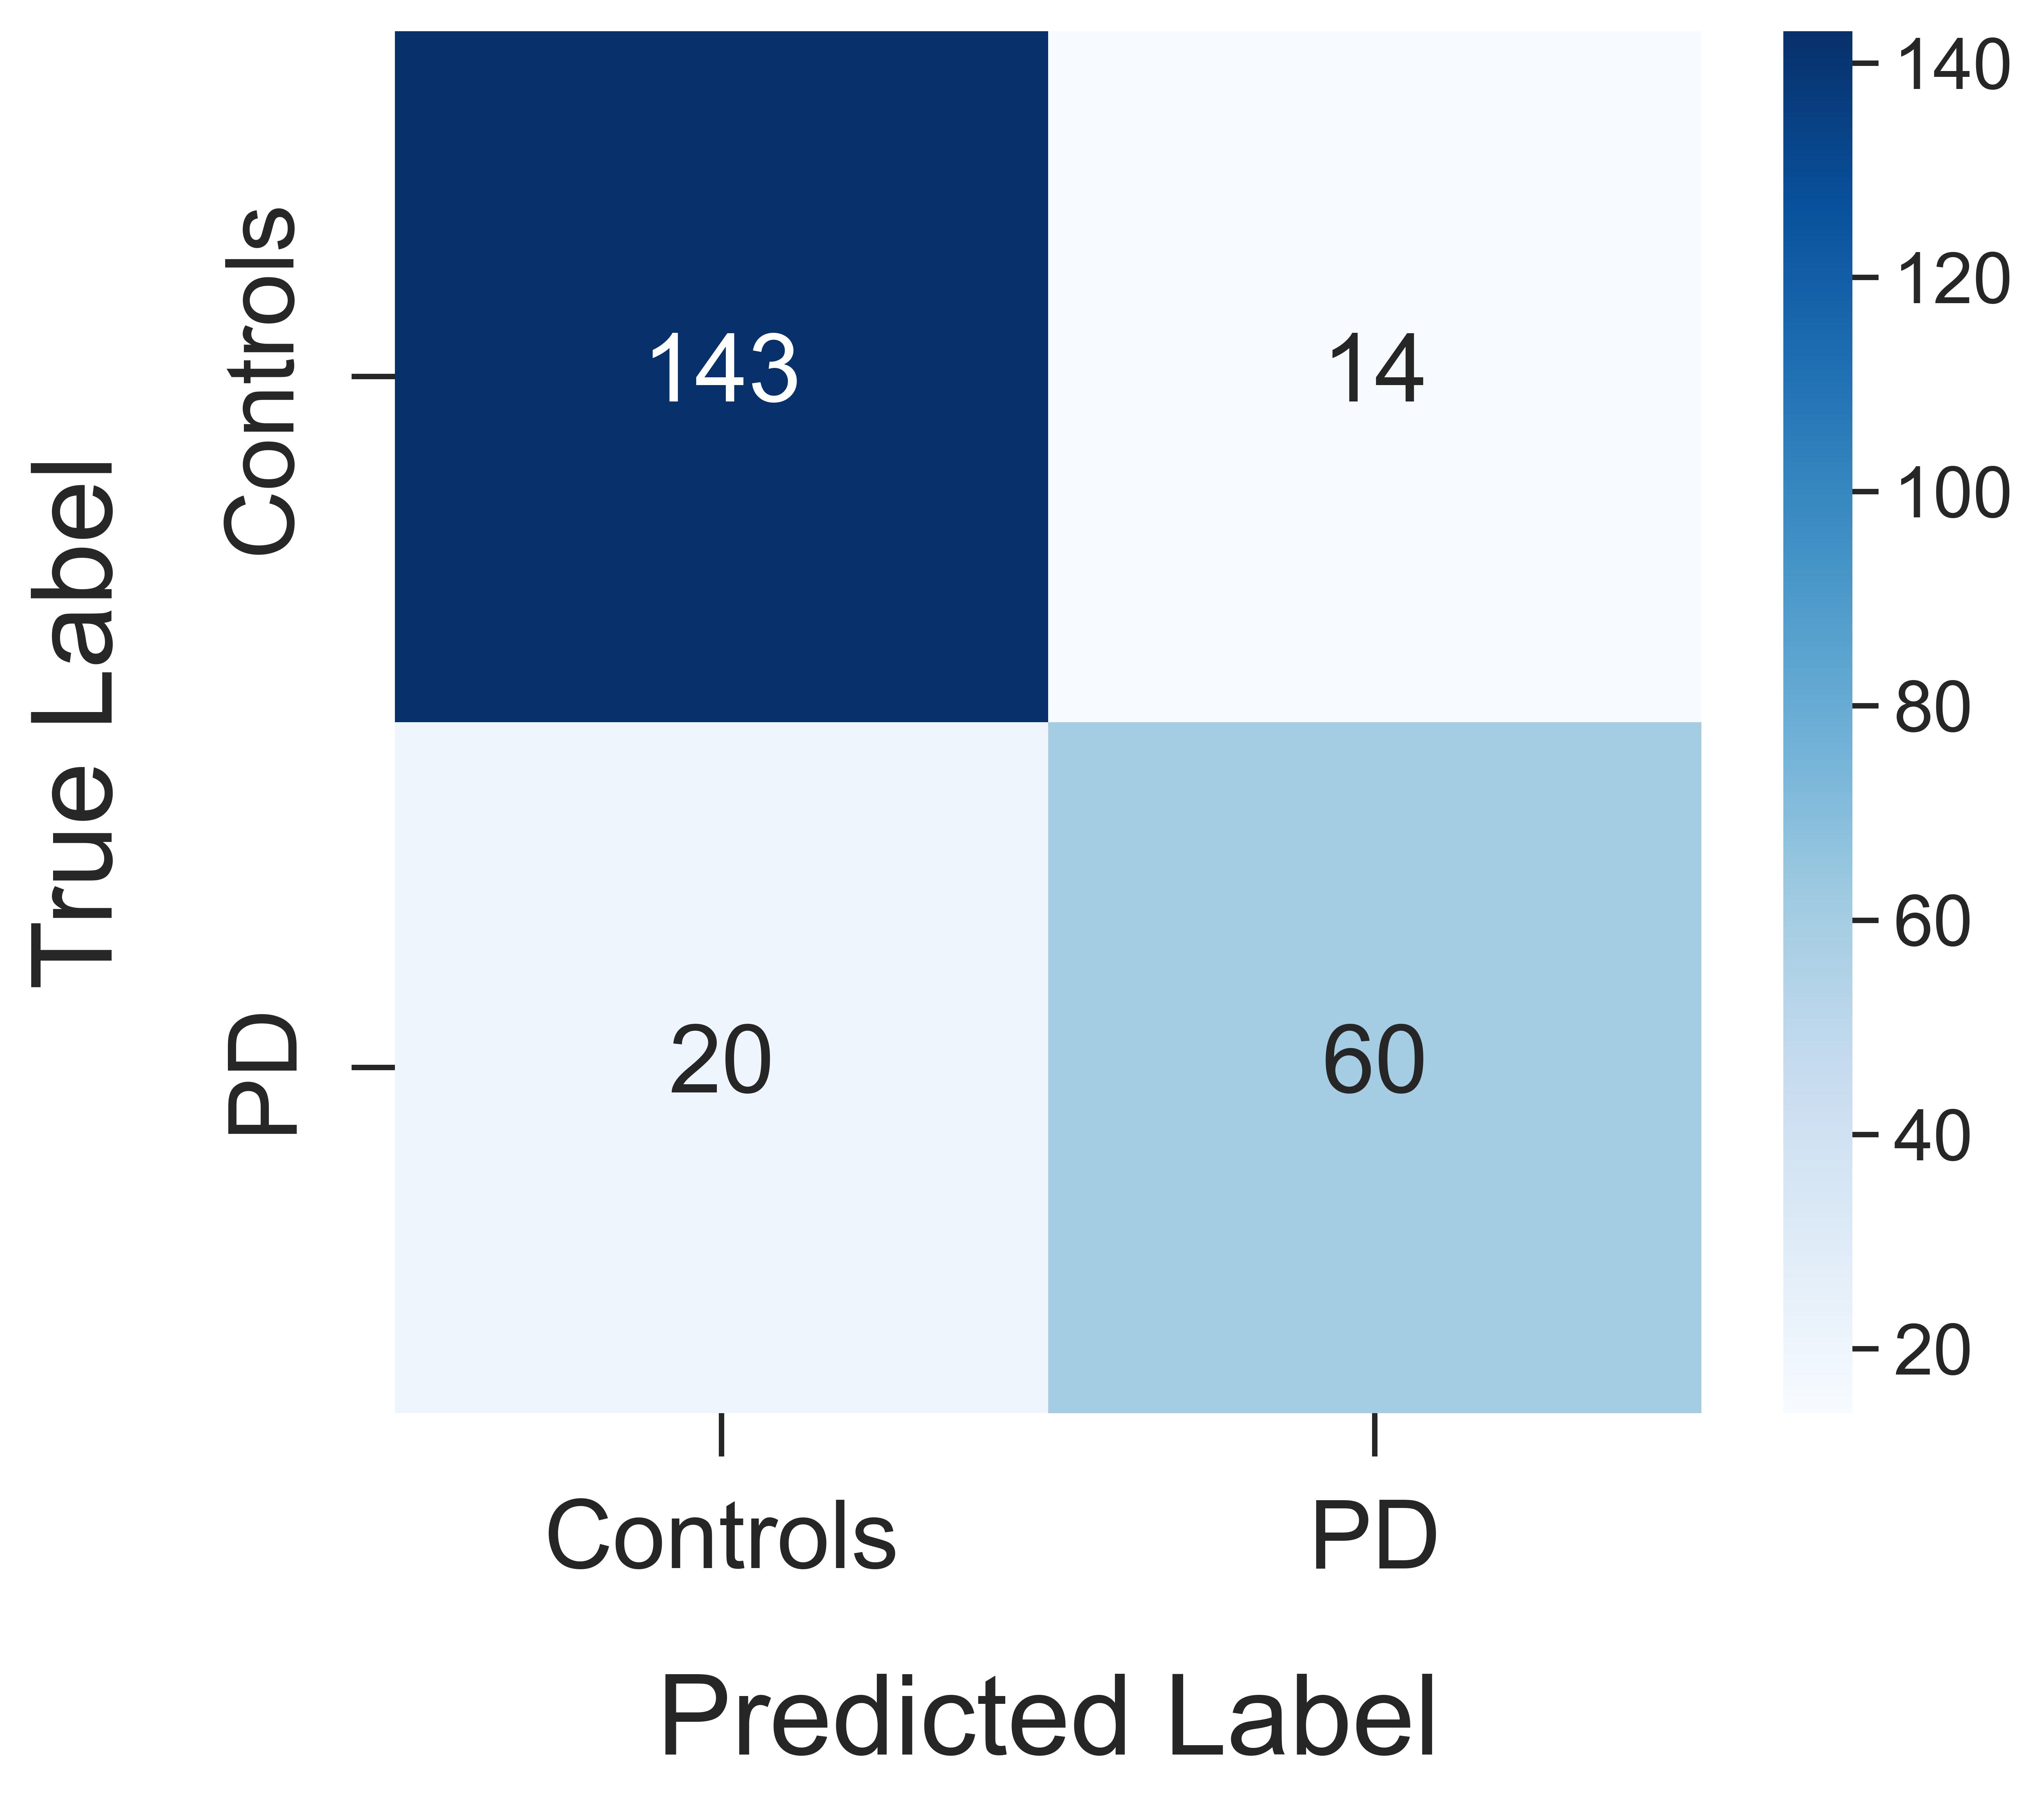
In the first configuration, where the model was trained using data from the Home Recorded and Clinical Setup cohorts and tested on the PD Care Facility cohort, the model achieved an AUROC of and an accuracy of . Compared to the best performance observed in the random split settings, the AUROC and accuracy dropped by and , respectively. Furthermore, the model demonstrated a sensitivity of , a specificity of , and a positive predictive value (PPV) of . Unfortunately, a significant drop in the negative predictive value (NPV) was observed, with a value of .
In the second configuration, where the model was tested on the Clinical Setup cohort after being trained on data from the Home Recorded and PD Care Facility cohorts, it achieved an AUROC of (a decrease) and an accuracy of (a decrease). The model showed a reduced sensitivity of , a specificity of , and a PPV of , but a comparable NPV of . Figure 3 demonstrate the ROC curve and confusion matrix when our best fusion model was tested on data from the Clinical Setup and PD Care Facility cohorts, respectively.
2.5. Error Analysis
To determine if the model is under performing for any particular demographic subgroup, we performed rigorous error analysis in terms of four key demographic properties of the participants that were not included in the model’s training and validation stages: sex, ethnicity, age, and recording environment.
Statistical Bias Analysis
First, we performed statistical significance tests to evaluate whether the model’s performance differed significantly across complementary demographic subgroups. All statistical tests were conducted at an significance level. First, we divided the dataset into multiple subgroups based on sex (Male vs. Female), ethnicity (White vs. Non-White), age (Below 50 years vs. 50 years and Above), and recording environment (Home Recorded vs. Clinical Setup vs. PD Care Facility). Participants with missing demographic information were excluded from the statistical testing of the respective demographic property. Note that in the random split experimental setting, our test set had 237 audio samples. To carry out the statistical tests, we conducted a two-sample –test for proportions between each pair of subgroups.
For the analysis based on sex, the model achieved an accuracy of for the male subgroup ( samples) and for the female subgroup ( samples). The p-value for this comparison was , indicating that the difference in model performance between male and female participants was not statistically significant, and thus the model performed similarly across both genders. In the analysis based on ethnicity, the model achieved an accuracy of for the White subgroup ( samples) and for the Non-White subgroup ( samples). The p-value for this comparison was , which was not statistically significant. When analyzing by age, the model achieved an accuracy of for participants below years old ( samples) and for participants aged years and above ( samples). With a p-value of , this difference was not statistically significant, indicating that the model did not perform differently between these two age groups.
Since we had three distinct recording environments, we conducted statistical test for each of the pairs. The model achieved an accuracy of for the Home Recorded cohort ( samples) and for the Clinical Setup cohort ( samples). The p-value for this comparison was , indicating that the difference was statistically significant at the level. For the comparison between Home Recorded ( samples, accuracy) and PD Care Facility cohorts ( samples, accuracy), the p-value was , showing no significant difference in performance between these two cohorts. Lastly, in the comparison between the Clinical Setup ( samples, accuracy) and PD Care Facility cohorts ( samples, accuracy), the p-value was , which came out to be statistically significant. The outcome of different statistical significance test are summarized in Table 3.
We also investigated whether the duration of the disease impacted the model’s performance. We collected the disease duration information for all the clinical data and some of the home recorded data. Among the test samples, we had disease duration information for of them. We performed Spearman’s rank correlation test to analyze the relationship between the model’s correctness and the disease duration. The results showed a weak positive correlation between the model’s correctness and disease duration (), but this correlation was not statistically significant (). Therefore, there is no significant correlation between the model’s correctness and disease duration, suggesting that the duration of the disease does not have a significant impact on the model’s performance.
| Demographic | Groups | # of samples | Group | p-value | Significant? |
|---|---|---|---|---|---|
| Property | Accuracy | ||||
| Sex | Male | 115 | 84.3 | 0.5776 | No |
| Female | 122 | 86.9 | |||
| Ethinicity | White | 183 | 82.5 | 0.0530 | No |
| Non-White | 18 | 100.0 | |||
| Age | Below 50 | 19 | 100.0 | 0.0799 | No |
| 50 and Above | 199 | 85.9 | |||
| Recording | Home Recorded | 133 | 91.0 | 0.0004 | Yes |
| Environment | Clinical Setup | 72 | 72.2 | ||
| Recording | Home Recorded | 133 | 91.0 | 0.6133 | No |
| Environment | PD Care Center | 32 | 93.8 | ||
| Recording | Clinical Setup | 72 | 72.2 | 0.0131 | Yes |
| Environment | PD Care Center | 32 | 93.8 |
Cohort-based Error Analysis
We performed an extended error analysis utilizing the error analysis framework developed by Microsoft (Shiryaev et al., 2021) to generate hierarchical decision tree maps and heat maps of the error rates and error coverage among the demographic cohorts. Based on the visualization and corresponding metrics, we identified subgroups within the test set data that shared the same demographic characteristics and exhibited outstanding error rates. For this analyses, we excluded the participants whose demographic information were not available and ended up with instances in the test set, of which the PD/non-PD labels were correctly classified by the best-performing fusion model with projection (WavLM ImageBind, AUROC = ), resulting in an average error rate of .
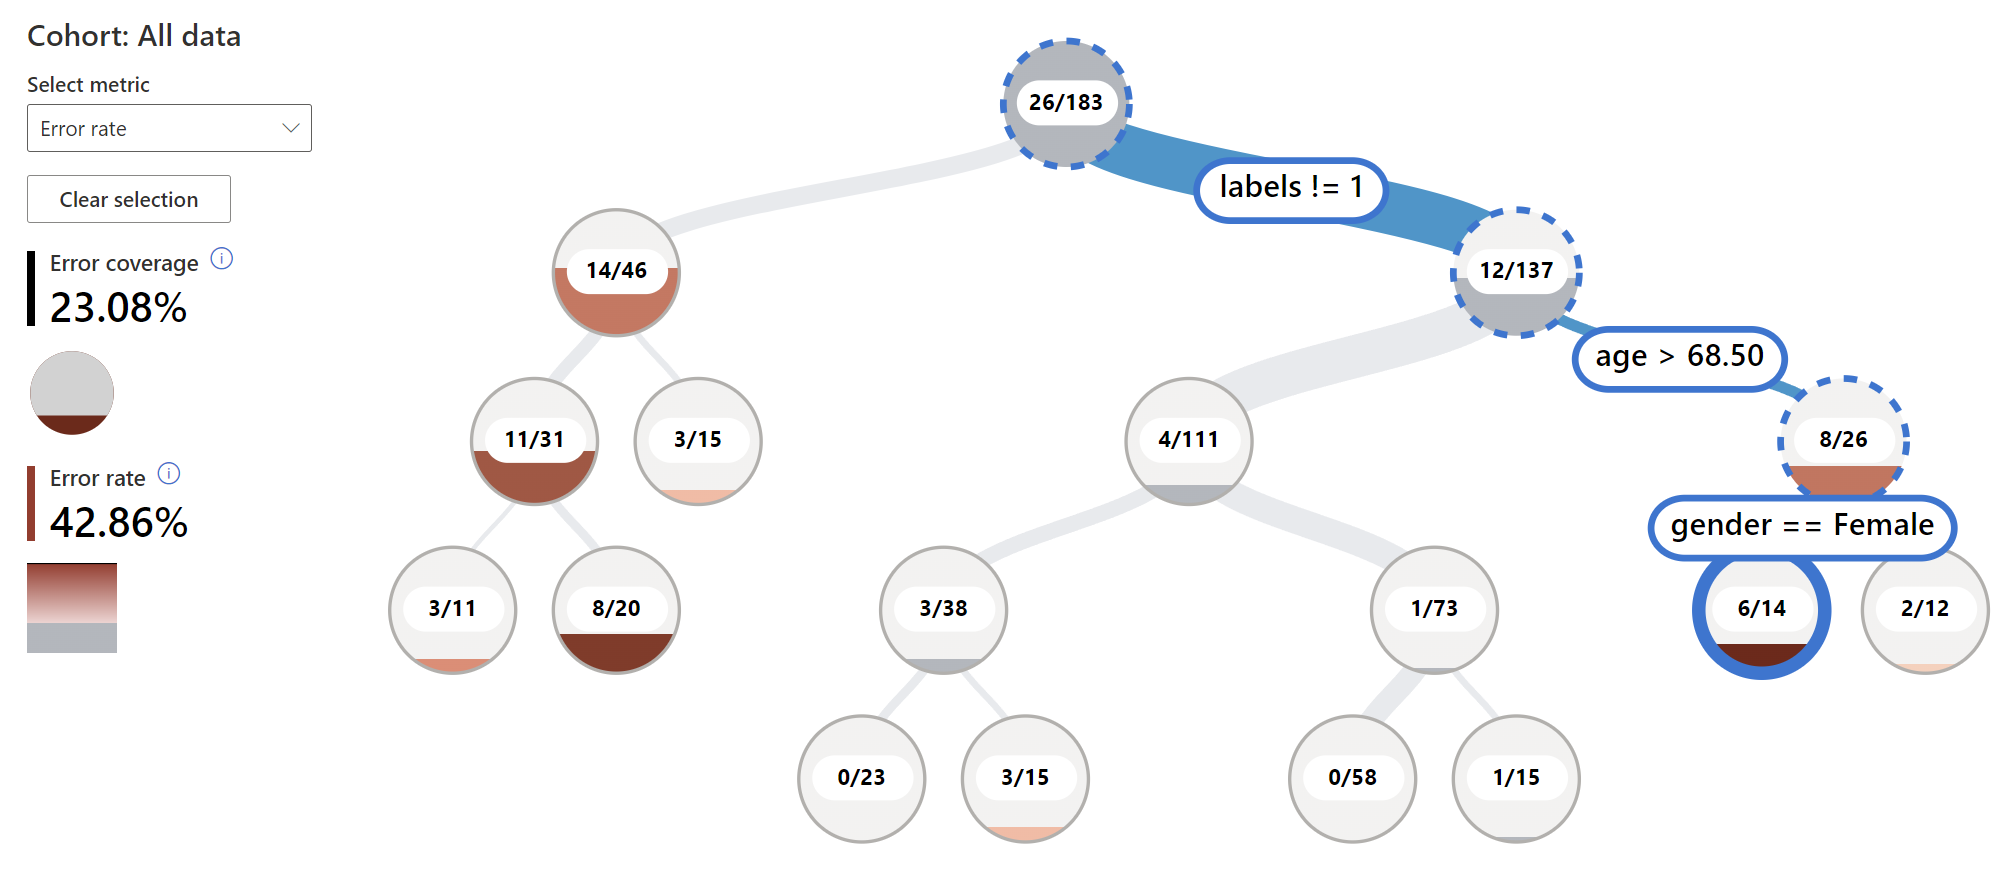
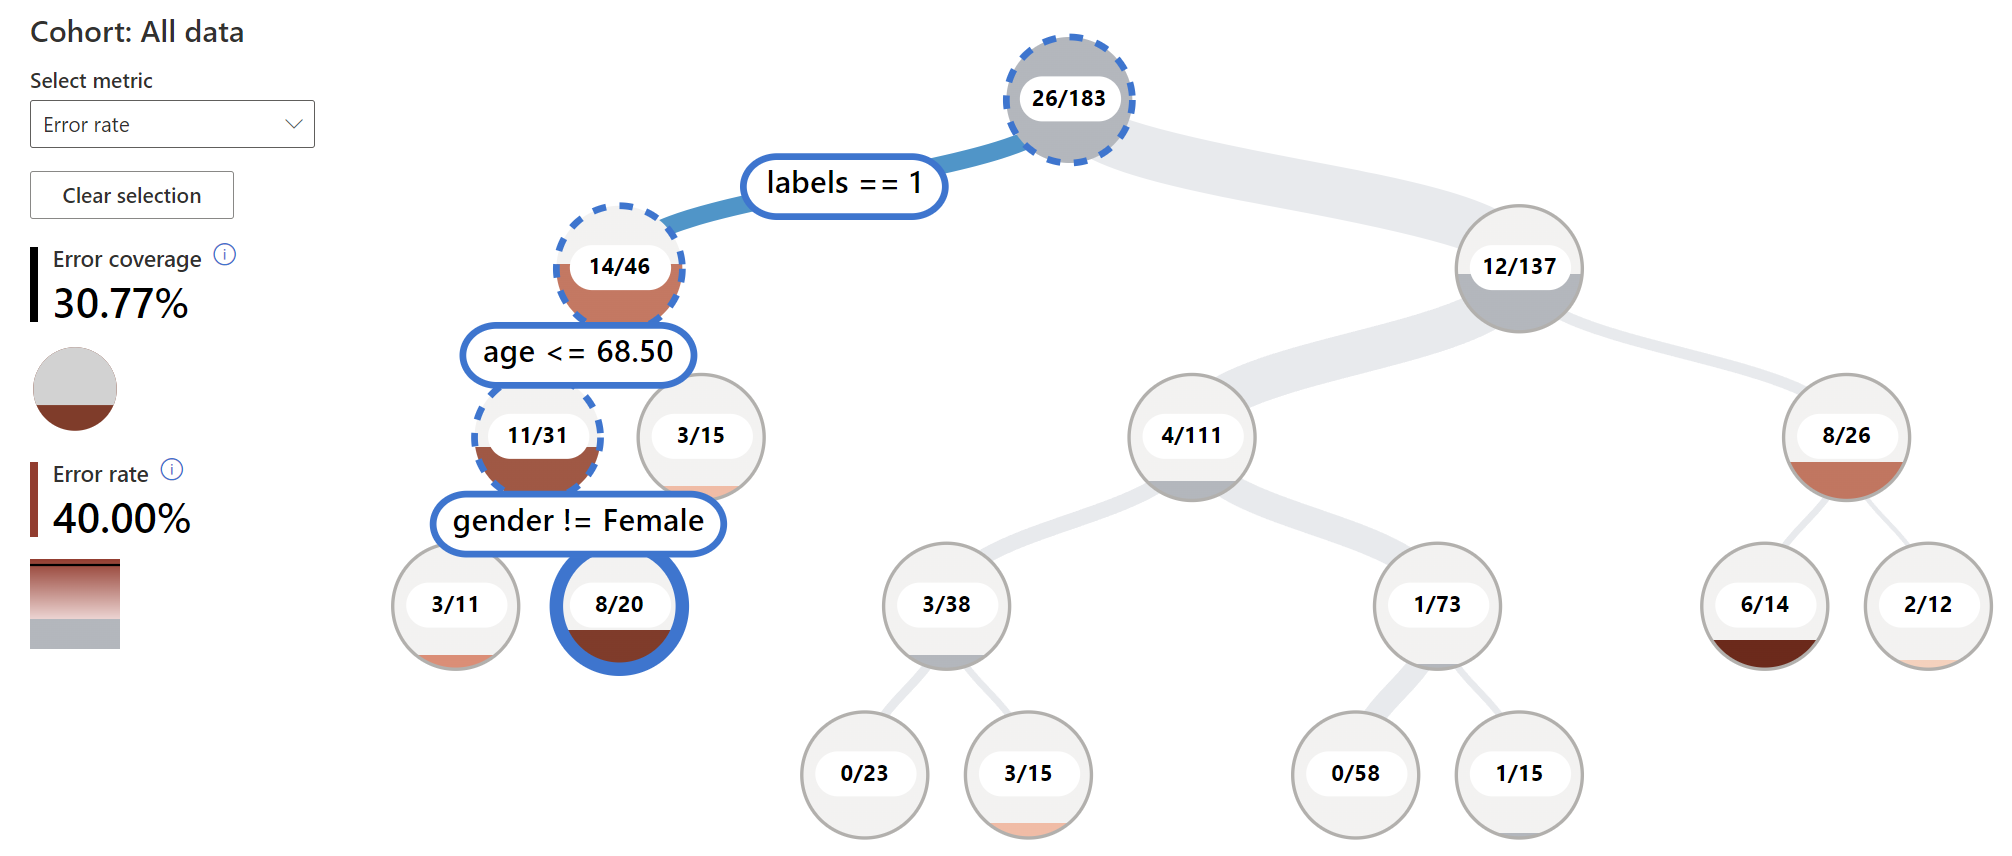
From the decision tree map visualization we looked for nodes with a stronger red color (representing high error rate) and branches with a higher fill line (representing high error coverage) and identified a noteworthy cohort in Figure 4(a) consisting of non-PD participants aged above with an error rate of and a significant error coverage of . For its all-female subgroup of cardinality , the model’s performance barely approached that of a random guess, with an error rate of and an error coverage of . Besides this, we observed another cohort in Figure 4(b) consists of PD patients aged below with error rate of and an error coverage of , possessing perfect precision of but low sensitivity of . For its all-male subgroup of size , the error rate increased to with error coverage of , and the sensitivity score dropped to
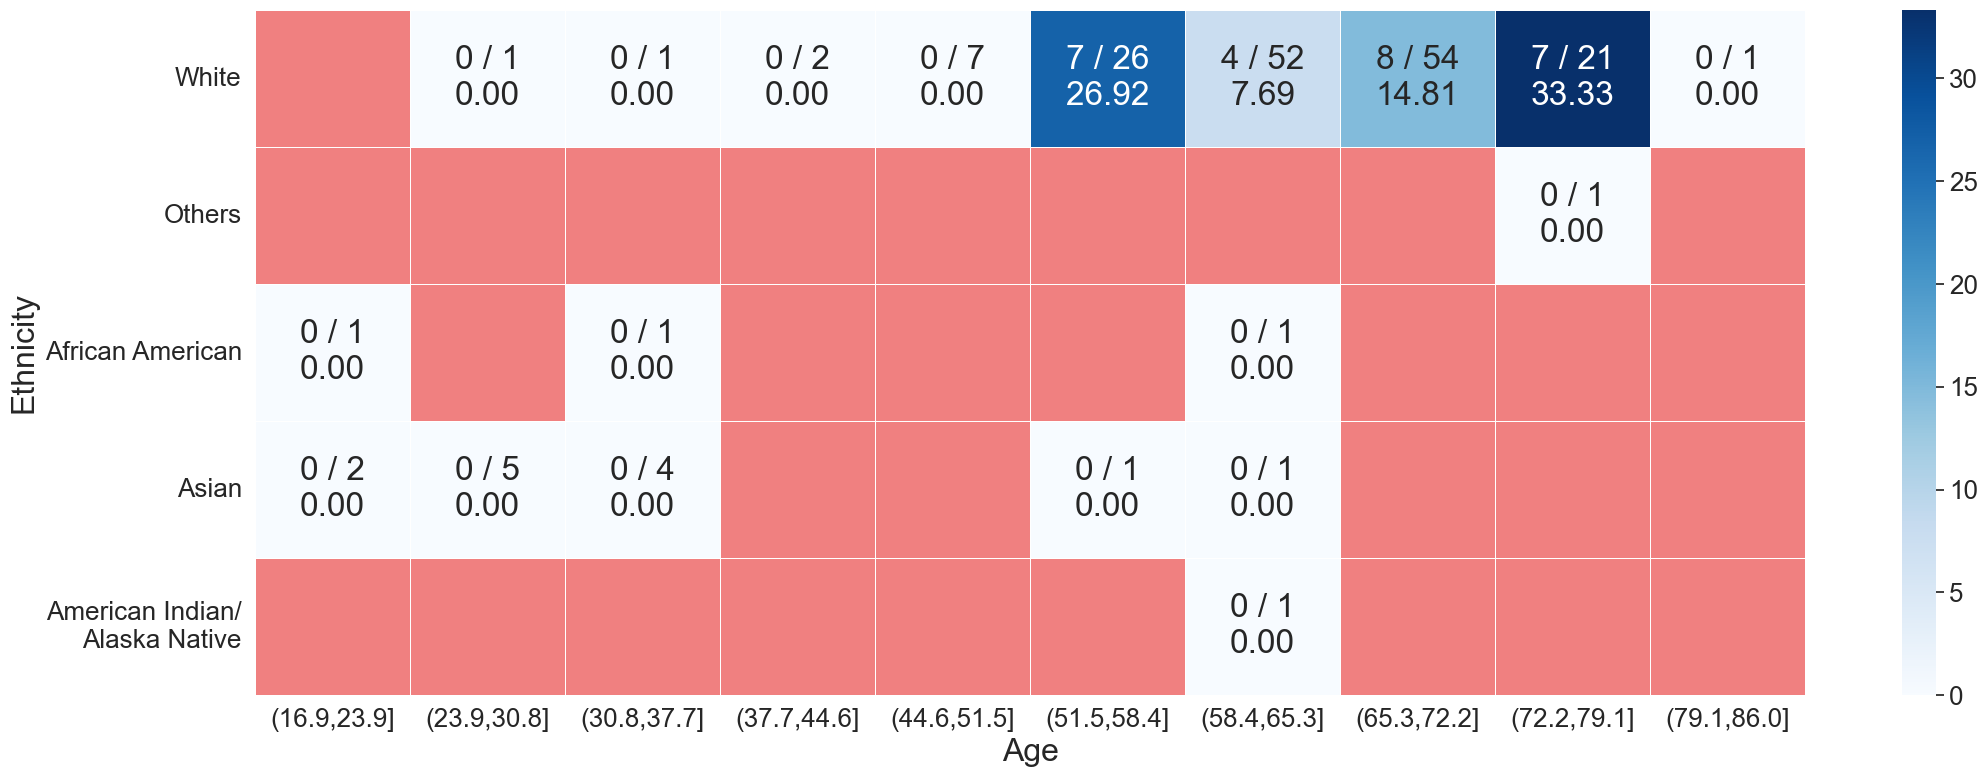


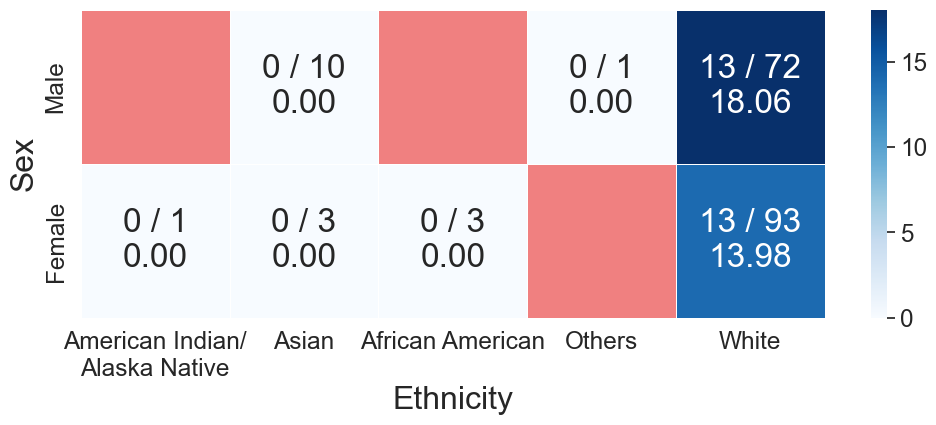
From the heat maps we identified several combinations of demographic features that the model showed suboptimal performance. For the combination of {age ethnicity} in Figure 5(a), two subgroups were particularly notable: white individuals aged between and , and white individuals aged between and . These subgroups exhibited higher-than-average error rates, at and respectively (error coverage is for both). Both precision ( and ) and sensitivity ( and ) scores are low for these two cohorts. For the combination of {age sex} 5(b), we observed a significant cohort of female aged between and has an outstanding error rate of (precision = , sensitivity = ) and error coverage of . Another smaller female cohort of 18 aged between and has an error rate of (precision = sensitivity = ) and error coverage of . We observed that for male individuals in the age interval between and , the error rates and error coverage substantially exceeded the average level. For both genders, the age interval displayed very concerning error rates. For the combination of {ethnicity sex} in Figure 5(d), the model only made mistakes for the white cohorts, with the white male cohort has a higher error rate of , higher precision of and lower sensitivity of than the white female cohort’s error rate of , precision of , and sensitivity of . Both subgroups cover of the total errors.
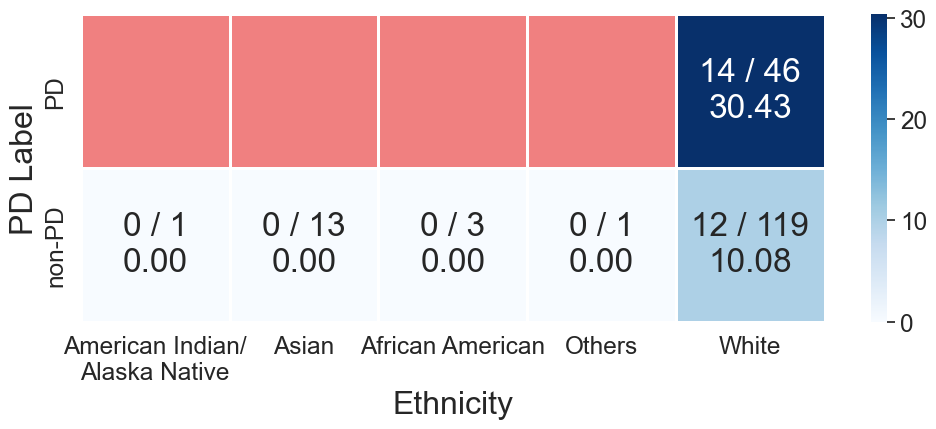
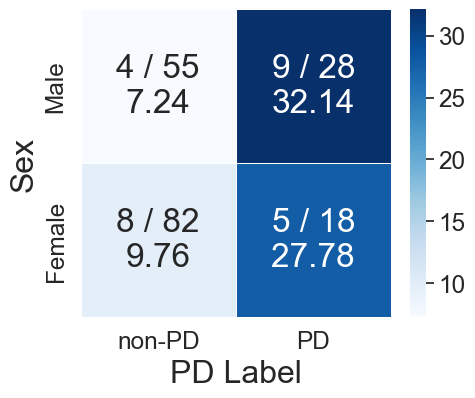
We also examined the error differences between PD and non-PD individuals within each standard demographic subgroup in Figure 5(c), 6(a), and 6(b). The model made mistakes more frequently for PD individuals aged between and (error rate = , error coverage = ), while for the next three age intervals from to the model erred a lot as well. Non-PD individuals were mostly misclassified for ages between and (error rate = , error coverage = ) and between and (error rate = , error coverage = ). A large cohort of 44 non-PD individuals at age interval was perfectly classified without any mistake. PD white individuals were more often misclassified (error rate = , error coverage = ) compared to non-PD white (error rate = , error coverage = ). Lastly, from the confusion matrix of sex versus PD labels, male PD individuals shared a slightly higher error rate of and error coverage of compared to female PD’s error rate and error coverage. Overall, for PD classification the model’s had an error rate of and contributed to of the total errors, whereas for non-PD cases the error rate is , contributing to of all mistakes made.
2.6. Ablation Study
We conducted extensive ablation studies to assess the discriminatory power of different feature sets in distinguishing participants with PD from the control group. We started with developing four deep learning baseline models, each trained and evaluated on one of four distinct feature sets. We further investigated all possible combinations of these feature sets, constructing 11 models using concatenated heterogeneous features. Particularly, WavLM and ImageBind features showed promise, both individually and in combination, prompting us to explore performance enhancements through feature space projection. Notably, classical acoustic features were also integrated in these models as they might provide complementary information when projected and fused with deep embeddings. Additionally, we projected both WavLM and ImageBind features (and Wav2Vec 2.0 in one instance) into a third, co-located latent feature space, subsequently fusing them to create a 512–dimensional feature set for PD classification. Our findings revealed that the model projecting WavLM features into the ImageBind feature dimension outperformed all other configurations. Although the model that projects all three deep embeddings into a 512–dimensional latent space demonstrated the highest (slightly higher than our chosen best), we could not select it as the overall best performing model for being relatively lower in all other metrics. Consequently, our chosen optimal model was solely employed in subsequent external validations as it was tested on two unseen test datasets. Table 4 presents the evaluation metrics for all experimental setups implemented in our study.
| Experimental Setup | AUROC | Accuracy | Sensitivity | Specificity | PPV | NPV |
|---|---|---|---|---|---|---|
| Deep Learning Baselines (Same Model Architecture on Different Feature Set) | ||||||
| Acoustic Feature | 72.79 | 69.95 | 61.54 | 75.20 | 60.75 | 75.81 |
| Wav2Vec2 Embeddings | 75.52 | 71.72 | 51.25 | 82.13 | 59.49 | 76.78 |
| WavLM Embeddings | 85.89 | 81.01 | 56.25 | 93.63 | 81.81 | 80.79 |
| ImageBind Embeddings | 80.42 | 74.26 | 47.50 | 87.89 | 66.67 | 76.67 |
| Fusion Models (Concatenation of Fused Feature Sets) | ||||||
| Acoustic + Wav2Vec2 | 76.39 | 72.41 | 62.82 | 78.40 | 64.47 | 77.17 |
| Acoustic + WavLM | 84.56 | 75.37 | 57.69 | 86.40 | 72.58 | 76.60 |
| Acoustic + Imagebind | 79.28 | 72.91 | 66.67 | 76.80 | 64.20 | 78.69 |
| Wav2Vec2 + WavLM | 84.30 | 75.11 | 46.25 | 89.81 | 69.81 | 76.63 |
| Wav2Vec2 + ImageBind | 81.04 | 72.57 | 56.25 | 80.89 | 60.00 | 78.40 |
| WavLM + ImageBind | 89.39 | 81.01 | 60.00 | 91.02 | 78.69 | 81.82 |
| Acoustic + WavLM + ImageBind | 88.10 | 80.30 | 64.10 | 90.40 | 80.65 | 80.14 |
| Acoustic + WavLM + Wav2Vec2 | 80.03 | 71.92 | 51.28 | 84.80 | 67.80 | 73.61 |
| Acoustic + ImageBind + Wav2Vec2 | 79.73 | 70.44 | 52.56 | 81.60 | 64.06 | 73.38 |
| WavLM + ImageBind + Wav2Vec2 | 89.49 | 82.28 | 75.00 | 85.99 | 73.17 | 87.10 |
| All features | 87.91 | 78.82 | 61.54 | 89.60 | 78.69 | 78.87 |
| Fusion Models (with Projection) | ||||||
| WavLM ImageBind | 88.94 | 85.65 | 75.00 | 91.08 | 81.08 | 87.73 |
| ImageBind WavLM | 88.20 | 81.43 | 71.25 | 86.62 | 73.08 | 85.53 |
| WavLM Acoustic | 86.93 | 77.83 | 69.23 | 83.20 | 72.00 | 81.25 |
| Acoustic WavLM | 85.60 | 75.86 | 67.95 | 80.80 | 68.83 | 80.16 |
| WavLM 512, ImageBind 512 | 88.63 | 78.90 | 67.50 | 84.71 | 69.23 | 83.65 |
| WavLM 512, ImageBind 512, Wav2Vec2 512 | 89.84 | 81.01 | 70.00 | 86.62 | 72.73 | 85.00 |
| Generalizability Tests (with best Fusion Model) | ||||||
| PD Care Facility as Test Set | 82.12 | 74.69 | 71.62 | 82.42 | 91.11 | 53.57 |
| Clinical Setup as Test Set | 78.44 | 70.20 | 77.32 | 65.83 | 58.10 | 82.57 |
3. Discussion
In today’s digital age, mobile devices have become pervasive across global populations, encompassing all age groups. These devices universally feature capabilities for audio recording, providing a practical platform for deploying our speech-based PD screening framework. By simply reciting a standard pangram, users can leverage their mobile devices to conduct preliminary screenings for Parkinson’s Disease. Our research further offers the potential to develop a mobile application utilizing semi-supervised speech models and fusion architecture and could continuously analyze natural speech during phone conversations — with explicit user consent — to detect early signs of PD and generate timely alerts. Such technological advancements significantly diminish the necessity for frequent clinical visits, offering a substantial benefit to individuals in areas where access to specialized neurological care is limited. This approach not only facilitates convenient at-home monitoring but also plays a crucial role in the early detection and managing the progression of PD, potentially altering the course of the disease by enabling earlier therapeutic intervention.
The reduction in unnecessary clinical visits not only alleviates the burden on healthcare systems but also offers significant cost savings for patients. Each avoided visit, which might end up as healthy symptoms, can save patients substantial amounts on consultation fees and associated travel expenses. Our model’s ability to provide PD screening remotely can lead to a more efficient allocation of healthcare resources and financial savings.
Dashtipour et al. (Dashtipour et al., 2018) highlighted that speech impairment affects up to of individuals with PD. In contrast to methods that require sustained phonation, the analysis of free-flow speech provides a more natural and comprehensive assessment of vocal impairments. This approach captures a wider spectrum of vocal characteristics and abnormalities, offering the potential for more accurate and earlier diagnosis than is possible with phonation-based models alone. Furthermore, the assessment of natural speech forms a core component of in-person evaluations as outlined by the MDS-Unified Parkinson’s Disease Rating Scale (MDS-UPDRS) (Goetz et al., 2008), whereas sustained phonations are not explicitly monitored under these guidelines. While our study did not directly analyze continuous speech, the use of pangram utterance closely approximates natural speech patterns. The semi-supervised models employed in this research, which are trained on natural speech, are thus well-suited to capture the speech dynamics indicative of PD, even from the structured utterance of a pangram.
The fusion of features, especially using projection methods, has demonstrated superior performance compared to simple concatenation, as evidenced by the results where models utilizing projection-based fusion outperformed those using concatenated features. For instance, the model projecting WavLM features into the ImageBind dimension achieved an AUROC of and an accuracy of , the highest among tested models. In contrast, models relying solely on concatenated features, such as concatenated WavLM, ImageBind, and Wav2Vec2 features resulted in an AUROC of , which is although marginally higher but a significantly lower overall accuracy of . This discrepancy highlights the inherent advantage of projection-based fusion: it not only aligns different feature sets more effectively but also enhances their synergy. By transforming and adapting each feature set into a common latent space, projection-based fusion mitigates issues such as feature redundancy and scale disparity, which are common in concatenation approaches. As a result, the fused features provide a more comprehensive and discriminative representation, enhancing the model’s ability to discern subtle PD-related variations in speech that might be missed when features are merely concatenated. Such an approach ensures that the model captures complex patterns more effectively, leading to improved diagnostic performance.
Rizzo et al. (Rizzo et al., 2016) reported that the accuracy of PD screening by non-expert clinicians stands at , with a confidence interval of . In contrast, movement disorder specialists achieve a slightly higher accuracy of , albeit with a wider confidence interval ranging from to . Remarkably, our model surpasses these benchmarks, achieving an accuracy of , well within or above these confidence intervals. This performance, coupled with the model’s robust generalization across diverse datasets, highlights its formidable potential when deployed globally. Tested on datasets from a PD care facility and a clinical setup, which were completely unseen during the training phase, our model demonstrated respectable AUROCs of (with accuracy of ) and (with accuracy of , respectively. These results are comparable to, if not better than, those achieved by non-experts, underscoring our model’s ability to provide reliable PD screening. Importantly, by building this model on data from a global population and diverse recording settings, we anticipate that it will significantly enhance accessibility to PD care, especially for underprivileged individuals who lack the opportunity to receive evaluations even from non expert clinicians. Such a model holds promise not only to bridge the gap in healthcare access but also to elevate the standard of PD diagnostics worldwide.
From the statistical significance tests, we have confirmed that our current fusion feature projection model is broadly invariant to demographic diversities and does not exhibit major bias issues. Nonetheless, there are still some under-performing data cohorts characterized by notable misclassification rates, indicating that we should be cautious interpreting the model’s prediction results upon these cohorts. For instance, the model frequently misclassifies younger male individuals between the ages of and , whereas for female individuals, the most error-prone age interval is above . One possible explanation for these differences in model performance could be the distinct vocal mechanism changes and aging patterns between men and women. In females, the epithelium progressively thickens with age, particularly after 70 (Chatterjee and Kumar, 2011), while males exhibit more pronounced structural changes in biological voice mechanisms around the age of 60. Previous studies in human speech spectrograms (Taylor et al., 2020) showed no age effect on spectral energy skewness for females, yet a significant increase with age was observed in males. Another study (Stathopoulos et al., 2011) revealed sex-specific changes in fundamental frequency (F0) and signal-to-noise ratio (SNR) across the human lifespan. Both sexes showed significant nonlinear trends of change for F0, with these trends being more pronounced in males. Females exhibited similar nonlinear trends for SNR, whereas males displayed linear increases in SNR with age. These differences in voice mechanism and acoustic characteristics between the sexes and across different age groups likely influence the raw voice samples collected in our study, affecting the embedded and projected fusion features and, ultimately, the prediction results of the deep learning model. Regardless of the factor of sex, the model exhibited exceeding-the-average error rates in two specific age ranges: to and to . This observation may be linked to general human biological aging patterns that affect the functionality of the vocal apparatus, orofacial muscles, and neural activity, all of which might alter vocal characteristics and influence the performance of free-flow speech, thus leading to increased error rates in the model’s predictions. All the above-mentioned potential associations between PD prediction and changes in human vocal characteristics suggests a need for further research to validate and explore the hypotheses raised. Additionally, misclassification may also stem from differences in native language and phonation habits among ethnic groups. Given the imbalanced ethnicity distribution in the data used for this study, it is crucial to conduct future demographic bias analyses using a more ethnically balanced and diverse dataset. This will help to better understand the impact of ethnicity on model performance and ensure the model’s fairness and effectiveness across different demographic groups. The comparison analysis between the prediction results for PD and non-PD individuals indicated strong specificity () , meaning the model is particularly effective at correctly identifying non-PD individuals. However, it is slightly less effective at correctly identifying PD cases, as indicated by the sensitivity rate () . The precision () and F1 score () suggest a good balance between the identification of true positives and the minimization of false positives, yet the model still seems slightly biased towards avoiding false positives, which aligns with the observation that it is more cautious in classifying PD as non-PD rather than the inverse. We should always be mindful of this observation when utilizing the model’s predictions in reality, and be aware of the the potential impact and corresponding consequences of providing inaccurate estimation to PD patients.
One of the principal limitations we must acknowledge is the limited explainability of our model. While the use of vector embeddings from semi-supervised models like WavLM provides a powerful tool for feature extraction, the black-box nature of these embeddings poses challenges in interpretability. Additionally, our current reliance on English pangrams restricts the model’s applicability to non-English speakers. However, the inherent adaptability of semi-supervised speech models offers a promising avenue for extending our approach to other languages. Ongoing efforts to fine-tune these models for diverse linguistic contexts (von Platen, 2021; Frost et al., 2022) underline their potential versatility. In future work, leveraging the adaptability of these models could significantly broaden the model’s inclusiveness and enhance its global applicability, ensuring that our diagnostic tool can serve a wider array of populations effectively.
The symptoms of Parkinson’s Disease vary widely among individuals. It is important to note that not all individuals with PD exhibit the same range or severity of symptoms. For instance, some may experience significant speech impairments, while others may primarily show motor symptoms like tremors without noticeable changes in their speech patterns. Consequently, our model, which primarily analyzes speech dynamics, may not be universally effective for all PD patients, especially those whose vocal symptoms are less pronounced early in the disease. To enhance the utility and accuracy of PD screening, it would be advantageous to integrate additional modalities such as motor function assessments and cognitive tests into the diagnostic framework. This multimodal approach could provide a more comprehensive understanding of the disease, accommodating the varied manifestations of PD across different individuals.
The implications of this study are broad, extending beyond PD diagnosis. The methodologies developed could be adapted for identifying other speech-related deficiencies, offering a blueprint for future research in neurological disorders. The success of this project highlights the transformative potential of AI in healthcare, particularly in enhancing diagnostic processes through advanced machine learning techniques and accessible digital platforms.
4. Methods
4.1. Dataset Description
4.1.1. Data Collection Framework.
For collecting the speech dataset used in this study, we employed the web-based PARK framework developed by Langevin et al. (Langevin et al., 2019), accessible at https://parktest.net/. Participants worldwide can use this framework to record themselves while performing tasks inspired by the MDS-UPDRS guidelines, which are designed to assess motor symptoms for evaluating PD. One such task involved the articulation of a standard English pangram, ”quick brown fox.” To ensure consistency and proper execution across participants, an instructional video was provided before each task. Additionally, participants were required to complete questionnaires that captured demographic information such as age, sex, ethnicity, PD diagnosis year (for participants with PD), etc. From the video recordings, we extracted audio clips to compile our dataset. Due to some participants providing multiple video/audio samples at different times, we could amass a total of samples for our study.
4.1.2. Data Collection Settings.
We collected the dataset from three distinct settings.
-
•
Home Recorded: We gathered a major portion of our dataset from participants who recorded themselves staying at home using the PARK tool. We reached these participants by advertising our PARK tool on social media. We also contacted individuals through email who were willing to contribute to PD research. Despite being a global effort, we could only collect data from ( of this cohort) PD participants. In this data collection setup the labels of the participants (PD or control) were self-reported.
-
•
Clinical Setup: In collaboration with the University of Rochester Medical Center (URMC) in New York, participants in a clinical study recorded themselves using the PARK tool. This setting ensured some supervision by clinical staff, particularly for those participants who required assistance during the recording. The participants of this cohort were clinically confirmed to be PD or control. Almost of the total PD participants are from this cohort.
-
•
PD Care Facility: Our last data collection site was InMotion333https://beinmotion.org/, a PD care facility in Ohio, US. We could collect the video/audio data from their clients as clinically confirmed PD patients and their caregivers as self-reported controls. This environment provided a supportive setting for participants, typically involving assistance from their caregivers and/or the InMotion’s staff during recording sessions. We collect the major portion of PD samples () from this setup.
4.1.3. Data Demographic Details.
In this study, we collected data samples across a broad spectrum of demographic subgroups targeting a comprehensive analysis of PD across diverse populations. The dataset notably achieved a balanced representation in terms of gender, with female participants and male participants. However, the demographic distribution reveals a predominance of white participants, accounting for of the total cohort, with one fourth of the total participants opting not to disclose their ethnicity, reflecting challenges in capturing complete demographic data. The age of participants ranged widely from to years, with the bulk of the dataset comprising individuals aged years, representing of the total. This age distribution is particularly relevant given that PD prevalence increases with age. The least represented age group was those below years, which is consistent with the lower incidence of PD among younger individuals. Additionally, the data was collected from varied recording environments as described in the preceding subsection to mimic real-world conditions as closely as possible and enhance the external validity of our study results. A significant proportion of the data, , was recorded in home settings, underscoring the accessibility and convenience of the data collection methodology. This was followed by from clinical setups and from the PD care centers. Comprehensive demographic details, including additional statistics on the participant cohort, are presented in Table 1.
4.1.4. Data Cleaning.
The efficacy of machine learning models greatly depends on the quality of the dataset they are trained on. To ensure the integrity and enhance the utility of our dataset for model training, we undertook a meticulous data cleaning and preparation process. Our dataset primarily consists of in-the-wild videos captured under various conditions, which presents unique challenges for standardization. To address these challenges, we first developed a pipeline to convert raw WEBM video files into MP4 format, ensuring consistent frames per second (fps) and uniform metadata across all files. Following the standardization of video formats, the audio content critical for our analysis was isolated. Each video was processed to extract the audio track, converting it into a WAV file sampled at 16 kHz, suitable for detailed acoustic analysis. We employed the Whisper model (Radford et al., 2023) to identify segments within the audio where the pangram is recited. This model efficiently generates start and end timestamps for each detected sentence, allowing us to precisely locate the spoken content relevant to our study. We subsequently verified the presence of key words from our pangram – ‘quick,’ ‘brown,’ ‘fox,’ ‘dog,’ ‘forest.’ For segments that contained these keywords, we defined our clip using the start timestamp of the first occurrence and the end timestamp of the last occurrence of the keywords. To ensure no contextual audio cues were lost, the video was trimmed to include an additional 0.5 seconds before the start and after the end of the selected segment. Finally the segmented audio clip was saved in WAV format to form the final speech dataset for our study.
4.2. Digital Speech Feature Extraction
In this study, we aim to objectively and quantitatively capture the nuanced speech dynamics that can be pivotal in differentiating PD characteristics. To achieve this, we extracted a series of classical acoustic features alongside advanced deep learning embeddings using state-of-the-art models such as Wav2Vec2 (Baevski et al., 2020), WavLM (Chen et al., 2022), and ImageBind (Girdhar et al., 2023). The remaining part of this subsections detail the methodologies employed for each type of feature extraction.
4.2.1. Classical Acoustic Features
We extracted classical acoustic features that are proven to be crucial in the literature in characterizing speech disorders associated with PD (Little et al., 2007; Rahman et al., 2021; Cantürk and Karabiber, 2016). These features include Mel-frequency cepstral coefficients (MFCCs) (Saldanha et al., 2023; Hawi et al., 2022), jitter (Saldanha et al., 2023; Upadhya et al., 2017), shimmer (Upadhya et al., 2017; Cantürk and Karabiber, 2016), and pitch-related metrics (Rusz et al., 2011; Liu et al., 2012):
-
•
MFCCs: MFCCs provide a representation of the short-term power spectrum of sound, based on a linear cosine transform of a log power spectrum on a nonlinear mel scale of frequency (Rabiner, 1978).
-
•
Jitter: Measures frequency variations from cycle to cycle, offering insights into the stability of vocal fold vibrations (Sataloff, 2017).
-
•
textbfShimmer: Quantifies amplitude variations, useful in assessing vocal fold closure inconsistencies (Sataloff, 2017).
-
•
Pitch: This feature encapsulates the fundamental frequency, providing crucial information on the tonal aspects of the speech (Titze and Martin, 1998).
Tools such as Praat (Boersma and Van Heuven, 2001; Styler, 2013) and Parselmouth (Jadoul et al., 2018) were utilized to calculate these features from the digitized voice recordings of the participants.
4.2.2. Deep Embedding Features
One of the major contributions of our study is the use of deep embeddings of the speech audio extracted by three distinct pre-trained deep learning models: Wav2Vec 2.0 (W2V2), WavLM, and ImageBind.
-
•
Wav2Vec 2.0 (W2V2): Developed by Facebook AI, Wav2Vec 2.0 utilizes a self-supervised learning approach to directly process the raw audio waveform and learn robust representations. The model is trained to predict masked segments of the audio input, leveraging context from surrounding audio to generate high-quality embeddings that capture underlying speech. characteristics (Baevski et al., 2020).
-
•
WavLM: Building on the success of Wav2Vec 2.0, WavLM from Microsoft enhances the model’s ability to handle diverse acoustic environments, including noisy backgrounds and overlapping speech. This is achieved through a self-supervised multi-task learning framework that helps the model to better generalize across different speaking conditions, making it highly effective for applications in real-world scenarios (Chen et al., 2022).
-
•
ImageBind: A novel approach introduced by Meta AI, ImageBind is designed to exploit the synergy between visual and audio modalities. By training on paired datasets of images and corresponding audio, the model learns to create embeddings that reflect not just the audio content but also its relation to visual elements, enhancing the ability to discern nuanced variations in speech possibly linked to neurological conditions like PD (Girdhar et al., 2023).
Using these deep-learning models, we extracted intermediate vector representations of the raw aido files directly from their last hidden layers, capturing the most sophisticated and informative features of the speech data. The inclusion of deep learning embeddings in our study aims to leverage the advanced feature extraction capabilities of these models, which can detect subtle and complex patterns in speech that traditional methods may overlook. The choice of these specific models was driven by their proven effectiveness in various audio processing tasks and their potential to offer new insights into the acoustic anomalies associated with PD.
4.3. Model Development and Evaluation
4.3.1. Data Pre-processing
Before starting the training phase, several data pre-processing steps were employed to optimize the dataset for effective machine learning model training. Initially, a correlation matrix was generated among the feature set, and features exhibiting a correlation coefficient above a predefined threshold were considered for elimination. This threshold and the decision to drop correlated features were set as tunable parameters, allowing for flexibility and optimization based on the specific characteristics of our dataset. To ensure that no single feature dominates due to its scale, two scaling methods were considered: MinMaxScaler and StandardScaler. Another significant challenge addressed was the imbalance in the dataset. In all cohorts, the proportion of PD samples was approximately half that of control samples. Imbalanced datasets can lead to biased models that overfit the majority class and underperform in predicting the minority class, which, in this case, was the PD class. To mitigate this issue, the Synthetic Minority Over-sampling Technique (SMOTE) (Chawla et al., 2002) was utilized to oversample the PD class. SMOTE creates synthetic samples from the minority class rather than merely duplicating existing samples, thus providing a more balanced dataset and enhancing the generalization capabilities of our model. The decisions to employ specific scalers and to apply SMOTE were also configured as tunable parameters.
4.3.2. Baseline Modeling
Following the setup of our data pre-processing and model development pipeline, we conducted initial baseline experiments. Our pre-processing pipeline is designed to be feature agnostic, which enabled us to independently train models on different features (Classical, W2V2, WavLM, ImageBind) To design the baseline DL models, we used the four different feature sets to train a single fully connected classification layer (ShallowANN) with sigmoid activation or additional hidden layer before the final output layer (ANN). The choice of ShallowANN or ANN was kept as a hyper parameter choice during the performance optimization phase.
4.3.3. Fusion Modeling
In our study, we explored several strategies to fuse multiple feature sets, enhancing the robustness and accuracy of the resulting models. We began with a simple vector concatenation approach, where distinct feature sets were merged into a single dataset. This basic concatenation strategy allowed us to establish a baseline for further fusion methods. Using the concatenated datasets, we trained both shallow and deep neural networks (ShallowANN and ANN) to assess the performance of combined features.
Moving beyond simple concatenation, we implemented a more sophisticated hybrid fusion approach using projection and reconstruction techniques. In this model configuration, known as Projection Shallow ANN and Projection ANN, all modalities except one were projected into a common dimension. These projected features were then combined and processed through neural network layers to produce the final output while attempting to reconstruct the original input dimensions for all modalities. This method aims to leverage the complementary information from different modalities while preserving the ability to reconstruct the original data, thus maintaining data integrity throughout the model processing.
The reasoning behind our use of projection techniques is grounded in the need to improve feature alignment, reduce noise, and maintain consistency across modalities (Veli et al., 2022; Wang et al., 2019). For example, by aligning WavLM features directly into ImageBind’s multi-modal latent space (our best performing model), we not only simplified the model architecture but also enhanced cross-modal learning capabilities (Lu et al., 2019; Li et al., 2019). This approach addresses the limitations of concatenation, which can introduce noise and redundancy due to misaligned features and increased dimensionality (Lin et al., 2021). The projection technique ensures that features are consistently aligned, minimizing overfitting and maximizing the generalization potential across modalities. Furthermore, the utilization of projection techniques is supported by contemporary research in multimodal learning (Lei et al., 2022; Tan and Bansal, 2019), which includes various applications where different data types are aligned into a common representational space (Chen et al., 2020; Kim et al., 2021). For instance, the Multimodal Video Transformer (MMV) Chen and Ho (2022) and Multimodal Masked Autoencoder (Geng et al., 2022) are notable examples where projection techniques facilitate the learning of joint representations from audio and visual data, enhancing action recognition and pretraining effectiveness, respectively.
4.3.4. Evaluation Metrics
To evaluate the performance of our deep learning models, we employed a set of metrics that are well-recognized and valued in clinical settings. These include the Area Under the Receiver Operating Characteristic (AUROC) score, Accuracy, Sensitivity (also known as true positive rate), Specificity (true negative rate), Positive Predictive Value (PPV), and Negative Predictive Value (NPV) Each metric offers a distinct perspective on the model’s diagnostic ability, facilitating a comprehensive assessment of its performance in clinical applications. Visual tools such as AUROC curves and confusion matrices were utilized to represent the model’s performance clearly. The AUROC curve provides a graphical view of the model’s ability to discriminate between conditions, while confusion matrices offer a detailed breakdown of true positives, false positives, true negatives, and false negatives, crucial for understanding the model’s predictive dynamics in real-world settings. The model that demonstrated the highest AUROC score during the validation phase was selected for further evaluation. This chosen model was subsequently assessed on the test set using the above metrics, ensuring rigorous verification of its clinical relevance and effectiveness.
4.3.5. Cohort-based Error Analysis
After evaluating the basic model performances using varies metrics such as AUROC, accuracy, sensitivity, specificity, NPV, and PPV, we recorded both the predicted PD labels and the true labels of the current best-performing fusion model with projection. This fusion model utilizes deep learning architecture and fusion features, which generally offer limited intuitive interpretability and explanation of the model’s decisions, as well as challenges in identifying when and why the model errs. To address this, we employed Microsoft’s Error Analysis SDK (Shiryaev et al., 2021) to visualize the error rates and characteristics of misclassified data instances. Unlike statistical bias analysis, this error analysis focuses on identifying cohorts within the test set that exhibit notably high error coverage (representing the percentage of errors concentrated within the selection out of all errors present in the dataset) and error rates. The pipeline follows:
-
•
The data was cleaned by excluding entries with any of the three demographic information categories of age, sex, or ethnicity as missing. Subsequently, the test set was consolidated to include combinations of true PD labels, predicted PD labels, and the corresponding demographic features of each participant whose audio information contributed to the model’s prediction results.
-
•
A decision-tree-like hierarchical structure was employed to systematically distinguish error instances from successes within the data. The decision boundaries of demographic features and the hierarchical arrangement facilitate the identification of prevalent error patterns. By tracing this hierarchy, cohorts exhibiting notably high error coverage and error rates were pinpointed, with consideration given to precision and sensitivity.
-
•
The data was then divided into cohorts exhibiting different combinations of demographic characteristics to determine if any specific combination was correlated with high prediction errors and if any interpretable prediction patterns were evident. Additionally, within each uni-demographic cohort, individuals with and without PD were examined separately. The combinations of cohort categories included {{sex ethnicity}, {sex age}, {age ethnicity}, {sex true PD labels}, {age true PD labels}, {ethnicity true PD labels}}. Heat maps of error rates, error coverage, precision, and sensitivity were generated of each of the combination subgroups.
Based on the decision tree maps and heat maps, we compared the visualization of the cohorts’ error rates and error coverage, then analyzed whether the selected fusion model under-performed or outperformed on certain demographic subgroups and identified potential triggers for such observations.
4.3.6. Statistical Bias Analysis
To ensure that our screening framework operates equitably across diverse populations, a comprehensive bias analysis was undertaken to scrutinize the model’s performance across various demographic subgroups. These subgroups were delineated by gender, ethnicity, age, and data collection setting providing a nuanced understanding of the model’s accuracy within specific cohorts.
For every test instance, we recorded the model’s prediction and associated it with the participant’s demographic data and verified (or self-reported) PD status, ensuring a comprehensive dataset for our bias analysis. In cases where demographic attributes were not reported, the corresponding participants were excluded from subgroup-specific analyses to maintain the integrity of the results.
We applied z-test for proportions, a statistical method used to determine whether the proportion of correct predictions – a measure of accuracy – differed significantly between subgroups. The z-test is computed using the formula:
where:
-
•
and are the sample proportions of correct predictions for the two groups being compared.
-
•
is the pooled proportion of correct predictions, calculated as , with and being the number of correct predictions in each group and and being the number of observations in each group.
-
•
and are the sample sizes of the two groups.
Applying this formula, we compared each subgroup’s accuracy to determine any significant deviations, adhering to a confidence level for our significance threshold. This rigorous statistical approach ensured that we could confidently identify and address any disparities in model performance, thus upholding the commitment to inclusivity and effectiveness for all potential users regardless of demographic differences.
4.3.7. Hyperparameter Tuning
Hyperparameter tuning (Victoria and Maragatham, 2021; Feurer and Hutter, 2019) is integral to optimizing the performance of machine learning models, particularly to enhance their predictive capabilities. In our study, both the Baseline Modeling and Fusion approaches underwent an extensive tuning process. The objective was to maximize the Area Under the Receiver Operating Characteristic (AUROC) of the validation set, a primary metric for model selection. We utilized Weights & Biases (WandB) (Biewald, 2020), a sophisticated tool that facilitates systematic exploration of the parameter space using a Bayesian optimization approach. This method allowed us to iterate over numerous combinations of hyperparameters to find the setup that yielded the best performance across our models. These parameters included choices between different model architectures (ANN and ShallowANN), batch sizes, learning rates, and optimization algorithms (AdamW and SGD), among others.
For instance, we adjusted batch sizes within the range of 128 to 1024, learning rates from 0.001 to 0.8, and explored both StandardScaler and MinMaxScaler for feature scaling. Parameters such as the correlation threshold for dropping correlated features were set between 0.8 and 0.95, allowing us to test the impact of different levels of feature correlation on model performance. Additionally, options like the use of oversampling techniques (SMOTE) (Chawla et al., 2002) to balance class distributions were considered to address the challenges posed by dataset imbalances. The hyperparameter tuning not only involved baseline models but also extended to our hybrid fusion approaches. In these advanced models, we introduced additional tunable parameters such as different projection dimensions and directions, along with a selection of functions for calculating reconstructive loss, including MSE, L1, Huber, and KL divergence. The careful calibration of these parameters was crucial for enhancing the generalizability and efficacy of the models, ensuring optimal performance across diverse datasets and conditions.
Code and Data Availability
In accordance with the Health Insurance Portability and Accountability Act (HIPAA), we are unable to distribute the original audio recordings as they might reveal identifiable information about the participants. Nevertheless, upon acceptance of this manuscript, we will make publicly available the code for the feature extraction pipeline, the de-identified extracted features, and the model training scripts, thereby supporting transparency and reproducibility of our research.
Acknowledgement
We express our profound gratitude to Meghan Pawlik for her substantial contributions to the maintenance of the clinical studies and the data collection. Cathe Schwartz and Karen Jaffe from the designated PD Care Center were instrumental in gathering data. Amir Zadeh provided pivotal guidance throughout the project, helping to steer its direction and focus. Additionally, we are thankful to Sangwu Lee for his meticulous feedback on the manuscript and his invaluable assistance in debugging the code.
Competing Interests
All the authors declare that there are no competing interests.
Author Contributions
TA, AA, and MSI conceptualized the study and designed the experimental framework. AA and MSI were responsible for developing the feature extraction pipelines, while also collaborating on the development of the baseline machine learning models using individual feature sets. AA crafted the fusion models using concatenation techniques, whereas TA and MEH focused on advancing the projection-based fusion architecture. Together, AA, TA, and MEH engaged in model evaluation, results analysis, visualization, and manuscript preparation. RL and SP significantly contributed to error visualization and statistical analysis. All authors critically reviewed the manuscript, providing substantial revisions and improvements as needed. EH, as the principal investigator, supervised the entire project, providing strategic direction and refining the manuscript’s narrative.
References
- (1)
- Adnan et al. (2023) Tariq Adnan, Md Saiful Islam, Wasifur Rahman, Sangwu Lee, Sutapa Dey Tithi, Kazi Noshin, Imran Sarker, M Saifur Rahman, and Ehsan Hoque. 2023. Unmasking Parkinson’s Disease with Smile: An AI-enabled Screening Framework. arXiv preprint arXiv:2308.02588 (2023).
- Baevski et al. (2020) Alexei Baevski, Yuhao Zhou, Abdelrahman Mohamed, and Michael Auli. 2020. wav2vec 2.0: A framework for self-supervised learning of speech representations. Advances in neural information processing systems 33 (2020), 12449–12460.
- Biewald (2020) Lukas Biewald. 2020. Experiment Tracking with Weights and Biases. https://www.wandb.com/ Software available from wandb.com.
- Boersma and Van Heuven (2001) Paul Boersma and Vincent Van Heuven. 2001. Speak and unSpeak with PRAAT. Glot International 5, 9/10 (2001), 341–347.
- Cantürk and Karabiber (2016) İsmail Cantürk and Fethullah Karabiber. 2016. A machine learning system for the diagnosis of Parkinson’s disease from speech signals and its application to multiple speech signal types. Arabian Journal for Science and Engineering 41 (2016), 5049–5059.
- Chatterjee and Kumar (2011) Indranil Chatterjee and Suman Kumar. 2011. An Analytical Study of Age and Gender Effects on Voice Range Profile in Bengali Adult Speakers using Phonetogram. International Journal of Phonosurgery and Laryngology (2011). https://www.ijopl.com/doi/pdf/10.5005/jp-journals-10023-1016
- Chawla et al. (2002) Nitesh V Chawla, Kevin W Bowyer, Lawrence O Hall, and W Philip Kegelmeyer. 2002. SMOTE: synthetic minority over-sampling technique. Journal of artificial intelligence research 16 (2002), 321–357.
- Chen and Ho (2022) Jiawei Chen and Chiu Man Ho. 2022. MM-ViT: Multi-modal video transformer for compressed video action recognition. In Proceedings of the IEEE/CVF winter conference on applications of computer vision. 1910–1921.
- Chen et al. (2022) Sanyuan Chen, Chengyi Wang, Zhengyang Chen, Yu Wu, Shujie Liu, Zhuo Chen, Jinyu Li, Naoyuki Kanda, Takuya Yoshioka, Xiong Xiao, et al. 2022. Wavlm: Large-scale self-supervised pre-training for full stack speech processing. IEEE Journal of Selected Topics in Signal Processing 16, 6 (2022), 1505–1518.
- Chen et al. (2020) Yen-Chun Chen, Linjie Li, Licheng Yu, Ahmed El Kholy, Fahad Ahmed, Zhe Gan, Yu Cheng, and Jingjing Liu. 2020. UNITER: UNiversal Transformer for aligning Vision and Language via Cross-modal Attention Transfer. arXiv preprint arXiv:1909.11776 (2020).
- Chowdhury et al. (2014) Rajib Nayan Chowdhury, ATM Hasibul Hasan, Yusuf Ur Rahman, Shafikul Islam Khan, Ahmed Riyad Hussain, and Shamim Ahsan. 2014. Pattern of neurological disease seen among patients admitted in tertiary care hospital. BMC research notes 7 (2014), 1–5.
- Dashtipour et al. (2018) Khashayar Dashtipour, Ali Tafreshi, Jessica Lee, and Brianna Crawley. 2018. Speech disorders in Parkinson’s disease: pathophysiology, medical management and surgical approaches. Neurodegenerative disease management 8, 5 (2018), 337–348.
- Dorsey et al. (2007) ERlet al Dorsey, R Constantinescu, JP Thompson, KM Biglan, RG Holloway, K Kieburtz, FJ Marshall, BM Ravina, G Schifitto, A Siderowf, et al. 2007. Projected number of people with Parkinson disease in the most populous nations, 2005 through 2030. Neurology 68, 5 (2007), 384–386.
- Dorsey et al. (2016) E Ray Dorsey, Floris P Vlaanderen, Lucien JLPG Engelen, Karl Kieburtz, William Zhu, Kevin M Biglan, Marjan J Faber, and Bastiaan R Bloem. 2016. Moving Parkinson care to the home. Movement Disorders 31, 9 (2016), 1258–1262.
- Dubey et al. (2015) Harishchandra Dubey, Jon C Goldberg, Mohammadreza Abtahi, Leslie Mahler, and Kunal Mankodiya. 2015. EchoWear: smartwatch technology for voice and speech treatments of patients with Parkinson’s disease. In Proceedings of the conference on Wireless Health. 1–8.
- Feurer and Hutter (2019) Matthias Feurer and Frank Hutter. 2019. Hyperparameter optimization. Automated machine learning: Methods, systems, challenges (2019), 3–33.
- Forkan et al. (2019) Abdur Rahim Mohammad Forkan, Philip Branch, Prem Prakash Jayaraman, and Andre Ferretto. 2019. An Internet-of-Things solution to assist independent living and social connectedness in elderly. ACM Transactions on Social Computing 2, 4 (2019), 1–24.
- Frid et al. (2016) Alex Frid, Ariel Kantor, Dimitri Svechin, and Larry M Manevitz. 2016. Diagnosis of Parkinson’s disease from continuous speech using deep convolutional networks without manual selection of features. In 2016 IEEE International Conference on the Science of Electrical Engineering (ICSEE). IEEE, 1–4.
- Frost et al. (2022) Geoffrey Frost, Emily Morris, Joshua Jansen van Vüren, and Thomas Niesler. 2022. Fine-Tuned Self-supervised Speech Representations for Language Diarization in Multilingual Code-Switched Speech. In Southern African Conference for Artificial Intelligence Research. Springer, 246–259.
- Geng et al. (2022) Xinyang Geng, Hao Liu, Lisa Lee, Dale Schuurmans, Sergey Levine, and Pieter Abbeel. 2022. Multimodal masked autoencoders learn transferable representations. arXiv preprint arXiv:2205.14204 (2022).
- Girdhar et al. (2023) Rohit Girdhar, Alaaeldin El-Nouby, Zhuang Liu, Mannat Singh, Kalyan Vasudev Alwala, Armand Joulin, and Ishan Misra. 2023. Imagebind: One embedding space to bind them all. In Proceedings of the IEEE/CVF Conference on Computer Vision and Pattern Recognition. 15180–15190.
- Goetz et al. (2008) Christopher G Goetz, Barbara C Tilley, Stephanie R Shaftman, Glenn T Stebbins, Stanley Fahn, Pablo Martinez-Martin, Werner Poewe, Cristina Sampaio, Matthew B Stern, Richard Dodel, et al. 2008. Movement Disorder Society-sponsored revision of the Unified Parkinson’s Disease Rating Scale (MDS-UPDRS): scale presentation and clinimetric testing results. Movement disorders: official journal of the Movement Disorder Society 23, 15 (2008), 2129–2170.
- Hawi et al. (2022) Sara Hawi, Jana Alhozami, Raneem AlQahtani, Dannah AlSafran, Maram Alqarni, and Lola El Sahmarany. 2022. Automatic Parkinson’s disease detection based on the combination of long-term acoustic features and Mel frequency cepstral coefficients (MFCC). Biomedical Signal Processing and Control 78 (2022), 104013.
- Hsu et al. (2021) Wei-Ning Hsu, Benjamin Bolte, Yao-Hung Hubert Tsai, Kushal Lakhotia, Ruslan Salakhutdinov, and Abdelrahman Mohamed. 2021. HuBERT: Self-Supervised Speech Representation Learning by Masked Prediction of Hidden Units. arXiv:2106.07447 [cs.CL]
- Islam et al. (2023) Md Saiful Islam, Wasifur Rahman, Abdelrahman Abdelkader, Sangwu Lee, Phillip T Yang, Jennifer Lynn Purks, Jamie Lynn Adams, Ruth B Schneider, Earl Ray Dorsey, and Ehsan Hoque. 2023. Using AI to measure Parkinson’s disease severity at home. npj Digital Medicine 6, 1 (2023), 156.
- Jadoul et al. (2018) Yannick Jadoul, Bill Thompson, and Bart De Boer. 2018. Introducing parselmouth: A python interface to praat. Journal of Phonetics 71 (2018), 1–15.
- Khan et al. (2014) Taha Khan, Jerker Westin, and Mark Dougherty. 2014. Classification of speech intelligibility in Parkinson’s disease. Biocybernetics and Biomedical Engineering 34, 1 (2014), 35–45.
- Kim et al. (2021) Wonjae Kim, Bokyung Son, and Ildoo Kim. 2021. Vilt: Vision-and-language transformer without convolution or region supervision. In International conference on machine learning. PMLR, 5583–5594.
- Kissani et al. (2022) Najib Kissani, Laila Liqali, Khaoula Hakimi, Jacob Mugumbate, Gams Massi Daniel, Eetedal Ahmed A Ibrahim, Enat Yewnetu, Mofou Belo, Jo Wilmshurst, Pascal Mbelesso, et al. 2022. Why does Africa have the lowest number of Neurologists and how to cover the Gap? Journal of the Neurological Sciences 434 (2022), 120119.
- Klempíř et al. (2023) Ondřej Klempíř, David Příhoda, and Radim Krupička. 2023. Evaluating the Performance of wav2vec Embedding for Parkinson’s Disease Detection. Measurement Science Review 23, 6 (2023), 260–267.
- Langevin et al. (2019) Raina Langevin, Mohammad Rafayet Ali, Taylan Sen, Christopher Snyder, Taylor Myers, E Ray Dorsey, and Mohammed Ehsan Hoque. 2019. The PARK framework for automated analysis of Parkinson’s disease characteristics. Proceedings of the ACM on Interactive, Mobile, Wearable and Ubiquitous Technologies 3, 2 (2019), 1–22.
- Lei et al. (2022) Jie Lei, Luowei Li, Luchen Zhou, Zhangyang Gan, Wenbin Zhang, Xu Wang, Wenjie Wang, and Xudong Chang. 2022. UniVL: A Unified Video and Language Pre-training Model for Multimodal Understanding and Generation. arXiv preprint arXiv:2202.03828 (2022).
- Li et al. (2019) Liunian Harold Li, Mark Yatskar, Da Yin, Cho-Jui Hsieh, and Kai-Wei Chang. 2019. VisualBERT: A Simple and Performant Baseline for Vision and Language. arXiv preprint arXiv:1908.03557 (2019).
- Lin et al. (2021) Yuchen Lin, Huan Li, Xuancheng Tan, Siqu Ren, Sheng Liu, Chang Xu, Hao Ji, Liang Ding, Yao Xi, and Maosong Sun. 2021. Efficient Transformer for Multimodal Machine Translation. In Proceedings of the 2021 Conference on Empirical Methods in Natural Language Processing. 8066–8076.
- Little et al. (2007) Max Little, Patrick Mcsharry, Stephen Roberts, Declan Costello, and Irene Moroz. 2007. Exploiting nonlinear recurrence and fractal scaling properties for voice disorder detection. Nature Precedings (2007), 1–1.
- Liu et al. (2012) Hanjun Liu, Emily Q Wang, Leo Verhagen Metman, and Charles R Larson. 2012. Vocal responses to perturbations in voice auditory feedback in individuals with Parkinson’s disease. PloS one 7, 3 (2012), e33629.
- Lu et al. (2019) Jiasen Lu, Dhruv Batra, Devi Parikh, and Stefan Lee. 2019. ViLBERT: Pretraining Task-Agnostic Visiolinguistic Representations for Vision-and-Language Tasks. arXiv preprint arXiv:1908.02265 (2019).
- Morel et al. (2022) Thomas Morel, Sophie Cleanthous, John Andrejack, Roger A Barker, Geraldine Blavat, William Brooks, Paul Burns, Stefan Cano, Casey Gallagher, Lesley Gosden, et al. 2022. Patient experience in early-stage Parkinson’s disease: Using a mixed methods analysis to identify which concepts are cardinal for clinical trial outcome assessment. Neurology and Therapy 11, 3 (2022), 1319–1340.
- Rabiner (1978) LR Rabiner. 1978. Digital Processing of Speech Signals. Prentice Hall google schola 2 (1978), 601–604.
- Radford et al. (2023) Alec Radford, Jong Wook Kim, Tao Xu, Greg Brockman, Christine McLeavey, and Ilya Sutskever. 2023. Robust speech recognition via large-scale weak supervision. In International Conference on Machine Learning. PMLR, 28492–28518.
- Rahman et al. (2021) Wasifur Rahman, Sangwu Lee, Md Saiful Islam, Victor Nikhil Antony, Harshil Ratnu, Mohammad Rafayet Ali, Abdullah Al Mamun, Ellen Wagner, Stella Jensen-Roberts, Emma Waddell, et al. 2021. Detecting parkinson disease using a web-based speech task: Observational study. Journal of medical Internet research 23, 10 (2021), e26305.
- Rizzo et al. (2016) Giovanni Rizzo, Massimiliano Copetti, Simona Arcuti, Davide Martino, Andrea Fontana, and Giancarlo Logroscino. 2016. Accuracy of clinical diagnosis of Parkinson disease: a systematic review and meta-analysis. Neurology 86, 6 (2016), 566–576.
- Rusz et al. (2011) Jan Rusz, Roman Cmejla, Hana Ruzickova, and Evzen Ruzicka. 2011. Quantitative acoustic measurements for characterization of speech and voice disorders in early untreated Parkinson’s disease. The journal of the Acoustical Society of America 129, 1 (2011), 350–367.
- Saldanha et al. (2023) Jennifer C Saldanha, Malini Suvarna, Dayakshini Satish, and Cynthia Santhmayor. 2023. Jitter as a quantitative indicator of dysphonia in Parkinson’s disease. International Journal of Intelligent Systems Technologies and Applications 21, 2 (2023), 199–228.
- Sataloff (2017) Robert Thayer Sataloff. 2017. Voice science. Plural Publishing.
- Schalkamp et al. (2023) Ann-Kathrin Schalkamp, Kathryn J Peall, Neil A Harrison, and Cynthia Sandor. 2023. Wearable movement-tracking data identify Parkinson’s disease years before clinical diagnosis. Nature Medicine 29, 8 (2023), 2048–2056.
- Shiryaev et al. (2021) Andrey Shiryaev, Hana Aronowitz, Eyal Walach, Sanika Chowdhury, and Ashish Sharma. 2021. Responsible Machine Learning with Error Analysis. https://techcommunity.microsoft.com/t5/ai-machine-learning-blog/responsible-machine-learning-with-error-analysis/ba-p/2141774. Accessed: 2024-05-10.
- Stathopoulos et al. (2011) Elaine T. Stathopoulos, Jessica E. Huber, and Joan E. Sussman. 2011. Age-Related Changes in Speech and Voice: Spectral and Cepstral Measures. Journal of speech, language, and hearing research : JSLHR 54, 4 (2011), 1011–1021. https://doi.org/10.1044/1092-4388(2010/10-0036)
- Styler (2013) Will Styler. 2013. Using Praat for linguistic research. University of Colorado at Boulder Phonetics Lab (2013).
- Tan and Bansal (2019) Hao Tan and Mohit Bansal. 2019. Lxmert: Learning cross-modality encoder representations from transformers. arXiv preprint arXiv:1908.07490 (2019).
- Taylor et al. (2020) Sammi Taylor, Christopher Dromey, Shawn Nissen, and Kristine Tanner. 2020. Age-Related Changes in Speech and Voice: Spectral and Cepstral Measures. Journal of speech, language, and hearing research : JSLHR 63, 3 (2020), 647–660. https://doi.org/10.1044/2019_JSLHR-19-00028
- Titze and Martin (1998) Ingo R Titze and Daniel W Martin. 1998. Principles of voice production.
- Umapathy et al. (2005) Karthikeyan Umapathy, Sridhar Krishnan, Vijay Parsa, and Donald G Jamieson. 2005. Discrimination of pathological voices using a time-frequency approach. IEEE Transactions on Biomedical Engineering 52, 3 (2005), 421–430.
- Upadhya et al. (2017) Savitha S Upadhya, AN Cheeran, and JH Nirmal. 2017. Statistical comparison of Jitter and Shimmer voice features for healthy and Parkinson affected persons. In 2017 second international conference on electrical, computer and communication technologies (ICECCT). IEEE, 1–6.
- Veli et al. (2022) Issa Veli, Jianmo Hao, Alexander G Schwing, and Quoc V Le. 2022. Transformer Dissection: An Unified Understanding for Transformer’s Attention via the Lens of Kernel. arXiv preprint arXiv:2202.03452 (2022).
- Victoria and Maragatham (2021) A Helen Victoria and G Maragatham. 2021. Automatic tuning of hyperparameters using Bayesian optimization. Evolving Systems 12 (2021), 217–223.
- von Platen (2021) Patrick von Platen. 2021. Fine-Tune XLSR-Wav2Vec2 for low-resource ASR with ~ Transformers. https://huggingface.co/blog/fine-tune-xlsr-wav2vec2. Accessed: 2024-05-10.
- Wang et al. (2019) Xuezhi Wang, Tao Qin, Xiang Liu, Xuanjing Huang, Fenglong Zhou, Zhongqin Zhang, Jingyi Zhu, Li Wen, and Yongdong Jin. 2019. Alignment by Agreement. In Proceedings of the 2019 Conference on Empirical Methods in Natural Language Processing and the 9th International Joint Conference on Natural Language Processing. 3184–3192.
- Yang et al. (2022) Yuzhe Yang, Yuan Yuan, Guo Zhang, Hao Wang, Ying-Cong Chen, Yingcheng Liu, Christopher G Tarolli, Daniel Crepeau, Jan Bukartyk, Mithri R Junna, et al. 2022. Artificial intelligence-enabled detection and assessment of Parkinson’s disease using nocturnal breathing signals. Nature medicine 28, 10 (2022), 2207–2215.