Color Dependence of Dipole in CatWISE2020 Data
Abstract
The signal of dipole anisotropy in quasar number counts is studied using the CatWISE2020 catalog in various color bins. It is found that the dipole signal differs significantly in two color bins, namely, and . The color bin appears strongly contaminated, with possibly Galactic contributions and is unreliable for extracting the signal of cosmological dipole. The source of this contamination has not been identified and cannot be attributed to known emissions within the galaxy. Removing this contaminated color bin leads to a strong dipole signal with a direction significantly different from that obtained from full data. If we interpret this dipole as due to our local motion, the extracted velocity turns out to be Kms-1, which deviates from the CMB dipole velocity with approximately sigma significance.
keywords:
large-scale structure of Universe – quasars:general – cosmology:miscellaneous1 Introduction
The standard CDM model is based on the cosmological principle (CP), which asserts that the Universe is isotropic and homogeneous on a sufficiently large distance scale. The precise distance scale at which this applies is so far unknown, although it is generally believed to be of order Mpc. The CP naturally sets a preferred frame, also known as the cosmic rest frame (CRF), in which the cosmological observations appear isotropic and homogeneous. On theoretical grounds, the cosmological principle may be justified by inflation. The basic idea is that, at the beginning of time, the Universe may have a complicated structure, but during inflation, the observable part of the Universe becomes isotropic and homogeneous. This has been explicitly shown for a limited class of models, in which an initially anisotropic Universe acquires isotropy within the first e-fold of inflation Wald (1983). However, this hypothesis directly suggests a limitation of the cosmological principle. For example, the perturbative modes originating during or before the first e-fold need not obey this principle Aluri & Jain (2012); Rath et al. (2013).
Observationally, there are some claims on the violation of the cosmological principle. The radio polarizations of distant galaxies show a dipole anisotropy with a preferred axis pointing close to the cosmic microwave background (CMB) dipole Jain & Ralston (1999); Ralston & Jain (2004). Subsequently, several effects have been found, showing an anisotropy correlated with this direction. This includes the quadrupole and octopole alignment in CMB De Oliveira-Costa et al. (2004), hemispherical power asymmetry Eriksen et al. (2004), dipole in galaxy number counts Baleisis et al. (1998); Blake & Wall (2002); Singal (2011); Gibelyou & Huterer (2012); Rubart & Schwarz (2013); Tiwari et al. (2015); Bengaly et al. (2018); Secrest et al. (2021a), large scale cosmic flow Kashlinsky et al. (2008); Watkins et al. (2023) and anisotropy in Hubble constant Luongo et al. (2022) etc. It has been pointed out that a dipole anisotropy in galaxy number counts is expected in the CDM model due to kinematic effects Ellis & Baldwin (1984) and is given by,
| (1) |
where is the index of cumulative number count , i.e., number of sources per unit solid angle having flux density greater than , assumed to follow a power law , is the spectral index of the source’s spectrum, defined by , is the peculiar velocity of the solar system with respect to the CRF, and is the speed of light in vacuum. The observed dipole in number counts, however, appears to be much larger than the kinematic expectation Singal (2011); Gibelyou & Huterer (2012); Rubart & Schwarz (2013); Tiwari et al. (2015); Bengaly et al. (2018); Secrest et al. (2021a).
An unusually strong departure from the CDM prediction in the number count dipole, employing the CatWISE2020 Marocco et al. (2021) catalog at infrared wavelengths, is claimed by Secrest et al. (2021a) with a significance of approximately sigma, and has also been confirmed by other authors Dam et al. (2023); Kothari et al. (2024). It has been pointed out that the effect of the evolution of the luminosity function needs to be taken into account to assess properly the significance of the excess dipole amplitude Guandalin et al. (2023). Furthermore, no deviation from the CDM model is seen in the Quaia data sample Storey-Fisher et al. (2023) by using Bayesian statistics Mittal et al. (2023). However, a recent analysis of the same Quaia data sample by Singal (2024) reveals a significant deviation from the CDM model, as the dipole amplitude is approximately times larger than that of the CMB-inferred dipole amplitude, and the direction is nearly similar to the CMB dipole direction.
In the present paper, the effect of color cut on the dipole signal in the quasar sample using the CatWISE2020 catalog Marocco et al. (2021) is studied. Secrest et al. (2021a) imposed the color cut on W1 and W2 band magnitude data of the CatWISE2020 catalog. In order to study the dependence of the dipole signal on color , the catalogue is divided into smaller bins of , and dipole are extracted in each bin. If the signal is of cosmological origin, it should be independent of the color.
The paper is organized in the following manner. In section 2, we describe the data used in this paper, the procedure used to eliminate the known systematics, and the corrections applied to remove the Galactic contamination. In section 3, we discuss the method employed to estimate the dipole signal. The main results of this paper are given in section 4, and we conclude in section 5. Throughout this paper, low color cut or stands for and high color cut or stands for respectively.
2 CatWISE2020 Catalog
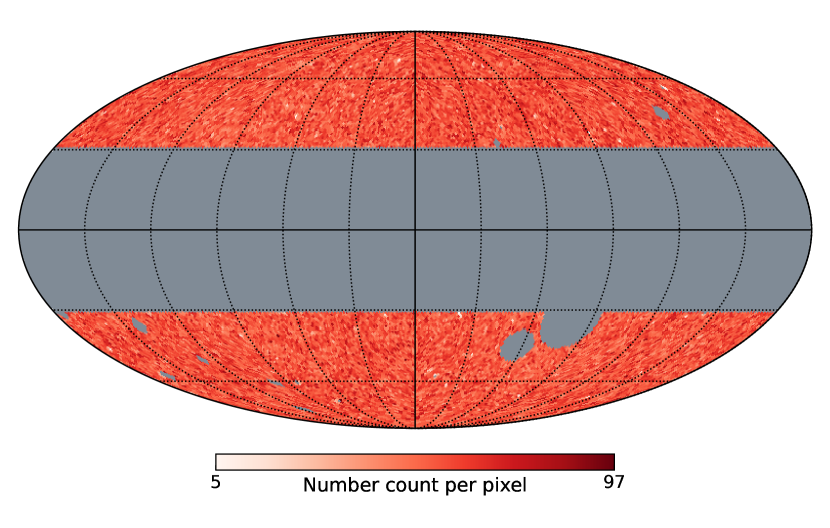
We use a sample of quasars from the CatWISE2020 catalog Marocco et al. (2021), which is constructed using Wide-field Infrared Survey Explorer (WISE) Wright et al. (2010) and NEOWISE (Near Earth Object WISE) Mainzer et al. (2011, 2014) all-sky survey data at 3.4m ( Band) and 4.6m ( Band) wavelengths. A mid-infrared color cut is applied to select quasars in the CatWISE2020 catalog Stern et al. (2012); Secrest et al. (2015). Our quasar sample is identical to the sample used by Secrest et al. (2021a), incorporating all cuts, masks, and corrections except for one specific correction, i.e., removing the observed inverse linear dependency of number density on absolute ecliptic latitude, believed to be caused by the WISE scanning pattern in the sky Wright et al. (2010). This correction is not essential since our analysis method can directly extract such dependency in the form of a quadrupole signal aligned with the ecliptic poles. The resulting quasar sample is the same as that used by Kothari et al. (2024) and Panwar & Jain (2023). To remove the Galactic contamination, the Galactic plane region deg is masked. The magnitudes and are corrected for the Galactic reddening by using Planck dust map Planck Collaboration et al. (2014) and extinction coefficients derived in Wang & Chen (2019). The ratio of total-to-selective extinction is , where is extinction in standard Johnson visual band and is reddening value in the line of sight of the source from the Planck dust map. We pixelize the quasars using a Python-based healpy package into equal-area pixels corresponding to nside. We imposed the constraint that the minimum number of sources in any pixel must be greater than or equal to . A pixel which has smaller number of sources is masked. This constraint is applied throughout our analysis. The number count map is shown in Fig. 1 in the Galactic coordinate system. All the masked regions are shown in gray color. We estimate the index of the integral number count , using the log-likelihood method Ghosh & Jain (2017); Panwar & Jain (2023), and the spectral index for each source following Secrest et al. (2021a).
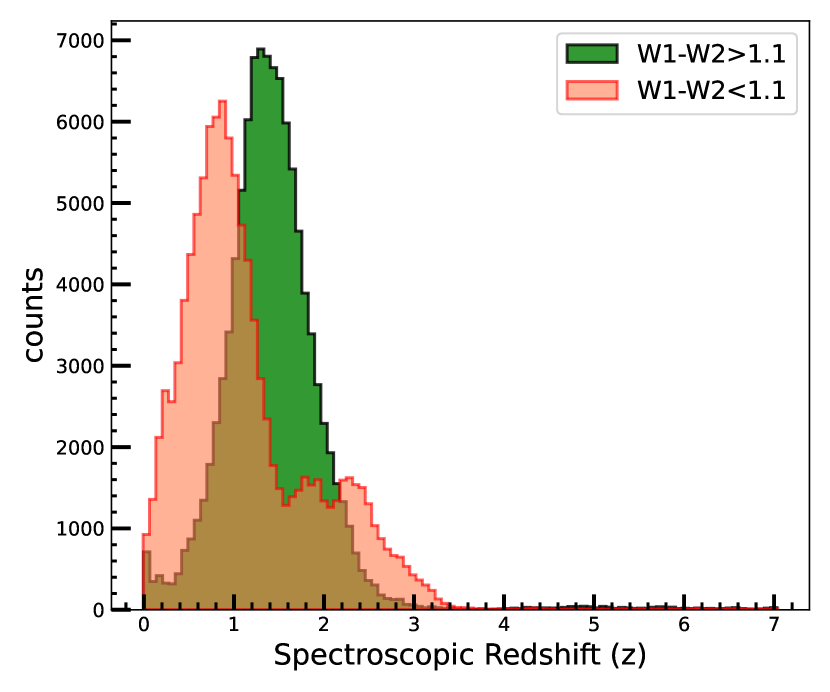
We cross match our quasar sample with Sloan Digital Sky Survey (SDSS) data release Ahumada et al. (2020) quasar catalog specObj-dr16.fits111https://data.sdss.org/sas/dr16/sdss/spectro/redux/specObj-dr16.fits within the search radius arcsec to extract the redshift. Resulting distributions of for and sources are displayed in Fig. 2.
3 Methodology
We obtain the dipole in number counts by using the same procedure as in Kothari et al. (2024). We assume the following model for the angular dependence of number counts,
| (2) | |||||
where we keep terms up to , namely the monopole (), dipole () and the quadrupole . Here, are the components of the unit vector in the spherical coordinate system. Hence, the model contains a total of nine parameters which are extracted by using minimization. The normalized dipole amplitude is defined as,
| (3) |
We pixelize the sky using the Healpy pixelization. The number counts in pixel are denoted by . The corresponding function is given by,
| (4) |
where is the total number of pixels. Assuming Poisson statistics, we set the error to be . We also determine the change in results as the galactic mask is made more stringent.
4 results and discussion
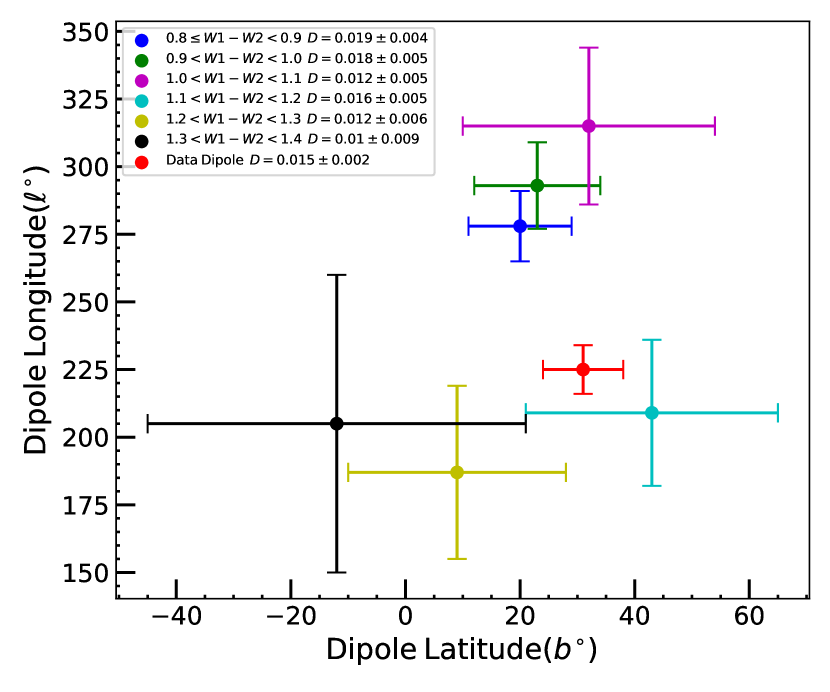
The extracted dipole parameters for the full data set are provided in Table 1. The corresponding dipole parameters for various color cuts are given in Table 2. The dipole directions are plotted in Fig. 3. There is some difference in results between the two different sets of color cuts, with the dominant change being in the dipole directions. As shown in Fig. 3, the dipoles for the lower values of () cluster around the Galactic longitude of approximately , while those for higher values of () are closer to . We find that although the galactic latitudes are roughly in agreement, the galactic longitudes are very different. In Table 3, we show the results after combining the lower and higher color cuts. The dipole for the high color cut points roughly opposite to the center of the galaxy, while that for is closer to the CMB dipole. We also find that the amplitude for is larger than that for .
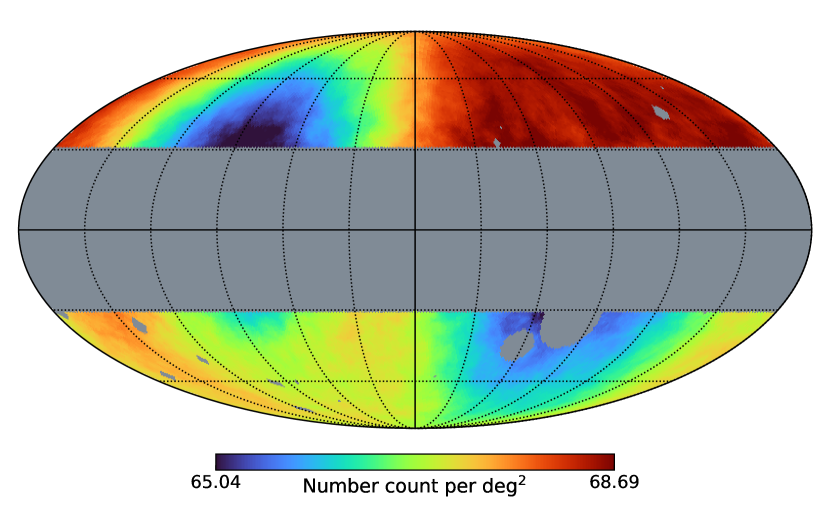
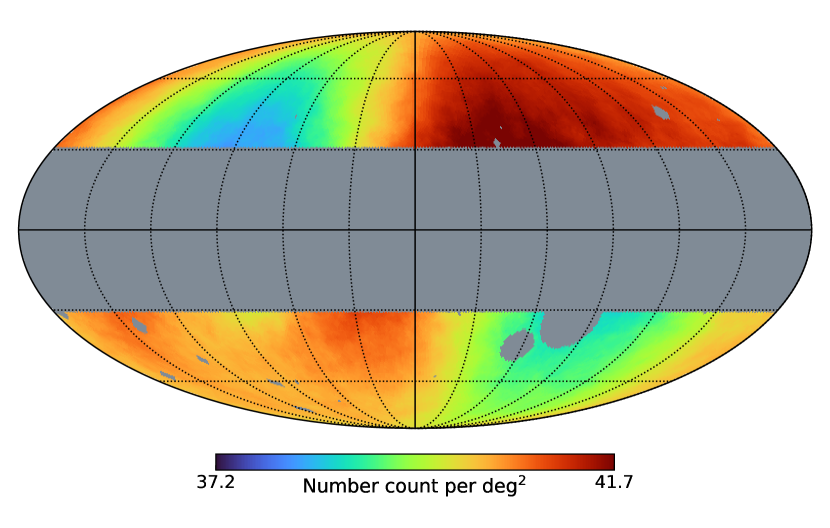
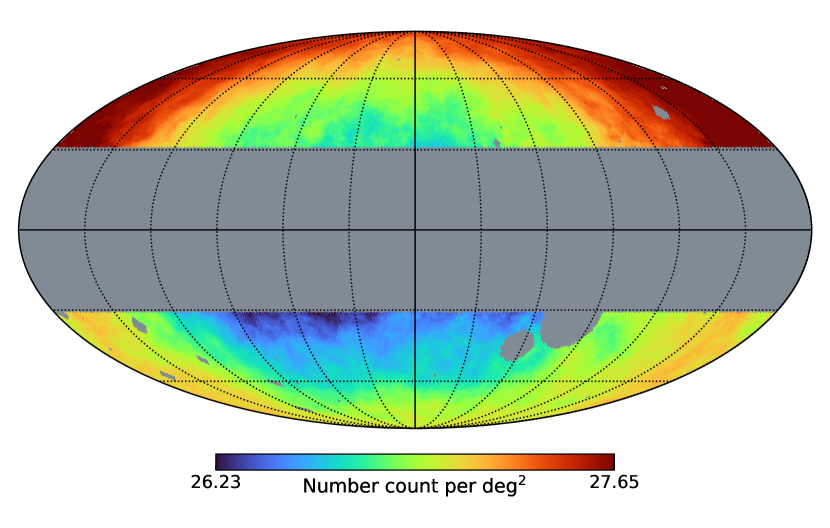
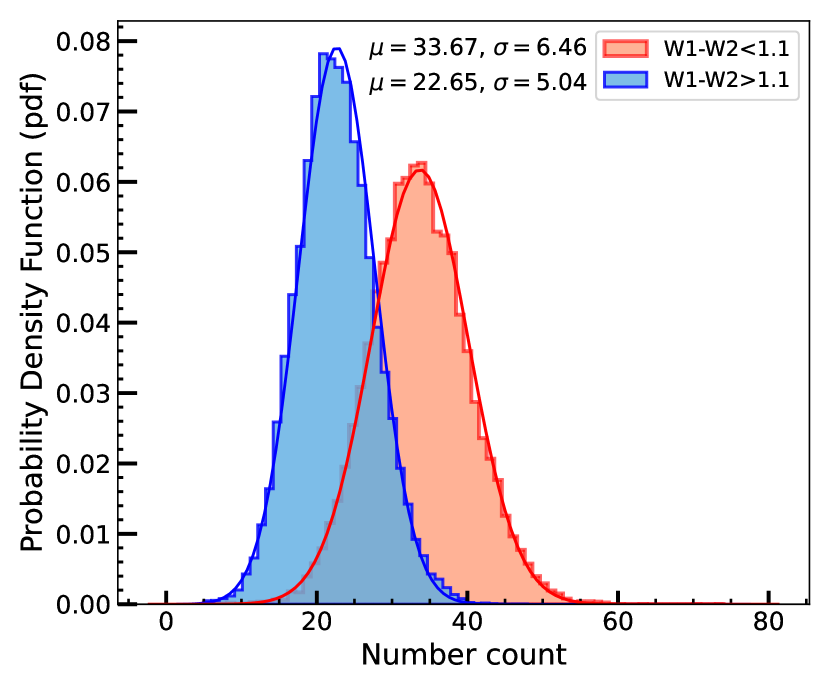
The most important observation is that the direction of the dipoles for points approximately opposite to the Galactic center. This indicates that this data set is likely to be very significantly contaminated with the Galactic emissions. We also see this clearly by making a source count map for different cuts. In Figs. 4, 5 and 6 we show the number density i.e., number of sources or number count per deg2, map for full data, low color cut data and high color cut data respectively. The number density values on the color bars are chosen in such a way as to show the presence of the dipole and quadrupole signals in the respective data sets. We see that while the low color cut data shows a dipole roughly similar to the full data, the high color cut data shows a completely different behaviour, closely correlated with our galaxy. The spectroscopic redshift distributions for the two cuts are shown in Fig. 2. We find that the mean redshift for the cut is greater than that for . The distributions of number counts for both the cuts are shown in Fig. 7. We see that both are well described by a Gaussian distribution.
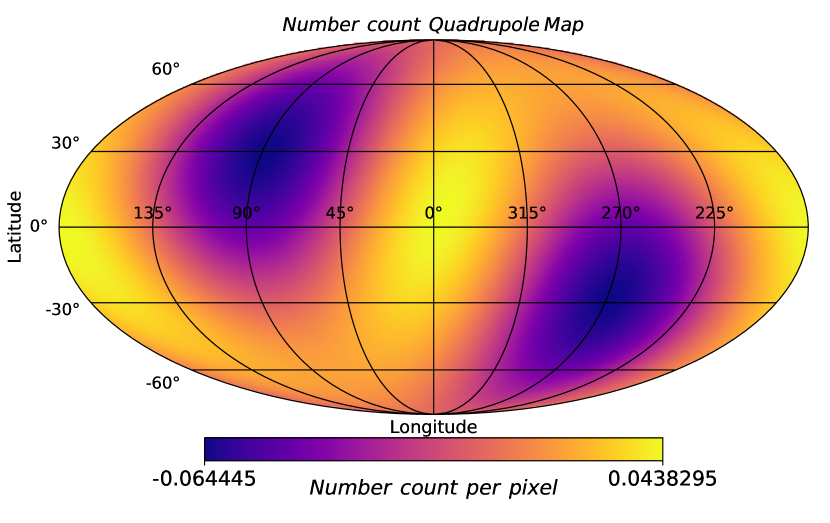
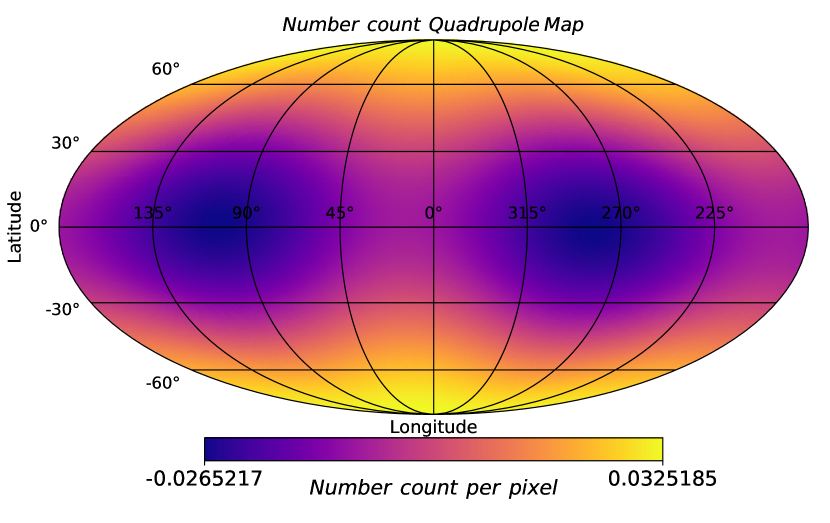
Figs. 8 and 9 display the fitted quadrupole present in low and high color cut data respectively. In these plots, we show only the quadrupole moment i.e.,
| (5) |
where is obtained from Eq. 2 by ignoring the dipole parameters . In low color cut data, we find that the quadrupole axis of symmetry, i.e., direction of cold spots, points towards the ecliptic poles, which may be correlated with the WISE scanning strategy. The quadrupole moment is nearly the same as in the full data Kothari et al. (2024). This fact is also reflected in our complete data map (Fig 4). In the case of high color data, the quadrupole is closely correlated with the Galactic plane, similar to the dipole signal. In order to investigate the effect of the Galactic plane, we study how the results change as we eliminate the Galactic plane with more stringent cuts starting from to . The results are shown in Table 4. We see that the results are very similar for this entire range of cuts. For both the color cuts, the magnitude of dipoles as well as their directions show only mild change as we make the Galactic plane cut more stringent. We next explore the possibility that the data corresponding to the cut shows Galactic contamination primarily due to the low flux sources. We study how the dipole signal changes as we increase the low flux cut from mJy to mJy. The results are shown in Table 5. We find that the dipole results are very stable against the value of , even after loosing sources at mJy. For all the flux cuts used, the quadrupole is also seen to align with the Galactic plane.
Our results show that there is significant Galactic contamination in the data set corresponding to the color cut . The origin of this contamination is unknown and seems to be present even at high galactic latitudes and is not limited to low flux sources. The dust map used to correct for galactic extinction also does not provide any clues to the origin of this effect. For example, scaling the extinction correction in band based on this dust map i.e., corrected magnitude where , leads to a systematic change in the extracted quadrupole but has negligible effect on the dipole. Hence, we are unable to identify the source of the dipole in this data set.
Given that the data for is unreliable, it is best to use data only for extracting the cosmological dipole. We see from Table 3 that this set also leads to a very significant dipole which is most likely of cosmological origin. However, its direction, particularly the galactic longitude, deviates considerably from that obtained from the full data. Furthermore the extracted velocity turns out to be Km/s which is significantly larger than what is obtained from the full data. This is primarily due to the smaller value of for that data set. It is clear that this extracted velocity deviates from the CMB dipole velocity at approximately 4.7 sigma significance. Furthermore, we point out that this set peaks at redshifts of order unity, as seen from Fig. 7. Hence, the extracted dipole is reliable only for this redshift range.
| # Sources | Mean Alpha() | Direction | /dof | ||
| Color cut[mag.] | # Sources | Direction | /dof | |
|---|---|---|---|---|
| Color cut[mag.] | Mean Alpha( | # Sources | Direction | /dof | ||
|---|---|---|---|---|---|---|
| Color cut[mag.] | # Sources | Direction | /dof | ||
|---|---|---|---|---|---|
| [mJy] | # Sources | Direction | /dof | |
|---|---|---|---|---|
5 Conclusions
The main result of our paper is that the data in the color bin suffers from strong contamination due to the Milky Way and hence is not reliable for extracting the cosmological dipole. Both the dipole and quadrupole extracted in this bin are strongly correlated with the galactic plane. The source of this contamination is unknown and we are not able to explain it in terms of known Galactic sources. This is particularly true for the dipole which remains unaffected even if we change the magnitude of the extinction correction based on known sources of galactic extinction. In contrast, the remaining data, corresponding to the cut , which peaks at redshift approximately equal to , shows a dipole roughly aligned with the CMB dipole direction and hence may be of cosmological origin. This data also shows a quadrupole aligned with the ecliptic poles, as seen in the full data, and hence may be attributed to ecliptic bias. The dipole amplitude in this set is strong and shows a sigma deviation from our local velocity derived from the CMB dipole. Hence the data continues to show a strong deviation from the model. We emphasize that it is important to determine the origin of the contamination in the color bin , which corresponds to redshifts greater than , in order to obtain a reliable signal in the full data set.
Data Availability
Data used in this article are already available in public domain Secrest et al. (2021b).
References
- Ahumada et al. (2020) Ahumada R., et al., 2020, The Astrophysical Journal Supplement Series, 249, 3
- Aluri & Jain (2012) Aluri P. K., Jain P., 2012, Mod. Phys. Lett. A, 27, 1250014
- Baleisis et al. (1998) Baleisis A., Lahav O., Loan A. J., Wall J. V., 1998, MNRAS, 297, 545
- Bengaly et al. (2018) Bengaly C. A., Maartens R., Santos M. G., 2018, Journal of Cosmology and Astroparticle Physics, 2018, 031
- Blake & Wall (2002) Blake C., Wall J., 2002, Nature, 416, 150
- Dam et al. (2023) Dam L., Lewis G. F., Brewer B. J., 2023, MNRAS, 525, 231
- De Oliveira-Costa et al. (2004) De Oliveira-Costa A., Tegmark M., Zaldarriaga M., Hamilton A., 2004, Phys. Rev. D, 69, 063516
- Ellis & Baldwin (1984) Ellis G. F. R., Baldwin J. E., 1984, MNRAS, 206, 377
- Eriksen et al. (2004) Eriksen H. K., Hansen F. K., Banday A. J., Górski K. M., Lilje P. B., 2004, The Astrophysical Journal, 605, 14
- Ghosh & Jain (2017) Ghosh S., Jain P., 2017, The Astrophysical Journal, 843, 13
- Gibelyou & Huterer (2012) Gibelyou C., Huterer D., 2012, Monthly Notices of the Royal Astronomical Society, 427, 1994
- Guandalin et al. (2023) Guandalin C., Piat J., Clarkson C., Maartens R., 2023, The Astrophysical Journal, 953, 144
- Jain & Ralston (1999) Jain P., Ralston J., 1999, Modern Physics Letters A - MOD PHYS LETT A, 14, 417
- Kashlinsky et al. (2008) Kashlinsky A., Atrio-Barandela F., Kocevski D., Ebeling H., 2008, The Astrophysical Journal, 686, L49
- Kothari et al. (2024) Kothari R., Panwar M., Tiwari P., Singh G., Jain P., 2024, The European Physical Journal C, 84
- Luongo et al. (2022) Luongo O., Muccino M., Colgáin E. O., Sheikh-Jabbari M. M., Yin L., 2022, Phys. Rev. D, 105, 103510
- Mainzer et al. (2011) Mainzer A., et al., 2011, The Astrophysical Journal, 731, 53
- Mainzer et al. (2014) Mainzer A., et al., 2014, The Astrophysical Journal, 792, 30
- Marocco et al. (2021) Marocco F., et al., 2021, The Astrophysical Journal Supplement Series, 253, 8
- Mittal et al. (2023) Mittal V., Oayda O. T., Lewis G. F., 2023, MNRAS
- Panwar & Jain (2023) Panwar M., Jain P., 2023, Probing Cosmological Principle using the spectral index of quasar flux distribution (arXiv:2312.07596)
- Planck Collaboration et al. (2014) Planck Collaboration et al., 2014, A&A, 571, A11
- Ralston & Jain (2004) Ralston J. P., Jain P., 2004, International Journal of Modern Physics D, 13, 1857
- Rath et al. (2013) Rath P. K., Mudholkar T., Jain P., Aluri P. K., Panda S., 2013, JCAP, 04, 007
- Rubart & Schwarz (2013) Rubart Schwarz 2013, A&A, 555, A117
- Secrest et al. (2015) Secrest N. J., Dudik R. P., Dorland B. N., Zacharias N., Makarov V., Fey A., Frouard J., Finch C., 2015, The Astrophysical Journal Supplement Series, 221, 12
- Secrest et al. (2021b) Secrest N. J., von Hausegger S., Rameez M., Mohayaee R., Sarkar S., Colin J., 2021b, Astrophys. J. Lett., 908, L51
- Secrest et al. (2021a) Secrest N. J., von Hausegger S., Rameez M., Mohayaee R., Sarkar S., Colin J., 2021a, The Astrophysical Journal Letters, 908, L51
- Singal (2011) Singal A. K., 2011, The Astrophysical Journal, 742, L23
- Singal (2024) Singal A. K., 2024, Cosmic dipoles of active galactic nuclei display much larger amplitudes than the cosmic microwave background dipole (arXiv:2403.16581)
- Stern et al. (2012) Stern D., et al., 2012, The Astrophysical Journal, 753, 30
- Storey-Fisher et al. (2023) Storey-Fisher K., Hogg D. W., Rix H.-W., Eilers A.-C., Fabbian G., Blanton M., Alonso D., 2023, arXiv e-prints, p. arXiv:2306.17749
- Tiwari et al. (2015) Tiwari P., Kothari R., Naskar A., Nadkarni-Ghosh S., Jain P., 2015, Astroparticle Physics, 61, 1
- Wald (1983) Wald R. M., 1983, Phys. Rev. D, 28, 2118
- Wang & Chen (2019) Wang S., Chen X., 2019, The Astrophysical Journal, 877, 116
- Watkins et al. (2023) Watkins R., et al., 2023, Monthly Notices of the Royal Astronomical Society, 524, 1885
- Wright et al. (2010) Wright E. L., et al., 2010, The Astronomical Journal, 140, 1868