PyCellMech: A shape-based feature extraction pipeline for use in medical and biological studies
Abstract
Summary: Medical researchers obtain knowledge about the prevention and treatment of disability and disease using physical measurements and image data. To assist in this endeavor, feature extraction packages are available that are designed to collect data from the image structure. In this study, we aim to augment current works by adding to the current mix of shape-based features. The significance of shape-based features has been explored extensively in research for several decades, but there is no single package available in which all shape-related features can be extracted easily by the researcher. PyCellMech has been crafted to address this gap. The PyCellMech package extracts three classes of shape features, which are classified as one-dimensional, geometric, and polygonal. Future iterations will be expanded to include other feature classes, such as scale-space.
Availability and implementation: PyCellMech is freely available at https://github.com/icm-dac/pycellmech.
Keywords shape features mechanobiology statistics machine learning feature extraction
1 Introduction
Medical research involves understanding the drivers behind disease prevalence and progression. Typically, such research is investigated using a combination of statistical or artificial intelligence (AI)-driven methods that could involve mining text and imaging data. Other evaluations include using both these media to extract potential features that may be characteristic of a disease state. For example, in the comprehensive and popular work of van Griethuysen et al. (2017), researchers can extract a large list of image-related features (typically for radiological images) using the Python-based package pyradiomics ([1]). This list includes first-order statistics, along with texture statistics, such as gray-level co-occurrence matrix (GLCM).
Amongst the existing body of work, another consideration can be found in the analysis of shape-based or morphometric features. This field of study first arose to prominence in the 1980s and investigated the incorporation of biological shape information. This includes translating shape descriptions in the form of quantitative measures that do not vary even when the shape is moved, rotated, enlarged, or reduced ([2]). Similar to existing packages, shape-related information can be used to help derive similarities or differences in disease classes, and thus provide additional insights regarding disease pathology and progression. In the literature, some packages already exist and take into consideration some shape-based features. These include perimeter, area, and aspect ratio ([3]), as well as others, such as mesh surface and surface ratio currently offered by pyradiomics. Additionally, other feature extraction works include the geomorph package in R ([4]), which is used to evaluate anatomical features of organisms for ecological and evolutionary studies.
In this paper, we augment this body of work by developing an easily accessible, open-source package that includes additional shape features not yet considered. Our objective is to provide complementary features that researchers can use when elucidating disease mechanics. Our package, named PyCellMech, is launched with a preliminary set of shape-based features inspired by the works of [5] and [6]. To the best of our knowledge, these features have not been made collectively available to the scientific community. In this paper, we discuss the current iteration of the pipeline, present results based on open-source data, and conclude with future directions.
2 Approach
The framework for the PyCellMech pipeline is outlined in Fig 1. The pipeline can be installed in Python using the command pip install pycellmech.
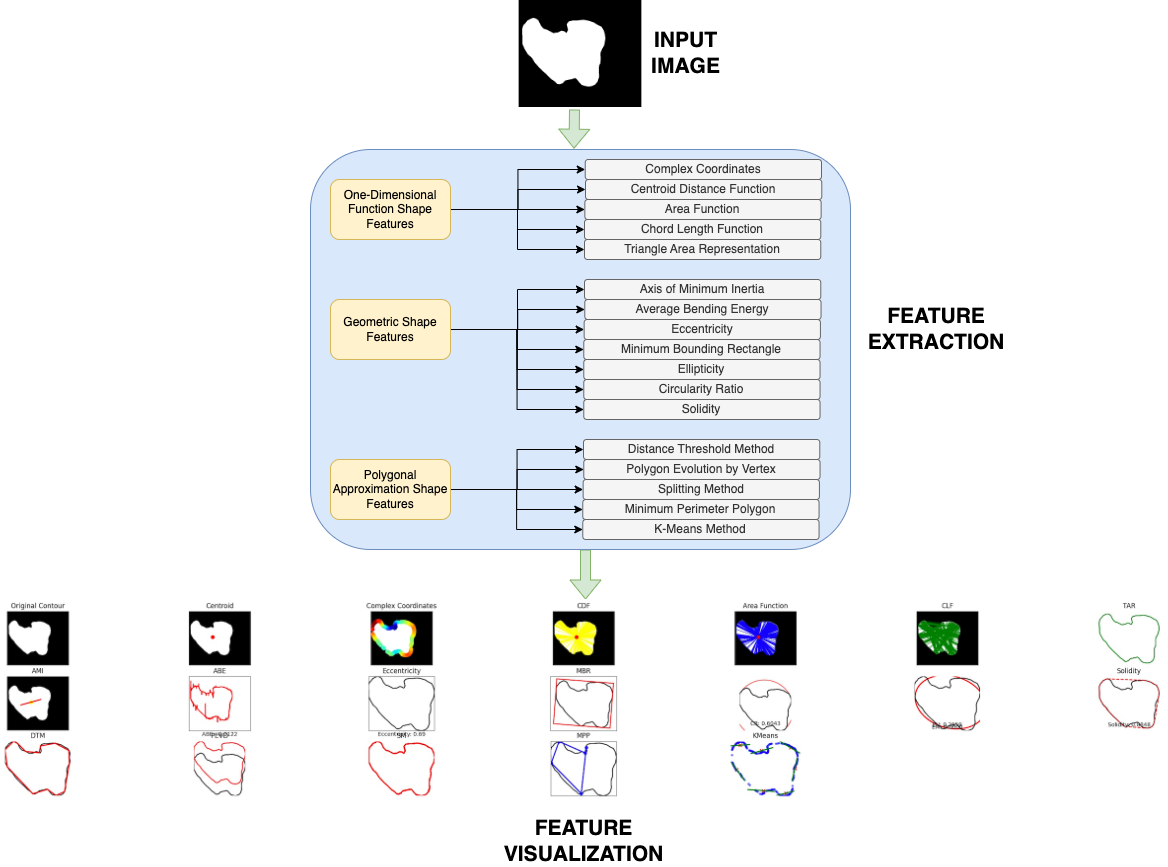
The pipeline consists of three primary components: image pre-processing, feature extraction, and feature visualization. For its input, the pipeline currently takes binarized images; this is in contrast to existing packages, such as pyradiomics, which read the binary masks in parallel to the original image for feature extraction (e.g., extracting texture or intensity-related information). However, the sole focus of this pipeline is understanding the inherent shape properties of the regions of interest (ROIs), and such information is sufficiently attainable in the binarized marks. The pipeline can process both single- or multi-class information (refer to Section 3 for further details).
The entire pipeline can be run using the command line illustrated below:
    pycellmech
    --input /path/to/folder/with/binary/masks
    --csv_file /path/to/save/extracted/features/as/csv
    --output /path/to/saving/feature/maps
    --label ’s’ (single-class) / ’m’ (multi-class)
    --nifti_folder /path/to/muti-class/nifti/metadata
An end-user can save their collection of binarized masks into a single folder, which can be called upon from the command line. All traditional image formats are accepted as input, including JPEG, PNG, and TIF. These images undergo a pre-processing of Gaussian blurring and morphological closing. The pipeline then iterates through every image within the folder, identifying all the ROIs within each image. All shape features are calculated and processed for each ROI; this information is output as a CSV file. An illustrative example of the CSV output can be found in Table 1. For ease of accessibility, features extracted are formatted in the following manner: image name, the ith ROI processed in the image, its label (if multi-class is selected), and all the shape features as related to the ith ROI. For example, in Table 1, image ck2bxskgxxzfv08386xkqtqdy.jpg had two ROIs processed.
Parallel to the quantification of the shape features, we also offer a qualitative assessment through the visualization of the collected shape features (we refer to this visualization as a feature map). In this feature map, the largest ROI based on connected regions in each image is automatically extracted. The original binary mask is illustrated as a reference image. All shape features are iteratively displayed in the feature map via superimposing each feature on the largest ROI and displaying it accordingly (refer to Feature Visualization in Figure 1). This task is repeated and saved for every binary mask within the chosen folder. These feature maps are saved using the argument --output in the command line.
In its inaugural version, the pipeline consists of three feature classes: one-dimensional function, geometric, and polygonal approximation. The choice of these modules was simply due to their practicality, given their ease of implementation and larger potential spectrum of application. One-dimensional function features hold the perspective properties of the shape (e.g., the Centroid Distance Function [CDF] estimates the distance between the center of an object to its boundary, describing the shape’s geometry relative to its center). Geometric shape features are used to determine the likeness amongst shape characteristics (e.g., Average Bending Energy [ABE] quantifies the mean effort required to deform a shape). Polygonal approximations overlook edge discrepancies (e.g., Minimum Perimeter Polygon [MPP] refers to a polygon with the smallest possible perimeter that can enclose a given shape). Further details regarding each feature can be found in the PyCellMech GitHub Repository. These modules will continually be built upon in future iterations of the pipeline as new research in the space becomes available.
The design and preparation of this pipeline were done using the open-source segmented polyp dataset, Kvasir, available through Kaggle ([7]) as well as internal data available to our team not yet published.
3 Single vs. Multi-Class Feature Extraction
Users have the option of selecting ’s’ for images with a single class or ’m’ for multi-class. Multi-class, for example, could represent the presence of multiple cell types within each image. This functionality allows the users greater flexibility, being able to automatically assign pre-defined labels alongside extracted shape features. If users opt for the single-class option, no labels need to accompany the binarized images. For users working with multi-classed masks, they are required to have labels in NifTI (Neuroimaging Informatics Technology Initiative) format which stores labeled metadata. NifTI files are preferable as they offer the following advantages: (1) they preserve spatial context information, (2) improve data organization, and (3) can easily be validated (e.g., visualizing the original image and labels). If users do not have at their disposal pre-existing NifTI files, PyCellMech accommodates for this possibility, allowing the users to create one from scratch using the pycellmech_create_label and pycellmech_nifti
functions in the package accordingly. The following steps are recommended to prepare images for multi-class processing:
-
•
Using the
pycellmech_create_labelcommand line, specify the folder in which the original binarized images are stored. For each image in this folder, the function will label each ROI based on connected regions, returning a numerical label for each ROI within the image.pycellmech_create_label --folder_path /path/to/folder/with/binary/masks --output_csv_folder /path/to/save/labels/as/csv --output_image_folder /path/to/save/labeled/masks -
•
Outputs from this function will include (1) the binarized image converted to an RGB format with the labels superimposed for visualization, and (2) a CSV file that contains the headers
cell_id(with this representing the ROI labels generated using connected regions),centroid_x, andcentroid_ythat represent the centroid coordinates of each ROI detected, and an empty column namedfinal_label. -
•
The end-user will need to fill in the
final_labelcolumn. The RGB image with thecell_idsuperimposed on each region can be used as a reference when annotating the data. We strongly recommend the use of numerical values to classify the ROI. For example, to classify the level of differentiation in cells, users can input 0 for undefined cells (which will be converted to the background during feature processing), 1 for undifferentiated cells, 2 for moderately differentiated, and 3 for differentiated. -
•
Once completed, users can use the
pycellmech_nifticommand line to create the NifTI file. For each binary mask file, the function reads the mask, loads the corresponding CSV file, and maps the user-defined final labels. It updates the labeled mask (so users can conduct any quality checks to ensure ROIs are correctly labeled), corrects the orientation of the labeled mask, converts it to a SimpleITK image, and saves it as a NIfTI file. The function then verifies the label consistency between the final labeled mask and the CSV file, ensuring all expected labels are present and identifying any missing or extra labels.pycellmech_nifti --folder_path /path/to/folder/with/binary/masks --input_csv_folder /path/to/extract/csv/labels --nifti_save_dir /path/to/save/nifti/file --label_save_dir /path/to/save/updated/labeled/images
The produced NifTI file can then be read into the main pycellmech command line to be processed.
| image_name | contour_number | abe | mbr_width | mbr_angle |
|---|---|---|---|---|
| ck2da7fwcjfis07218r1rvm95.jpg | 1 | -0.017 | 180.40 | 53.13 |
| ck2bxskgxxzfv08386xkqtqdy.jpg | 1 | -0.008 | 100.00 | 40.10 |
| ck2bxskgxxzfv08386xkqtqdy.jpg | 2 | -0.050 | 203.93 | 81.87 |
| ck2395w2mb4vu07480otsu6tw.jpg | 1 | -0.104 | 281.34 | 4.86 |
| ck2bxw18mmz1k0725litqq2mc.jpg | 1 | -0.012 | 408.88 | 4.43 |
| ck2bxqz3evvg20794iiyv5v2m.jpg | 1 | -0.020 | 252.97 | 64.26 |
4 Conclusions
The objective of PyCellMech is to provide users with a one-stop-shop shape feature extractor that is readily available and easy to use. PyCellMech can be used alongside existing packages, such as pyradiomics, and offers users additional features that may be useful in their medical or biological analyses. The potential use and application of PyCellMech can be summarized as follows:
-
•
Detection: Help identify certain classes of ROIs or cells based on their shape characteristics.
-
•
Classification: Identify shape features that can be used in the automation of classification.
-
•
Prognosis and Prediction: Shape features may assist in predicting the likely course of a disease. For example, in a previous study by the authors ([8]), shape characteristics played a part in the extraction of different levels of hyperfluorescent regions, which are biomarkers typically observed in the evaluation of the ocular disease geographic atrophy - a cause of irreversible vision loss in individuals aged 50 years and older.
Future iterations of the pipeline will include the addition of other classes of shape features, including scale-space and transform domain. While the results presented are preliminary, the pipeline will be extended to include all shape features over time, and will continually be updated as the research in this space evolves. Furthermore, PyCellMech will eventually include automated analyses (e.g., ranking of shape features) and baseline biological interpretations (e.g., certain characteristics could be indicative of healthy or unhealthy cells). In line with the objectives of our laboratory, we will add modules to the pipeline in which shape features will be coupled with mechanobiology to study the implication of shape data on different diseases or cellular states. While the predominant focus of this paper has been on cell-based analyses, such applications can be extended to other medical areas, including the assessment of shape data as related to MRIs.
5 Competing interests
No competing interest is declared.
6 Author contributions statement
J.A. developed the idea, created PyCellMech, and wrote the manuscript. H.C., I.K., R.V., and K.B. reviewed PyCellMech and the manuscript.
7 Acknowledgments
The research leading to these results has received funding from the national program “Investissements d’avenir” ANR-10- IAIHU-0006.
References
- [1] Joost J.M. van Griethuysen, Andriy Fedorov, Chintan Parmar, Ahmed Hosny, Nicole Aucoin, Vivek Narayan, Regina G.H. Beets-Tan, Jean-Christophe Fillion-Robin, Steve Pieper, and Hugo J.W.L. Aerts. Computational radiomics system to decode the radiographic phenotype. Cancer Research, 77(21):e104–e107, October 2017.
- [2] Fred L. Bookstein. Shape and the information in medical images: A decade of the morphometric synthesis. Computer Vision and Image Understanding, 66(2):97–118, May 1997.
- [3] Joana Lobo, Eugene Yong-Shun See, Manus Biggs, and Abhay Pandit. An insight into morphometric descriptors of cell shape that pertain to regenerative medicine: Cell shape analysis descriptors that pertain to regenerative medicine. Journal of Tissue Engineering and Regenerative Medicine, 10(7):539–553, March 2015.
- [4] Dean C. Adams and Erik Otárola-Castillo. geomorph: an r package for the collection and analysis of geometric morphometric shape data. Methods in Ecology and Evolution, 4(4):393–399, April 2013.
- [5] Jyotismita Chaki and Nilanjan Dey. A Beginner’s Guide to Image Shape Feature Extraction Techniques. Taylor & Francis Group, 2019.
- [6] Peng-Yeng Yin. Pattern Recognition Techniques, Technology and Applications. InTech, November 2008.
- [7] Konstantin Pogorelov, Kristin Ranheim Randel, Carsten Griwodz, Sigrun Losada Eskeland, Thomas de Lange, Dag Johansen, Concetto Spampinato, Duc-Tien Dang-Nguyen, Mathias Lux, Peter Thelin Schmidt, Michael Riegler, and Pål Halvorsen. Kvasir: A multi-class image dataset for computer aided gastrointestinal disease detection. In Proceedings of the 8th ACM on Multimedia Systems Conference, MMSys’17, pages 164–169, New York, NY, USA, 2017. ACM.
- [8] Janan Arslan and Kurt Benke. Automation of cluster extraction in fundus autofluorescence images of geographic atrophy. Applied Biosciences, 2(3):384–405, July 2023.