WTP 19aalnxx: Discovery of a bright mid-infrared transient in the emerging class of low luminosity supernovae revealed by delayed circumstellar interaction
Abstract
While core-collapse supernovae (SNe) often show early and consistent signs of circumstellar (CSM) interaction, some exhibit delayed signatures due to interaction with distant material around the progenitor star. Here we present the discovery in NEOWISE data of WTP 19aalnxx, a luminous mid-infrared (IR) transient in the outskirts of the galaxy KUG 0022-007 at Mpc. First detected in 2018, WTP 19aalnxx reaches a peak absolute (Vega) magnitude of at m in yr, comparable to the most luminous interacting SNe. Archival data reveal a fainter optical counterpart detected since 2015, while follow-up near-IR observations in 2022 reveal an extremely red ( mag) active transient. Deep optical spectroscopy confirm strong CSM interaction signatures via intermediate-width Balmer emission lines and coronal metal lines. Modeling the broadband spectral energy distribution, we estimate the presence of M⊙ of warm dust, likely formed in the shock interaction region. Together with the lack of nebular Fe emission, we suggest that WTP 19aalnxx is a missed, low (optical) luminosity SN in an emerging family of core-collapse SNe distinguished by their CSM-interaction-powered mid-IR emission that outshines the optical bands. Investigating the Zwicky Transient Facility sample of SNe in NEOWISE data, we find core-collapse SNe (% in a volume-limited sample) without early signs of CSM interaction that exhibit delayed IR brightening, suggestive of dense CSM shells at cm. We suggest that synoptic IR surveys offer a new route to revealing late-time CSM interaction and the prevalence of intense terminal mass loss in massive stars.
1 Introduction
Massive stars are known to undergo intense terminal mass loss episodes which remain poorly understood (Groh et al., 2013; Smith, 2014). Not only does this mass loss affect the observational appearance of the subsequent core-collapse supernova (CCSN; e.g. as a hydrogen-free or hydrogen-rich event), the amount, energy and composition of this mass has broader implications for the influence of massive stars on the surrounding interstellar medium (Puls et al., 2008). Elevated mass loss in the years to centuries prior to a massive stellar death can most readily be inferred via the observational effects produced by the interaction of the SN ejecta with the surrounding circumstellar material (CSM; Smith 2017). The canonical Type IIn supernovae (Gal-Yam, 2017) present the most dramatic examples, where narrow and intermediate-width emission lines from the shock interaction region are easily recognized, and the interaction energy powers most of the SN luminosity (Chevalier & Fransson, 2017). However, large-scale optical surveys are now providing increasing evidence that short-lived episodes of dense CSM interaction may be ubiquitous in most CCSNe as revealed by early photometric and spectroscopic follow-up (Bruch et al., 2021; Das et al., 2023; Jacobson-Galán et al., 2024).
While the effects of CSM interaction are sometimes apparent at X-ray and radio wavebands (Chevalier & Fransson, 2017), the mid-infrared (MIR) bands have often provided tantalizing evidence (Szalai et al., 2019). CCSNe frequently show bright MIR emission from warm dust heated by the SN emission (Szalai & Vinkó, 2013; Tinyanont et al., 2016; Fox et al., 2011). Warm dust around CCSNe can be pre-existing in the SN progenitor environment, produced in the dense interaction region between the forward and reverse shocks or even produced in the cooling SN ejecta (Fox et al., 2010). In the presence of dense interaction, the dust can be heated by collisions in the shock or by the radiation produced at the shock. Modeling of the MIR emission as well as its temporal evolution offers powerful clues to understanding the origin of the dust (Fox et al., 2011), while simultaneously providing direct evidence for CSM interaction at late times where optical spectroscopy (to detect interaction narrow lines) may be infeasible (Tinyanont et al., 2016, 2019; Szalai et al., 2021).
Previous sample studies of MIR supernovae undertaken primarily with the Spitzer space telescope (Fox et al., 2011; Tinyanont et al., 2016; Szalai et al., 2021) show that Type IIn supernovae (see Filippenko 1997 for a review of SN classification) consistently exhibit luminous mid-IR emission, likely powered by shock radiation reprocessed by dust pre-exisiting in the progentior surroundings in most cases (Fox et al., 2011). Such behavior is less prevalent in the canonical Type IIP SNe; however some events show prolonged MIR emission and even re-brightenings likely due to new dust formation (Fabbri et al., 2011; Szalai et al., 2011; Meikle et al., 2011; Shahbandeh et al., 2023) caused by delayed CSM interaction. Similar behavior has also been in some stripped envelope SNe (SESNe) such as SN 2014C (Tinyanont et al., 2019) and SN 2004dk (Mauerhan et al., 2018; Szalai et al., 2021) where delayed CSM interaction inferred from optical, radio and X-ray wavelengths coincide with new dust formation. While the delayed MIR emission in these events is comparable or fainter than the primary optical supernova, it is straightforward to envision a population where MIR emission powered by delayed interaction completely outshines its parent low-luminosity SN. However, the lack of synoptic MIR observations outside of targeted follow-up campaigns or serendipitous host galaxy observations severely limit systematic searches in this regime.
Here, we present the discovery and characterization of a luminous MIR transient in NEOWISE data, utilizing the unique wavelength coverage, temporal baseline and cadence of the NEOWISE mission. The transient exhibits the tell-tale signatures of a CSM-interaction powered SN where the original optical emission was missed due to its low luminosity. We present the discovery and observational details in Section 2. We present a detailed analysis of the photometric and spectroscopic characteristics in Section 3. In Section 4, we identify additional examples of this class of events in NEOWISE data and conclude with a summary. Throughout this paper, we assume , , and km s-1 Mpc-1. Unless otherwise noted, quoted uncertainties represent 90% confidence intervals.
2 Observations
2.1 Discovery in NEOWISE data
The Wide-field Infrared Survey Explorer (WISE) satellite (Wright et al., 2010), re-initiated as the NEOWISE mission (Mainzer et al., 2014), has been carrying out an all-sky MIR survey in the ( m) and ( m) bands since 2014. In its ongoing survey, NEOWISE revisits each part of the sky once every yr. We have carried out a systematic search for transients in time-resolved coadded images created as part of the unWISE project (Lang, 2014; Meisner et al., 2018), the details of which will be presented in De et al. (in prep). In brief, we used a customized code (De et al., 2020a) based on the ZOGY algorithm (Zackay et al., 2016) to perform image subtraction on the NEOWISE images using the co-added images of the WISE mission (obtained in 2010-2011) as reference images111For all transients identified in the WISE Transient Pipeline (WTP, De in prep.), we adopt the naming scheme WTP XXYYYYYY, where XX indicates the year of first detection and YYYYYY is a six letter alphabetical code.. Our pipeline produces a database of all transients down to a statistical significance of . Follow-up for the sources was coordinated using the fritz astronomical data platform (van der Walt et al., 2019).
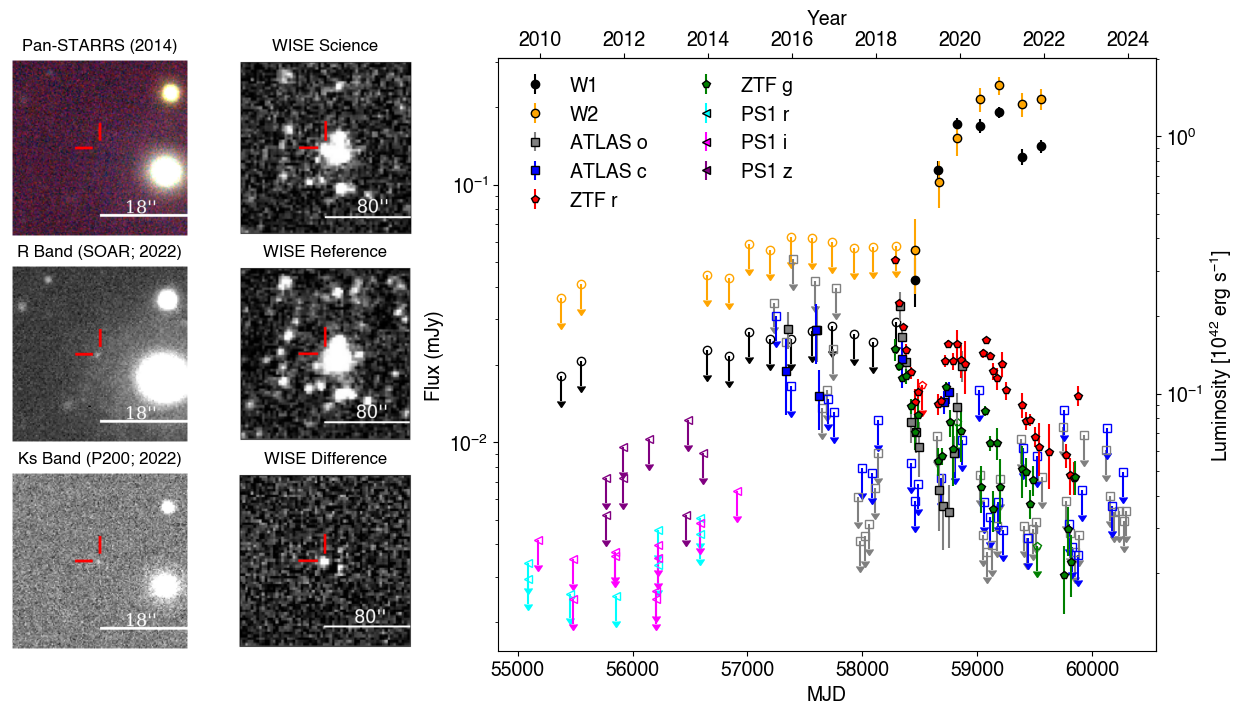
We identified the transient source WTP 19aalnxx at J2000 coordinates 00:24:41.60, 00:30:14.99 in a crossmatch between the sample of NEOWISE transients and galaxies with confirmed spectroscopic redshifts in the Census of the Local Universe (CLU; Cook et al. 2019) catalog. The source lies in the outskirts (projected offset ″) of the spiral galaxy KUG 0022-007 at a known redshift of . The corresponding luminosity distance is Mpc and the projected physical offset from the center of the galaxy is kpc, within the spiral arms of the host galaxy. Performing forced difference Point Spread Function (PSF) photometry at the source position in NEOWISE images (De et al., 2023), we find the mid-IR brightening to have begun in , reaching a peak flux of mJy in the band in 2021 before beginning to fade. The complete WISE light curve of the source is shown in Figure 1. We convert the measured fluxes on the unWISE images to physical flux units using the published WISE zero-point fluxes222https://wise2.ipac.caltech.edu/docs/release/allsky/expsup/sec4_4h.html.
2.2 Archival light curves and follow-up observations
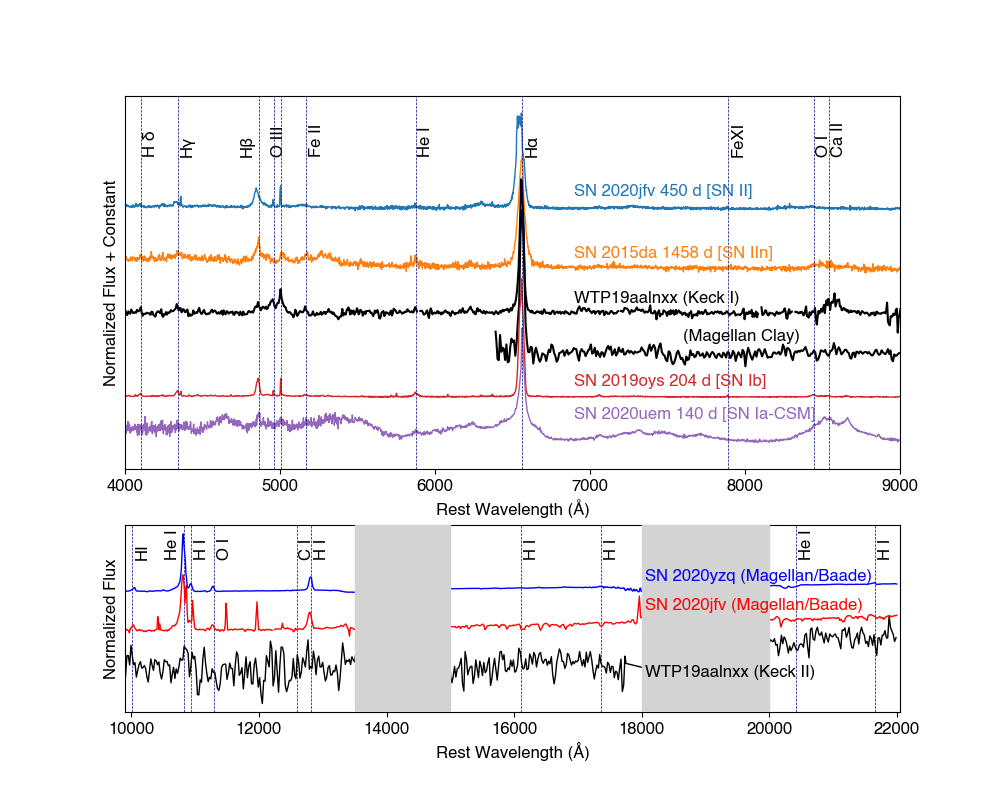
We retrieved archival light curves at the position from the Zwicky Transient Facility (ZTF; Bellm et al. 2019), Asteroid Terrestrial-impact Last Alert System (ATLAS; Tonry et al. 2018) and PanSTARRS surveys (Chambers et al., 2016). The technical details can be found in Appendix A. The combined light curve is shown in Figure 1. We obtained follow-up NIR imaging of the source with the Palomar 200-inch telescope and optical/NIR imaging with the 4.1 m Southern Astrophysical Research (SOAR) Telescope. The details of the observations and data reduction can be found in Appendix B. The follow-up images are shown in Figure 1. We also obtained follow-up optical spectroscopy of WTP 19aalnxx with the Keck-I and Magellan/Clay telescopes, and follow-up NIR spectroscopy of WTP 19aalnxx with the Keck-II telescope and two similar bright MIR SNe with the Magellan/Baade telescope, described in Appendix B. The spectra are presented in Figure 2.
3 Analysis
3.1 Comparison to known supernovae in the mid-IR
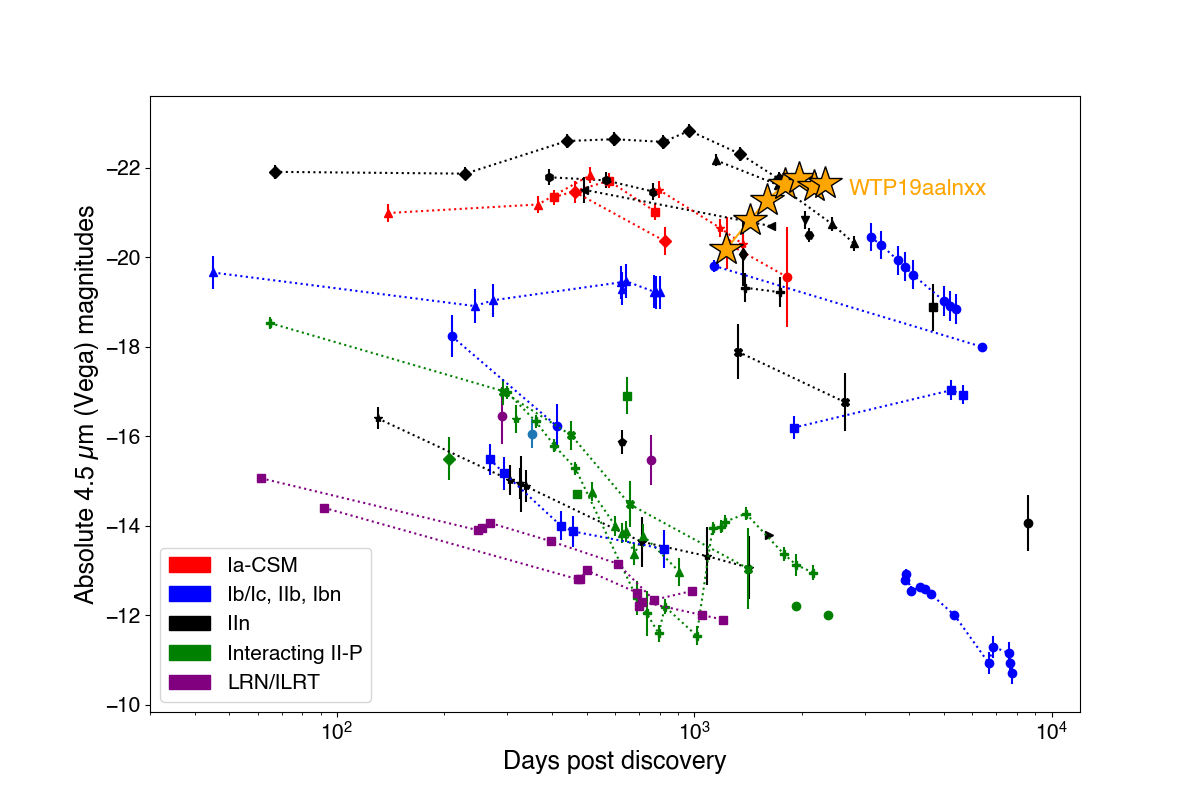
We begin our analysis by comparing the MIR luminosity evolution of WTP 19aalnxx with the known population of extragalactic MIR transients. In Figure 3, we plot the light curve of WTP 19aalnxx with the complete sample of m light curves of supernovae from the Spitzer space telescope (Szalai et al., 2019, 2021). The epoch of explosion is however not well constrained; while the WISE brightening begins in 2018, archival optical photometry reveals a faint transient preceding the mid-IR emission. We can constrain the epoch of explosion noting that the PS1 data do not detect any source until late 2014, while the first ATLAS observations in mid-2015 reveal evidence of a faint optical source. We nominally adopt this date (MJD ) as the explosion epoch, noting that it may be uncertain by d due to the gap in coverage between PS1 and ATLAS. The optical source fades below detectability after the initial ATLAS detection within months, but subsequently re-brightens during 2018 as detected in both ZTF and ATLAS data and continues to exhibit a bumpy morphology until late 2022. We highlight a sudden reddening in the color at the onset of the MIR brightening in 2019, likely produced by the strong H line starting to dominate the source spectrum (Section 3.2).
WTP 19aalnxx reaches a peak absolute Vega magnitude of (), lying amongst the most luminous known mid-IR supernovae. The high luminosity is unlike that seen in SN impostors such as Luminous red novae (LRNe; Pastorello et al. 2019) and Intermediate Luminosity Red Transients (ILRTs; Cai et al. 2021), as well as Type IIP and Ib/c SNe. The luminosity and slow evolution is only similar to Type IIn and Type Ia-CSM SNe that are powered by circumstellar interaction. Under the assumption that the faint ATLAS emission is coincident with the start of the terminal explosion, the MIR brightening begins d after the explosion, unlike all the IIn/Ia-CSM SNe; instead the brightening timescale is similar to that seen in the subset of Type Ib/c SNe which exhibit late-time MIR re-brightening and fading, suggested to arise from late-time CSM interaction (Szalai et al., 2021; Tinyanont et al., 2016). We conclude that the high luminosity and brightening timescale of WTP 19aalnxx is indicative of a MIR transient powered by late-time CSM interaction.
3.2 Spectroscopic signatures
Given the MIR evidence for interaction and dust in WTP 19aalnxx we compare its optical and NIR spectrum to that of other well-studied SNe exhibiting late-time CSM interaction. In Figure 2, we compare the late-time optical spectrum with two well studied interacting SNe from the literature – the Type IIn SN 2015da (Tartaglia et al., 2020) and the Type Ia-CSM SN 2020uem (Sharma et al., 2023). WTP 19aalnxx exhibits all the characteristic optical spectroscopic signatures of an interacting SN – narrow/intermediate-width lines of the Balmer series (H, H, H) and He I (5876 Å) emission, together with coronal metal lines of Fe. We also observe resolved lines of [O III] (4959 Å, 5007 Å), commonly seen in other interacting SNe. Fitting the strong H emission line, we find that it is well described by a sum of two Gaussian profiles, consisting of a resolved, intermediate-width component with a full-width-at-half-maximum of km s-1 superimposed with a broad component with a width of km s-1. Unlike the optical spectrum, the NIR spectrum of WTP 19aalnxx exhibits a red featureless continuum without clear signs of emission lines; we discuss possible interpretations in Section 4.
We note that the broad Fe group emission lines seen in Ia-CSM SNe at nearly all phases (Sharma et al., 2023) are not observed in WTP 19aalnxx. Together with the long and bumpy optical light curve (Figure 1), the observations argue against a Ia-CSM classification for this object. While the the spectrum has remarkable similarities to that of SN 2015da, the lower luminosity optical light curve does not support a SN IIn classification; most well-studied SN IIn peak within (Nyholm et al., 2020), while WTP 19aalnxx peaks at = -16.7 in the optical. Given that the emission is dominated by the CSM interaction at this late stage (and not by the photospheric lines that are typically used to classify SNe), we compare the optical spectrum to other SN types that exhibit delayed CSM interaction. Figure 2 shows that the spectrum is also broadly similar to other SNe that exhibit delayed CSM interaction despite being classified as a different spectroscopic sub-type near peak optical light – including the Type Ib SN 2019oys (Sollerman et al., 2020) and the Type II SN 2020jfv (Sollerman et al., 2021). As such, we suggest that WTP 19aalnxx is a likely low-luminosity core-collapse SN exhibiting delayed CSM interaction, and consistent with both stripped envelope and hydrogen-rich SNe (Spiro et al., 2014). However, the spectroscopic type near peak light is unconstrained. We can constrain the mass-loss rate of the pre-existing CSM (Smith, 2017) assuming the interaction energy is primarily re-radiated via the bright H emission line ( erg s-1, as calibrated to -band photometry) as
| (1) |
where is the assumed wind velocity and is the velocity of the ejecta interaction region. The derived mass-loss rate at a time after the explosion corresponds to a time
| (2) |
before the death of the star, thereby tracing terminal mass loss in the centuries before the explosion.
3.3 Dust temperature and mass
The luminous and variable MIR emission of WTP 19aalnxx is indicative of a hot dust shell surrounding the likely central SN. We attempt to constrain the temporal evolution of the temperature and mass of the shell by fitting the MIR WISE photometry with a simple blackbody model accounting for the wavelength-dependent emissivity of the dust grains. As in Fox et al. (2010) and Fox et al. (2011), we nominally use the emissivity model for silicate dust with m grains from Draine & Li (2001) and fit for the temperature and mass using the modified Planck function. The mass of the dust is derived from the best-fit model as
where a is the assumed grain size of the dust (0.1 m), is the bulk density ( g cm-3), D is the distance to the source, is the observed flux, is the grain emissivity factor based on the model for silicate dust grains, and is the Planck function at the estimated temperature. Figure 4 shows the temporal evolution the dust temperature and mass. The model assumes that the dust emission is optically thin and therefore provides a lower limit to the true dust mass for the given composition and grain size.
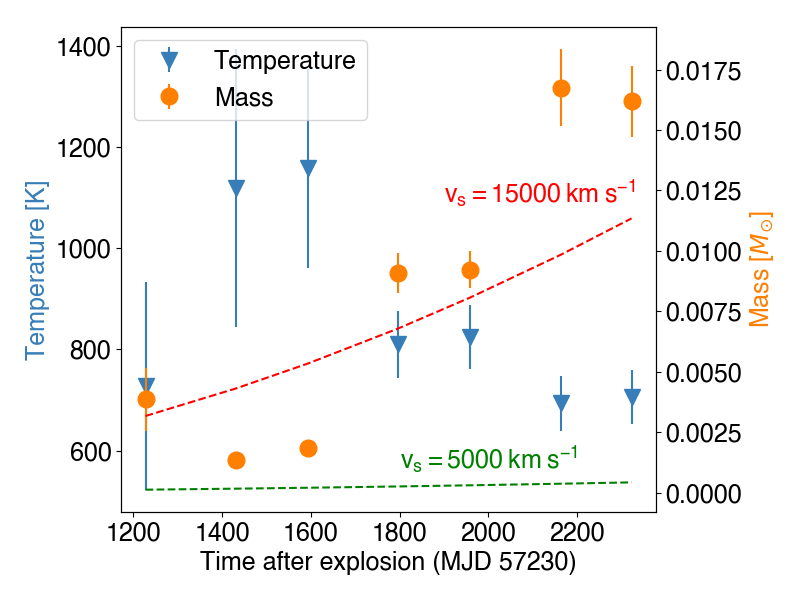
The temperature increases to a maximum of 1200 K within yr of the appearance of the MIR transient, subsequently cooling to K over the next d. At the same time, the inferred dust mass grows over time from M⊙to M⊙, potentially suggestive of new dust formation in the ejecta. We derive similar estimates for the evolution of the dust mass if we instead assume m graphitic dust, albeit at lower temperatures (cooling from K to K). We draw additional constraints on the nature of the dust emission noting that the inferred blackbody radius for a pure blackbody model provides a lower limit on the true radius of the shell (Szalai et al., 2011; Fox et al., 2010). The inferred radius increases from cm to cm over the same time period, suggesting an expansion velocity of km s-1 similar to that measured for the broad H component in the optical spectrum. If the explosion powering the dust emission began d before the MIR brightening (Figure 3), the inferred spectroscopic velocity would suggest that the ejecta radius would also evolve from cm to cm over the duration where the source is detected in WISE.
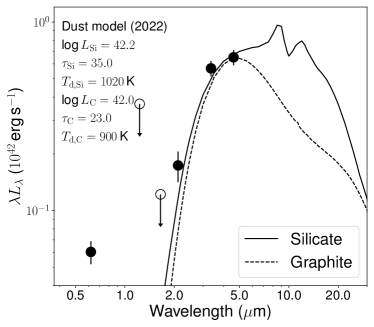
We revisit the assumption that the dust emission is optically thin by modeling the broadband spectral energy distribution (SED) with optical and near-infrared photometry. We use our only optical (-band) and NIR ( and band) constraints of the source from 2022 and fit it together with the MIR photometry using DUSTY (Ivezic & Elitzur, 1997; Ivezic et al., 1999). We assume a spherically symmetric distribution of the dust with a density profile around the central explosion and a shell outer to inner radius of . We consider both Silicate and Graphite-rich compositions for the dust with a MRN grain size distribution (Mathis et al. 1977; ) with a minimum and maximum grain size of m and m. We fit the photometry using a Markov Chain Monte Carlo (MCMC) wrapper around the DUSTY code (De et al., 2022) using the Python emcee library (Foreman-Mackey et al., 2013). The resulting free parameters of the model are the dust optical depth at m (), the inner stellar temperature (), the dust temperature at the inner edge of the shell () and the total flux (). We assume flat priors on all the fit parameters and ensure convergence of the posterior sampling chains.
The resulting fits are shown in Figure 4. We note that the 2022 -band photometry is significantly in excess of the SED models given the spectral slope from the NEOWISE to NIR bands. As discussed in Section 3.2, the -band photometry is clearly contaminated with a strong H emission line that is not part of the continuum, and therefore we exclude the -band data in the final fit. The best-fit models indicate a high optical depth of together with a dust temperature of K, similar to that inferred from the modified blackbody fitting. Both the high optical depths and the lack of longer wavelength coverage (which could allow large masses of cold dust to be missed) suggest that the derived dust masses are lower limits to the true mass. The DUSTY models also constrain the total luminosity of the dust shell to be , consistent with a luminous MIR transient. While both the silicate and graphite dust models can fit with the near to mid-IR photometry, they exhibit dramatic differences at m. These differences can be used to accurately constrain the dust composition with longer wavelength spectroscopy or photometry.
4 Discussion
4.1 A luminous MIR transient likely powered by dust formation in a shock
In Section 3, we show that WTP 19aalnxx lands among the most luminous MIR transients known in the literature, comparable only to events powered by CSM interaction. The delayed brightening of the MIR emission compared to the optical SN (at d) is similar to that suggested for core-collapse SNe exhibiting delayed interaction with distant CSM shells. Comparison of the late-time optical spectra confirm striking similarities with previously known core-collapse SNe exhibiting late-time CSM interaction. The very high inferred mass-loss rate from the optical spectra ( M⊙ yr-1) is similar to that observed in interacting SNe and the winds of Luminous Blue Variables (Smith, 2017).
We now attempt to constrain the nature of the MIR emission. The delayed brightening rules out an IR echo scenario where the MIR emission can be sustained due to light travel time effects of a pre-existing dust shell heated by the original CSM around the progenitor. The inferred minimum radius of the dust shell from the MIR photometry is consistent the expected location of the expanding ejecta at the time of the MIR brightening. While it is possible that the MIR brightening is caused by new dust formation within the cooling ejecta, we consider it unlikely due to the temporal coincidence of the MIR brightening with the onset of undulations in the optical light curve (Figure 1), indicative of CSM interaction triggering the dust emission.
If the dust is pre-existing, we use the relations in Fox et al. (2010) for the dust mass expected to be collisionally heated in the shock, and find that the measured masses exceed the model by for the likely velocity ( km s-1; Figure 4), and even in the case of a velocity of km s-1. Radiative heating of a pre-existing dust shell due to the optical brightening of the SN (Figure 1; likely due to the onset of CSM interaction) cannot be ruled out; however it is unclear why the prior optical peak (only fainter) did not produce detectable MIR emission. Another possibility is that pre-existing dust is heated due to the onset of CSM interaction at late-times, in which case the dust should lie outside the region where the ejecta is interacting with CSM. However, given the striking similarity of the estimated radius of the ejecta (measured from spectroscopy and light curve) and the dust formation radius (estimated from the MIR SED) around the time of the MIR brightening, it appears likely that new dust formation took place in the dense interaction region (Smith, 2017) consistent with the increasing dust mass (Figure 4).
4.2 An emerging population of MIR SNe outshining the optical bands
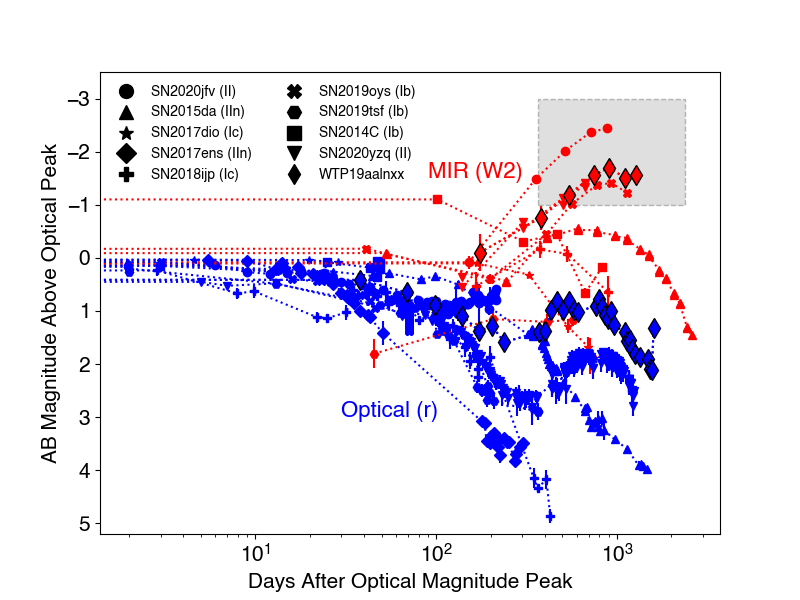
One of the most striking features of WTP 19aalnxx is its discovery as a luminous MIR transient that was completely missed in optical searches. Despite its proximity in the local universe ( Mpc), it was not spectroscopically classified or reported due to its faint peak optical magnitude of mag. While ongoing systematic SN classification experiments (e.g. Fremling et al. 2020; Neumann et al. 2023) are not sensitive to low luminosity core-collapse SNe at this distance (WTP 19aalnxx exhibits a peak absolute magnitude of ), WTP 19aalnxx is distinguished by its exceptional MIR emission that outshines the optical SN by mag. Noting that the likely interpretation of the MIR emission is due to late-time CSM interaction, we searched for known interacting SNe published in the literature to confirm similar behavior. We show a collage of the optical and MIR light curves of some published events exhibiting CSM interaction in Figure 5.
While most interaction-powered events exhibit MIR emission that is sustained in time and similar in brightness to the optical peak, we highlight a sub-sample of events (SN 2020jfv, SN 2019oys, SN 2020yzq and WTP 19aalnxx) that exhibit dramatic MIR brightening at yr after the optical peak that outshines the optical peak by mag ( in flux). All these events exhibit faint late-time rebrightening episodes in their optical light curves. To compare the IR spectra of these events to WTP 19aalnxx we show new NIR spectra of SN 2020jfv and SN 2020yzq in Figure 2. Both objects show clear signs of CSM interaction in their spectra via intermediate-width emission lines of H, He and O; however such features are not seen in the NIR spectra of WTP 19aalnxx, and we cannot rule out if the NIR spectroscopic interaction signatures in WTP 19aalnxx may have appeared at later epochs (the optical spectrum was obtained nearly a year after the NIR). A similar lack of optical spectroscopic signatures was reported for SN 2019tsf (Sollerman et al., 2020), which like WTP 19aalnxx, also exhibits a late-time MIR brightening (Figure 5).
4.3 The prevalence of core-collapse SNe exhibiting late MIR brightening
WTP 19aalnxx demonstrates that MIR studies offer a powerful probe to reveal late-time CSM interaction in core-collapse SNe even in the absence of expensive late-time optical spectroscopy (usually carried out on 6-10 m class telescopes). While previous studies of late-time MIR emission in core-collapse SNe have been primarily limited to targeted or serendipitous observations of nearby galaxies with the Spitzer space telescope (Szalai et al., 2021), the NEOWISE dataset is uniquely suited to discover events exhibiting late-time CSM interaction even in the absence of spectroscopic signatures at peak light and late times. To quantify the prevalence of MIR brightening possibly caused by CSM interaction, we use the systematic sample of spectroscopically classified core-collapse SNe reported by the Zwicky Transient Facility Bright Transient Survey (BTS; Fremling et al. 2020; Perley et al. 2020). The experiment is complete for SNe brighter than mag at peak light, and we use it to construct a controlled sample of optically discovered events between 2018-2020 (735 total SNe; ensuring years of NEOWISE data after the optical SN).
Performing forced photometry in the NEOWISE difference images (as described in Section 2), we visually search for events that i) exhibit late MIR brightening in either or bands after the fading of the optical SN and ii) are not spectroscopically classified as interacting SNe on the Transient Name Server (typically based on peak light spectroscopy) to demonstrate the utility of MIR observations in identifying late-time CSM interaction. We identify a sample of 17 core-collapse SNe exhibiting such signatures and show their optical and MIR light curves in Appendix C. While the majority of events fade below detectability in the optical bands by the time of the MIR brightening, some events indeed show late time optical plateaus and rebrightening at flux levels mags fainter than the optical peak, consistent with their interpretation as interacting SNe. Constructing a volume-limited sub-sample of events with (corresponding to a complete sample of SNe brighter than mag at the depth of BTS), we find a lower limit333The derived numbers represent a lower limit due to the six-month NEOWISE cadence, where faint late-time re-brightening episodes near the detection threshold may be missed in the observing gap. of % of core-collapse SNe (12 out of 495) without early spectroscopic interaction signatures exhibit late MIR brightening with mag (the NEOWISE sensitivity) at d (corresponding to CSM located at cm for a shock velocity of km s-1) from optical peak.
5 Summary
We present the discovery and characterization of WTP 19aalnxx a luminous MIR transient in the outskirts of a spiral galaxy at Mpc. Based on i) the timescale and luminosity of its MIR light curve, ii) faint optical light curve exhibiting multiple rebrightening episodes, iii) spectroscopic signatures of CSM interaction without nebular Fe emission and iv) temporal evolution of the dust temperature and mass derived from the MIR light curve, we suggest that WTP 19aalnxx is a low luminosity core-collapse SN exhibiting dramatic MIR brightening powered by delayed CSM interaction. By inspection of known interacting SNe from the literature, we highlight an emerging population of core-collapse SNe exhibiting delayed MIR brightening episodes that completely outshine the parent optical SN. Not only do these episodes offer a completely new route to both discovering massive stellar death in the local universe, they offer direct evidence for likely detached CSM shells around the progenitors of core-collapse SNe possibly arising from eruptive mass loss in the decades to centuries prior to explosion.
Investigating the spectroscopically complete sample of nearby core-collapse SNe from the Zwicky Transient Facility, we identify a sample of 17 events that exhibit late-time MIR brightening episodes that do not otherwise exhibit spectroscopic interaction signatures at peak light. Our findings suggest that % of core-collapse SNe exhibit delayed CSM interaction signatures; while a detailed analysis confirming whether these brightening episodes are consistent with CSM interaction is beyond the scope of this paper, such searches can motivate targeted optical spectroscopic follow-up to confirm as well as measure the composition and dynamics of the CSM shells. Longer wavelength follow-up with the JWST offers the only opportunity to accurately measure the dust chemistry and distribution (Figure 4). Finally, upcoming synoptic IR surveys from the ground like WINTER (Lourie et al., 2020) and PRIME (Kondo et al., 2023) as well as in space, like the NEO-Surveyor mission (Mainzer et al., 2023) and Roman high latitude time domain survey (e.g. Wang et al. 2023), will open new windows into revealing this population owing to both their increased sensitivity as well as the larger detectable volume for interacting IR SNe that outshine their optical counterparts.
Acknowledgments
.
We thank Y. Sharma for providing the optical spectra of SNe Ia-CSM events. K. D. was supported by NASA through the NASA Hubble Fellowship grant #HST-HF2-51477.001 awarded by the Space Telescope Science Institute, which is operated by the Association of Universities for Research in Astronomy, Inc., for NASA, under contract NAS5-26555. This work was supported by a NASA Keck PI Data Award, administered by the NASA Exoplanet Science Institute. Data presented herein were obtained at the W. M. Keck Observatory from telescope time allocated to the National Aeronautics and Space Administration through the agency’s scientific partnership with the California Institute of Technology and the University of California. The Observatory was made possible by the generous financial support of the W. M. Keck Foundation. The authors wish to recognize and acknowledge the very significant cultural role and reverence that the summit of Maunakea has always had within the indigenous Hawaiian community. We are most fortunate to have the opportunity to conduct observations from this mountain. This research has made use of the Keck Observatory Archive (KOA), which is operated by the W. M. Keck Observatory and the NASA Exoplanet Science Institute (NExScI), under contract with the National Aeronautics and Space Administration. This paper includes data gathered with the 6.5 meter Magellan Telescopes located at Las Campanas Observatory, Chile. Based in part on observations obtained at the Southern Astrophysical Research (SOAR) telescope, which is a joint project of the Ministério da Ciência, Tecnologia e Inovações do Brasil (MCTI/LNA), the US National Science Foundation’s NOIRLab, the University of North Carolina at Chapel Hill (UNC), and Michigan State University (MSU).
References
- Bellm et al. (2019) Bellm, E. C., Kulkarni, S. R., Graham, M. J., et al. 2019, PASP, 131, 018002, doi: 10.1088/1538-3873/aaecbe
- Bruch et al. (2021) Bruch, R. J., Gal-Yam, A., Schulze, S., et al. 2021, ApJ, 912, 46, doi: 10.3847/1538-4357/abef05
- Cai et al. (2021) Cai, Y. Z., Pastorello, A., Fraser, M., et al. 2021, A&A, 654, A157, doi: 10.1051/0004-6361/202141078
- Chambers et al. (2016) Chambers, K. C., Magnier, E. A., Metcalfe, N., et al. 2016, arXiv e-prints, arXiv:1612.05560. https://arxiv.org/abs/1612.05560
- Chen et al. (2018) Chen, T. W., Inserra, C., Fraser, M., et al. 2018, ApJ, 867, L31, doi: 10.3847/2041-8213/aaeb2e
- Chevalier & Fransson (2017) Chevalier, R. A., & Fransson, C. 2017, in Handbook of Supernovae, ed. A. W. Alsabti & P. Murdin, 875, doi: 10.1007/978-3-319-21846-5_34
- Clemens et al. (2004) Clemens, J. C., Crain, J. A., & Anderson, R. 2004, in Society of Photo-Optical Instrumentation Engineers (SPIE) Conference Series, Vol. 5492, Ground-based Instrumentation for Astronomy, ed. A. F. M. Moorwood & M. Iye, 331–340, doi: 10.1117/12.550069
- Cook et al. (2019) Cook, D. O., Kasliwal, M. M., Van Sistine, A., et al. 2019, ApJ, 880, 7, doi: 10.3847/1538-4357/ab2131
- Das et al. (2023) Das, K. K., Kasliwal, M. M., Sollerman, J., et al. 2023, arXiv e-prints, arXiv:2306.04698, doi: 10.48550/arXiv.2306.04698
- De et al. (2020a) De, K., Hankins, M. J., Kasliwal, M. M., et al. 2020a, PASP, 132, 025001, doi: 10.1088/1538-3873/ab6069
- De et al. (2020b) De, K., Kasliwal, M. M., Tzanidakis, A., et al. 2020b, ApJ, 905, 58, doi: 10.3847/1538-4357/abb45c
- De et al. (2022) De, K., Mereminskiy, I., Soria, R., et al. 2022, arXiv e-prints, arXiv:2205.09139. https://arxiv.org/abs/2205.09139
- De et al. (2023) De, K., MacLeod, M., Karambelkar, V., et al. 2023, Nature, 617, 55, doi: 10.1038/s41586-023-05842-x
- Dey et al. (2019) Dey, A., Schlegel, D. J., Lang, D., et al. 2019, AJ, 157, 168, doi: 10.3847/1538-3881/ab089d
- Draine & Li (2001) Draine, B. T., & Li, A. 2001, ApJ, 551, 807, doi: 10.1086/320227
- Fabbri et al. (2011) Fabbri, J., Otsuka, M., Barlow, M. J., et al. 2011, MNRAS, 418, 1285, doi: 10.1111/j.1365-2966.2011.19577.x
- Filippenko (1997) Filippenko, A. V. 1997, ARA&A, 35, 309, doi: 10.1146/annurev.astro.35.1.309
- Foreman-Mackey et al. (2013) Foreman-Mackey, D., Hogg, D. W., Lang, D., & Goodman, J. 2013, PASP, 125, 306, doi: 10.1086/670067
- Fox et al. (2010) Fox, O. D., Chevalier, R. A., Dwek, E., et al. 2010, ApJ, 725, 1768, doi: 10.1088/0004-637X/725/2/1768
- Fox et al. (2011) Fox, O. D., Chevalier, R. A., Skrutskie, M. F., et al. 2011, ApJ, 741, 7, doi: 10.1088/0004-637X/741/1/7
- Fremling et al. (2020) Fremling, C., Miller, A. A., Sharma, Y., et al. 2020, ApJ, 895, 32, doi: 10.3847/1538-4357/ab8943
- Gal-Yam (2017) Gal-Yam, A. 2017, in Handbook of Supernovae, ed. A. W. Alsabti & P. Murdin, 195, doi: 10.1007/978-3-319-21846-5_35
- Groh et al. (2013) Groh, J. H., Meynet, G., & Ekström, S. 2013, A&A, 550, L7, doi: 10.1051/0004-6361/201220741
- Ivezic & Elitzur (1997) Ivezic, Z., & Elitzur, M. 1997, Mon. Not. R. Astron. Soc., 287, 799, doi: 10.1093/mnras/287.4.799
- Ivezic et al. (1999) Ivezic, Z., Nenkova, M., & Elitzur, M. 1999, arXiv e-prints, astro. https://arxiv.org/abs/astro-ph/9910475
- Jacobson-Galán et al. (2024) Jacobson-Galán, W. V., Dessart, L., Davis, K. W., et al. 2024, arXiv e-prints, arXiv:2403.02382, doi: 10.48550/arXiv.2403.02382
- Kondo et al. (2023) Kondo, I., Sumi, T., Koshimoto, N., et al. 2023, AJ, 165, 254, doi: 10.3847/1538-3881/acccf9
- Kuncarayakti et al. (2018) Kuncarayakti, H., Maeda, K., Ashall, C. J., et al. 2018, ApJ, 854, L14, doi: 10.3847/2041-8213/aaaa1a
- Lang (2014) Lang, D. 2014, AJ, 147, 108, doi: 10.1088/0004-6256/147/5/108
- Loh et al. (2012) Loh, E. D., Biel, J. D., Davis, M. W., et al. 2012, PASP, 124, 343, doi: 10.1086/665597
- Lourie et al. (2020) Lourie, N. P., Baker, J. W., Burruss, R. S., et al. 2020, in Society of Photo-Optical Instrumentation Engineers (SPIE) Conference Series, Vol. 11447, Society of Photo-Optical Instrumentation Engineers (SPIE) Conference Series, 114479K, doi: 10.1117/12.2561210
- Mainzer et al. (2014) Mainzer, A., Bauer, J., Cutri, R. M., et al. 2014, ApJ, 792, 30, doi: 10.1088/0004-637X/792/1/30
- Mainzer et al. (2023) Mainzer, A. K., Masiero, J. R., Abell, P. A., et al. 2023, \psj, 4, 224, doi: 10.3847/PSJ/ad0468
- Masci et al. (2023) Masci, F. J., Laher, R. R., Rusholme, B., et al. 2023, arXiv e-prints, arXiv:2305.16279, doi: 10.48550/arXiv.2305.16279
- Mathis et al. (1977) Mathis, J. S., Rumpl, W., & Nordsieck, K. H. 1977, Astrophys. J., 217, 425, doi: 10.1086/155591
- Mauerhan et al. (2018) Mauerhan, J. C., Filippenko, A. V., Zheng, W., et al. 2018, MNRAS, 478, 5050, doi: 10.1093/mnras/sty1307
- Meikle et al. (2011) Meikle, W. P. S., Kotak, R., Farrah, D., et al. 2011, ApJ, 732, 109, doi: 10.1088/0004-637X/732/2/109
- Meisner et al. (2018) Meisner, A. M., Lang, D., & Schlegel, D. J. 2018, AJ, 156, 69, doi: 10.3847/1538-3881/aacbcd
- Neumann et al. (2023) Neumann, K. D., Holoien, T. W. S., Kochanek, C. S., et al. 2023, MNRAS, 520, 4356, doi: 10.1093/mnras/stad355
- Nyholm et al. (2020) Nyholm, A., Sollerman, J., Tartaglia, L., et al. 2020, A&A, 637, doi: 10.1051/0004-6361/201936097
- Oke et al. (1995) Oke, J. B., Cohen, J. G., Carr, M., et al. 1995, PASP, 107, 375, doi: 10.1086/133562
- Pastorello et al. (2019) Pastorello, A., Mason, E., Taubenberger, S., et al. 2019, A&A, 630, A75, doi: 10.1051/0004-6361/201935999
- Perley (2019) Perley, D. A. 2019, PASP, 131, 084503, doi: 10.1088/1538-3873/ab215d
- Perley et al. (2020) Perley, D. A., Fremling, C., Sollerman, J., et al. 2020, ApJ, 904, 35, doi: 10.3847/1538-4357/abbd98
- Prochaska et al. (2020) Prochaska, J., Hennawi, J., Westfall, K., et al. 2020, The Journal of Open Source Software, 5, 2308, doi: 10.21105/joss.02308
- Puls et al. (2008) Puls, J., Vink, J. S., & Najarro, F. 2008, A&A Rev., 16, 209, doi: 10.1007/s00159-008-0015-8
- Shahbandeh et al. (2023) Shahbandeh, M., Sarangi, A., Temim, T., et al. 2023, MNRAS, 523, 6048, doi: 10.48550/arXiv.2301.10778
- Sharma et al. (2023) Sharma, Y., Sollerman, J., Fremling, C., et al. 2023, ApJ, 948, 52, doi: 10.3847/1538-4357/acbc16
- Simcoe et al. (2013) Simcoe, R. A., Burgasser, A. J., Schechter, P. L., et al. 2013, PASP, 125, 270, doi: 10.1086/670241
- Smith (2014) Smith, N. 2014, ARA&A, 52, 487, doi: 10.1146/annurev-astro-081913-040025
- Smith (2017) —. 2017, in Handbook of Supernovae, ed. A. W. Alsabti & P. Murdin, 403, doi: 10.1007/978-3-319-21846-5_38
- Sollerman et al. (2020) Sollerman, C., Fransson, C., Barbarino1, C., et al. 2020, Å, 643, 12, doi: 10.1051/0004-6361/202038960
- Sollerman et al. (2021) Sollerman, J., Yang, S., Schulze, S., et al. 2021, A&A, 655, A105, doi: 10.1051/0004-6361/202141374
- Spiro et al. (2014) Spiro, S., Pastorello, A., Pumo, M. L., et al. 2014, MNRAS, 439, 2873–2892, doi: 10.1093/mnras/stu156
- Szalai & Vinkó (2013) Szalai, T., & Vinkó, J. 2013, A&A, 549, A79, doi: 10.1051/0004-6361/201220015
- Szalai et al. (2011) Szalai, T., Vinkó, J., Balog, Z., et al. 2011, A&A, 527, A61, doi: 10.1051/0004-6361/201015624
- Szalai et al. (2019) Szalai, T., Zsíros, S., Fox, O. D., Pejcha, O., & Müller, T. 2019, ApJS, 241, 38, doi: 10.3847/1538-4365/ab10df
- Szalai et al. (2021) Szalai, T., Fox, O. D., Arendt, R. G., et al. 2021, ApJ, 919, 17, doi: 10.3847/1538-4357/ac0e2b
- Tartaglia et al. (2020) Tartaglia, L., Pastorello, A., Sollerman, J., et al. 2020, A&A, 635, A39, doi: 10.1051/0004-6361/201936553
- Tinyanont et al. (2016) Tinyanont, S., Kasliwal, M. M., Fox, O. D., et al. 2016, ApJ, 833, 231, doi: 10.3847/1538-4357/833/2/231
- Tinyanont et al. (2019) Tinyanont, S., Lau, R. M., Kasliwal, M. M., et al. 2019, ApJ, 887, doi: 10.3847/1538-4357/ab521b
- Tonry et al. (2018) Tonry, J. L., Denneau, L., Heinze, A. N., et al. 2018, PASP, 130, 064505, doi: 10.1088/1538-3873/aabadf
- van der Walt et al. (2019) van der Walt, S., Crellin-Quick, A., & Bloom, J. 2019, The Journal of Open Source Software, 4, 1247, doi: 10.21105/joss.01247
- Wang et al. (2023) Wang, K. X., Scolnic, D., Troxel, M. A., et al. 2023, MNRAS, 523, 3874, doi: 10.1093/mnras/stad1652
- Wilson et al. (2003) Wilson, J. C., Eikenberry, S. S., Henderson, C. P., et al. 2003, in Society of Photo-Optical Instrumentation Engineers (SPIE) Conference Series, Vol. 4841, Instrument Design and Performance for Optical/Infrared Ground-based Telescopes, ed. M. Iye & A. F. M. Moorwood, 451–458, doi: 10.1117/12.460336
- Wright et al. (2010) Wright, E. L., Eisenhardt, P. R. M., Mainzer, A. K., et al. 2010, AJ, 140, 1868, doi: 10.1088/0004-6256/140/6/1868
- Zackay et al. (2016) Zackay, B., Ofek, E. O., & Gal-Yam, A. 2016, ApJ, 830, 27, doi: 10.3847/0004-637X/830/1/27
- Zhang et al. (2020) Zhang, J., Zhai, Q., Wang, C., & Wang, X. 2020, Transient Name Server Classification Report, 2020-3388, 1
Appendix A Archival light curve processing
While a faint optical transient is reported at the WISE position in the ZTF alert stream as ZTF18abxgjqx444https://lasair-ztf.lsst.ac.uk/objects/ZTF18abxgjqx/, the source is marked as a negative transient, indicating that the transient flux contaminates the ZTF reference images. We therefore derived the ZTF light curve by performing forced difference photometry (Masci et al., 2023) followed by addition of the source flux reported in the ZTF reference image catalog. We directly use difference photometry fluxes from the ATLAS forced photometry server555https://fallingstar-data.com/forcedphot/ since the reference images were acquired earlier. In both cases, we stack the photometry in time bins of d to improve the signal to noise ratio. We clearly detect a faint optical transient in the archival light curves detected between 2015 and 2023. We also retrieved reduced images from the PanSTARRS survey (Chambers et al., 2016) obtained between 2009 and 2014, and performed forced difference imaging photometry using a custom pipeline (De et al., 2022). We only obtain non-detections in PS1 images.
Appendix B Follow-up imaging and spectroscopy
On UT 2022-09-08, we obtained one epoch of and band NIR imaging of WTP 19aalnxx using the Wide-field Infrared Camera (WIRC; Wilson et al. 2003) on the Palomar 200-inch telescope. A series of dithered exposures amounting to a total exposure time of s were obtained in each filter. The data were reduced and calibrated to the 2MASS system using a custom pipeline (De et al., 2020b). While a faint point source is detected at mag, no source is detected in -band to a limiting magnitude of mag. On UT 2023-01-07, -band images were obtained with the Spartan NIR camera (Loh et al., 2012) on the 4.1 m Southern Astrophysical Research (SOAR) Telescope (SOAR 2022B-005; PI: De). We obtained a set of dithered images amounting to a total exposure time of s, and reduced the data using a custom pipeline (De et al., 2020b). No source is detected at the transient position to a limit of mag. We obtained one epoch of optical imaging on UT 2022-11-28, using the Goodman High Throughput Spectrograph (Clemens et al., 2004) on the SOAR telescope. We obtained four exposures amounting to a total exposure time of s in -band. The data were reduced, calibrated and processed through image subtraction using a custom pipeline (De et al., 2020b) using templates from the Legacy Survey (Dey et al., 2019). At the position of the mid-IR transient, we clearly detect a faint point source with a magnitude of mag.
On UT 2022-10-15, we obtained NIR spectrum of WTP 19aalnxx as part of our ongoing NASA Keck program on the NIRES (Wilson et al., 2003) instrument (2022B_N187; PI: De). We obtained a series of dithered exposures amounting to a total exposure time of s, in addition to a nearby telluric standard star. The data were reduced and calibrated using the pypeit package (Prochaska et al., 2020). On UT 2023-05-27, we obtained an optical spectrum of the source using the LDSS-3 spectrograph on the Magellan/Clay telescope. The data were obtained using the VPH-Red grism for a total exposure time of minutes. The data were reduced using the pypeit package (Prochaska et al., 2020), and we clearly detect a broad H emission line at the transient position. On UT 2023-07-23, we obtained an optical spectrum of the source using the Low Resolution Imaging Spectrometer (LRIS; Oke et al. 1995) on the Keck-I telescope (PI: Fremling), for a total exposure time of s. The data were reduced and extracted using the Lpipe code (Perley, 2019). In addition to WTP 19aalnxx, we obtained NIR spectra using the Magellan Baade/FIRE spectrograph (Simcoe et al., 2013) of two similar MIR SNe identified in NEOWISE – SN 2020jfv and SN 2020yzq (Section 4). SN 2020jfv was observed on UT 2022-08-18 using the prism mode for a total exposure time of s, while SN 2020yzq was observed on UT 2023-08-31 using the echelle mode for a total exposure time of s. The data were reduced using the pypeit package (Prochaska et al., 2020). The spectra are presented in Figure 2.
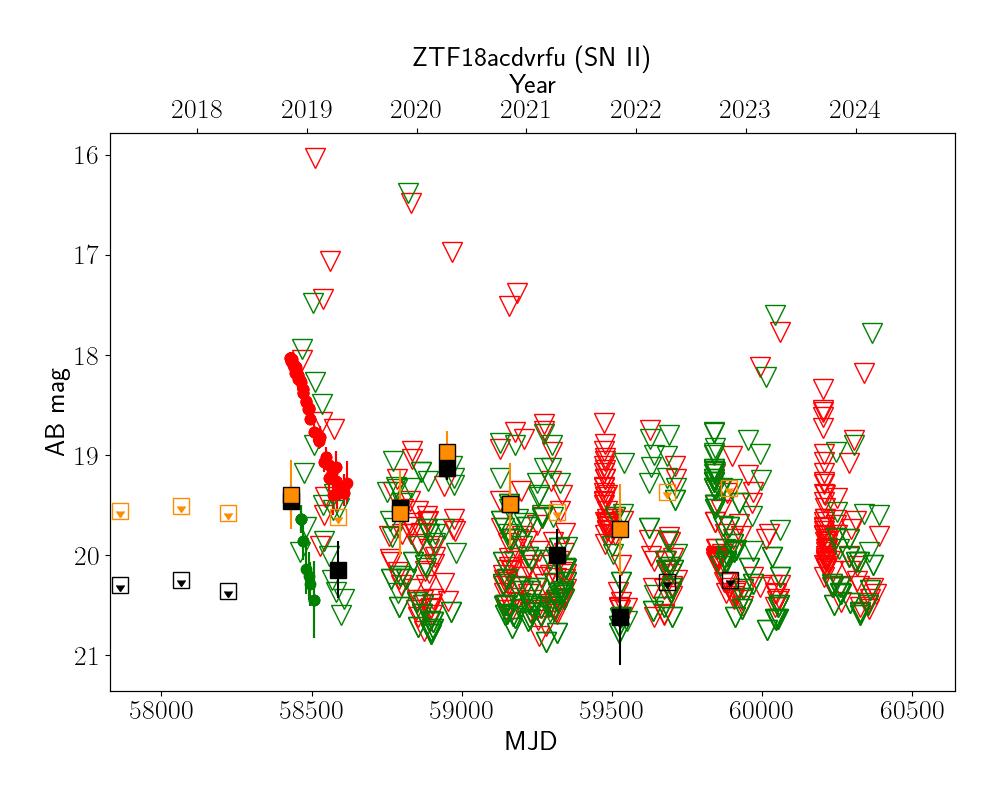
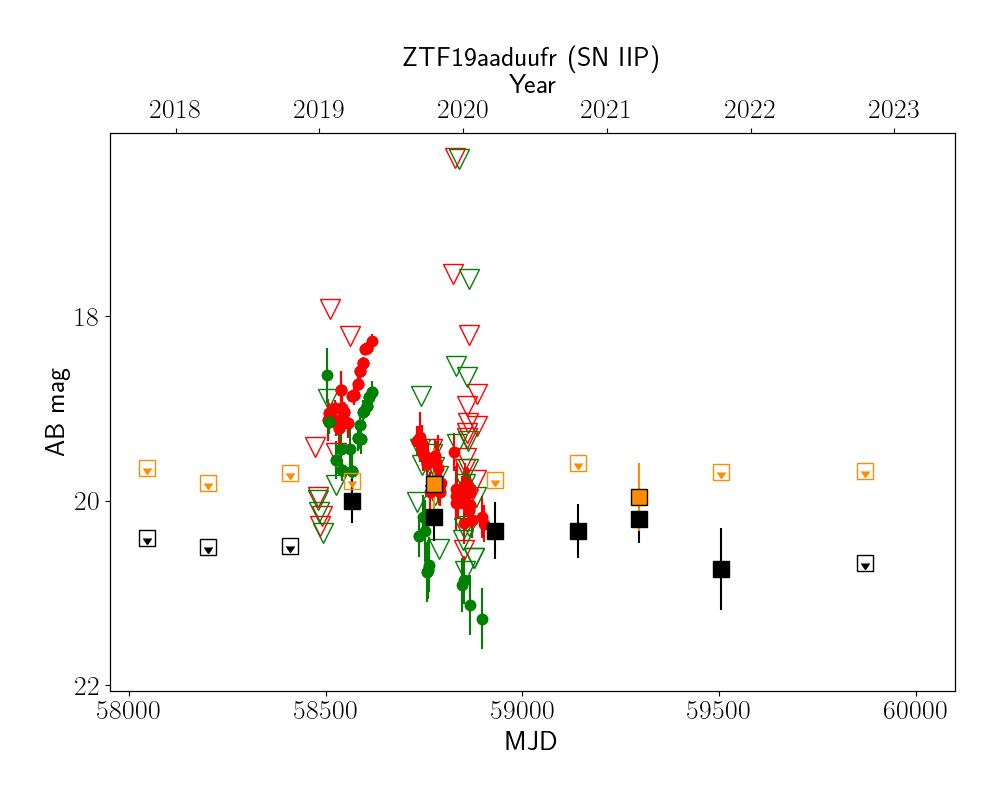
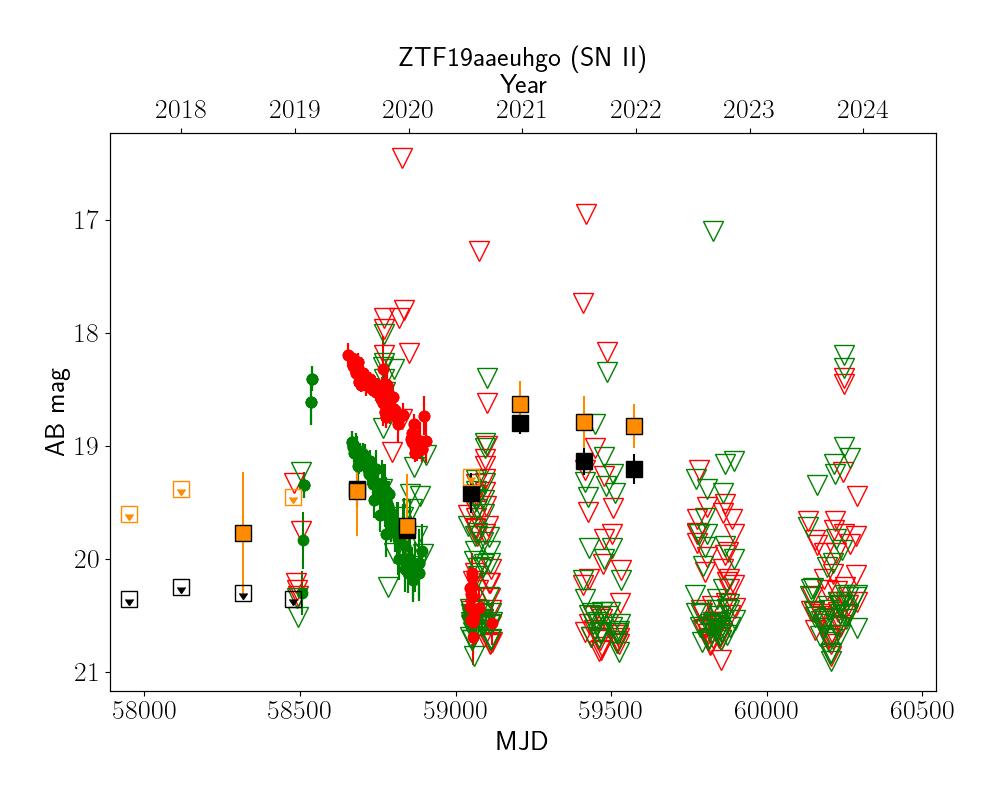
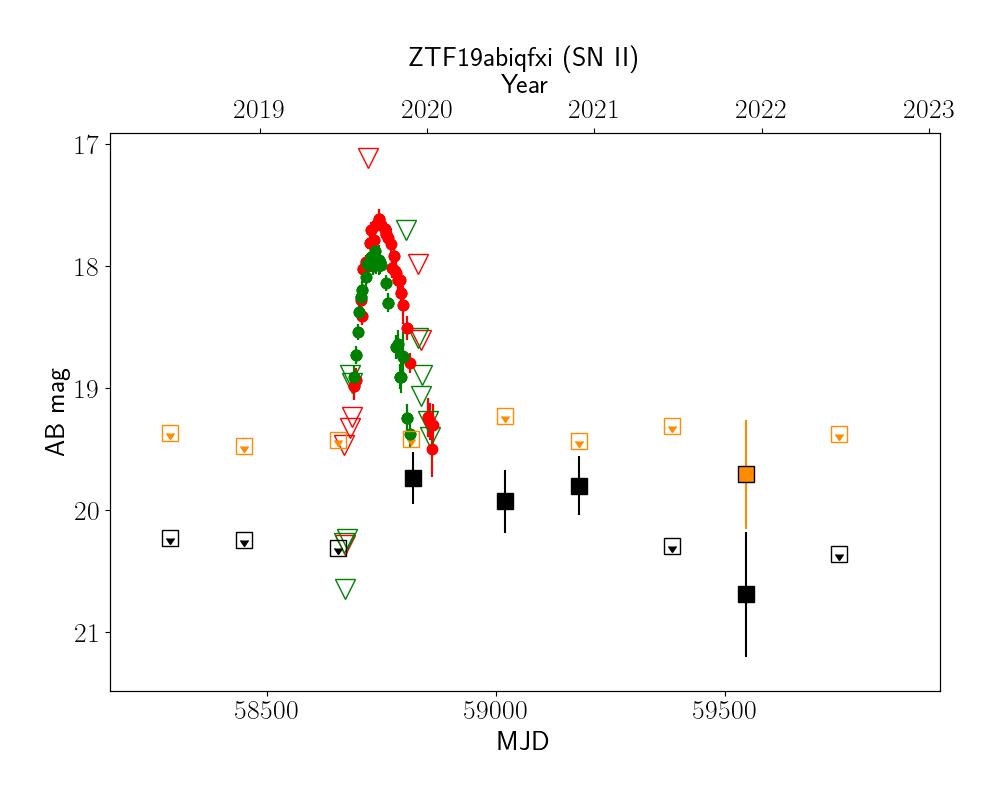
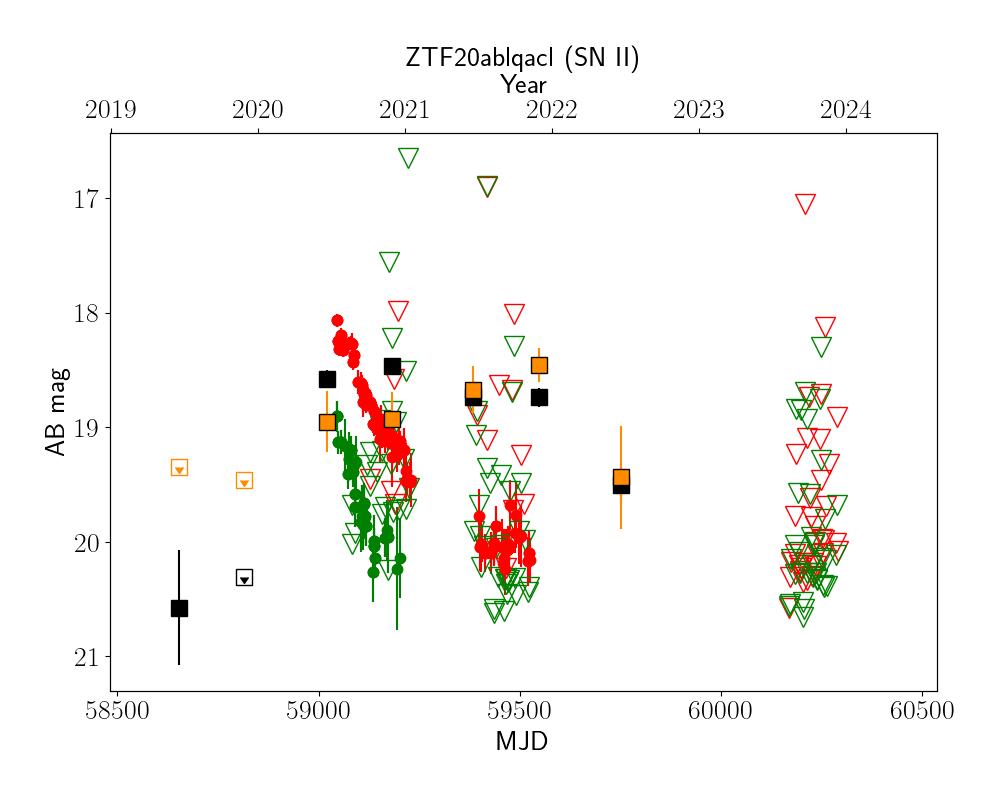
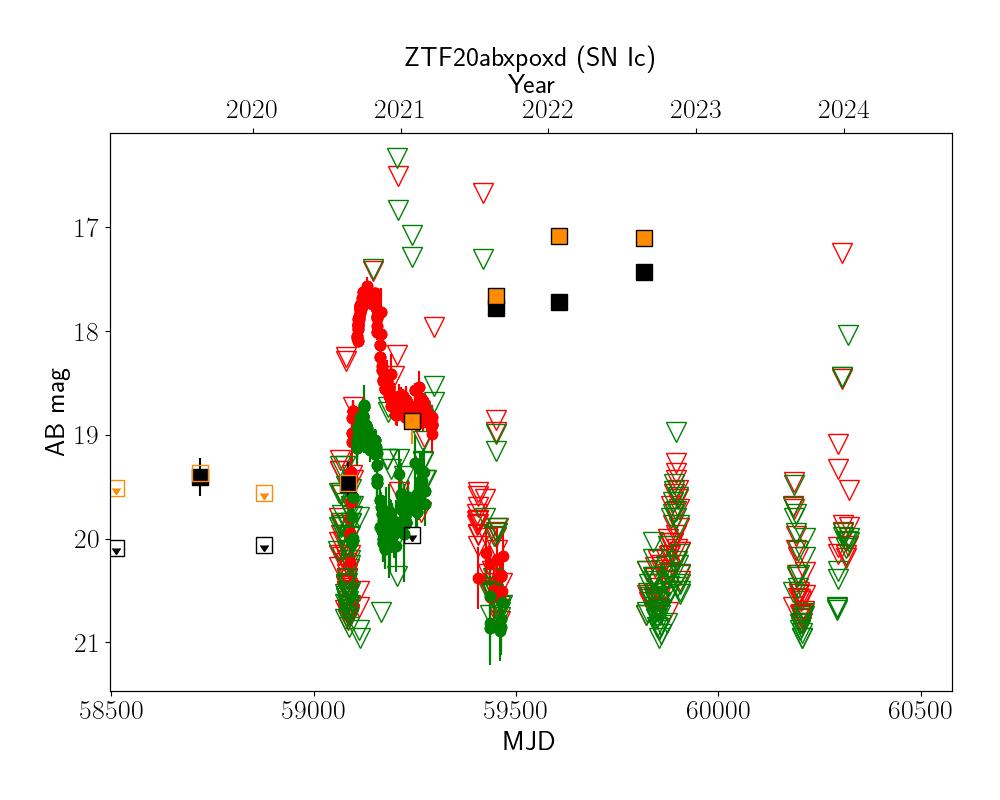
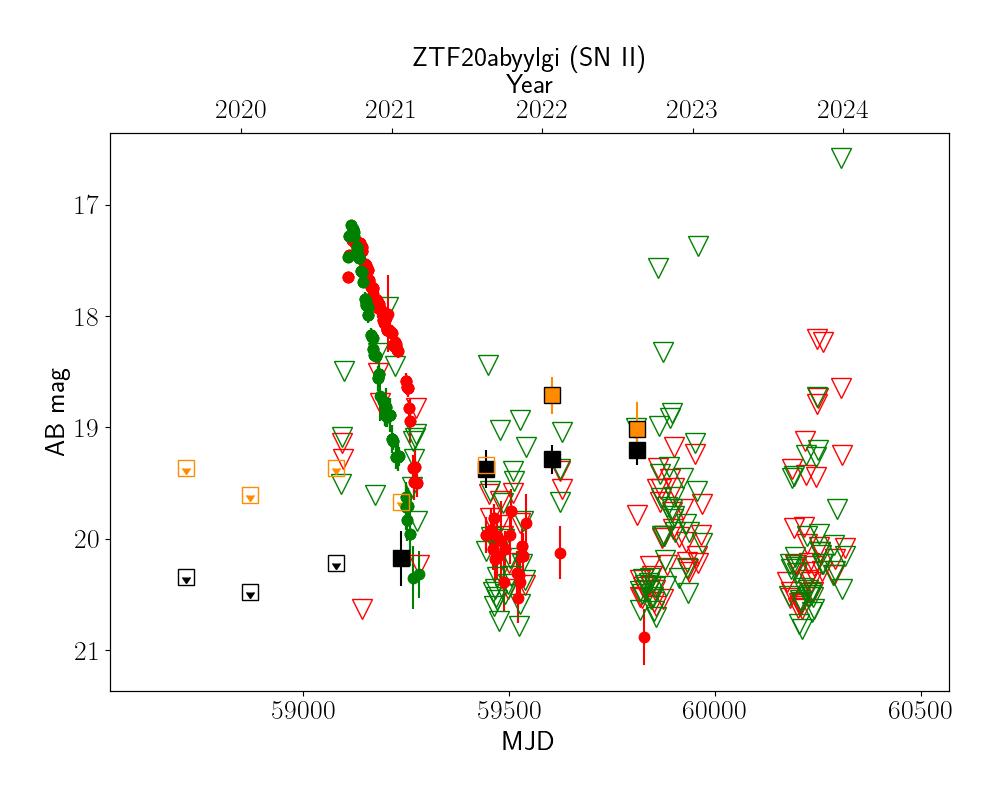
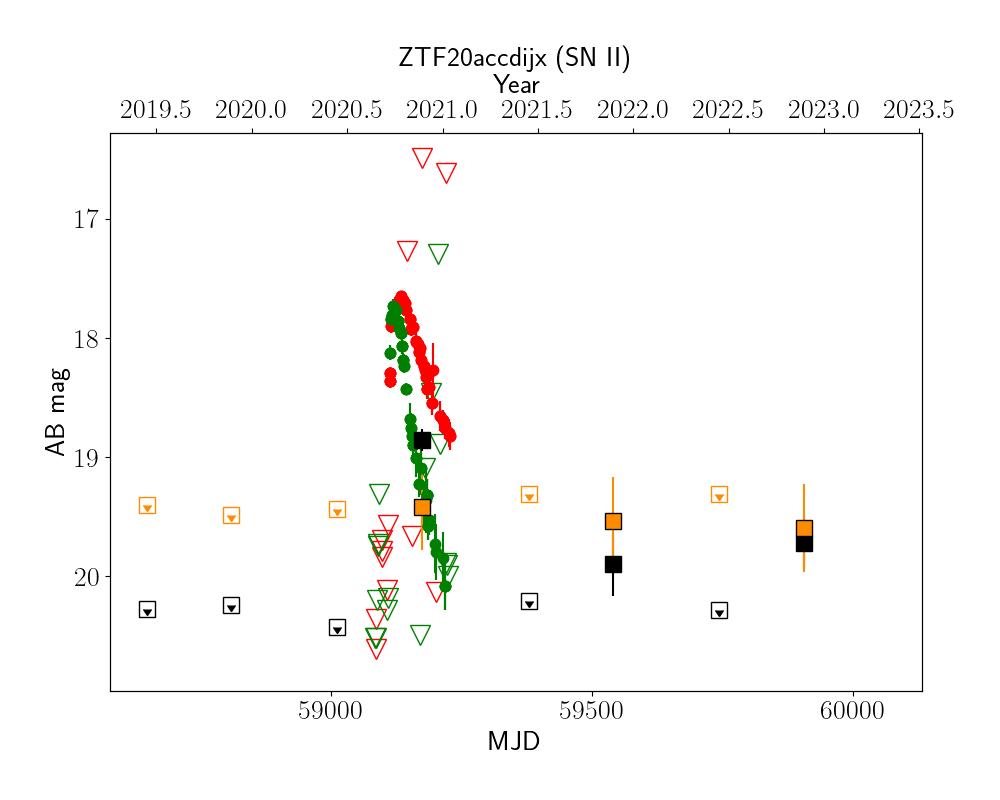
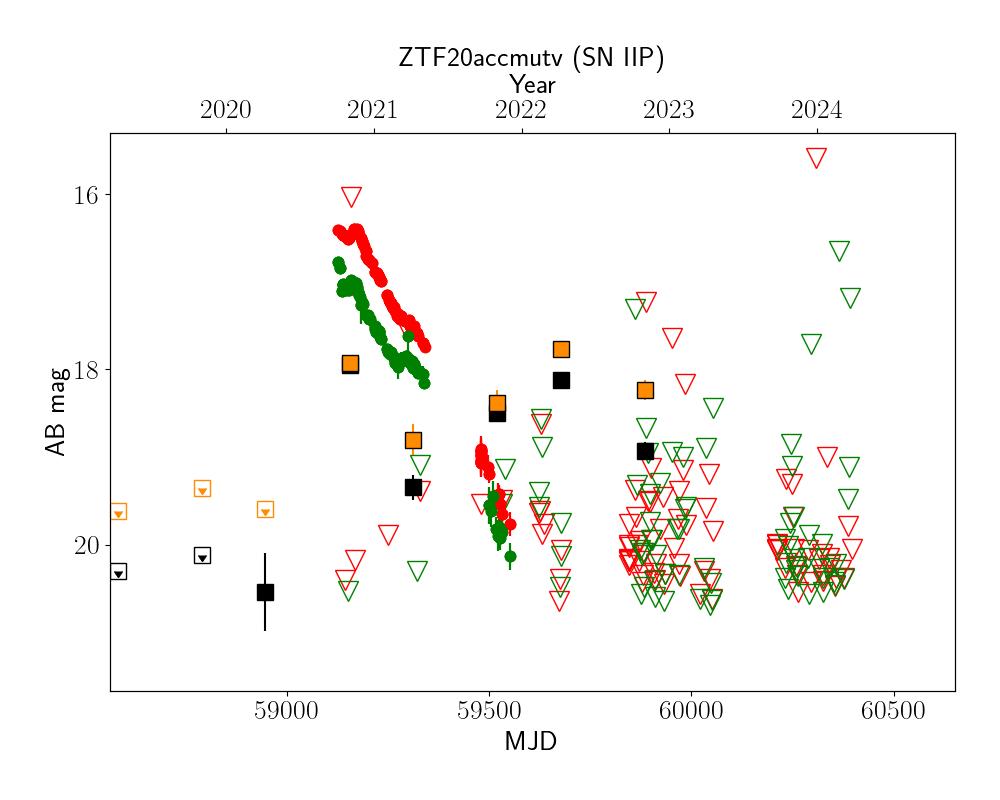
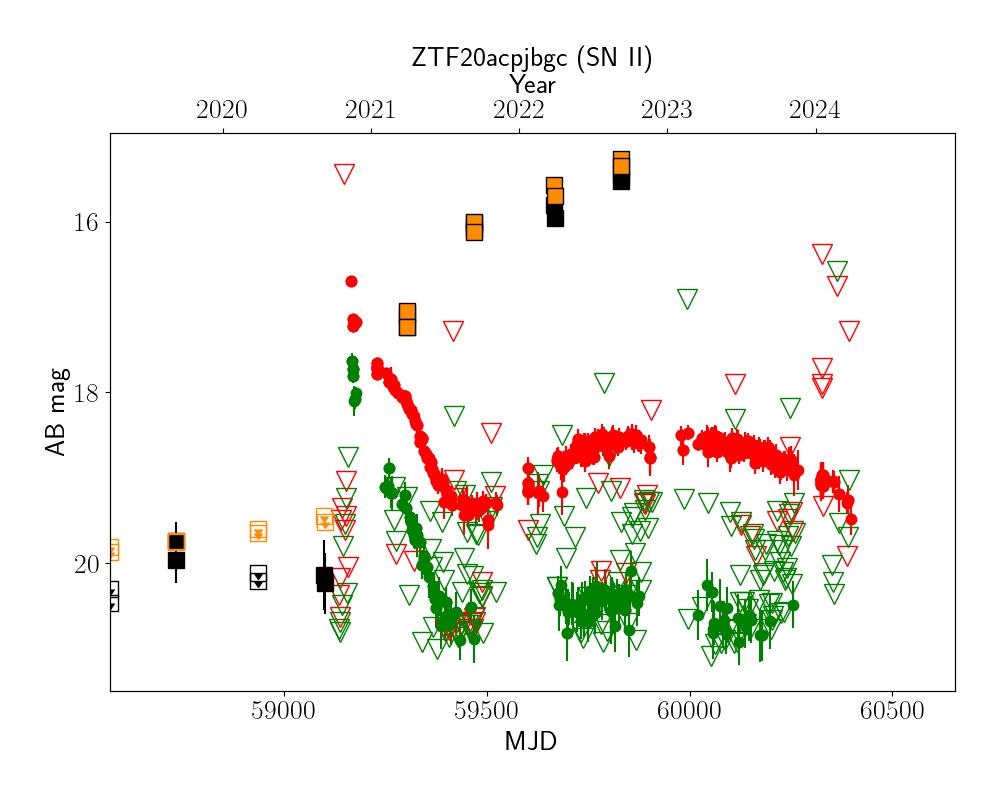
Appendix C Delayed MIR brightenings in BTS SNe
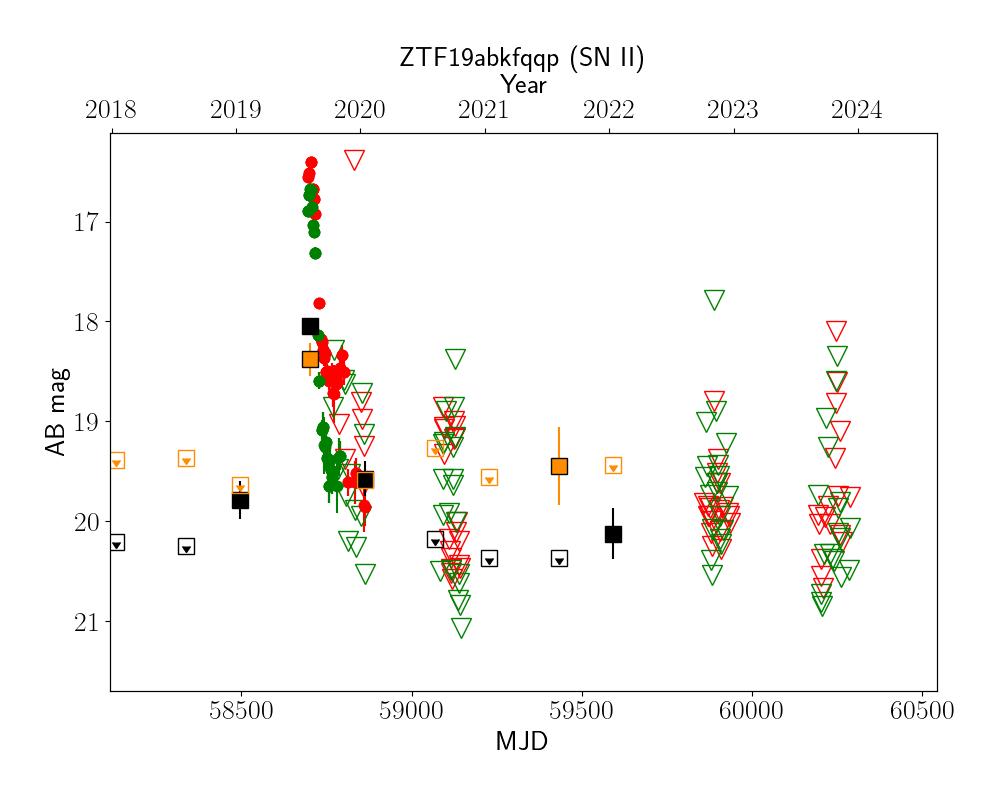
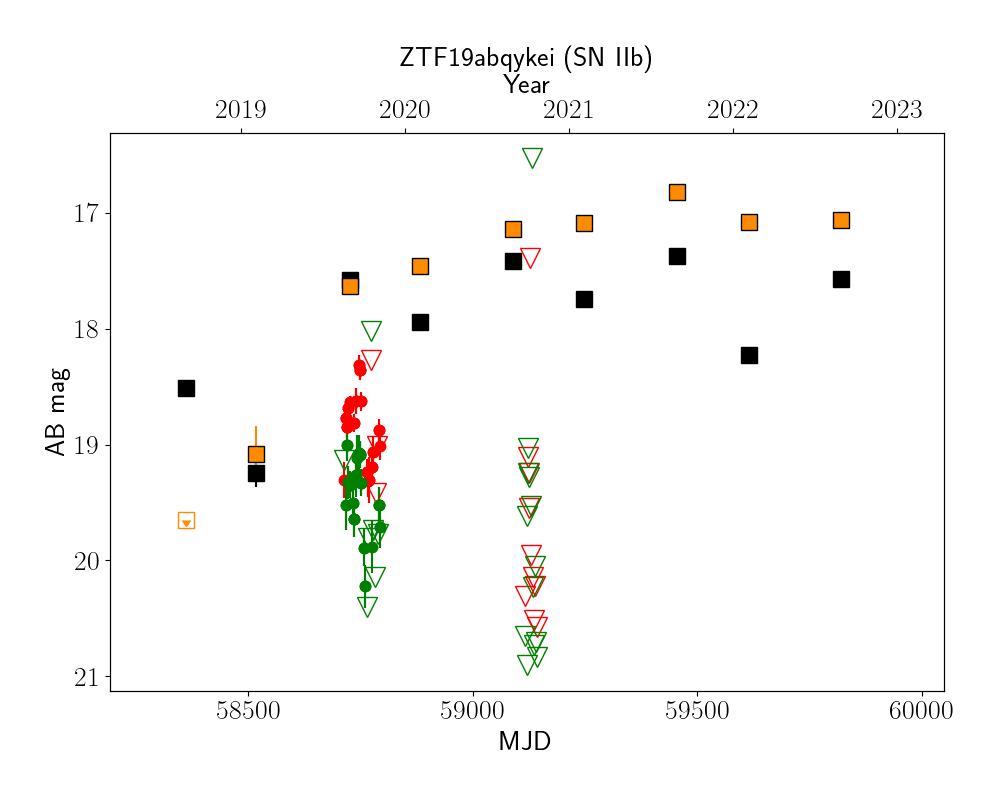
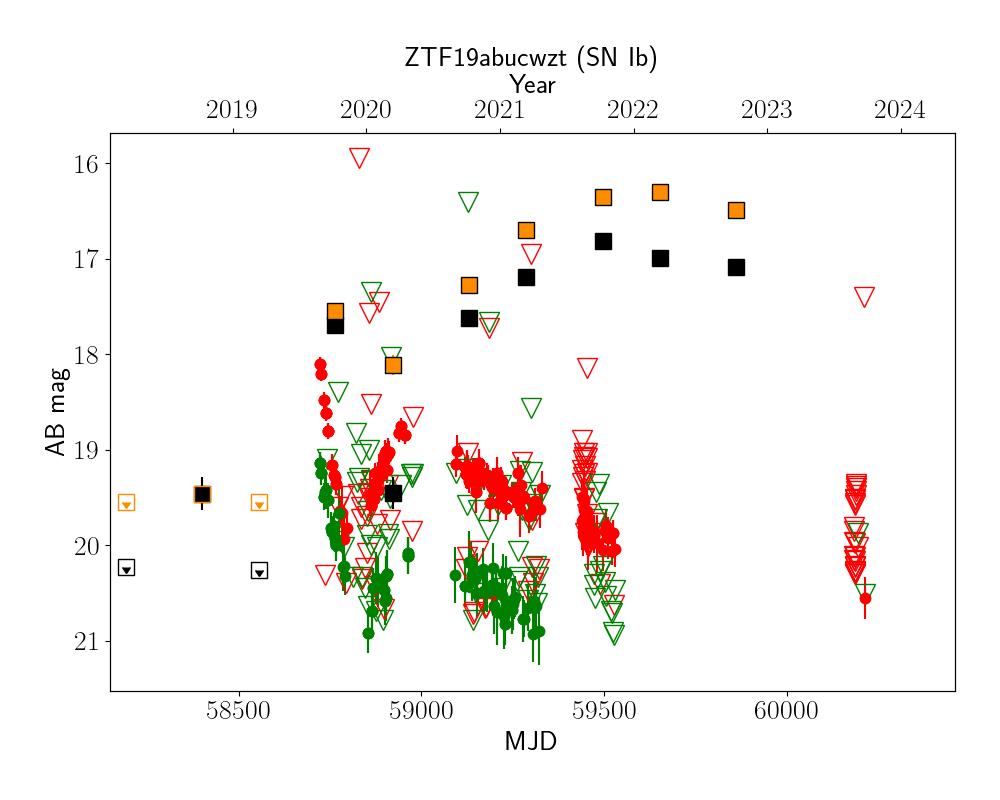
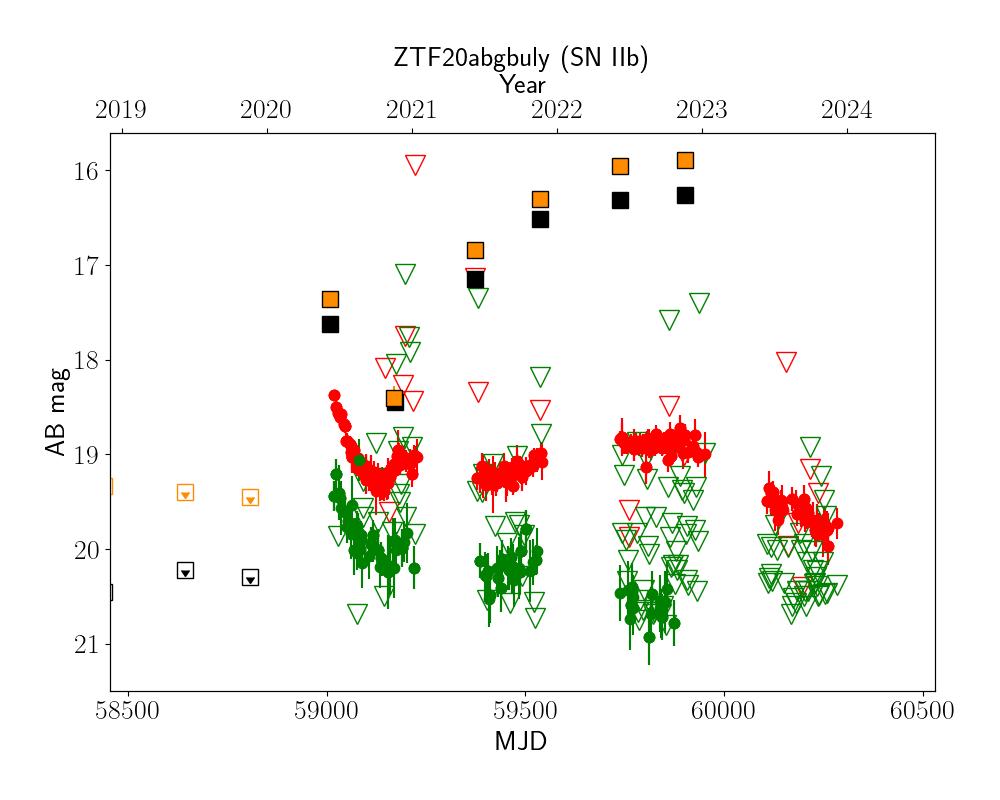
In this section, we show optical and MIR light curves of core-collapse SNe from the Bright Transient Survey (Fremling et al., 2020; Perley et al., 2020) identified to exhibit late-time MIR brightening in NEOWISE. The ZTF photometry was obtained from the publicly available alert packets (Bellm et al., 2019) while the NEOWISE photometry is from our forced difference photometry pipeline. The light curves are shown in Figures 6 and 7. The complete list of objects and their properties are summarized in Table 1.
| ZTF Name | IAU Name | Optical Peak | NEOWISE Peak | Type | Redshift | ||
|---|---|---|---|---|---|---|---|
| Mag (band) | Mag (band) | ||||||
| ZTF 18acdvrfu | SN 2018hov | 18.04 () | -19.23 | 18.98 (W2) | -18.29 | SN II | 0.067 |
| ZTF 18acgvgiq | SN 2018fru | 16.65 () | -16.57 | 18.64 (W1) | -14.58 | SN II | 0.01026 |
| ZTF 19aaduufr | SN 2019bjr | 18.27 () | -17.6 | 19.82 (W2) | -16.05 | SN IIP | 0.035 |
| ZTF 19aaeuhgo | SN 2019bcv | 18.20 () | -19.09 | 18.64 (W2) | -18.65 | SN II | 0.0678 |
| ZTF 19abiqfxi | SN 2019ltz | 17.61 () | -19.21 | 19.71 (W2) | -17.11 | SN II | 0.0542 |
| ZTF 19abjbtbm | SN 2019lzq | 17.47 () | -18.69 | 19.64 (W1) | -16.52 | SN II | 0.04 |
| ZTF 19abkfqqp | SN 2019knu | 16.40 () | -19.14 | 18.04 (W1) | -17.5 | SN II | 0.03 |
| ZTF 19abqykei | SN 2019obh | 18.31 () | -17.57 | 16.83 (W2) | -19.05 | SN IIb | 0.0355 |
| ZTF 19abucwzt | SN 2019oys | 18.10 () | -16.15 | 16.31 (W2) | -17.94 | SN Ib | 0.01650 |
| ZTF 19ackjszs | SN 2019tsf | 17.70 () | -17.84 | 18.33 (W2) | -17.22 | SN Ib | 0.03 |
| ZTF 20abgbuly | SN 2020jfv | 18.38 () | -15.95 | 15.89 (W2) | -18.43 | SN II | 0.01709 |
| ZTF 20ablqacl | SN 2020izc | 18.07 () | -15.61 | 18.46 (W1) | -15.22 | SN IIb | 0.01269 |
| ZTF 20abxpoxd | SN 2020sgf | 17.56 () | -17.32 | 17.09 (W2) | -17.79 | SN Ic | 0.02208 |
| ZTF 20abyylgi | SN 2020svn | 17.18 () | -18.28 | 18.72 (W2) | -16.74 | SN II | 0.02891 |
| ZTF 20accdijx | SN 2020twk | 17.65 () | -17.5 | 18.86 (W1) | -16.29 | SN II | 0.025 |
| ZTF 20accmutv | SN 2020uem | 16.40 () | -19.82 | 17.78 (W2) | -18.44 | SN IIP | 0.041 |
| ZTF 20acpjbgc | SN 2020yzq | 16.69 () | -17.33 | 15.27 (W2) | -18.74 | SN II | 0.01482 |