VelCrys: Interactive web-based application to compute acoustic wave velocity in crystals and its magnetic corrections
Abstract
We present VelCrys, a web-based interactive tool, that allows to perform further post-processing of the elastic tensor in order to compute and plot the group velocity of the acoustic waves for any crystal symmetry. We also implemented the calculation of effective magnetic corrections to the elastic tensor and corresponding fractional change in group velocity under a magnetic field. We apply it to dry sandstone, cubic CoPt and hcp Co to show some of the program features. In the analysis of magnetic corrections, we find complex landscapes of fractional change in group velocity as a function of ray direction, as well as a field dependence consistent with Simon effect.
keywords:
Acoustic , Crystals , Magnetism1 Introduction
The characterization of wave velocity is particularly useful in many fields like geophysics[1, 2, 3, 4, 5], communication technology[6] or biosensors[7]. The way acoustic waves propagate in crystals can be highly anisotropic, and thus it is different and more complicated than in isotropic media [8]. Providing the phase velocity direction (), one finds three possible modes for an acoustic wave: one quasi-compressional wave (qP) and two quasi-shear waves (qS1 and qS2)[1]. Over the last five decades, great efforts have been made to develop theoretical techniques to compute wave velocity for a general anisotropic media[9, 10, 11, 12, 1]. For instance, Zhou et al.[12] proposed the eigenvalue and eigenvector methods to calculate the group velocity. A more manageable approach has been recently proposed by Wang et al.[1] based on analytical formulas for group velocity, which can deal with the singular points and multivalue problems of the qS wave.
Magnetic effects on wave velocity in magnetostrictive materials are interesting from a fundamental and applied point of view[13, 14, 15, 16]. The effect of a magnetic field on wave velocity was originally discovered by Simon in 1958 (Simon effect)[17]. Additionally, other magnetic effects have been identified like isotropic exchange effects[18], anisotropic morphic effects[19, 20, 13], rotational-magnetostrictive effects [13, 14], and -effect [14], which have been experimentally observed in ultrasonic elastic waves[14, 21, 22, 23, 24, 25, 15, 26, 27, 16]. In 1979, a comprehensive theoretical description of these effects were reported by Rouchy et al. for cubic crystals [13]. Later, Rinaldi and Turilli showed that linear magnetic effects on wave velocity can be equivalently taken into account as effective corrections to the elastic constants [28]. The addition of these corrections to the elastic tensor combined with Wang et al. method [1] to compute group velocity may provide a practical way to efficiently compute the fractional change in group velocity due to linear magnetic effects for arbitrary wave propagation direction and applied magnetic field. Hence, it may facilitate the analysis of this phenomenon beyond the cases with wave propagation and magnetic field directions along high symmetry crystallographic directions studied so far, as well as crystals with symmetry lower than cubic [13, 22, 18, 15]. Such kind of approach may be exploited in novel magneto-acoustic phenomena like acoustic spin pumping [29], magnetization switching induced by sound waves [30, 31, 32, 33, 34, 35, 36, 37] and picosecond ultrasonics [38].
The development advanced visualization tools in databases can help to accelerate the design of new materials in different areas of condensed matter physics[39, 40, 41]. For example, ELATE is an online user-friendly interface that has been implemented to analyze the elastic tensor and visualize anisotropic mechanical properties [42]. Similarly, MAELASviewer was developed to visualize anisotropic magnetostrictive properties[43, 44, 45]. In this work, we present VelCrys a web-based interactive tool that performs further post-processing of the elastic tensor in order to compute and plot the sound velocity of the three kinds of acoustic waves (qP, qS1, and qS2) for any crystal symmetry based on the analytical formulas derived by Wang et al.[1]. Additionally, if the magnetoelastic constants are also provided, then it can calculate the effective magnetic corrections to the elastic tensor and corresponding fractional change in sound velocity under a magnetic field using Rinaldi and Turilli approach[28].
2 Methodology
2.1 Software details
VelCrys is created with Dash which is an efficient Python framework for building web applications [46]. Dash uses Flask as the web framework [47]. Visualization of 3D surfaces is done using the Python open source graphing library Plotly [48]. We also make use of NumPy library for some mathematical operations. The online application is currently available at http://www.md-esg.eu/velcrys/, while the open source Python module is available at GitHub repository [49]. VelCrys can be also used offline by executing the Python module[49].
2.2 Calculation of sound velocity and magnetic corrections
The calculation of group velocity for any crystal symmetry is performed by computing the analytical solution derived by Wang et al.[1] which makes use of the elastic tensor as input parameter
| (1) |
where is the phase velocity, and is the unit vector of phase velocity direction (ray direction).
The effective magnetic corrections () to elastic tensor are obtained through the formulas derived by Rinaldi and Turilli which have the form [28]
| (2) |
where are magnetoelastic constants, is saturation magnetization, is direction cosine of magnetization at equilibrium, and is the susceptibility tensor, see Ref.[28] for details about subscript indexes. The corresponding fractional change in group velocity due to magnetic effects is obtained by computing Wang et al. formulas[1] using the elastic tensor including effective magnetic corrections (), that leads to , and elastic tensor without effective magnetic corrections () which gives , that is
| (3) |
This option is currently supported only for Cubic I (point groups , , , space group numbers from 207 up to 230), and Hexagonal I (point groups , , , , space group numbers from 177 up to 194) symmetries[28]. Note also that Rinaldi and Turilli expressions does not include higher order corrections like morphic and rotational-magnetostrictive effects [18]. These limitations are discussed in Section 3.2.
3 Results
In this section, we perform some tests of the methodology implemented in VelCrys.
3.1 Dry sandstone
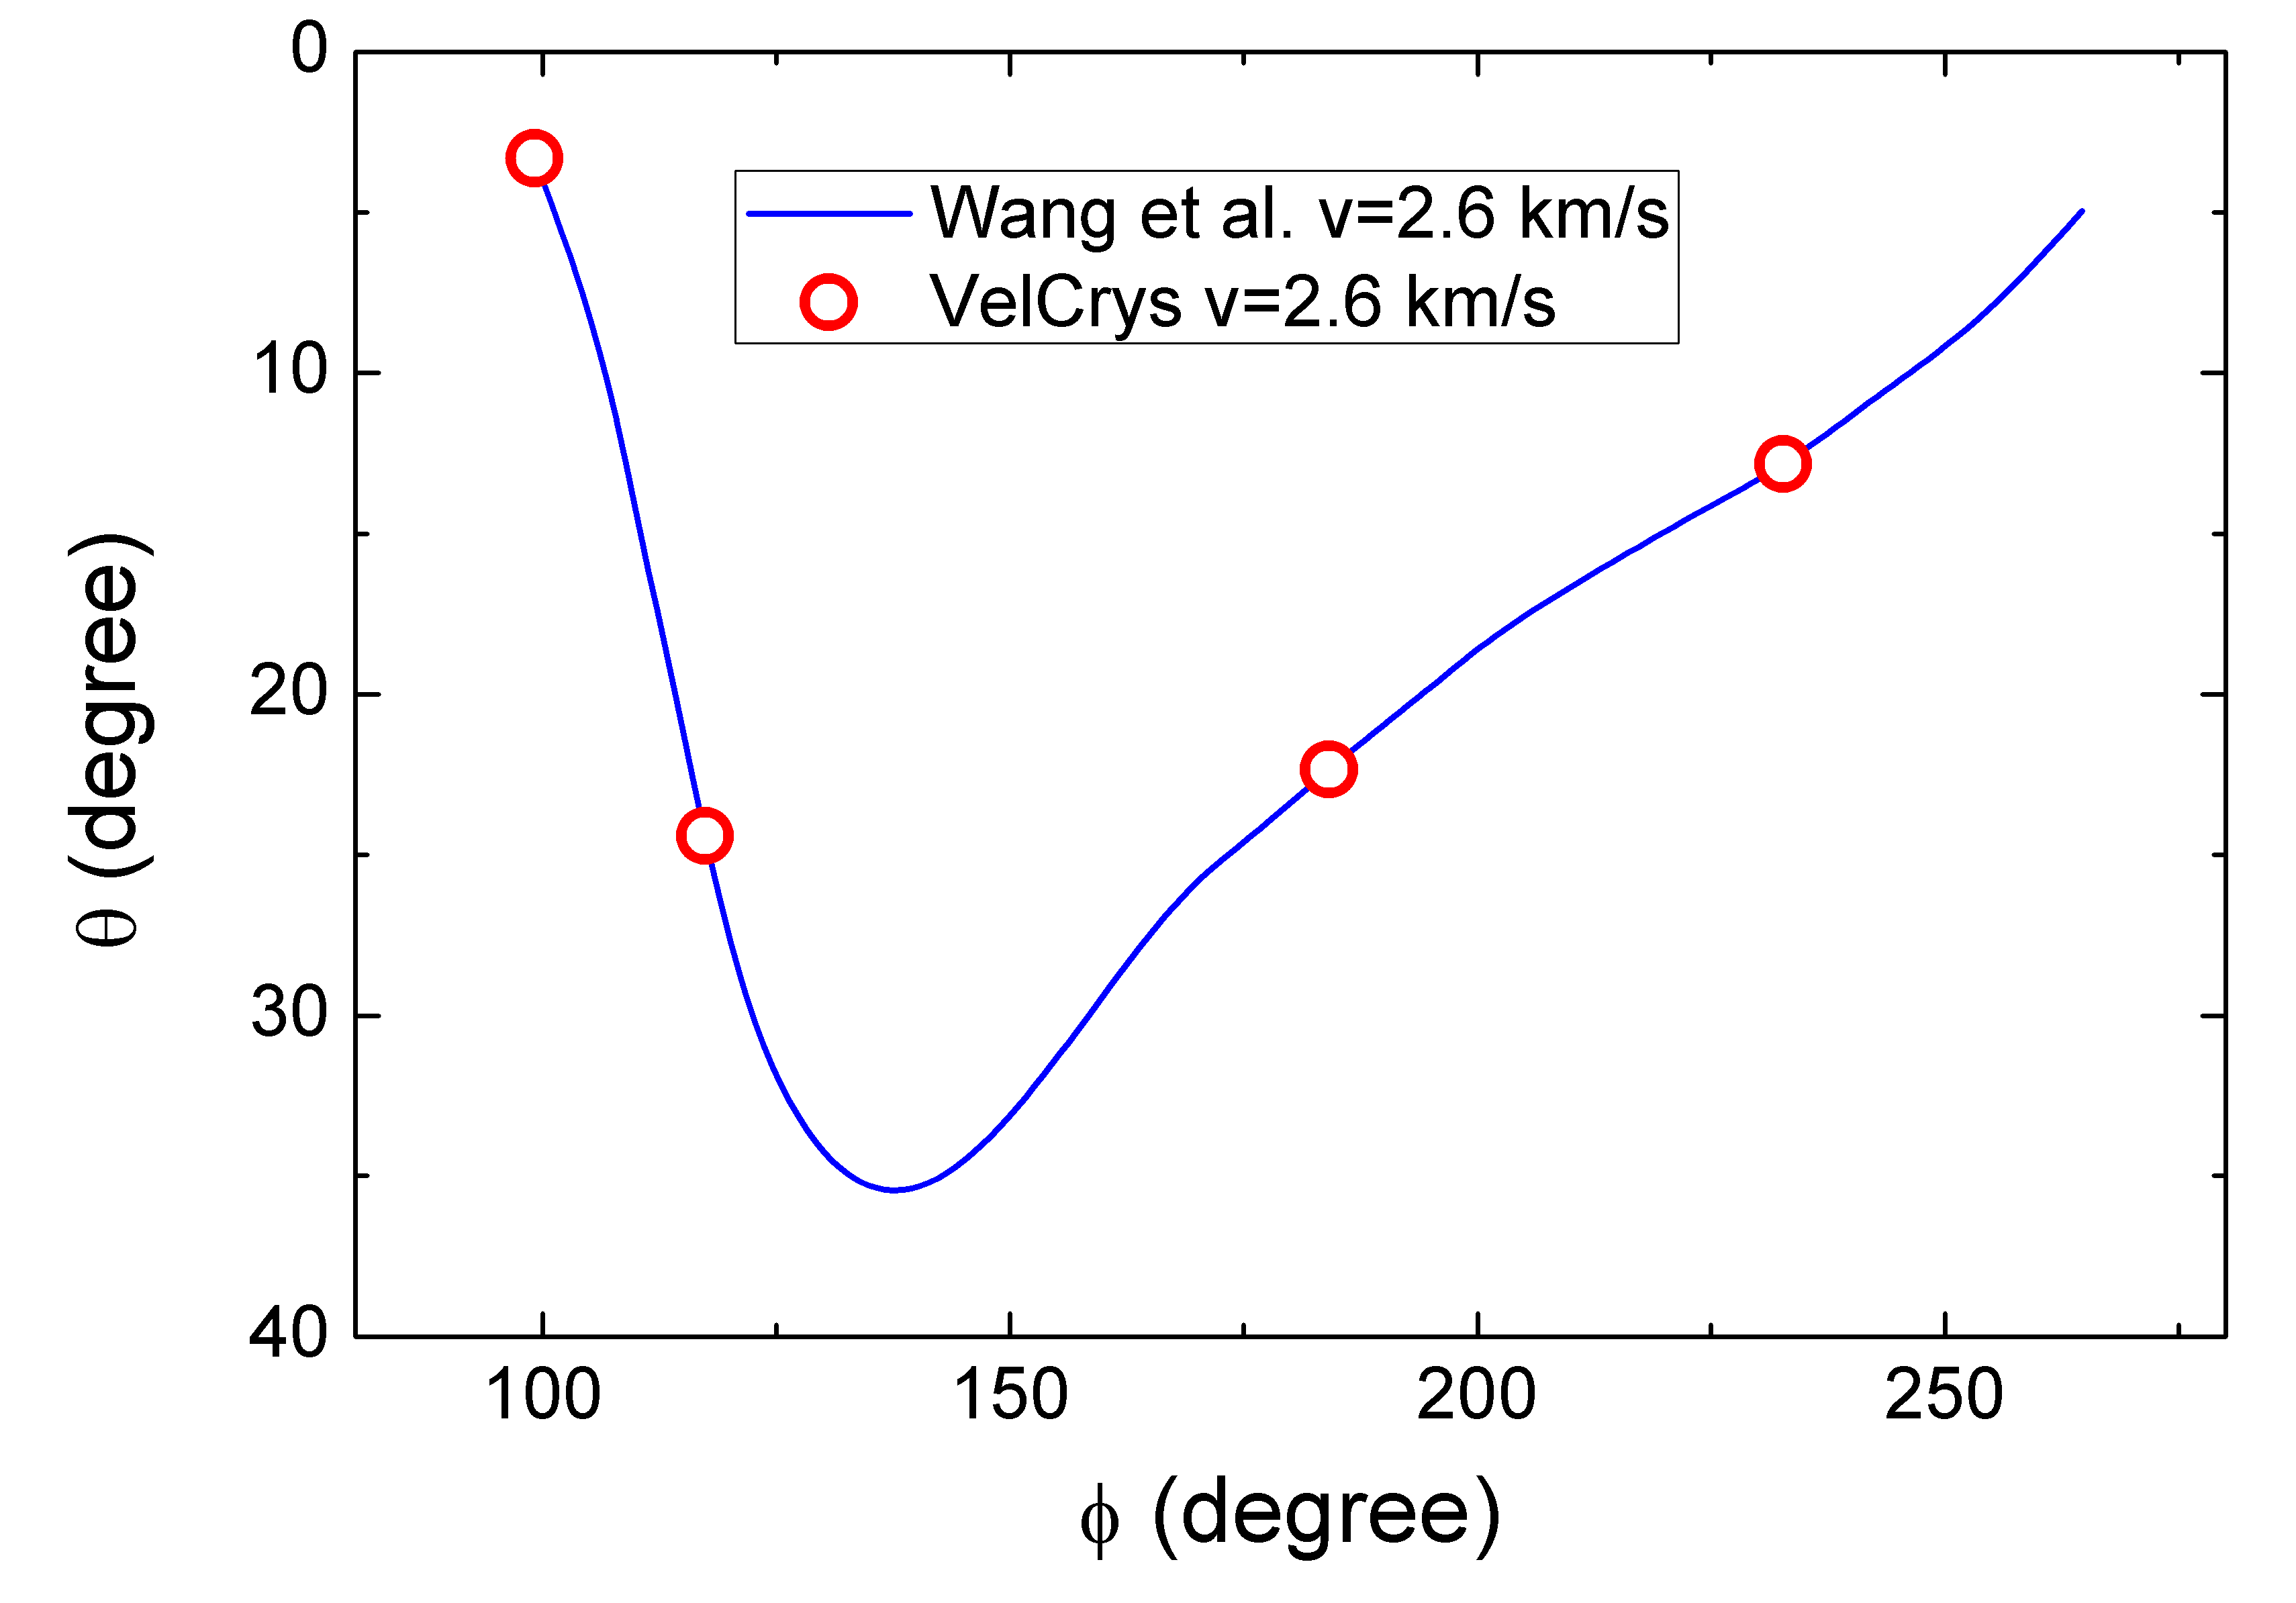
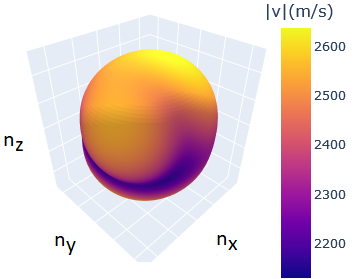
Sandstone is sedimentary rock widely distributed in planet Earth mostly composed of sand-sized minerals or rock grains cemented by siliceous, argillaceous, and/or calcareous materials [50]. Its mechanical properties depend highly upon the degree of cementation and grain composition [50] which are affected by temperature and burial history [50, 51]. In this first example, we verify the correct implementation in VelCrys of Wang et al.[1, 52] methodology by computing the group velocity of complex dry sandstone and compare with their results[1]. The elastic constants of this material are shown in Table 1, while the mass density is kg/m3 at room temperature[1]. In Fig.1, we compare the group velocity for a qP wave obtained with VelCrys and reported by Wang et al.[1], finding good agreement. A 3D plot generated with VelCrys is shown in Fig.2, where one can see the group velocity landscape of the qP wave as a function of the ray direction (phase velocity direction), again consistent with Ref. [1].
| (GPa) | (GPa) | (GPa) | (GPa) | (GPa) | (GPa) | ||||||
|---|---|---|---|---|---|---|---|---|---|---|---|
| 10.3 | 0.9 | 1.3 | 1.4 | 1.1 | 0.8 | ||||||
| 10.6 | 2.1 | 0.2 | -0.2 | -0.6 | |||||||
| 14.1 | 0.0 | -0.5 | -1.0 | ||||||||
| 5.1 | 0.0 | 0.2 | |||||||||
| 6.0 | 0.0 | ||||||||||
| 4.9 |
| (GPa) | (MPa) | () | (kJ/m3) | (T) | (kg/m3) | |||
|---|---|---|---|---|---|---|---|---|
| 289.7 | -35 | 210 | -40 | 0.942 | 16696.7 | |||
| 178.5 | 11.9 | -53 | ||||||
| 124.1 |
| Wave | |||||||
|---|---|---|---|---|---|---|---|
| 0 | 0 | qP | |||||
| 0 | 0 | qP | |||||
| qS1 | |||||||
| qS1 |
3.2 Co-Pt alloy
Co-Pt (and Fe-Pt) are very interesting alloys since supported nanostructures of these alloys present direct link between atom arrangements and magnetic behavior. Additionally, both alloys are today model systems in the field of nanoalloys, due to the diversity of atom arrangements present either in bulk state or specific to the nanoscale (disordered fcc structures, chemically ordered L10, L12, core-shell, five-fold structures - icosahedral or decahedral, etc). Importantly, Co-Pt alloys that can be used as permanent-magnet materials are found around the equiatomic composition where the disordered A1 (fcc) phase transforms into the ordered L10 phase [54]. Here, we further test VelCrys capabilities by evaluating magnetic corrections to group velocity for cubic single crystals of disordered equiatomic Co-Pt alloy, and comparing the results with theory and experiment [14, 53]. The fractional change in group velocity due to magnetic effects may be written as [13, 18]
| (4) |
where is the frequency of sound wave measured in ultrasound experiments (for instance, by the pulse echo method[14, 22]) and is the length in the direction of wave propagation. The fractional change of frequency could be further splitted into [13, 18, 15, 16, 14]
| (5) |
where accounts for higher order correction arising from the morphic coefficients , comes from rotational and magnetostrictive effects, describes the Simon effect that depends on the external magnetic field [17], and corresponds to other possible effects like the -effect associated to domain walls displacement in the low magnetic field regime [14]. The anisotropic part of the fractional change in length reads [18, 15]
| (6) | ||||
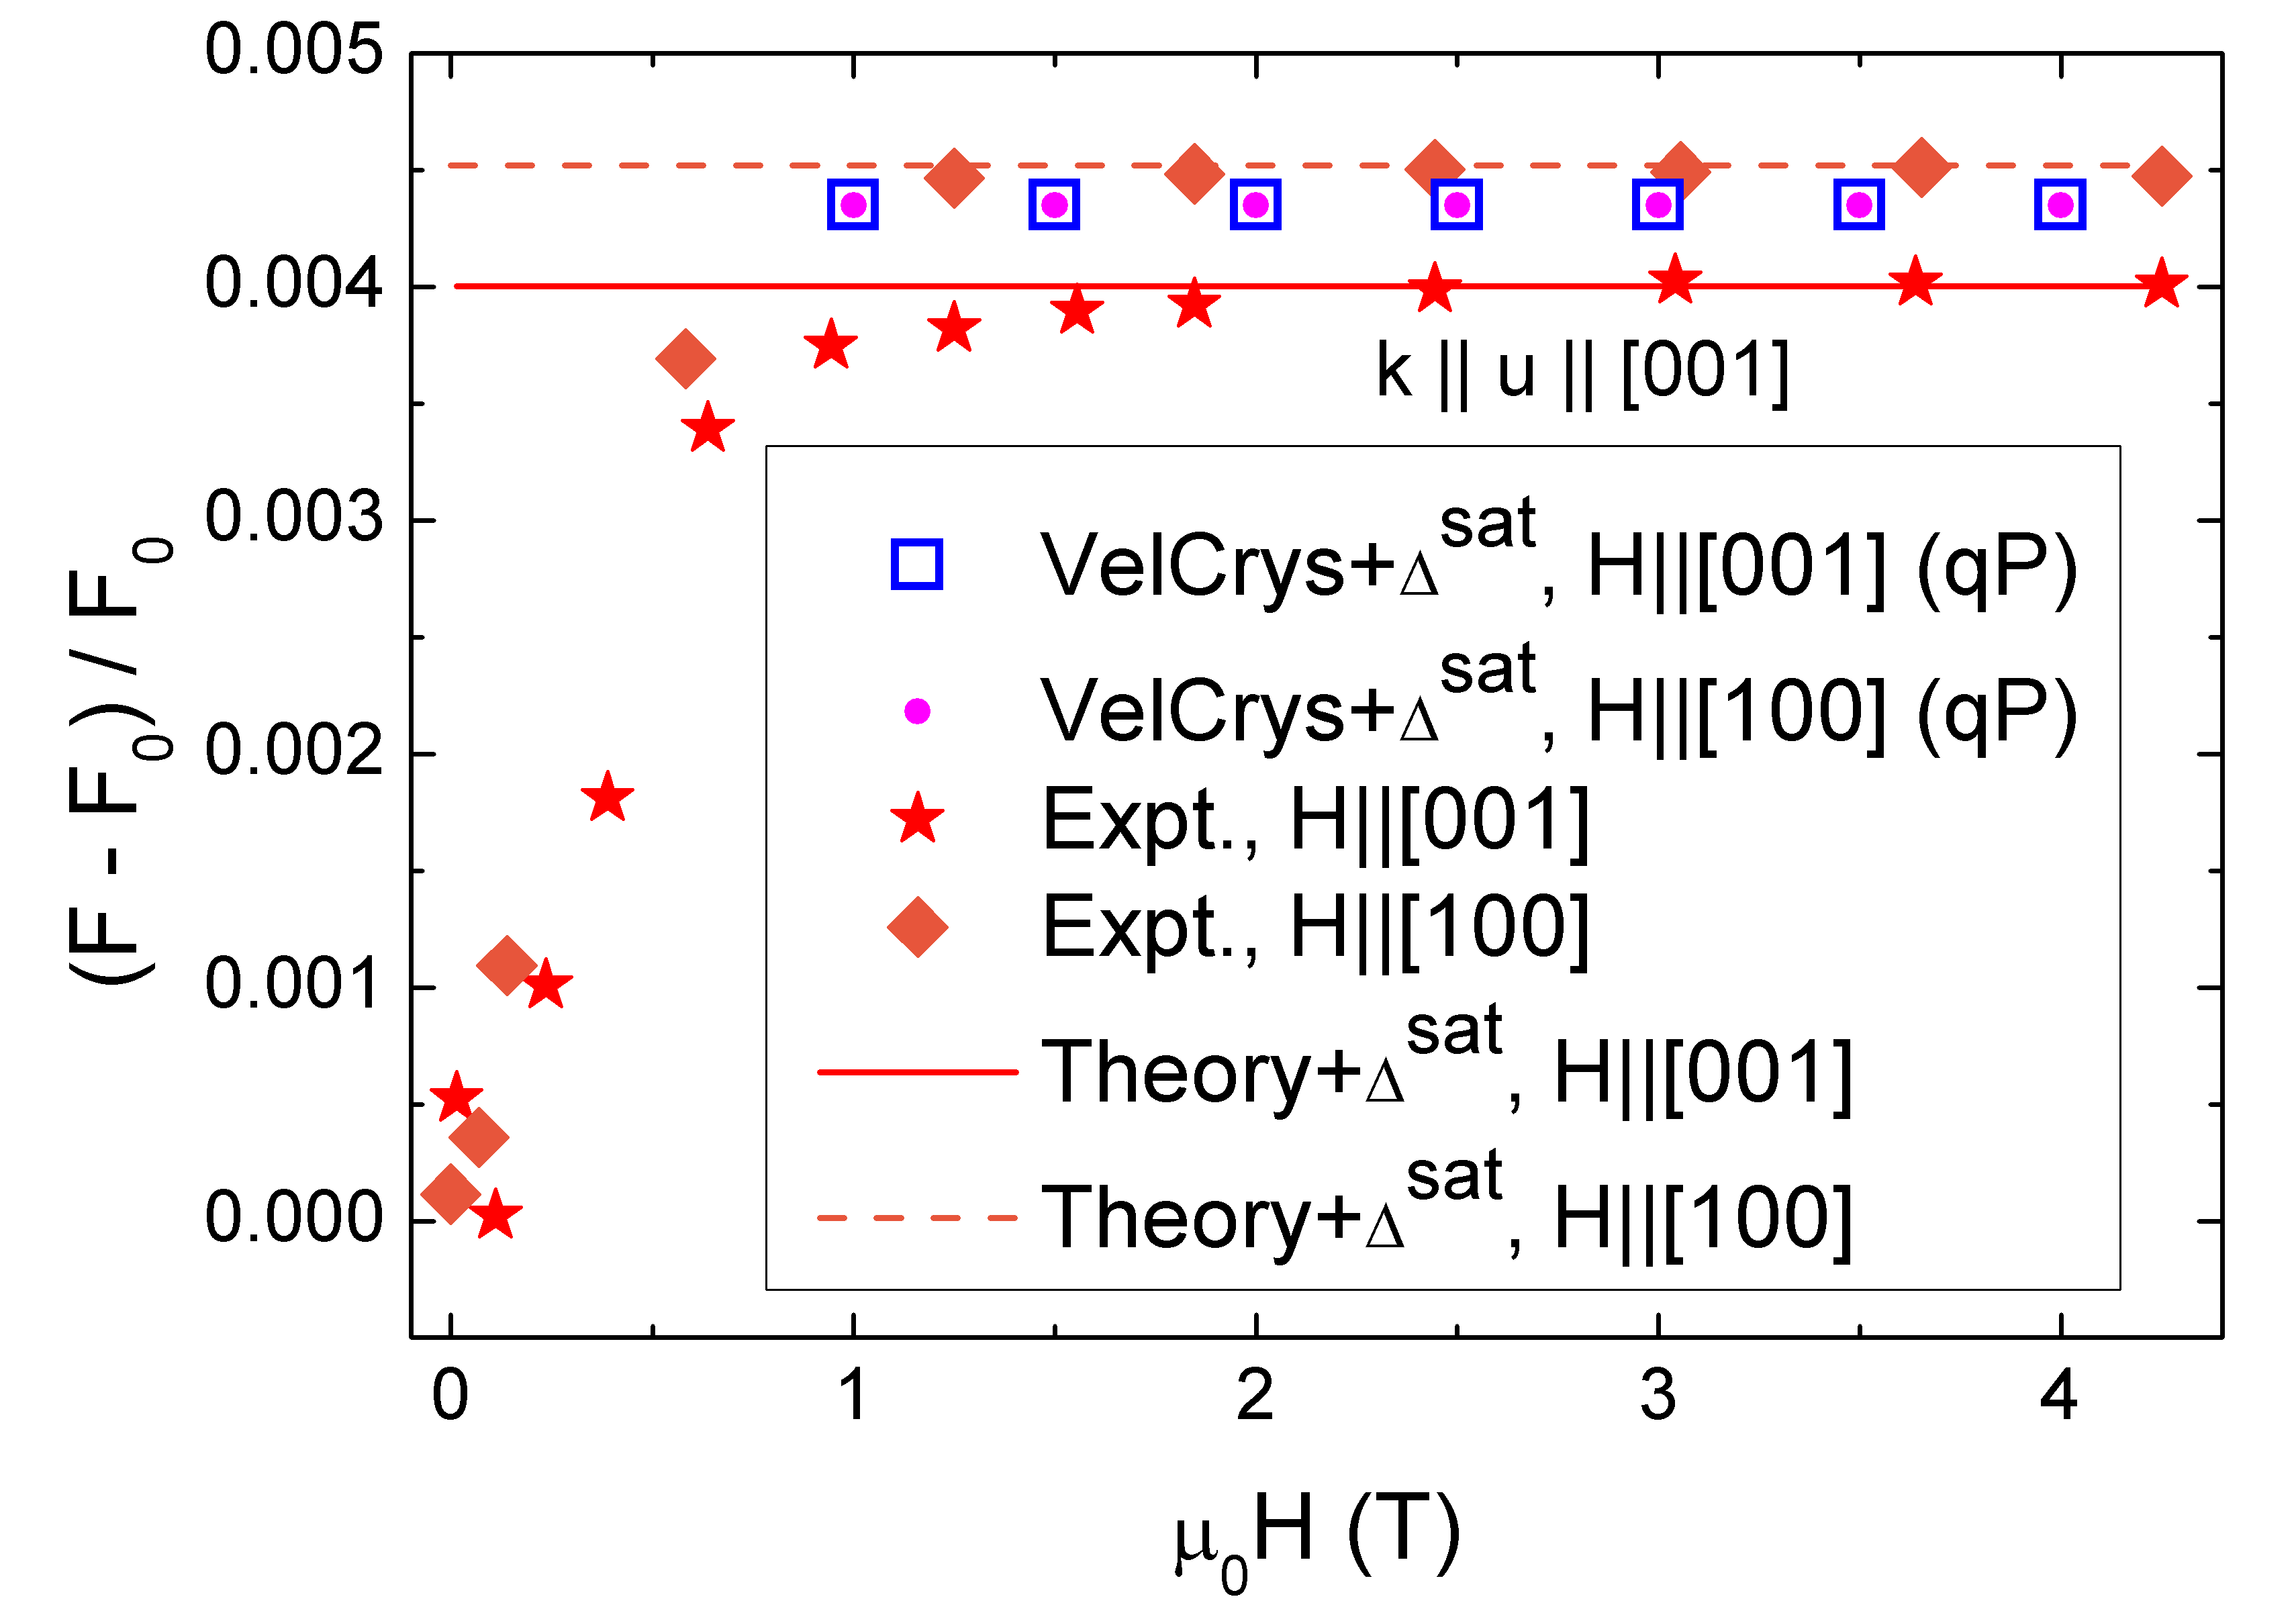
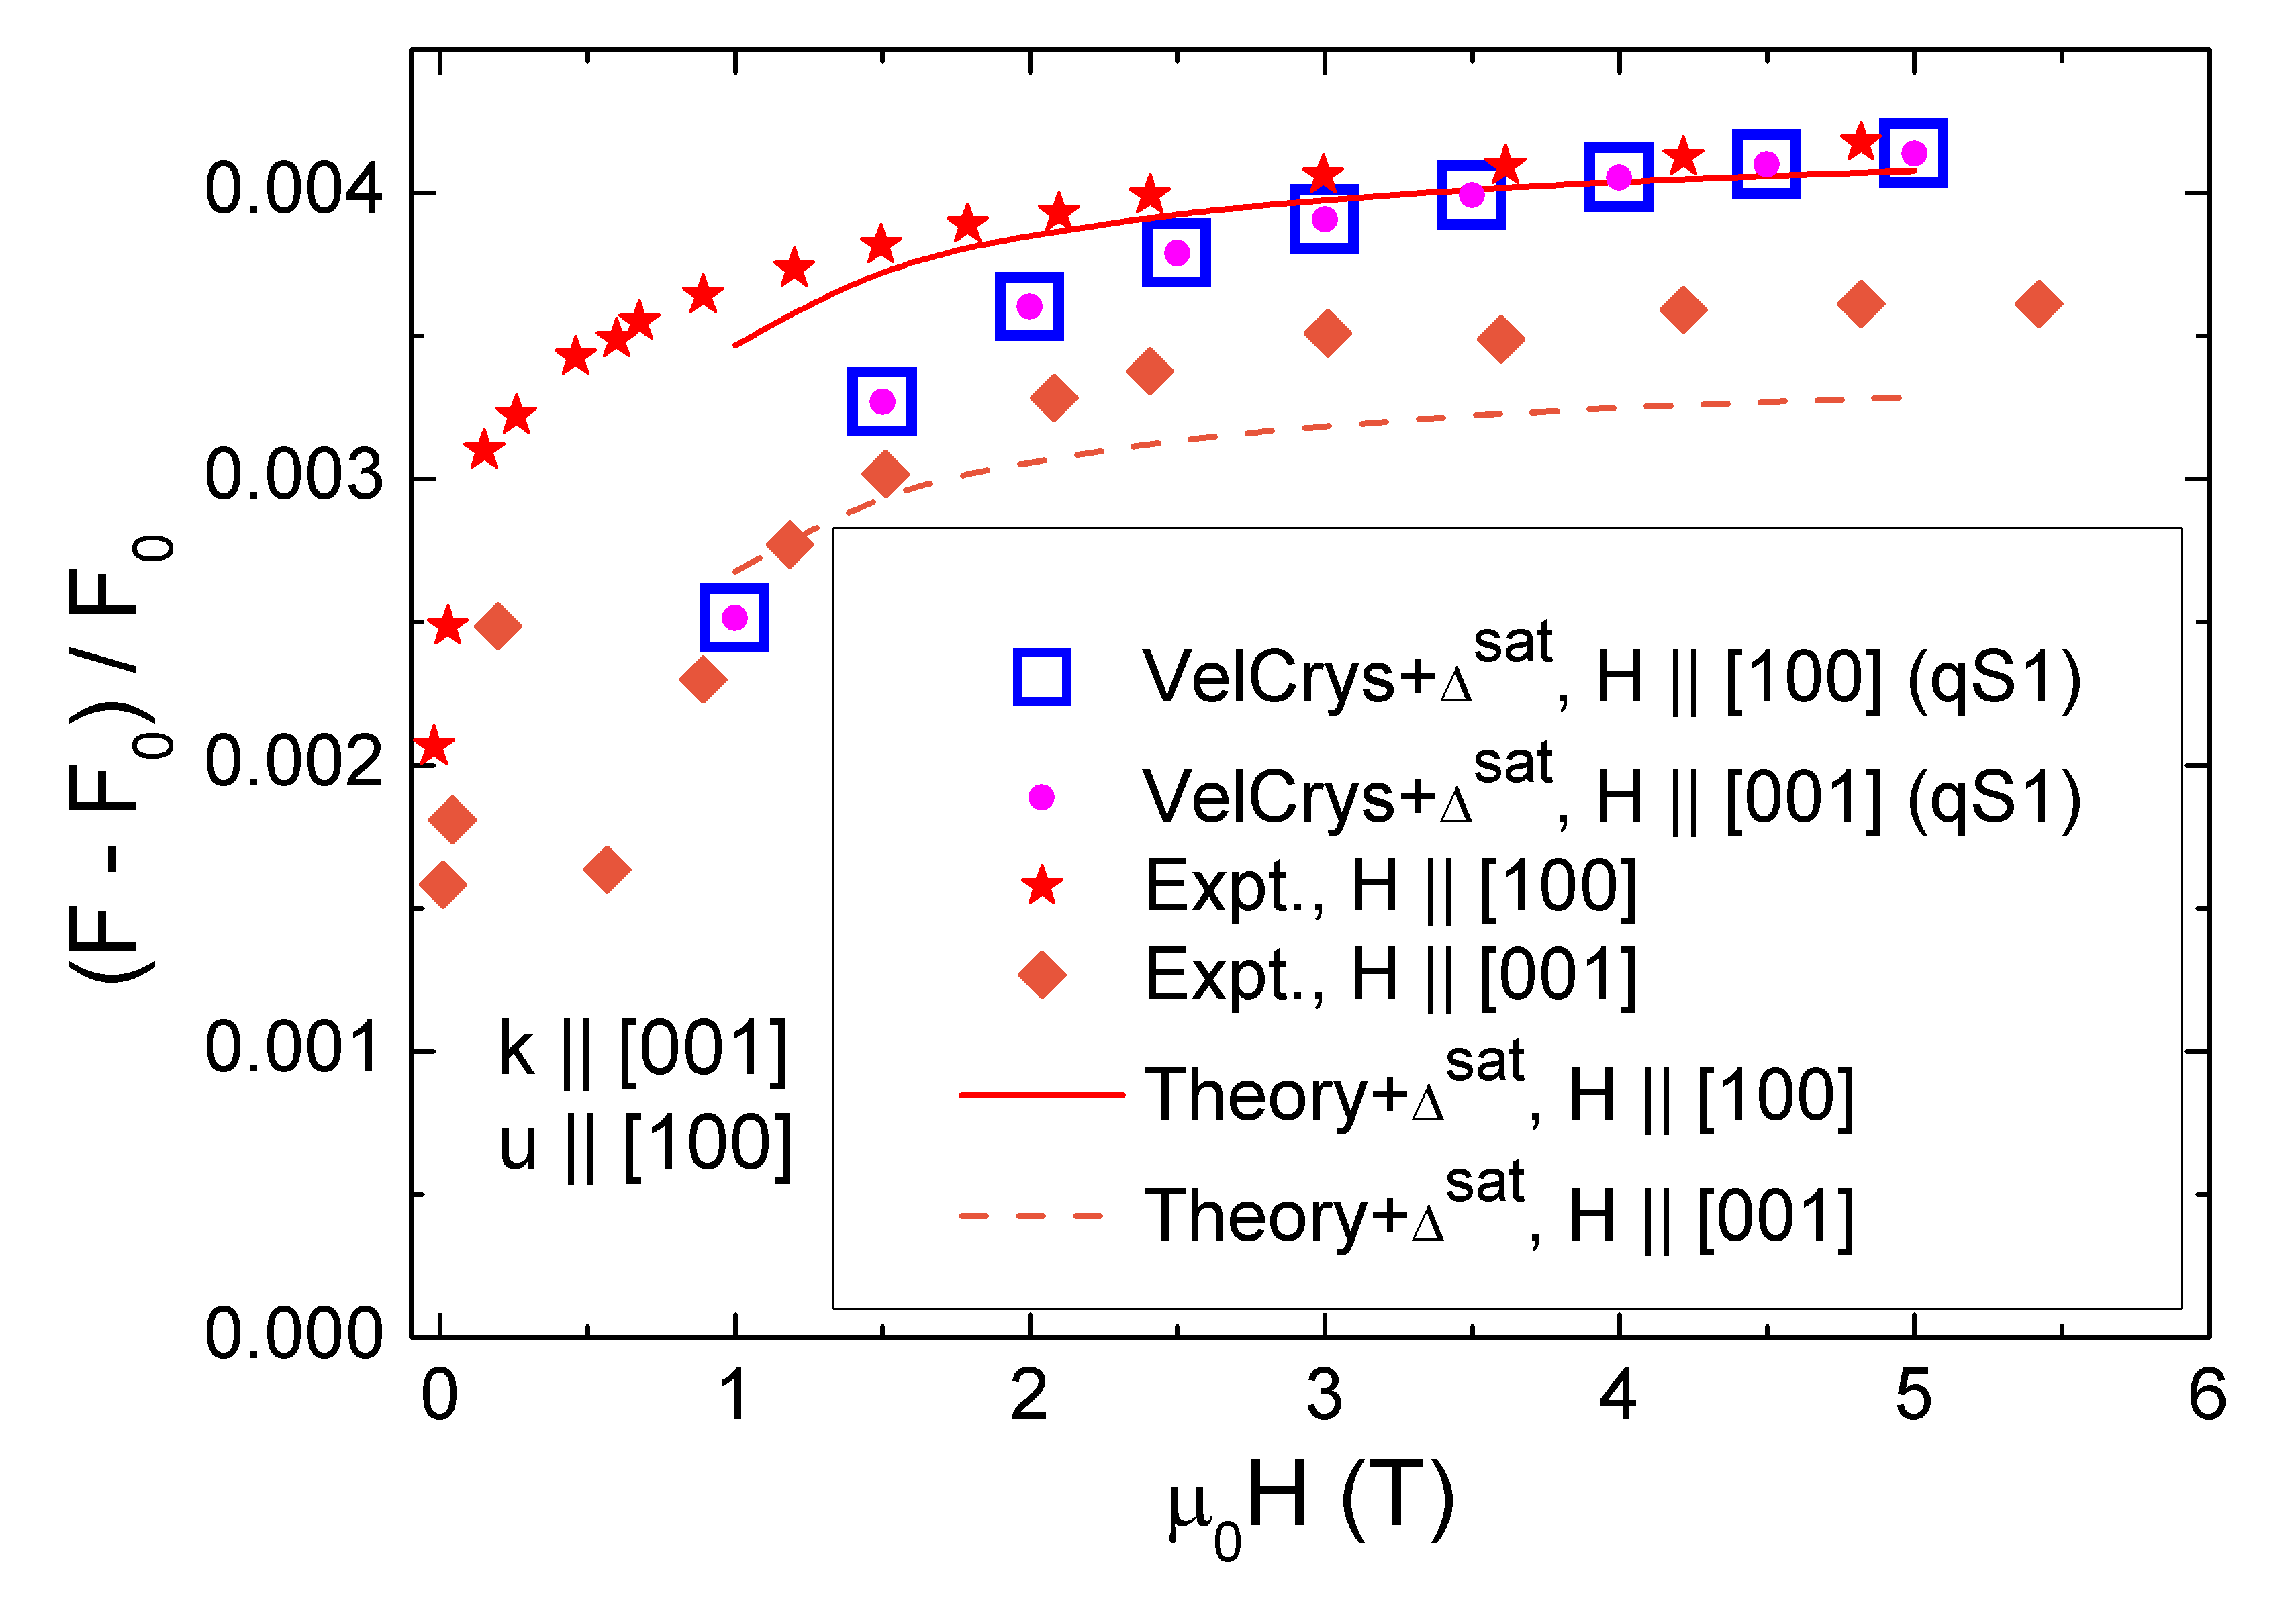
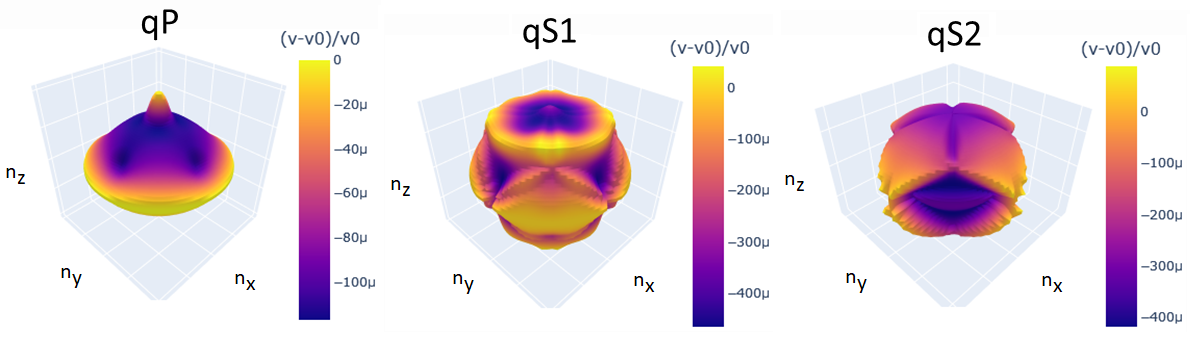
where is the direction cosine of magnetization, is the normalized vector along the measuring length direction, and and are the magnetostrictive coefficients. In this example, we consider longitudinal (qP) and transverse (qS) elastic waves propagating along the crystallographic direction (), where the magnetic field is applied either along or . In Table 3, we present the theoretical expression for each magnetic contribution to fractional change in group velocity in cubic crystal [13, 14, 18] for these cases. A comparison between experiment, theory and VelCrys is shown in Figs.3 and 4, finding consistent results. In function , we use experimental values of the morphic coefficients GPa, and GPa, while for the other properties we use the experimental values shown in Table 2[14]. The fractional change in frequency is indirectly obtained in VelCrys by using the calculated fractional change in group velocity in Eq.4. Here, the experimental observed -effect, about at saturated state[14], is included both in theory and VelCrys. For the sake of simplicity, the demagnetizing field was not included () in Simon effect . Note that VelCrys gives the same value for the cases with and , failing to reproduce the small observed shift between both cases. In the case of transverse waves (Fig.4), this discrepancy is due to the fact that Rinaldi and Turilli work[28] is based on infinitesimal strain theory, while this shift arises from the rotational-magnetostrictive effect based on the finite strain theory [13, 14, 15, 18]. Similarly, in the case of longitudinal wave (Fig.3), this discrepancy is due to the lack of higher order corrections coming from morphic coefficients () [18, 15]. The low field regime below magnetic saturation is influenced by -effect due to domain walls displacement[14], and cannot be accounted by Simon effect described by function in Table 3, as well as VelCrys, since they assume a magnetic saturated state[17, 28]. In Fig.5, we show the landscape of the fractional change in group velocity for the 3 types of waves (qP, qS1 and qS2) as a function of the ray direction (phase velocity direction) with applied magnetic field T generated with VelCrys. We see that for the qP wave we have at consistent with the Simon effect (), see Table 3. The largest value is observed in the qS1 wave about . Note that the values shown in Fig.5 does not include the -effect. Theoretical expression for other high symmetry ray and field directions were derived by Rouchy et al.[13, 14], which can be also studied with VelCrys.
3.3 hcp Co
Most of the Co produced is used for special alloys [55]. A relatively large percentage of the world’s production goes into magnetic alloys such as the Alnicos for permanent magnets. Sizable quantities are utilized for alloys that retain their properties at high temperatures and superalloys that are used near their melting points (where steels would become too soft). Co is also employed for hard-facing alloys, tool steels, low-expansion alloys (for glass-to-metal seals), and constant-modulus (elastic) alloys (for precision hairsprings). In this last example, we study magnetic corrections to group velocity for Co with hexagonal symmetry (hcp Co). We point out that magnetic field effect on group velocity is still rather unexplored in hexagonal crystals [28, 56]. The used parameters in VelCrys for this material are given in Table 4.
| (GPa) | (MPa) | (kJ/m3) | (T) | (kg/m3) | |||
|---|---|---|---|---|---|---|---|
| 307 | -31.9 | 410 | 1.76 | 8900 | |||
| 165 | 25.5 | 150 | |||||
| 103 | -8.1 | ||||||
| 358 | 42.9 | ||||||
| 75 |
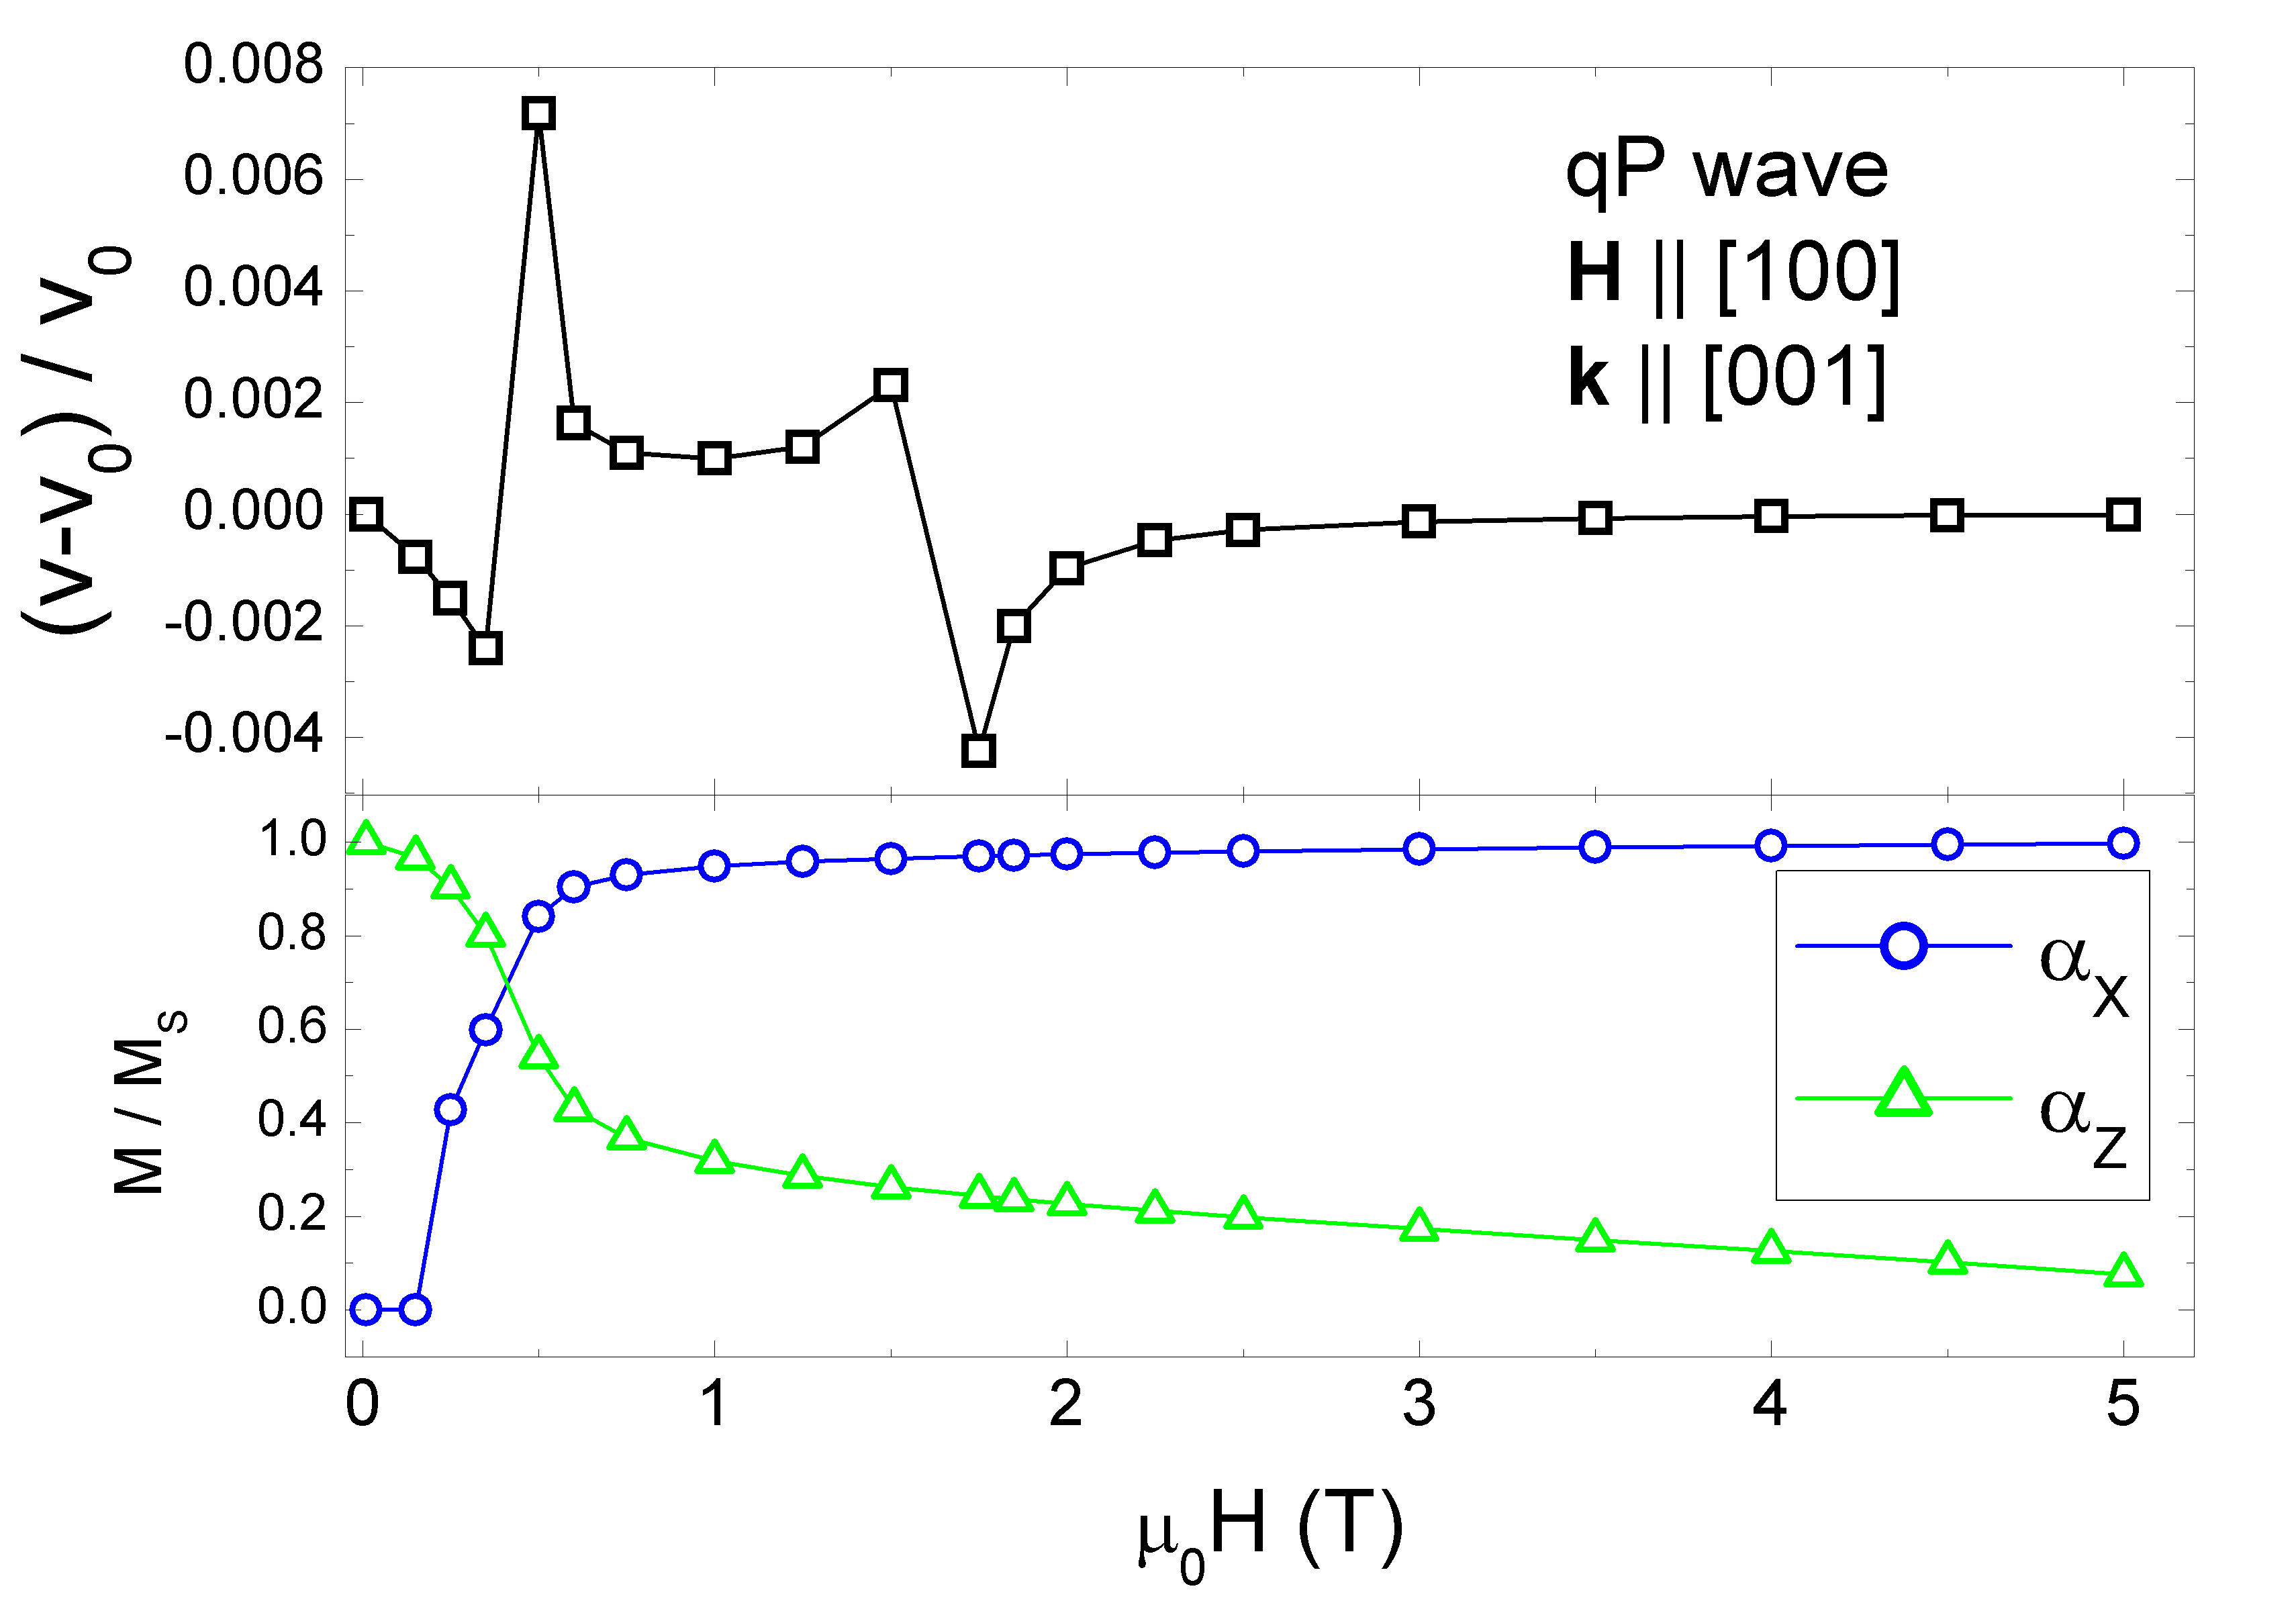
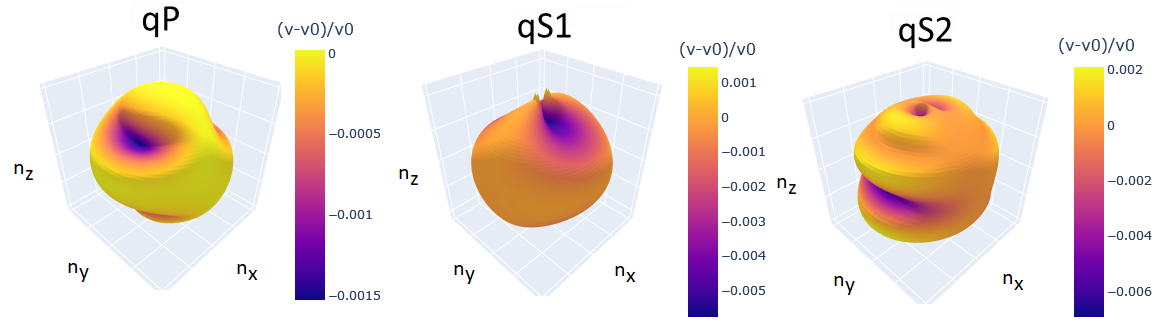
In Fig.6, we computed the fractional change in group velocity for the qP wave with ray direction as a function of the applied magnetic field . At high fields (T), we observe a field dependence consistent with Simon effect. In the low field regime (T), a non-monotonic behaviour is observed probably due to an interplay between magnetic anisotropy, applied magnetic field, and rotation of magnetization. Similar peaks have been observed in Co-Pt alloys[14]. In Fig.7, we present the landscape of the fractional change in group velocity for the 3 types of waves (qP, qS1 and qS2) as a function of the ray direction (phase velocity direction) with applied magnetic field T generated with VelCrys. Largest values are found in the qS2 wave () along the direction of the magnetic field . More theoretical analysis and experimental measurements in hexagonal crystals would be highly desirable to have a more deep understanding of these results [56]. Note that the same limitations of the implemented methodology as in the case of cubic crystals (lack of higher order corrections and -effect) are also expected for the hexagonal symmetry.
4 Conclusion
In summary, we showed that the combination of Wang et al.[1] analytical solution of group velocity for a general elastic tensor with Rinaldi and Turilli[28] effective magnetic corrections could provide a convenient approach to easily compute the group velocity and fractional change in group velocity due to magnetic effects. Such strategy has been implemented in the open source program VelCrys, facilitating the calculation of these quantities. VelCrys also includes visualization features to generate 3D plots of the landscape of these quantities as a function of the ray direction.
We have validated the program by recovering Wang et al. results of group velocity for the dry sandstone [1]. The magnetic corrections[28] were tested on cubic disordered Co-Pt alloy showing good agreement with theory and experiment after adding the s-effect[14]. We also applied this method to hcp Co finding a field dependence consistent with Simon effect[17], as well as complex landscapes of fractional change in group velocity that have yet to be fully explained. Current version of the program has some limitations. For example, magnetic corrections to the elastic tensor has been implemented only for cubic I and hexagonal I symmetries. Additionally, these corrections does not include higher order terms associated to morphic coefficients and rotational-magnetostrictive effect, as well as -effect related to domain walls displacement. Hopefully, some of these limitations might be overcome in future releases of the program.
Potential applications of VelCrys could be in the research field of geophysics[1, 2, 3, 4, 5], communication technology[6], biosensors[7], acoustic spin pumping [29], magnetization switching induced by sound waves [30, 31, 32, 33, 34, 35, 36, 37], and picosecond ultrasonics [38]. VelCrys could also be useful for further post-processing of elastic tensor and magnetoelastic constants obtained from automated schemes [42, 59, 60, 61, 43]. Moreover, its web-based interface might be exploited in databases of material science [39, 40].
Declaration of competing interest
The authors declare that they have no known competing financial interests or personal relationships that could have appeared to influence the work reported in this paper.
Data availability
Source files of VelCrys tool are available on the GitHub repository [49].
Acknowledgement
This work was supported by projects e-INFRA CZ (ID:90254)" and QM4ST (CZ.02.01.01/00/22_008/0004572) by The Ministry of Education, Youth and Sports of the Czech Republic and also by Czech Science Foundation of the Czech Republic by grant No. 22-35410K. P. N. acknowledges support by grant MU-23-BG22/00168 funded by The Ministry of Universities of Spain. A.F. acknowledges funding from the Spanish Ministry of Science and Innovation (grants nos. PID2022-139230NB-I00, and TED2021-132074B-C32) the Diputación Foral de Gipuzkoa (Project No. 2023-CIEN-000077-01). Research conducted in the scope of the Transnational Common Laboratory (LTC) Aquitaine-Euskadi Network in Green Concrete and Cement-based Materials. R. I. acknowledges financial support from the project MAGNES funded by the Principality of Asturias Government (grant no. AYUD/2021/51822) and from and the project RADIAFUS V, funded by the Spanish Ministry of Science and Innovation (grant no. PID2019-105325RB-C32).
References
-
[1]
D. Wang, C.-Y. Bai, X.-W. Li, J. Hu, Analytic formula for the group velocity and its derivatives with respect to elastic moduli for a general anisotropic medium, Geophysics 88 (4) (2023) C111–C121.
arXiv:https://pubs.geoscienceworld.org/geophysics/article-pdf/88/4/C111/5894846/geo-2022-0566.1.pdf, doi:10.1190/geo2022-0566.1.
URL https://doi.org/10.1190/geo2022-0566.1 -
[2]
J. Regan, D. L. Anderson, Anisotropic models of the upper mantle, Physics of the Earth and Planetary Interiors 35 (4) (1984) 227–263.
doi:https://doi.org/10.1016/0031-9201(84)90020-7.
URL https://www.sciencedirect.com/science/article/pii/0031920184900207 -
[3]
M. Cara, J. Lévêque, Oriented olivine crystals in the upper mantle: a test from the inversion of multimode surface-wave data, Physics of the Earth and Planetary Interiors 47 (1987) 246–252.
doi:https://doi.org/10.1016/0031-9201(87)90080-X.
URL https://www.sciencedirect.com/science/article/pii/003192018790080X -
[4]
L. Thomsen, Weak elastic anisotropy, GEOPHYSICS 51 (10) (1986) 1954–1966.
arXiv:https://doi.org/10.1190/1.1442051, doi:10.1190/1.1442051.
URL https://doi.org/10.1190/1.1442051 - [5] M. Schimmel, E. Stutzmann, S. Ventosa, Measuring group velocity in seismic noise correlation studies based on phase coherence and resampling strategies, IEEE Transactions on Geoscience and Remote Sensing (55) (2017) 1928–1935. doi:10.1109/TGRS.2016.2631445.
- [6] H. H. Yang Y, Dejous C, Trends and applications of surface and bulk acoustic wave devices: A review, Micromachines (Basel) (14(1):43) (2022). doi:doi:10.3390/mi14010043.
-
[7]
Y. Huang, P. K. Das, V. R. Bhethanabotla, Surface acoustic waves in biosensing applications, Sensors and Actuators Reports 3 (2021) 100041.
doi:https://doi.org/10.1016/j.snr.2021.100041.
URL https://www.sciencedirect.com/science/article/pii/S2666053921000175 - [8] L. D. Landau, E. M. Lifshitz, Theory of elasticity / by L. D. Landau and E. M. Lifshitz ; translated from the Russian by J. B. Sykes and W. H. Reid, Pergamon London, 1959.
-
[9]
J. R. Neighbours, G. E. Schacher, Determination of Elastic Constants from Sound-Velocity Measurements in Crystals of General Symmetry, Journal of Applied Physics 38 (13) (1967) 5366–5375.
arXiv:https://pubs.aip.org/aip/jap/article-pdf/38/13/5366/10553733/5366\_1\_online.pdf, doi:10.1063/1.1709328.
URL https://doi.org/10.1063/1.1709328 -
[10]
V. Červený, Seismic Rays and Ray Intensities in Inhomogeneous Anisotropic Media, Geophysical Journal International 29 (1) (1972) 1–13.
arXiv:https://academic.oup.com/gji/article-pdf/29/1/1/1734163/29-1-1.pdf, doi:10.1111/j.1365-246X.1972.tb06147.x.
URL https://doi.org/10.1111/j.1365-246X.1972.tb06147.x -
[11]
S. Crampin, A review of wave motion in anisotropic and cracked elastic-media, Wave Motion 3 (4) (1981) 343–391.
doi:https://doi.org/10.1016/0165-2125(81)90026-3.
URL https://www.sciencedirect.com/science/article/pii/0165212581900263 -
[12]
B. Zhou, S. Greenhalgh, On the computation of elastic wave group velocities for a general anisotropic medium, Journal of Geophysics and Engineering 1 (3) (2004) 205.
doi:10.1088/1742-2132/1/3/005.
URL https://dx.doi.org/10.1088/1742-2132/1/3/005 -
[13]
J. Rouchy, E. du Tremolet de Lacheisserie, Elastic properties of ferromagnetic single crystal with cubic symmetry, Zeitschrift für Physik B Condensed Matter 36 (1) (1979) 67–80.
doi:10.1007/BF01333955.
URL https://doi.org/10.1007/BF01333955 -
[14]
J. Rouchy, E. T. de Lacheisserie, J. Genna, A. Waintal, A 6 T ultrasonic study of the magnetoelastic coupling in ferromagnetic Co—Pt alloy, Journal of Magnetism and Magnetic Materials 21 (1) (1980) 69–79.
doi:https://doi.org/10.1016/0304-8853(80)90489-8.
URL https://www.sciencedirect.com/science/article/pii/0304885380904898 - [15] E. D. T. de Lacheisserie, Magnetostriction: Theory and Application of Magnetoelasticity, CRC Press, Boca Raton, FL, 1993.
- [16] A. Del Moral, Handbook of magnetostriction and magnetostrictive materials, Del Moral Zaragoza, Zaragoza, 2008.
-
[17]
G. Simon, Das verhalten von ebenen ultraschallwellen in homogen magnetisierten einkristallen, Zeitschrift für Naturforschung A 13 (2) (1958) 84–89.
doi:doi:10.1515/zna-1958-0204.
URL https://doi.org/10.1515/zna-1958-0204 -
[18]
P. Nieves, J. Tranchida, S. Nikolov, A. Fraile, D. Legut, Atomistic simulations of magnetoelastic effects on sound velocity, Phys. Rev. B 105 (2022) 134430.
doi:10.1103/PhysRevB.105.134430.
URL https://link.aps.org/doi/10.1103/PhysRevB.105.134430 -
[19]
W. P. Mason, A phenomenological derivation of the first- and second-order magnetostriction and morphic effects for a nickel crystal, Phys. Rev. 82 (1951) 715–723.
doi:10.1103/PhysRev.82.715.
URL https://link.aps.org/doi/10.1103/PhysRev.82.715 -
[20]
D. E. Eastman, Ultrasonic study of first-order and second-order magnetoelastic properties of yttrium iron garnet, Phys. Rev. 148 (1966) 530–542.
doi:10.1103/PhysRev.148.530.
URL https://link.aps.org/doi/10.1103/PhysRev.148.530 -
[21]
E. du Tremolet de Lacheisserie, J. Rouchy, The magnetoelastic coupling in nickel, Journal of Magnetism and Magnetic Materials 28 (1) (1982) 77–87.
doi:https://doi.org/10.1016/0304-8853(82)90031-2.
URL https://www.sciencedirect.com/science/article/pii/0304885382900312 -
[22]
J. Rouchy, P. Morin, E. T. de Lacheisserie, Magnetic and magnetoelastic properties of gdzn single crystals, Journal of Magnetism and Magnetic Materials 23 (1) (1981) 59–68.
doi:https://doi.org/10.1016/0304-8853(81)90068-8.
URL https://www.sciencedirect.com/science/article/pii/0304885381900688 -
[23]
J. Sakurai, Ultrasonic propagation in nickel and mn-ferrite at high magnetic fields, Journal of the Physical Society of Japan 19 (3) (1964) 311–317.
arXiv:https://doi.org/10.1143/JPSJ.19.311, doi:10.1143/JPSJ.19.311.
URL https://doi.org/10.1143/JPSJ.19.311 -
[24]
G. Alers, J. Neighbours, H. Sato, Dependence of sound velocity and attenuation on magnetization direction in nickel at high fields, Journal of Physics and Chemistry of Solids 9 (1) (1959) 21–27.
doi:https://doi.org/10.1016/0022-3697(59)90085-X.
URL https://www.sciencedirect.com/science/article/pii/002236975990085X -
[25]
G. Dietz, G. Wielpütz, Magnetoelastic coupling between sound waves in ferromagnetic crystals, Applied physics 11 (2) (1976) 131–136.
doi:10.1007/BF00920591.
URL https://doi.org/10.1007/BF00920591 -
[26]
C. Kingner, J. Heil, B. Lüthi, Surface acoustic wave propagation in paramagnets and ferromagnets, Journal of Applied Physics 52 (3) (1981) 2270–2272.
arXiv:https://doi.org/10.1063/1.328902, doi:10.1063/1.328902.
URL https://doi.org/10.1063/1.328902 -
[27]
M. Seavey, Acoustic resonance in the easy-plane weak ferromagnets alpha; fe2o3 and febo3, Solid State Communications 10 (2) (1972) 219–223.
doi:https://doi.org/10.1016/0038-1098(72)90385-7.
URL https://www.sciencedirect.com/science/article/pii/0038109872903857 -
[28]
S. Rinaldi, G. Turilli, Theory of linear magnetoelastic effects, Phys. Rev. B 31 (1985) 3051–3058.
doi:10.1103/PhysRevB.31.3051.
URL https://link.aps.org/doi/10.1103/PhysRevB.31.3051 -
[29]
K. Uchida, H. Adachi, T. An, T. Ota, M. Toda, B. Hillebrands, S. Maekawa, E. Saitoh, Long-range spin seebeck effect and acoustic spin pumping, Nature Materials 10 (10) (2011) 737–741.
doi:10.1038/nmat3099.
URL https://doi.org/10.1038/nmat3099 -
[30]
I. S. Camara, J.-Y. Duquesne, A. Lemaître, C. Gourdon, L. Thevenard, Field-free magnetization switching by an acoustic wave, Phys. Rev. Applied 11 (2019) 014045.
doi:10.1103/PhysRevApplied.11.014045.
URL https://link.aps.org/doi/10.1103/PhysRevApplied.11.014045 -
[31]
O. Kovalenko, T. Pezeril, V. V. Temnov, New concept for magnetization switching by ultrafast acoustic pulses, Phys. Rev. Lett. 110 (2013) 266602.
doi:10.1103/PhysRevLett.110.266602.
URL https://link.aps.org/doi/10.1103/PhysRevLett.110.266602 -
[32]
L. Thevenard, J.-Y. Duquesne, E. Peronne, H. J. von Bardeleben, H. Jaffres, S. Ruttala, J.-M. George, A. Lemaître, C. Gourdon, Irreversible magnetization switching using surface acoustic waves, Phys. Rev. B 87 (2013) 144402.
doi:10.1103/PhysRevB.87.144402.
URL https://link.aps.org/doi/10.1103/PhysRevB.87.144402 -
[33]
L. Thevenard, I. S. Camara, S. Majrab, M. Bernard, P. Rovillain, A. Lemaître, C. Gourdon, J.-Y. Duquesne, Precessional magnetization switching by a surface acoustic wave, Phys. Rev. B 93 (2016) 134430.
doi:10.1103/PhysRevB.93.134430.
URL https://link.aps.org/doi/10.1103/PhysRevB.93.134430 -
[34]
V. S. Vlasov, A. M. Lomonosov, A. V. Golov, L. N. Kotov, V. Besse, A. Alekhin, D. A. Kuzmin, I. V. Bychkov, V. V. Temnov, Magnetization switching in bistable nanomagnets by picosecond pulses of surface acoustic waves, Phys. Rev. B 101 (2020) 024425.
doi:10.1103/PhysRevB.101.024425.
URL https://link.aps.org/doi/10.1103/PhysRevB.101.024425 -
[35]
A. Stupakiewicz, C. S. Davies, K. Szerenos, D. Afanasiev, K. S. Rabinovich, A. V. Boris, A. Caviglia, A. V. Kimel, A. Kirilyuk, Ultrafast phononic switching of magnetization, Nature Physics 17 (4) (2021) 489–492.
doi:10.1038/s41567-020-01124-9.
URL https://doi.org/10.1038/s41567-020-01124-9 - [36] W. Li, B. Buford, A. Jander, P. Dhagat, Acoustically assisted magnetic recording: A new paradigm in magnetic data storage, IEEE Transactions on Magnetics 50 (3) (2014) 37–40. doi:10.1109/TMAG.2013.2285018.
- [37] M. Strungaru, M. O. A. Ellis, S. Ruta, R. F. L. Evans, R. W. Chantrell, O. Chubykalo-Fesenko, A route to minimally dissipative switching in magnets via thz phonon pumping (2023). arXiv:2209.04312.
-
[38]
M. Mattern, A. von Reppert, S. P. Zeuschner, M. Herzog, J.-E. Pudell, M. Bargheer, Concepts and use cases for picosecond ultrasonics with x-rays, Photoacoustics 31 (2023) 100503.
doi:https://doi.org/10.1016/j.pacs.2023.100503.
URL https://www.sciencedirect.com/science/article/pii/S2213597923000563 - [39] A. Jain, S. Ong, G. Hautier, W. Chen, W. Richards, S. Dacek, S. Cholia, D. Gunter, D. Skinner, G. Ceder, K. Persson, The materials project: A materials genome approach to accelerating materials innovation, APL Materials 1 (2013) 011002.
-
[40]
S. Curtarolo, W. Setyawan, G. L. Hart, M. Jahnatek, R. V. Chepulskii, R. H. Taylor, S. Wang, J. Xue, K. Yang, O. Levy, M. J. Mehl, H. T. Stokes, D. O. Demchenko, D. Morgan, Aflow: An automatic framework for high-throughput materials discovery, Computational Materials Science 58 (2012) 218–226.
doi:https://doi.org/10.1016/j.commatsci.2012.02.005.
URL https://www.sciencedirect.com/science/article/pii/S0927025612000717 -
[41]
M. Scheidgen, L. Himanen, A. N. Ladines, D. Sikter, M. Nakhaee, Ádám Fekete, T. Chang, A. Golparvar, J. A. Márquez, S. Brockhauser, S. Brückner, L. M. Ghiringhelli, F. Dietrich, D. Lehmberg, T. Denell, A. Albino, H. Näsström, S. Shabih, F. Dobener, M. Kühbach, R. Mozumder, J. F. Rudzinski, N. Daelman, J. M. Pizarro, M. Kuban, C. Salazar, P. Ondračka, H.-J. Bungartz, C. Draxl, Nomad: A distributed web-based platform for managing materials science research data, Journal of Open Source Software 8 (90) (2023) 5388.
doi:10.21105/joss.05388.
URL https://doi.org/10.21105/joss.05388 -
[42]
R. Gaillac, P. Pullumbi, F.-X. Coudert, ELATE: an open-source online application for analysis and visualization of elastic tensors, Journal of Physics: Condensed Matter 28 (27) (2016) 275201.
doi:10.1088/0953-8984/28/27/275201.
URL https://doi.org/10.1088%2F0953-8984%2F28%2F27%2F275201 -
[43]
P. Nieves, S. Arapan, A. P. Kądzielawa, D. Legut, MAELASviewer: An online tool to visualize magnetostriction, Sensors 20 (22) (2020).
doi:10.3390/s20226436.
URL https://www.mdpi.com/1424-8220/20/22/6436 - [44] https://github.com/pnieves2019/MAELASwiewer.
- [45] http://www.md-esg.eu/maelasviewer/.
- [46] https://dash.plotly.com/.
- [47] https://flask.palletsprojects.com/en/1.1.x/.
- [48] https://plotly.com/python/.
- [49] https://github.com/pnieves2019/VelCrys.
- [50] H. Tian, T. Kempka, S. Yu, M. Ziegler, Mechanical properties of sandstones exposed to high temperature, Rock Mechanics and Rock Engineering 49 (1) (2016) 321–327. doi:10.1007/s00603-015-0724-z.
-
[51]
Q. Ben-dong, H. Jun, C. Lun-jian, Experimental research on mechanical properties of limestone and sandstone under high temperature (2009).
URL /article/id/615fae88ed73f804e4fe0df6 - [52] https://github.com/li913/Velocity4GeneralAnisotropicMedium.
-
[53]
P. Villars, K. Cenzual, R. Gladyshevskii, Handbook, De Gruyter, Berlin, Boston, 27 Nov. 2015.
doi:10.1515/9783110334678.
URL https://www.degruyter.com/view/title/304631 -
[54]
A. S. Darling, Cobalt-platinum alloys, Platinum Metals Review 7 (3) (1963) 96–104.
doi:https://doi.org/10.1595/003214063X7396104.
URL https://technology.matthey.com/content/journals/10.1595/003214063X7396104 -
[55]
Q. Dehaine, L. T. Tijsseling, H. J. Glass, T. Törmänen, A. R. Butcher, Geometallurgy of cobalt ores: A review, Minerals Engineering 160 (2021) 106656.
doi:https://doi.org/10.1016/j.mineng.2020.106656.
URL https://www.sciencedirect.com/science/article/pii/S0892687520304763 -
[56]
V. G. Bar’yakhtar, A. G. Danilevich, Magnetoelastic waves in ferromagnets in the vicinity of lattice structural phase transitions, Ukrainian Journal of Physics 63 (9) (2018) 836.
doi:10.15407/ujpe63.9.836.
URL https://ujp.bitp.kiev.ua/index.php/ujp/article/view/2018150 - [57] R. C. O’Handley, Modern magnetic materials, Wiley, 2000.
-
[58]
P. Nieves, S. Arapan, S. Zhang, A. Kądzielawa, R. Zhang, D. Legut, Maelas: Magneto-elastic properties calculation via computational high-throughput approach, Computer Physics Communications 264 (2021) 107964.
doi:https://doi.org/10.1016/j.cpc.2021.107964.
URL https://www.sciencedirect.com/science/article/pii/S0010465521000801 -
[59]
M. de Jong, W. Chen, T. Angsten, A. Jain, R. Notestine, A. Gamst, M. Sluiter, C. Krishna Ande, S. van der Zwaag, J. J. Plata, C. Toher, S. Curtarolo, G. Ceder, K. A. Persson, M. Asta, Charting the complete elastic properties of inorganic crystalline compounds, Scientific Data 2 (1) (2015) 150009.
doi:10.1038/sdata.2015.9.
URL https://doi.org/10.1038/sdata.2015.9 -
[60]
S. Zhang, R. Zhang, AELAS: Automatic ELAStic property derivations via high-throughput first-principles computation, Computer Physics Communications 220 (2017) 403 – 416.
doi:10.1016/j.cpc.2017.07.020.
URL http://www.sciencedirect.com/science/article/pii/S0010465517302400 - [61] https://github.com/pnieves2019/MAELAS.