1321 \vgtccategoryResearch \vgtcpapertypeTheoretical & Empirical \authorfooter *: equal contribution. Melissa Lin is with Carnegie Mellon University. E-mail: mylin@andrew.cmu.edu. Heer Patel, Medina Lamkin, Tukey Tu, Soham Raut, and Leilani Battle are with University of Washington, Seattle. E-mail: (heerpate, mlamkin, yuanjt2, sohamr, leibatt)@cs.washington.edu. Hannah Bako is with University of Maryland, College Park. E-mail: hbako@umd.edu.
How do Observable Users Decompose D3 Code? An Exploratory Study
Abstract
Users often struggle to program visualizations using complex toolkits like D3. Before we can design effective code assistants to support them, we must first understand how D3 users reason about their code. In this work, we explore users’ understanding of D3 using an important gauge of code comprehension in CS education: code decomposition. We qualitatively analyze 560 D3 programs published on Observable and identify three distinct strategies to decomposing D3 programs: segmenting code into layers of functionality, keeping everything all in one cell, or creating reusable visualization functions. We also observe how users inherit decomposition methods from copied examples and reorganize copied code to suit their needs. We corroborate our findings for decomposition preferences through interviews with D3 and Observable users. Based on our findings, we suggest strategies for generating more intuitive D3 code recommendations using decomposition preferences and highlight new research opportunities for visualization code assistants. All supplemental materials are available at https://osf.io/sudb8/?view_only=302fc5c8d397412aac35c6e094ae7dd6.
keywords:
Visualization toolkit usage, Code decompositionIntroduction
From designing bespoke visualizations in D3 [10] to orchestrating multi-chart interactions in Vega-Lite [36], visualization programming is considered a valuable skill among data scientists, enthusiasts, and engineers [34]. However, increased customization often leads to higher toolkit complexity and in turn steeper learning curves [35]. As a result, users may struggle to write their own customized programs [4], even when adapting existing examples [7], negating the benefits of adopting more expressive toolkits like D3. Automatic code generation could ease this learning burden [1]. Copying code from existing examples can also speed up the implementation process [4, 3]. However, these strategies only work if end users can comprehend the code [8, 20]. For example, users will struggle to adopt both human-curated [7] and AI-generated [24] code recommendations if they are still unfamiliar with the underlying toolkit. Further, how intentional are visualization users when they inherit code from outside sources? And how closely does the code’s organization match their own thought process?
In this paper, we explore opportunities to observe a user’s comprehension of visualization code. By targeting comprehension, we can speak to what code structures these users find intuitive to understand, which provides a blueprint for generating code recommendations—and possibly new visualization toolkits—that are in close alignment with users’ mental models of visualization programs. To do this, we investigate a core measurement of code comprehension from the CS education literature: code decomposition [11, 37]. Examining how users organize their code provides a window into users’ mental models of visualization code [29, 4], such as whether scales and axes are routinely grouped together and whether the same encoding is organized similarly across different visualization types [2].
Inspired by previous research on the challenges of programming in D3 [7, 4], we contribute a qualitative analysis of D3 code decomposition strategies across 560 D3 projects on Observable [27], a computational notebook environment containing the largest database of D3 examples on the web. Given that users’ D3 coding strategies may be inherited from existing examples [7, 16, 17, 22], we also analyze how Observable users adapt code written by others. Our analysis reveals three distinct strategies to decomposing D3 programs: segmenting code into layers of functionality, keeping everything all in one Observable cell, or creating reusable visualization functions. We find that Layered decomposition is the most popular decomposition strategy among the notebooks we analyzed, which held true across all 22 observed visualization types and regardless of whether the code was inherited or not. Furthermore, we find that users’ layering strategies align closely with the structure of the Layered Grammar of Graphics [43].
To connect our findings with how users think about D3 code structure, we conducted an interview study with 7 Observable users ranging from students to professional developers. Our interview participants reported using the same decomposition strategies we observed through our notebook analysis. Furthermore, they clarify why certain decomposition strategies may be preferred, such as using layered decomposition to make debugging D3 programs easier or admiring the use of function decomposition in examples from D3 co-creator Mike Bostock. Together, our analysis and study findings reveal how D3 users are intentional about structuring their code in a semantically meaningful way, e.g., by process (data transformation, visual encoding, etc.) or by output (chart type). Furthermore, our findings provide inital empirical evidence that existing examples influence not only visualization design thinking but also programming strategy.
Given these findings, we discuss future opportunities in program analysis and AI code generation for visualization. For example, these findings suggest that generated code recommendations could be made more intuitive by organizing and annotating the code in a modular way that aligns with users’ preferred decomposition methods, e.g., according to the Layered Grammar of Graphics [43]. The contributions of this work are summarized as follows:
-
•
We present a robust dataset of 560 Observable notebooks representing 22 distinct visualization types written using D3.
-
•
We report on a comprehensive analysis of how Observable users organize their D3 visualization code, including their code decomposition and code inheritance strategies.
-
•
We conduct an interview study with 7 Observable users regarding how they organize their D3 code.
-
•
We discuss future implications regarding the creation of supportive learning and visualization prototyping tools for D3, including AI code generation.
1 Related Work
In this section, we review existing work on supporting D3 users and visualization language users more broadly.
1.1 Facilitating Visualization Code Reuse
Users often create visualizations by copying code from existing examples [7, 3]. However, relevant examples can be hard to find and modify correctly [3, 7]. Hoque and Agrawala introduce a search engine that supports querying via visual encodings and data attributes [17]. However, D3 code can contain uncommon syntax and code structures, making it difficult to search [7]. Further, in-depth examples may over-complicate the visualization prototyping process [7] or even lead to design fixation [28]. We seek to understand how users intuitively structure their own D3 code, which can facilitate improvements to D3 example search and reuse features in future development environments.
1.2 Visualization Templates
Many projects aim to support visualization prototyping through code templates. For example, Bako et al. find that users implement visualizations similarly, and contribute templates to help users program common D3 visualization and interaction types [2]. Harper et al. propose techniques for converting existing D3 visualizations in to templates [16]. Tools such as Ivy generalize these concepts to make it easier to create and reuse code templates [22]. However, templates are difficult to modify beyond their defined parameters, impeding user creativity and workflow [4]. Our research presents an alternative method for analyzing D3 users’ coding strategies, which could lead to new methods for template design and customization.
1.3 Visualization Recommendation
Visualization recommendation tools generate partial or full visualizations to speed up the design process [46]. Many of these tools not only give recommendations but also apply changes for the user [15, 18]. Mirny, for example, suggests visualizations and interactions to create and automatically generates D3 code snippets to help users implement recommended changes [4]. Our research can benefit visualization recommendation systems by highlighting key characteristics of code snippets that make them easier or harder for D3 users to understand, potentially boosting the adoption of recommended code.
1.4 Automatic Design Pattern Detection
Other automated tools concentrate on segmenting code into more readable and logical components, facilitating a better understanding of the code. MICoDe, for example, generates empty code templates by extracting code patterns, preserving the high-level structure of programs (e.g., function headers) [21]. MiLoCo similarly allows users to identify programming rules through the use of semantic clusters, a technique that groups code with related vocabulary, and a graph mining algorithm [30]. DeMIMA and MoDeC can detect code patterns through an abstract model identification process and limiting variables values respectively [14, 25]. Many other tools have been designed to achieve similar goals with different techniques [32, 39, 13, 41, 26, 12]. With a better understanding of users’ mental models of D3, we can implement analogues within automated tools, allowing them to reason about code in a manner that is more intuitive for end users of differing expertise.
1.5 Code Decomposition and Visualization Grammars
Code decomposition is a useful measure of programming comprehension in CS education [37]. For example, Charitsis et al. find that intro CS students who decompose their code into modular functions tend to have better assignment outcomes [11]. Decomposition has also been studied in computational notebook environments [33]. For example, Raghunandan et al. observe that Jupyter-based data science notebooks often separate code by functionality, such as placing visualization code in separate cells [31]. Titov et al. take it one step further by directly restructuring the cells and reordering the notebook for the user to help increase clarity [38]. We seek to understand whether decomposition methods from CS education and data science broadly may translate to visualization programming and D3 specifically.
Although established theories guide the structure and interpretation of many visualization grammars (e.g., the Grammar of Graphics [45] and Layered Grammar of Graphics [43]), it is unclear whether the reasoning of toolkit and grammar designers aligns with the reasoning of end users. One approach to investigating this problem is to analyze how end users organize their own code into logical units and compare those suggested by prevailing theories [29]. We take a similar approach in this work but we focus on D3, given observed challenges for D3 users in making sense of and debugging D3 code [7].
1.6 Computing Education and Large Language Models
The goal of programming courses is to not only expose students to a specific programming language but also to help students develop independent problem-solving skills [23]. Decomposition strategies play a critical role in problem solving. For example, Charitsis et al. found that introductory programming students decompose their programming assignments to add functionality, restructure code, and remove duplicated code [11]. They also found that adopting decomposition strategies early led to better assignment outcomes. Although large language models (LLMs) can aid in this process by helping students to triage and generate code [8], they may also rob students of opportunities to develop problem solving skills and even encourage overreliance on AI code assistance [8, 24, 1]. Further, these models are notorious for hallucinating false information and providing nonsensical rationales for generated answers, which students are not equipped to assess [5, 19, 20]. By developing complementary knowledge regarding how people reason about and structure D3 code, we can develop additional inputs to LLMs and other AI solutions to improve their outputs for educational use.
1.7 Why Analyze Observable Notebooks?
We selected the Observable notebook platform [27] as the focus of our study as it is now the largest source of D3 examples since the deprecation of Bl.ocks.org [9]. Furthermore, Observable’s notebook environment contains a cellular structure, which allows users to separate code into modular cells that can be split, joined, or reordered according to user preferences. This enables us to objectively analyze what code was placed into distinct cells, compared to other file formats where we must subjectively interpret white space characters (e.g., raw JavaScript or HTML files). Furthermore, users often apply different white space patterns depending on which stage of the analysis process they are in [31], making it difficult to systematically code notebooks using this method. Thus, we adopt a more conservative analysis approach by focusing on code cells, which provide a clearer indicator of code structuring.
2 Data Collection & Preparation
To understand how users organize their D3 code, we collected 560 D3 visualization notebooks from Observable [27], representing 22 different visualization types. We collected both notebooks that were written from scratch and those copied from other sources (as well as the original sources themselves) to understand how users choose to inherit code from existing D3 programs. In this section, we report on our data collection methods and key terms used throughout the paper. Detailed information on the number of corpus examples and excluded examples for each visualization type can be seen in Table 1. Additionally, our supplemental material contains detailed data for all corpus examples and excluded examples.
2.1 Term Definitions
To aid understanding, define the following terms used in his paper:
-
•
Decompose refers to how users separate code within a single visualization using cells. We use this definition as an overarching term to describe how users "organize," "structure," and "break down" code [12].
-
•
Modularity refers to the extent to which users decompose their code into separate pieces, i.e., modules [7]. An example of a module would be an Observable code cell.
-
•
Sources are D3 programs that inspire or provide code for other programs. A source could be a notebook shared on Observable like in the D3 Gallery111https://observablehq.com/@d3/gallery or a D3 program shared on an external platform such as GitHub Gist222https://gist.github.com/.
-
•
An Example refers to a single Observable notebook.
2.2 Seeding the Initial Observable Notebook Corpus
To facilitate a rigorous qualitative analysis, we collected a diverse range of examples spanning 22 visualization types identified in previous work [6]. We used the following steps to curate our example corpus:
-
1.
Search by Visualization Type: Keyword searches were performed on Observable for each visualization type (keywords are provided in supplemental materials).
-
2.
Filter for Quality and Uniqueness: We reviewed the search results in order of relevance until at least ten unique visualizations with readable code, no compile or runtime errors, and fully rendered visualizations were found.
-
3.
Select Diverse Programs: We manually filtered from ten down to five examples that maximize the diversity of code length and total code cells across programs.
This selection process yielded five examples per the 22 visualization types, for a total of 110 examples. Then, we analyzed these initial examples to determine how to expand the corpus further.
2.3 Expanding the Corpus with Source Examples
Through our initial search, filter, and analysis process, we observed that most search results on Observable return duplicate notebooks that copy from older examples. This is partly due to Observable’s encouragement of code reuse through its notebook “forking” functionality, similar to creating project forks in online repositories such as GitHub. We also observed users manually copying code outside of forks. To study how Observable users copy from existing examples, we recorded the source notebooks used by our initial set of 110 notebooks.
Fork Sources.
When a notebook is forked, Observable automatically links it with the original source. For each notebook in our initial set, we traced backward using Observable’s fork source links until we reached the original source (i.e., with no forked source), which we record in our dataset.
Non-Fork (i.e., Indirect) Sources.
Given that users can manually copy code from existing notebooks as well as from outside the Observable platform, we performed subsequent searches for indirect (i.e., non-fork) sources. For a given example, our protocol was as follows:
-
1.
Search markdown cells for links to source examples.
-
2.
If (1) yields no sources, identify all related examples from the Observable D3 Gallery and manually check each one for code overlap/similarity.
-
3.
If (2) yields no sources, copy and paste each text cell into a search engine. For each of the top-k relevant search results, compare for markdown and code overlap/similarity. This usually returns the original example containing the same markdown text/code.
We acknowledge the limitations to finding the “right” indirect sources, since a notebook can have multiple sources and some could have been taken down prior to our analysis. Despite these limitations, this process successfully identified indirect sources outside of Observable for 8 of our 110 initial notebooks, which were primarily Github Gists. Given the (defunct) Bl.ocks.org repository was built on top of GitHub Gists [9], these results appear to align with our goals of analyzing users’ code copying and decomposition strategies.
| Visualization Type | Examples per Type (includes, excludes) | Group Total |
|---|---|---|
| Area, Bar, Box Plot, Bubble, Chord Diagram, Donut, Geo Map, Parallel Coordinates, Sunburst, Waffle (10) | 5, 20 | (5 + 20) 10 = 250 |
| Graph, Heatmap, Hexabin, Line, Pie, Radial, Sankey, Treemap, Word Cloud (9) | 6, 20 | (6 + 20) 9 = 234 |
| Scatter Plot (1) | 7, 20 | (7 + 20) 1 = 27 |
| Streamgraph (1) | 8, 20 | (8 + 20) 1 = 28 |
| Voronoi Diagram (1) | 6, 15 | (6 + 15) 1 = 21 |
| Corpus Total | - | 560 |
2.4 Expanding the Corpus Through Shared Lineage
Our source analysis revealed that some unique examples share the same sources. Thus, we expanded our search for corpus examples to downstream forks from our identified sources in subsection 2.3. This process yielded 15 unique forked examples across the 22 visualization types, expanding our corpus size from 110 examples to 125 examples.
As previously mentioned, many of the Observable notebooks online are duplicates of existing examples. Although duplicate notebooks contain redundant information, they are still useful for understanding how often different visualization types and D3 functionality are used across Observable. Therefore, we also compiled a separate list of duplicate examples as we analyzed Observable forks. 20 duplicate examples were collected per visualization type, hereby referenced as "excluded examples" in our corpus, since they are not part of our 125 examples (initial set + fork sources). The sole exception is the Voronoi diagram, for which we could only find 15 duplicates. Together, we collected 435 duplicate notebooks, representing 77.7% of the corpus.
3 Analysis Overview
The objective of this paper is to understand how Observable users decompose their D3 programs into modular units. Consequently, our analysis focuses on three research questions:
-
RQ1:
How do D3 users decompose their own code?
-
RQ2:
How do users utilize code from existing D3 examples?
-
RQ3:
How do users draw decomposition strategies from existing D3 examples?
To answer these research questions, we perform a mixed methods evaluation of the examples in our corpus (see section 2) to examine the structure and organization of code cells and identify the decomposition strategies applied in each example (R1). Then, we inspect to what extent examples reused code from their sources (R2). Finally, we compare the decomposition strategies within examples to those in their sources to gauge the influence of existing examples on observed decomposition strategies within our corpus (R3).
Examine notebook structure.
To understand how D3 users decompose their code, we examined each example from our corpus and noted different choices made regarding the use of code cells. Then, we grouped repeated patterns of decisions into high-level decomposition strategies. Using this information, we qualitatively coded each example by the decomposition strategy used, enabling us to answer our first research question in section 4.
Inspect example sources.
To better understand how deliberate users’ coding decisions may be, we inspect how examples draw from existing sources such as through manual copying and use of Observable forks. We rely on our observations to classify whether examples did or did not inherit code from sources, answering our second research question in section 5.
Compare decomposition strategies.
To understand how inheriting code may influence decomposition strategies, we compare the coded decomposition strategy for each example to the strategies used by its sources. For example, we consider whether decomposition strategies tend to match those of their sources when code is inherited and what decomposition strategies are prevalent for original examples without known sources, answering our third research question in section 6.
Scoping Program Decomposition for Our Analysis.
We acknowledge that prior to Observable, D3 users did not have access to code cells and used other strategies to decompose their code such as writing helper functions. Thus, Observable users could employ function calls and cell decomposition to further organize their D3 programs. To determine what decomposition information helper functions may provide beyond Observable code cells, we qualitatively analyzed 100 Bl.ocks.org examples from Bako et al.’s D3 dataset [2] to compare. Functions were used in the following ways (counts in parentheses):
-
•
Building entire visualizations (5/100).
-
•
Creating part of a visualization (18/100).
-
•
Data processing (43/100).
-
•
Adding interactions (74/100).
Overall, we find that helper functions in Github Gists from Bl.ocks.org are used similarly to Observable code cells, but code cells are more comprehensive. Thus, we focus on analyzing code cells in this paper. Further, we reiterate that white space is a more subjective measure of decomposition that may evolve as users iterate on their notebooks [31]. Thus, we avoid analyzing white space in this work.
4 Analysis 1: How do D3 Users Decompose Their Own Code?
To answer our first research question, we examined the examples in each corpus to identify the number and functionality of code cells and the relationships between cells, such as variable and function dependencies. We then clustered examples with similar code organization, which revealed three high-level code decomposition methods: Layered, Function Calling, and All-in-One, illustrated in Figure 1. In this section, we detail the patterns and prevalence of each decomposition strategy, compare our findings across different visualization types, and discuss potential relationships to existing theory on visualization grammars (e.g., the Layered Grammar of Graphics [43]).
For this analysis, we focus on the included examples from our corpus (125 of 560 examples, see subsection 2.2 and subsection 2.3). Note that since the excluded examples (435 of 560) are duplicates, one can extrapolate our results to the broader corpus using the counts in Table 1.
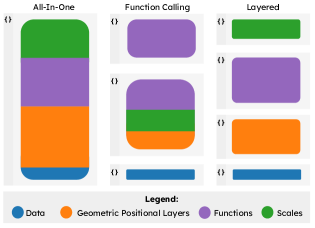
4.1 Layered Decomposition
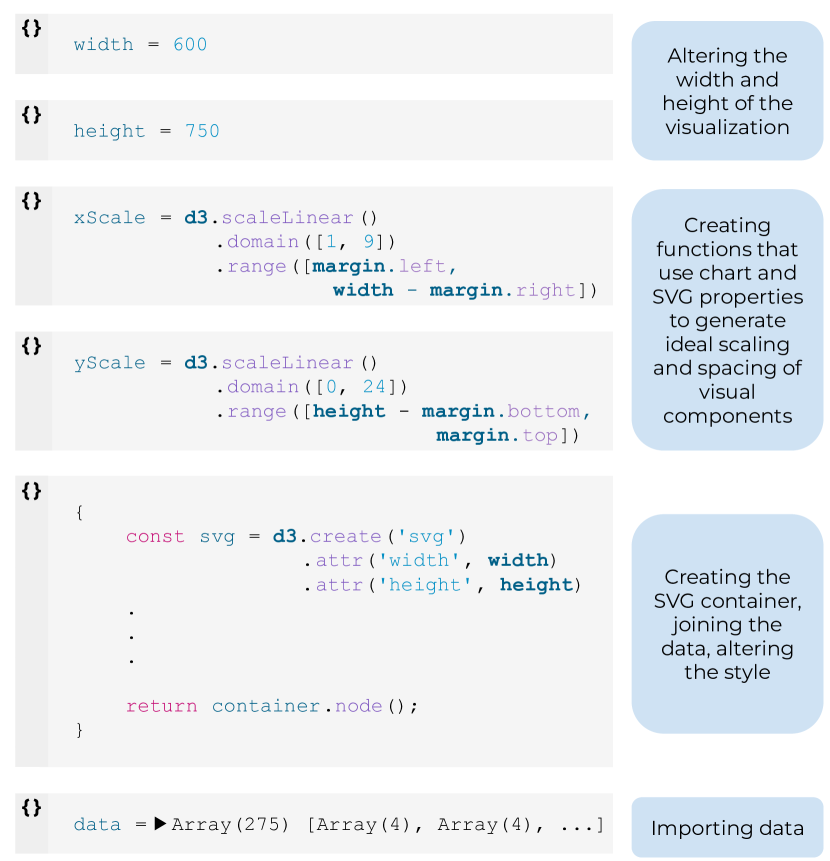
Layered decomposition was the most common strategy observed, appearing in 102 of 125 examples (82.4%). In Layered Decomposition, users create each code cell as a distinct layer that builds upon previous layers to implement a single example, represented as separate colors in Figure 1. An example sketch is illustrated in Figure 2. Each layer (code cell) tends to fall under one step of the visualization process, such as importing the dataset to be visualized (data in Figure 2), defining properties of the target image (height and width), specifying visual encodings (xScale and yScale), and rendering the final image (svg). Further, in Figure 2, the xScale layer builds on the width layer, the svg layer builds on the xScale layer, and so on.333We include relevant examples as footnotes, e.g., https://observablehq.com/@uvizlab/d3-tutorial-4-bar-chart-with-transition And while the number of layers varied across notebooks, their semantic categories remained consistent, such as layers for data loading, data manipulation, visual encoding, interaction encoding, and SVG rendering.
Furthermore, we observe that these semantic categories align with the components proposed by Wickham in the Layered Grammar of Graphics [43], which combines four visualization components to create layered visualizations: (a) “data”, (b) “aesthetic mappings” (i.e., visual encodings), (c) “statistical transformations”, and (d) “geometric objects” (e.g., SVG lines, circles, rectangles, etc.). In reviewing our corpus, we find the following overlaps: 100% of Layered Decomposition examples load their input data into a separate cell before visualizing it (a). 75.9% of Layered examples (41/54) using scales had separate code cells to specify them (b), which were then used by separate SVG code cells to render the visualization (d), supporting the idea of a Layered approach to building D3 examples. Further, 58.6% of Layered notebooks (34/58) that group and/or aggregate data perform the data grouping and aggregation steps in a separate Observable cell(s) (c). These findings suggest that for the notebooks studied, many users’ mental models of D3 code are well represented by the Layered Grammar of Graphics.
4.1.1 Layering Interactions
Although the Layered Grammar of Graphics is useful for reasoning about visual components, it fails to account for interactive components, which we frequently observed in our corpus (63 of 125 notebooks or 50.4%). In their analysis of D3 projects on GitHub, Bl.ocks.org, and Observable, Bako et al. observed six different interaction types [2]: Brush, Hover, Click, Visualize, Zoom & Pan, and Drag. We adopted the same classification strategy for our analysis, and observe the same six interaction types across our notebook corpus (see supplemental materials). 36 of the 63 interactive examples (57.1%) separated the interactive elements into multiple cells, often giving each interaction its own cell. This decomposition strategy resembles Layered code decomposition, but specifically for interactions. 15 of the 63 interaction notebooks (23.8%) incorporated the interactive code directly into the SVG rendering cell, similar to All-in-One decomposition for interactions. The remaining 12 of the 63 examples (19%) had interactive elements in the SVG rendering cell as well as in separate cells. The Visualize and Drag interactions were more likely to be placed into separate cells while the other four interactions were commonly integrated into the SVG-rendering cell. To summarize, some users put all interaction code into a single interaction cell (i.e., interaction as a component of layered visualization); some decompose interactions further into multiple cells, similar to layered visualization (i.e., Layered interaction); others integrate interaction code into existing cells (i.e., do not separate interaction from existing layers); and still others use a mix of these strategies. These findings suggest that users’ mental models of D3 interactions vary significantly. Given that interactions are known to be challenging to implement in D3 [7, 4], we may be observing some D3 users struggling to apply Layered decomposition to D3 interactions, providing opportunities for future support tools to ease the coding process.
4.2 Function Calling Decomposition
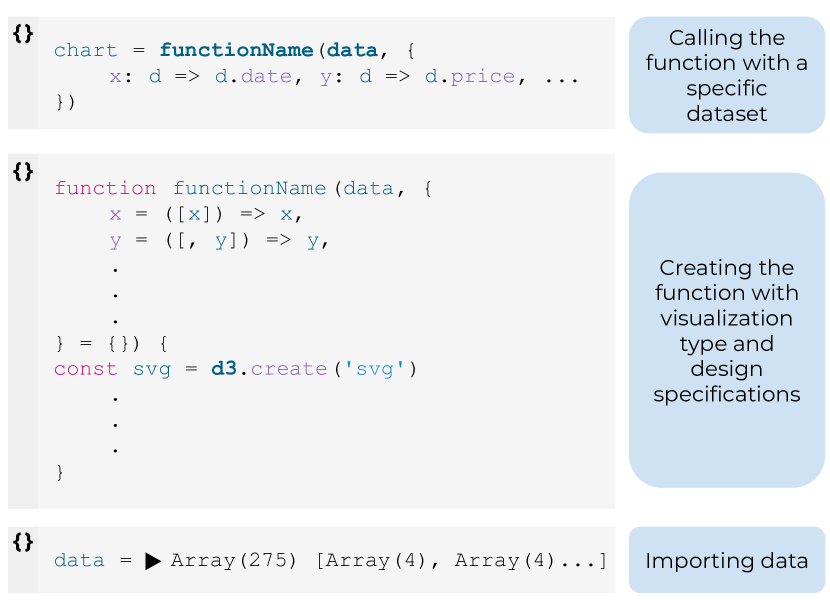
Function Calling decomposition was present in 9 of 125 examples (7.2%). As illustrated in Figure 1, Function Calling Decomposition generally splits code according to the target output (i.e., an entire visualization) instead of visualization steps (data manipulation, rendering, etc.). To do this, users who adopted Function Calling decomposition would create a helper function cell that generates the target visualization type (see Figure 3). Then, users would call this helper function in another cell to generate the final visualization. While some examples occasionally extracted a small number of components into separate cells, Function Calling code is typically segmented at a coarser scope compared to Layered decomposition. Although this decomposition strategy is uncommon, it can aid the creation of reusable visualization templates to speed up future projects [4, 2, 16]. We revisit this idea in our user study in section 7.
4.3 All-in-One Decomposition
Another strategy we observed is simply to not decompose the code. In this case, users place all of their code within a single Observable cell444https://observablehq.com/@crazyjackel/stacked-area-chart (see Figure 1). We call this All-in-One decomposition, which was present in only 8 of 125 examples (6.4%). Similar to Function Calling decomposition, there was not a strong preference for All-in-One decomposition. Although we acknowledge that users could be using white space to segment their code (see section 1 and section 3), the low prevalence of this strategy compared to Layered decomposition suggests that users are choosing to forego cell-based decomposition. We interview users about their decision making strategies in section 7.
4.4 Mixed Decomposition Strategies
The Layered, Function Calling, and All-in-One decomposition strategies are not necessarily mutually exclusive. We did observe rare examples using a mix of strategies. However, note that mixing All-in-One with Layered decomposition or All-in-One with Function Calling does not make sense, as All-in-One is defined in relation to the others (i.e., as a lack of decomposition). Thus, we focus on reporting examples that mix Layered and Function Calling Decomposition.
Examples displaying both Layered and Function Calling decomposition were rare. We observed 6 of 125 examples (4.8%) combining the idea of calling helper functions and having layers with modular code cells. For example, this notebook555https://observablehq.com/@randomfractals/nlp-word-cloud has separate code cells for chart properties such as x-scale, y-scale, and margins, exemplifying Layered decomposition. Additionally, they make use of separate cells for builder functions which are called within another code cell with the desired parameters passed in, similar to Function Calling decomposition.
4.5 Decomposition Among Different Visualization Types
To understand if visualization type impacts decomposition strategies, we performed a follow-up analysis to compare users’ decomposition strategies across the six most popular D3 visualization types reported in the literature: bar charts, bubble charts, geographic maps, graphs, line charts, and, scatterplots [2, 6, 7] (Figure 4). To do this, we collected 13 to 15 new examples following the searching strategy described in subsection 2.2 in addition to the 5 to 7 corpus examples we already had for each visualization type until we reached 20 total examples for each type. We chose not to use the collected excluded examples in order to examine a larger variety of notebooks. The new examples collected for this analysis are recorded separately from the 560-example corpus. Then, we analyzed the decomposition strategies of the new examples. Complete data and codings can be found in our supplementary material.
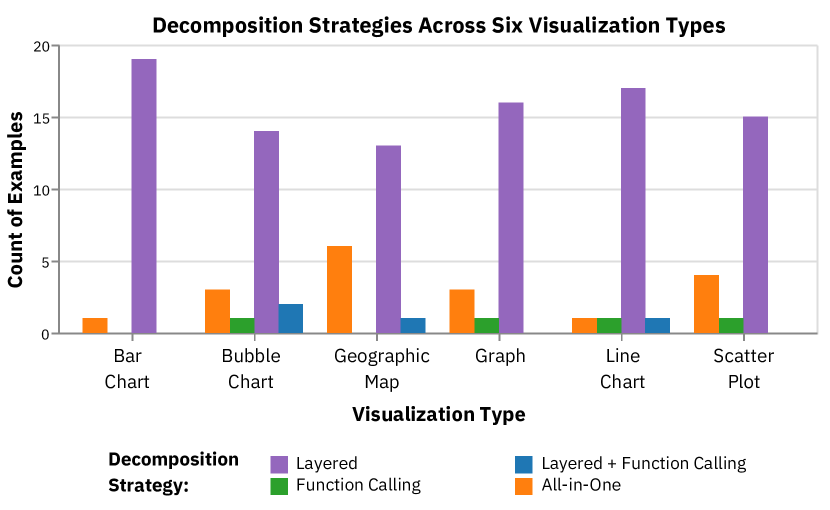
Our results show that Layered decomposition was the most popular amongst all six visualization types, with each type having 13 to 19 Layered examples out of 20 total (see Figure 4). These findings suggest that most of the Observable users we studied consistently prefer Layered decomposition and the popularity of decomposition strategies may be independent of visualization type.
5 Analysis 2: How do D3 Users Inherit Code From Existing Examples?
During our analysis of code decomposition strategies, we observed a prevalence of code reuse among the examples. We define code inheritance as the analysis of how users copy code from direct or indirect sources, as defined in subsection 2.3. In this section, we describe the four major code inheritance strategies we observed in our dataset as summarized in Table 2.
5.1 No Observed Code Inheritance
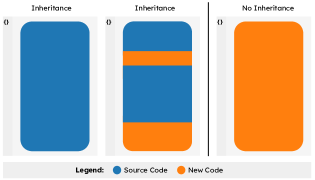
Examples with no observed code inheritance did not use code from any sources as shown in Figure 5. We observed two kinds of no-code inheritance: one where users created an example from scratch (which we refer to as original) and one where users forked an example but then did not use any of the code from the forked example, referred to as orthogonal code inheritance.
5.1.1 Original
This strategy captures examples that have no forks (i.e., a blank notebook was created) and were not found to have any indirect sources (i.e., from Observable or outside Observable). Original examples likely do not have copied code from elsewhere. 52/125 examples (41.6%) were Original. These findings suggest that observed decomposition results are a valid indication of how users think about D3 code since a large portion of them create examples from scratch and thus choose their own decomposition strategies.
5.1.2 Orthogonal Code Inheritance.
Orthogonal code inheritance occurs when examples are forked for reasons other than code reuse. We observed two instances where the source and the forked example share almost no code and produce entirely unrelated visualizations. We also encountered users who forked their own examples to either (a) build off of previous work or (b) conveniently couple examples through the fork links. 4/125 examples (3.2%) displayed Orthogonal Code Inheritance.
5.2 Presence of Code Inheritance
For corpus examples with code inheritance, users reused code from the Observable website or non-Observable platforms. Some examples would completely copy code from their sources and some would use portions of code from sources, as shown in Figure 5.
5.2.1 Observable Sourced.
Observable Sourced examples shared similarities with another Observable example. We labeled 61/125 (48.8%) examples as Observable Sourced, making it the most common code inheritance strategy. We observe that the majority of these examples are identical copies of their fork source, but some merely copy one cell or mention taking inspiration from a different user.
5.2.2 Outside Sourced.
We found 8/125 (6.4%) examples with Outside Sourced code inheritance (i.e., examples that share code with a source outside the Observable platform). Our investigation into these examples revealed that seven of the examples were observed to have copied code from GitHub Gist projects, and the remaining one took code from a blog website.
| Code Inheritance Strategy | Number of Examples |
|---|---|
| Original | 52/125 |
| Orthogonal | 4/125 |
| Observable Sourced | 61/125 |
| Outside Sourced | 8/125 |
5.3 Code Inheritance Among Different Visualization Types
We repeated our analysis in subsection 4.5 for the six visualization types but for code inheritance instead (summarized in Table 3). We find that majority of examples across the six visualization types are Original, with Observable Sourced as the second most popular code inheritance strategy. Our analysis shows that user preference for writing code is independent of visualization type.
| Visualization Type | Original | Orthogonal | Observable Sourced | Outside Sourced |
|---|---|---|---|---|
| Bar Chart | 16/20 | 0/20 | 4/20 | 0/20 |
| Bubble Chart | 11/20 | 0/20 | 9/20 | 0/20 |
| Geographic Map | 17/20 | 0/20 | 1/20 | 2/20 |
| Graph | 9/20 | 0/20 | 10/20 | 1/20 |
| Line Chart | 14/20 | 0/20 | 6/20 | 0/20 |
| Scatter Plot | 14/20 | 2/20 | 3/20 | 1/20 |
In summary, our analysis found that 56/125 (44.8%) of corpus examples opted not to inherit code. That being said, 55.2% of corpus examples did inherit code from existing sources, with 48.8% of the examples that inherit code copying directly from Observable. This suggests that our corpus and additional examples can provide insight into how users decompose their code both when using and not using code from a source, which we study in section 6.
6 Analysis 3: Can Code Inheritance Explain Decomposition Strategies?
To investigate if decomposition strategies are a reflection of users’ personal preferences or inherited from sources they copy from, we examine how frequently decomposition strategies were changed from source examples. By analyzing shifts in decomposition strategies, we identify which decomposition strategy appears to be most intuitive to Observable users.
6.1 Observable-Sourced Inheritance Strategies
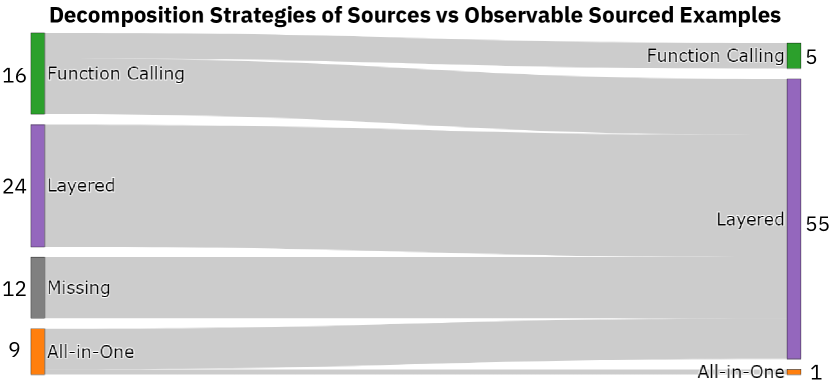
Status Quo implies that users defaulted to the decomposition strategy of their source. This was present in 30/61 (49.2%) Observable Sourced examples. Of those, 24/30 (80%) examples used Layered decomposition, suggesting user satisfaction with a layered approach. The remaining 6/30 examples demonstrated Function Calling decomposition and All-in-One decomposition, as illustrated in Figure 6. We note that they may be influenced by the popularity of the Layered decomposition strategy in source examples, as described in section 4.
11/61 (18%) Observable-sourced examples changed the source’s Function Calling decomposition to Layered decomposition. No examples did the opposite, suggesting that users prefer Layered decomposition over Function Calling decomposition.
8/61 (13.1%) Observable-sourced examples demonstrated changing All-in-One decomposition to Layered decomposition. This demonstrates a significant desire for Layered code, even if users first see non-Layered code. No examples did the opposite, reinforcing preference for Layered decomposition.
There were Observable Sourced examples that were forks of inaccessible deprecated D3 Gallery examples, so we code 12/125 (9.6%) of corpus examples with Missing Decomposition Inheritance as we cannot be sure of their source’s decomposition strategy at the time the examples were forked. All 12 of these examples displayed Layered decomposition, as shown in Figure 6.
6.2 Other Inheritance Strategies
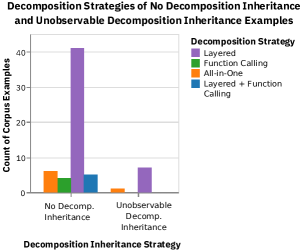
The 56 Original and Orthogonal examples were coded with No Decomposition Inheritance, as they had no copied code. 41/56 (73.2%) of these examples used Layered decomposition. This finding aligns with the trend of users preferring Layered decomposition, even if they do not inherit any code.
The 8 Outside-Sourced examples were not sourced from a cellular environment like Observable. Thus, decomposition inheritance was Unobservable. 7/8 of these examples still used Layered decomposition, shown in Figure 7. This suggests that Layered decomposition cannot be fully explained as an artifact of Observable’s cellular environment and likely reflects user preferences for structuring D3 code. However, future studies are needed to confirm this hypothesis.
6.3 Analyzing Decomposition Inheritance Across Different Visualization Types
We repeated our follow-up analysis with the six most popular D3 visualization types. The majority of examples across these six visualization types were Original (see subsection 5.3). We repeated our analysis in subsection 4.5 but for decomposition inheritance instead to find patterns between examples that did not inherit code and did inherit code.
83/120 (69.2%) examples had No Decomposition Inheritance. Layered decomposition was present in 61/83 of those examples. Once again, we see preference of Layered decomposition, regardless of code inheritance. Original notebooks show similar decomposition patterns as code-inherited notebooks in subsection 6.1, suggesting that inheritance is not a confounder and Layered decomposition is preferred to structure D3 Observable notebooks.
Overall, we found that Observable Sourced examples were unlikely to alter users’ decomposition strategies if the source used Layered decomposition. When users changed the decomposition strategy of inherited code, Layered decomposition was the most popular choice, depicted in Figure 6. We also report a preference for Layered Decomposition on the Original, Orthogonal, and Outside Sourced examples although they did not inherit code from a cellular environment, shown in Figure 7. In summary, users seemed to prefer Layered decomposition across all four code inheritance strategies, suggesting they intuitively think about D3 code in a layered and modular manner. Codings for each analyzed example is available in supplementary material.
7 How Do People Think About Organizing D3 Code?
Through our analysis of Observable notebooks, we found that people tend to prefer using Layered decomposition over Function Calling and All-in-One decomposition. However, this analysis alone does not give us insight into whether people are intentional about how they organize their D3 code, why people choose one decomposition method over other methods, and what benefits they perceive from organizing their code in a specific way. To explore how the decomposition strategies we observed relate to users’ mental models, i.e., how people think about their code, we interviewed seven D3 users on how they organize their code on Observable. We recruited participants through our professional networks and through the Observable platform directly. The study is approved by our institutional IRB. We view this study as an initial exploration into users’ thought processes to form hypotheses that can be validated by future research.
7.1 Participant Backgrounds
Our participants represent a wide range of age groups (18-54), educational backgrounds (high school to PhD), and occupations (e.g., researcher, analyst, Observable employee). Participant demographics are detailed in Table 4.
| ID | Age | Highest Degree | Occupation | D3 Exp |
|---|---|---|---|---|
| P1 | 25-34 | Masters | Research Assistant | 3-4 years |
| P2 | 18-24 | High school | Student | < 1 year |
| P3 | 18-24 | Bachelors | Data Analyst | 1-2 years |
| P4 | - | - | - | 5+ years |
| P5 | 25-34 | Bachelors | Software Developer | 3-4 years |
| P6 | 35-44 | Masters | Web Designer & Developer | 5+ years |
| P7 | 45-54 | PhD | D3 Maintainer & Observable Employee | 5+ years |
7.2 Interview Protocol
Participants were given an overview of the study and asked to sign a consent form. Participants also completed an optional demographics and background survey regarding their age, gender, race and ethnicity, occupation, and experience with statistics, making data visualization, and using Observable.
The interviews were conducted on Zoom, lasting an average of 34 minutes each, and were structured into two parts. First, participants are asked to screenshare an Observable D3 notebook and explain its purpose and functionality. During this overview, participants are prompted to discuss how they have organized the code, how they debug their D3 code on Observable, etc. Next, participants are asked questions about using D3 and Observable, including how they are influenced by past programming experience and whether they use other examples to build their visualizations. A full list of possible questions can be found in the supplemental materials.
7.3 Emerging Themes from the Interviews
We determined participants’ decomposition strategies based on the notebooks shared with us as well as by asking them about their code organization strategies, including the use of functions and Observable code cells; our inferred decomposition strategies were not explained to participants. We observed a breadth of decomposition preferences through our interviews (participants are labeled as P1, P2, P3, etc.): P1 uses All-in-One decomposition, P2, P3, and P5 use Layered decomposition, and P4, P6, and P7 use Function Calling decomposition. From these interviews, three common themes emerged on how people think about their D3 code.
7.3.1 These D3 Users are Intentional About Code Structure
All participants shared specific reasons why they chose to organize their code in certain ways. For example, 3/7 participants discussed how functions facilitate the reuse of data visualizations. P4 and P6 talked about building functions to reuse charts and showed us several examples. P5, who primarily uses Layered decomposition, showed us a visualization dashboard in which he used function calls for previously built charts to keep his dashboard neat. Participants also discuss thoughtful deviations from their usual strategies. For example, P4 mentioned that he will sometimes put all the code into a single cell instead of a function if he is testing new ideas or he isn’t planning to reuse the visualization. Similarly, P7 uses multiple new cells when he is playing with a new idea. Then, he streamlines the code into a single function later.
Using a certain decomposition style also helps participants achieve specific goals, such as understanding their code, keeping a notebook neat, improving integration into an external web application, and enabling interaction. For example, P2 presented a notebook that was part of a team project with the goal of importing it into a web application. P2 mentioned his team found that using a layered approach to organizing the code, instead of using a single cell, led to better visualization rendering in their web application. He described this process of deciding to use Layered decomposition, saying, "We found that it would clump really odd … We felt that separating each component would be easier for our web app, that way we can integrate text and components of the Observable notebook onto the web app". P3, who also used Layered decomposition, explained how building up a visualization step by step helped him understand the code better. While P5 used Function Calling decomposition for neatness in his presented visualization dashboard, most of the other notebooks he shared were individual charts decomposed into layers. While explaining his examples, P5 navigated to a forked source visualization he used for inspiration, where the source example used Function Calling decomposition. However, P5 was unable to recall why he reorganized the code given how long ago he created it. Lastly, P1 used new cells to enable interactions with his visualizations.
Together, these findings suggest that many users are intentional about how they structure D3 code and furthermore, how code structure can be changed to suit their design goals. Our participants organize their code in ways that best serve them and sometimes deviate from the primary decomposition strategy we observed if a different strategy aligns better with their long-term project goals.
7.3.2 Layered Decomposition Can Make Debugging Easier
Participants often mentioned debugging D3 code being a significant challenge (4 out of 7 participants), due in part to JavaScript’s silent failures [7]. To simplify the debugging process, P2 and P3 pointed to splitting code into distinct cells (i.e., Layered decomposition) as being helpful for isolating problems and identifying issues. P3 described how his code organization supports debugging, "If you display a visualization in a sequential process from top to bottom [referring to his use of Layered decomposition], you can go back up until where the problem disappears."
Other participants who do not typically use Layered decomposition also created new cells to identify issues. For example, P1 mentioned that he sometimes moves code to new cells instead of commenting it out. P7 also uses new cells for debugging by creating JavaScript mutables. These findings seem to align with recent work in CS education which finds that Layered decomposition strategies can make introductory programming assignments easier to debug and faster to complete [11].
7.3.3 Examples Inspire Code Organization as Well as Visualization Best Practices
Lastly, participants shared how they rely on examples for inspiration. In some cases, people use examples for inspiration on what data visualizations to create. Then, they fork the example and update the code structure to suit their needs. For example, P5 changed the decomposition strategy of the original source to suit his preferences.
Other participants discussed how they learned to structure their code from examples. P3, who exclusively layers code, pointed to how he was taught and the examples he learned from as the main reason he chooses to layer his code. The Observable D3 Gallery was also a significant source of inspiration for participants. For example, P4 mentioned that he changed the way he wrote functions based on seeing D3 examples from Mike Bostock and thinking their code organization was clearer. Similarly, P6 discussed how he learns from other notebooks, "It’s easy to learn [using Observable]. I can go open anybody’s notebook [and see] this is how they have written it… I can say that I learn from other people’s code." Additionally, P6 mentioned that his code structure looks very similar to examples in the Observable D3 Gallery as he frequently relies on it for inspiration.
8 Discussion: Implications for Future Research
In this paper, we infer users’ mental models of D3 code by analyzing how they structure their own D3 programs in the Observable notebook environment. We analyzed a corpus of 125 examples that represented over 560 notebooks when considering duplicates. We observed three different code decomposition strategies (Layered, Function Calling, and All-in-One) and two code inheritance strategies (Status Quo and changing Inheritance) as well as examples with no observed inheritance. Our user study corroborates these findings and contributes rationales for these strategies, such as easing the debugging process, facilitating code reuse across projects, or following best practices demonstrated by D3 experts. In this section, we summarize our main findings, their implications and limitations, and opportunities for future research.
8.1 Key Analysis Findings
We observe the following key findings from our analyses:
- •
-
•
When Observable users inherit a non-Layered decomposition strategy, they often change it to Layered decomposition. In contrast, users never changed from Layered to All-in-One or Function Calling decomposition, reiterating their preference for Layered Decomposition (section 6).
- •
-
•
When copying from existing D3 examples, users are making deliberate decisions regarding which visualization designs and coding strategies they choose to adopt (section 7).
-
•
Users choose decomposition strategies to improve their current and future visualization programming workflows such as by making debugging easier and facilitating code reuse (section 7).
8.2 Users’ Mental Models and Bridging the Gap Between Theory and Practice
Despite many visualization languages being structured according to existing programming paradigms and frameworks, there is little research on how these theories align with how users reason about visualizations in practice [7, 29]. To fill this gap, we contribute a dataset, analysis methods, and interviews with D3/Observable users. We find that Observable users make deliberate decisions regarding how they will decompose their D3 code. This decomposition process opens a window into how users reason about their code, e.g., step by step as in Layered decomposition or chart by chart as in Function Calling decomposition. Thus, these findings also suggest that code decomposition is a suitable proxy for how users organize their thoughts as they program D3 visualizations, i.e., users’ mental models of D3 programs.
By extension, visualization programming paradigms that align with users’ mental models may be easier for users to understand and thus form a favorable basis for new languages. Examples include the Grammar of Graphics [44] and Vega-Lite [36]/Altair [40] as well as the Layered Grammar of Graphics [43] and ggplot2 [42]. However, not all users segment their code using a Layered approach, suggesting that either visualization languages must be flexible enough to accommodate different user groups who think differently from one another, or a variety of languages are needed to cater to different mental models of visualization code. Recent work in studying ggplot2 usage suggests that it may not necessarily offer this type of flexibility [29], revealing a gap for new toolkits/grammars to fill. These principles also extend to support tools and documentation. For example, our findings show how examples from the Observable D3 gallery can influence the way Observable users organize their own D3 programs. Broadly, we encourage the visualization community to consider users’ programming strategies as a complementary model for studying user reasoning and visualization design.
8.3 Analyzing Other Programming Environments
Our findings can provide benefits for D3 users, but how might they translate beyond D3? We believe that certain results may have broader implications. For example, our observed decomposition strategies may translate well to ggplot2 given that it is designed using the principles of the Layered Grammar of Graphics [42]. For example, Pu and Kay observed some ggplot2 users organizing their code using a Layered approach but also observed users copying entire visualization specifications from previous ggplot2 projects [29], similar to the motivations for Function Calling decomposition reported in our interview study. Given that the Layered Grammar of Graphics [43] is based on the Grammar of Graphics [44], users of other Grammar of Graphics-based tools such as Altair [40] may exhibit similar behaviors. Further, given the complexities associated with programming interactions [36], we believe users of other toolkits/grammars may experience similar difficulties with programming interactions but to varying degrees. For example, Vega-Lite’s formalisms for selections [36] may make it easier for Altair users to reason about their interaction code.
However, we stress that the aim of this work is to understand the experiences of a specific set of users for a toolkit known to be challenging to use. We believe it is critical to deepen our understanding of individual user groups before trying to draw conclusions across them. To this end, we encourage the visualization community to continue exploring this avenue of scientific inquiry. Echoing the sentiments of prior studies [7, 29], we see studying toolkit usage as being just as important as developing new toolkits, and hope to see more studies of visualization grammar and toolkit usage in the future.
8.4 Automation to Improve Language Understanding
Large language models (LLMs)—and AI solutions in general—can be powerful tools for generating output matching an expressed visualization intent [20, 4, 46]. However, there are no guarantees regarding the quality and interpretability of AI-generated code. This is particularly challenging in scenarios where the code may not throw obvious errors (e.g., silent JavaScript errors in D3 programs [7]) and the target users lack the knowledge and skills to debug it code [24, 8].
Our research findings can contribute to future AI-driven solutions by revealing the programming patterns and structures that different D3 user groups find intuitive to understand. For example, one could prompt or fine-tune LLMs to organize and label code according to their semantic purpose, e.g., data manipulation, visual encoding, SVG rendering, interactions, etc. The Layered Grammar of Graphics can be used to form a priori labels for building a training set of decomposed D3 programs. LLMs could even be pipelined to generate code, then, organize it in a more intuitive way depending on the particular D3 user who is seeking support. In this way, our research can be used to generate code with a more intuitive structure and explanations for why it is structured the way it is.
8.5 Limitations
Our corpus examples were all collected from the Observable platform, representing a subset of D3 users. Some Observable users also program their visualizations in private notebooks, which we cannot access. While we employed multiple strategies to increase the rigor of our example and source collection (see section 2), we acknowledge there are examples where we were unable to locate or analyze the source. For example, some sources may have undergone changes after they were used. Thus, decomposition inheritance may not be fully verifiable. Finally, our corpus appears relatively small when ignoring duplicate notebooks. Including duplicates allows more D3 users to be included in our analysis, but given their redundancy with our initial corpus, we do not comment on them directly in our findings.
When examining notebooks, their purpose can greatly impact the final code decomposition. We chose not to filter based on intention and thus included education and tutorial notebooks within the example corpus. However, we believe this decision had minimal impact our conclusions as the ten included educational notebooks also exhibit a Layered decomposition approach. This reinforces the strong preference we observed among Observable users for Layered decomposition, and even a preference for creating layered notebooks to teach others D3.
9 Conclusion
Visualization users make deliberate choices about how they organize and structure their code. By studying the reasoning processes behind their code organization strategies, we can design visualization toolkits and support infrastructure that align with users’ programming mental models and visualization design goals. In this paper, we introduce a qualitative approach to analyzing how users decompose their D3 code in Observable notebooks and contextualize our findings through an interview study with D3/Observable users. Our analysis takes into account how users draw inspiration from existing notebooks and reorganize the code to match their own decomposition preferences and project goals. From our analyses, we find a clear preference among Observable users for layered decomposition, where users separate code into distinct cells that build on one another, and each cell serves a clear purpose (data manipulation, visual encoding, SVG rendering, etc.). This pattern held across different visualization types and code reuse strategies, suggesting that a layered decomposition approach aligns with users’ mental models of D3 code. Furthermore, this layered approach appears to align with existing visualization grammars, namely the Layered Grammar of Graphics [43]. Our interview study not only corroborates the decomposition and code reuse strategies we observed but also clarifies why certain strategies may be adopted; for example, to adopt best practices presented by D3 experts or to make D3 programs easier to debug. Our findings open up new research directions in observing the visualization programming and design processes, refining and creating visualization languages and grammars, and making AI-generated code examples more intuitive for D3 users to understand.
Supplemental Materials
All our supplemental materials are available via this anonymous OSF link: https://osf.io/sudb8/?view_only=302fc5c8d397412aac35c6e094ae7dd6. For ease of reviewing, we also provide a complete copy of all our supplementary materials as a zip file on PCS and a detailed README.md file that outlines its contents (also in the zip file).
References
- [1] B. Bach, M. Keck, F. Rajabiyazdi, T. Losev, I. Meirelles, J. Dykes, R. S. Laramee, M. AlKadi, C. Stoiber, S. Huron, C. Perin, L. Morais, W. Aigner, D. Kosminsky, M. Boucher, S. Knudsen, A. Manataki, J. Aerts, U. Hinrichs, J. C. Roberts, and S. Carpendale. Challenges and opportunities in data visualization education: A call to action. IEEE Transactions on Visualization and Computer Graphics, 30(1):649–660, 2024. doi: 10 . 1109/TVCG . 2023 . 3327378
- [2] H. Bako, A. Varma, A. Faboro, M. Haider, F. Nerrise, B. Kenah, and L. Battle. Streamlining visualization authoring in d3 through user-driven templates. In 2022 IEEE Visualization and Visual Analytics (VIS), pp. 16–20. IEEE Computer Society, Los Alamitos, CA, USA, oct 2022. doi: 10 . 1109/VIS54862 . 2022 . 00012
- [3] H. K. Bako, X. Liu, L. Battle, and Z. Liu. Understanding how designers find and use data visualization examples. IEEE Transactions on Visualization and Computer Graphics, 29(1):1048–1058, 2023. doi: 10 . 1109/TVCG . 2022 . 3209490
- [4] H. K. Bako, A. Varma, A. Faboro, M. Haider, F. Nerrise, B. Kenah, J. P. Dickerson, and L. Battle. User-driven support for visualization prototyping in d3. In Proceedings of the 28th International Conference on Intelligent User Interfaces, IUI ’23, p. 958–972. Association for Computing Machinery, New York, NY, USA, 2023. doi: 10 . 1145/3581641 . 3584041
- [5] Y. Bang, S. Cahyawijaya, N. Lee, W. Dai, D. Su, B. Wilie, H. Lovenia, Z. Ji, T. Yu, W. Chung, Q. V. Do, Y. Xu, and P. Fung. A multitask, multilingual, multimodal evaluation of ChatGPT on reasoning, hallucination, and interactivity. pp. 675–718, Nov. 2023. doi: 10 . 18653/v1/2023 . ijcnlp-main . 45
- [6] L. Battle, P. Duan, Z. Miranda, D. Mukusheva, R. Chang, and M. Stonebraker. Beagle: Automated Extraction and Interpretation of Visualizations from the Web, p. 1–8. CHI ’18. Association for Computing Machinery, New York, NY, USA, 2018. doi: 10 . 1145/3173574 . 3174168
- [7] L. Battle, D. Feng, and K. Webber. Exploring d3 implementation challenges on stack overflow. In 2022 IEEE Visualization and Visual Analytics (VIS), pp. 1–5, 2022. doi: 10 . 1109/VIS54862 . 2022 . 00009
- [8] B. A. Becker, P. Denny, J. Finnie-Ansley, A. Luxton-Reilly, J. Prather, and E. A. Santos. Programming is hard - or at least it used to be: Educational opportunities and challenges of ai code generation. In Proceedings of the 54th ACM Technical Symposium on Computer Science Education V. 1, SIGCSE 2023, p. 500–506. Association for Computing Machinery, New York, NY, USA, 2023. doi: 10 . 1145/3545945 . 3569759
- [9] M. Bostock. bl.ocks.org. https://github.com/mbostock/bl.ocks.org, 2015.
- [10] M. Bostock, V. Ogievetsky, and J. Heer. D3 data-driven documents. IEEE Transactions on Visualization and Computer Graphics, 17(12):2301–2309, Dec. 2011. doi: 10 . 1109/TVCG . 2011 . 185
- [11] C. Charitsis, C. Piech, and J. C. Mitchell. Detecting the reasons for program decomposition in cs1 and evaluating their impact. In Proceedings of the 54th ACM Technical Symposium on Computer Science Education V. 1, SIGCSE 2023, p. 1014–1020. Association for Computing Machinery, New York, NY, USA, 2023. doi: 10 . 1145/3545945 . 3569763
- [12] C. Chen, B. Lee, Y. Wang, Y. Chang, and Z. Liu. Mystique: Deconstructing svg charts for layout reuse. IEEE Transactions on Visualization and Computer Graphics, 30(1):447–457, 2024. doi: 10 . 1109/TVCG . 2023 . 3327354
- [13] A. De Lucia, V. Deufemia, C. Gravino, and M. Risi. An eclipse plug-in for the detection of design pattern instances through static and dynamic analysis. In 2010 IEEE International Conference on Software Maintenance, pp. 1–6, 2010. doi: 10 . 1109/ICSM . 2010 . 5609707
- [14] Y.-G. Guéhéneuc and G. Antoniol. Demima: A multilayered approach for design pattern identification. IEEE Transactions on Software Engineering, 34(5):667–684, 2008. doi: 10 . 1109/TSE . 2008 . 48
- [15] J. Harper and M. Agrawala. Deconstructing and restyling d3 visualizations. In Proceedings of the 27th Annual ACM Symposium on User Interface Software and Technology, UIST ’14, p. 253–262. Association for Computing Machinery, New York, NY, USA, 2014. doi: 10 . 1145/2642918 . 2647411
- [16] J. Harper and M. Agrawala. Converting basic d3 charts into reusable style templates. IEEE Transactions on Visualization & Computer Graphics, 24(03):1274–1286, mar 2018. doi: 10 . 1109/TVCG . 2017 . 2659744
- [17] E. Hoque and M. Agrawala. Searching the visual style and structure of d3 visualizations. IEEE Transactions on Visualization and Computer Graphics, 26(1):1236–1245, 2020. doi: 10 . 1109/TVCG . 2019 . 2934431
- [18] K. Z. Hu, M. A. Bakker, S. Li, T. Kraska, and C. A. Hidalgo. Vizml: A machine learning approach to visualization recommendation. In S. A. Brewster, G. Fitzpatrick, A. L. Cox, and V. Kostakos, eds., Proceedings of the 2019 CHI Conference on Human Factors in Computing Systems, p. 128. ACM, Glasgow, Scotland, UK, 2019. doi: 10 . 1145/3290605 . 3300358
- [19] Z. Ji, N. Lee, R. Frieske, T. Yu, D. Su, Y. Xu, E. Ishii, Y. J. Bang, A. Madotto, and P. Fung. Survey of hallucination in natural language generation. ACM Comput. Surv., 55(12), mar 2023. doi: 10 . 1145/3571730
- [20] N. W. Kim, G. Myers, and B. Bach. How good is chatgpt in giving advice on your visualization design? arXiv preprint arXiv:2310.09617, 2023.
- [21] Y. Lin, G. Meng, Y. Xue, Z. Xing, J. Sun, X. Peng, Y. Liu, W. Zhao, and J. Dong. Mining implicit design templates for actionable code reuse. In 2017 32nd IEEE/ACM International Conference on Automated Software Engineering (ASE), pp. 394–404, 2017. doi: 10 . 1109/ASE . 2017 . 8115652
- [22] A. M. McNutt and R. Chugh. Integrated visualization editing via parameterized declarative templates. In Proceedings of the 2021 CHI Conference on Human Factors in Computing Systems, CHI ’21. Association for Computing Machinery, New York, NY, USA, 2021. doi: 10 . 1145/3411764 . 3445356
- [23] R. P. Medeiros, G. L. Ramalho, and T. P. Falcão. A systematic literature review on teaching and learning introductory programming in higher education. IEEE Transactions on Education, 62(2):77–90, 2019. doi: 10 . 1109/TE . 2018 . 2864133
- [24] A. Moradi Dakhel, V. Majdinasab, A. Nikanjam, F. Khomh, M. C. Desmarais, and Z. M. J. Jiang. Github copilot ai pair programmer: Asset or liability? Journal of Systems and Software, 203:111734, 2023. doi: 10 . 1016/j . jss . 2023 . 111734
- [25] J. K.-Y. Ng, Y.-G. Guéhéneuc, and G. Antoniol. Identification of behavioural and creational design motifs through dynamic analysis. J. Softw. Maint. Evol., 22(8):597–627, dec 2010. doi: 10 . 1002/smr . 421
- [26] J. Niere. Fuzzy logic based interactive recovery of software design. In Proceedings of the 24th International Conference on Software Engineering. ICSE 2002, pp. 727–728, 2002. doi: 10 . 1145/581469 . 581473
- [27] Observable, Inc. Observable. https://observablehq.com, 2024.
- [28] P. Parsons, P. Shukla, and C. Park. Fixation and creativity in data visualization design: Experiences and perspectives of practitioners. In 2021 IEEE Visualization Conference (VIS), pp. 76–80, 2021. doi: 10 . 1109/VIS49827 . 2021 . 9623297
- [29] X. Pu and M. Kay. How data analysts use a visualization grammar in practice. In Proceedings of the 2023 CHI Conference on Human Factors in Computing Systems, CHI ’23. Association for Computing Machinery, New York, NY, USA, 2023. doi: 10 . 1145/3544548 . 3580837
- [30] W. Qian, X. Peng, Z. Xing, S. Jarzabek, and W. Zhao. Mining logical clones in software: Revealing high-level business and programming rules. In 2013 IEEE International Conference on Software Maintenance, pp. 40–49, 2013. doi: 10 . 1109/ICSM . 2013 . 15
- [31] D. Raghunandan, A. Roy, S. Shi, N. Elmqvist, and L. Battle. Code code evolution: Understanding how people change data science notebooks over time. In Proceedings of the 2023 CHI Conference on Human Factors in Computing Systems, CHI ’23. Association for Computing Machinery, New York, NY, USA, 2023. doi: 10 . 1145/3544548 . 3580997
- [32] S. Romano, G. Scanniello, M. Risi, and C. Gravino. Clustering and lexical information support for the recovery of design pattern in source code. In 2011 27th IEEE International Conference on Software Maintenance (ICSM), pp. 500–503, 2011. doi: 10 . 1109/ICSM . 2011 . 6080818
- [33] A. Rule, A. Tabard, and J. D. Hollan. Exploration and explanation in computational notebooks. In Proceedings of the 2018 CHI Conference on Human Factors in Computing Systems, CHI ’18, p. 1–12. Association for Computing Machinery, New York, NY, USA, 2018. doi: 10 . 1145/3173574 . 3173606
- [34] L. Ryan, D. Silver, R. S. Laramee, and D. Ebert. Teaching data visualization as a skill. IEEE Computer Graphics and Applications, 39(2):95–103, 2019. doi: 10 . 1109/MCG . 2018 . 2889526
- [35] A. Satyanarayan, B. Lee, D. Ren, J. Heer, J. Stasko, J. Thompson, M. Brehmer, and Z. Liu. Critical reflections on visualization authoring systems. IEEE Transactions on Visualization and Computer Graphics, 26(1):461–471, 2020. doi: 10 . 1109/TVCG . 2019 . 2934281
- [36] A. Satyanarayan, D. Moritz, K. Wongsuphasawat, and J. Heer. Vega-lite: A grammar of interactive graphics. IEEE Transactions on Visualization and Computer Graphics, 23(1):341–350, Jan 2017. doi: 10 . 1109/TVCG . 2016 . 2599030
- [37] X. Tang, Y. Yin, Q. Lin, R. Hadad, and X. Zhai. Assessing computational thinking: A systematic review of empirical studies. Computers & Education, 148:103798, 2020. doi: 10 . 1016/j . compedu . 2019 . 103798
- [38] S. Titov, Y. Golubev, and T. Bryksin. Resplit: Improving the structure of jupyter notebooks by re-splitting their cells. In 2022 IEEE International Conference on Software Analysis, Evolution and Reengineering (SANER), pp. 492–496, 2022. doi: 10 . 1109/SANER53432 . 2022 . 00066
- [39] N. Tsantalis, A. Chatzigeorgiou, G. Stephanides, and S. T. Halkidis. Design pattern detection using similarity scoring. IEEE Transactions on Software Engineering, 32(11):896–909, 2006. doi: 10 . 1109/TSE . 2006 . 112
- [40] J. VanderPlas, B. Granger, J. Heer, D. Moritz, K. Wongsuphasawat, A. Satyanarayan, E. Lees, I. Timofeev, B. Welsh, and S. Sievert. Altair: Interactive statistical visualizations for python. Journal of Open Source Software, 3(32):1057, 2018. doi: 10 . 21105/joss . 01057
- [41] H. Washizaki, K. Fukaya, A. Kubo, and Y. Fukazawa. Detecting design patterns using source code of before applying design patterns. In 2009 Eighth IEEE/ACIS International Conference on Computer and Information Science, pp. 933–938, 2009. doi: 10 . 1109/ICIS . 2009 . 209
- [42] H. Wickham. ggplot2: Elegant Graphics for Data Analysis. Springer-Verlag New York, 2009. doi: 10 . 1007/978-0-387-98141-3
- [43] H. Wickham. A layered grammar of graphics. Journal of Computational and Graphical Statistics, 19(1):3–28, 2010. doi: 10 . 1198/jcgs . 2009 . 07098
- [44] L. Wilkinson. The grammar of graphics. Springer New York, 2005. doi: 10 . 1007/0-387-28695-0
- [45] L. Wilkinson, A. Anand, and R. Grossman. Graph-theoretic scagnostics. In Information Visualization, IEEE Symposium on, pp. 157,158,159,160,161,162,163,164. IEEE Computer Society, Los Alamitos, CA, USA, Oct 2005. doi: 10 . 1109/INFVIS . 2005 . 1532142
- [46] Z. Zeng, P. Moh, F. Du, J. Hoffswell, T. Y. Lee, S. Malik, E. Koh, and L. Battle. An evaluation-focused framework for visualization recommendation algorithms. IEEE Transactions on Visualization and Computer Graphics, 28(1):346–356, 2022. doi: 10 . 1109/TVCG . 2021 . 3114814