State of the Practice for Medical Imaging Software
Abstract
We present the state of the practice for Medical Imaging (MI) software. We selected 29 medical imaging projects from 48 candidates, assessed 10 software qualities (installability, correctness/ verifiability, reliability, robustness, usability, maintainability, reusability, understandability, visibility/transparency and reproducibility) by answering 108 questions for each software project, and interviewed 8 of the 29 development teams. Based on the quantitative data for the first 9 qualities, we ranked the MI software with the Analytic Hierarchy Process (AHP). The four top ranked software products are: 3D Slicer, ImageJ, Fiji, and OHIF Viewer. Our ranking is mostly consistent with the community’s ranking, with four of our top five projects also appearing in the top five of a list ordered by stars-per-year. Generally, MI software is in a healthy state as shown by the following: in the repositories we observed 88% of the documentation artifacts recommended by research software development guidelines, 100% of MI projects use version control tools, and developers appear to use the common quasi-agile research software development process. However, the current state of the practice deviates from the existing guidelines because of the rarity of some recommended artifacts (like test plans, requirements specification, code of conduct, code style guidelines, product roadmaps, and Application Program Interface (API) documentation), low usage of continuous integration (17% of the projects), low use of unit testing (about 50% of projects), and room for improvement with documentation (six of nine developers felt their documentation wasn’t clear enough). From interviewing the developers, we identified five pain points and two qualities of potential concern: lack of development time, lack of funding, technology hurdles, ensuring correctness, usability, maintainability, and reproducibility. The interviewees proposed strategies to improve the state of the practice, to address the identified pain points, and to improve software quality. Combining their ideas with ours, we have the following list of recommendations: increase documentation, increase testing by enriching datasets, increase continuous integration usage, move to web applications, employ linters, use peer reviews, design for change, add assurance cases, and incorporate a “Generate All Things” approach.
Keywords: medical imaging, research software, software engineering, software quality, analytic hierarchy process, developer interviews
1 Introduction
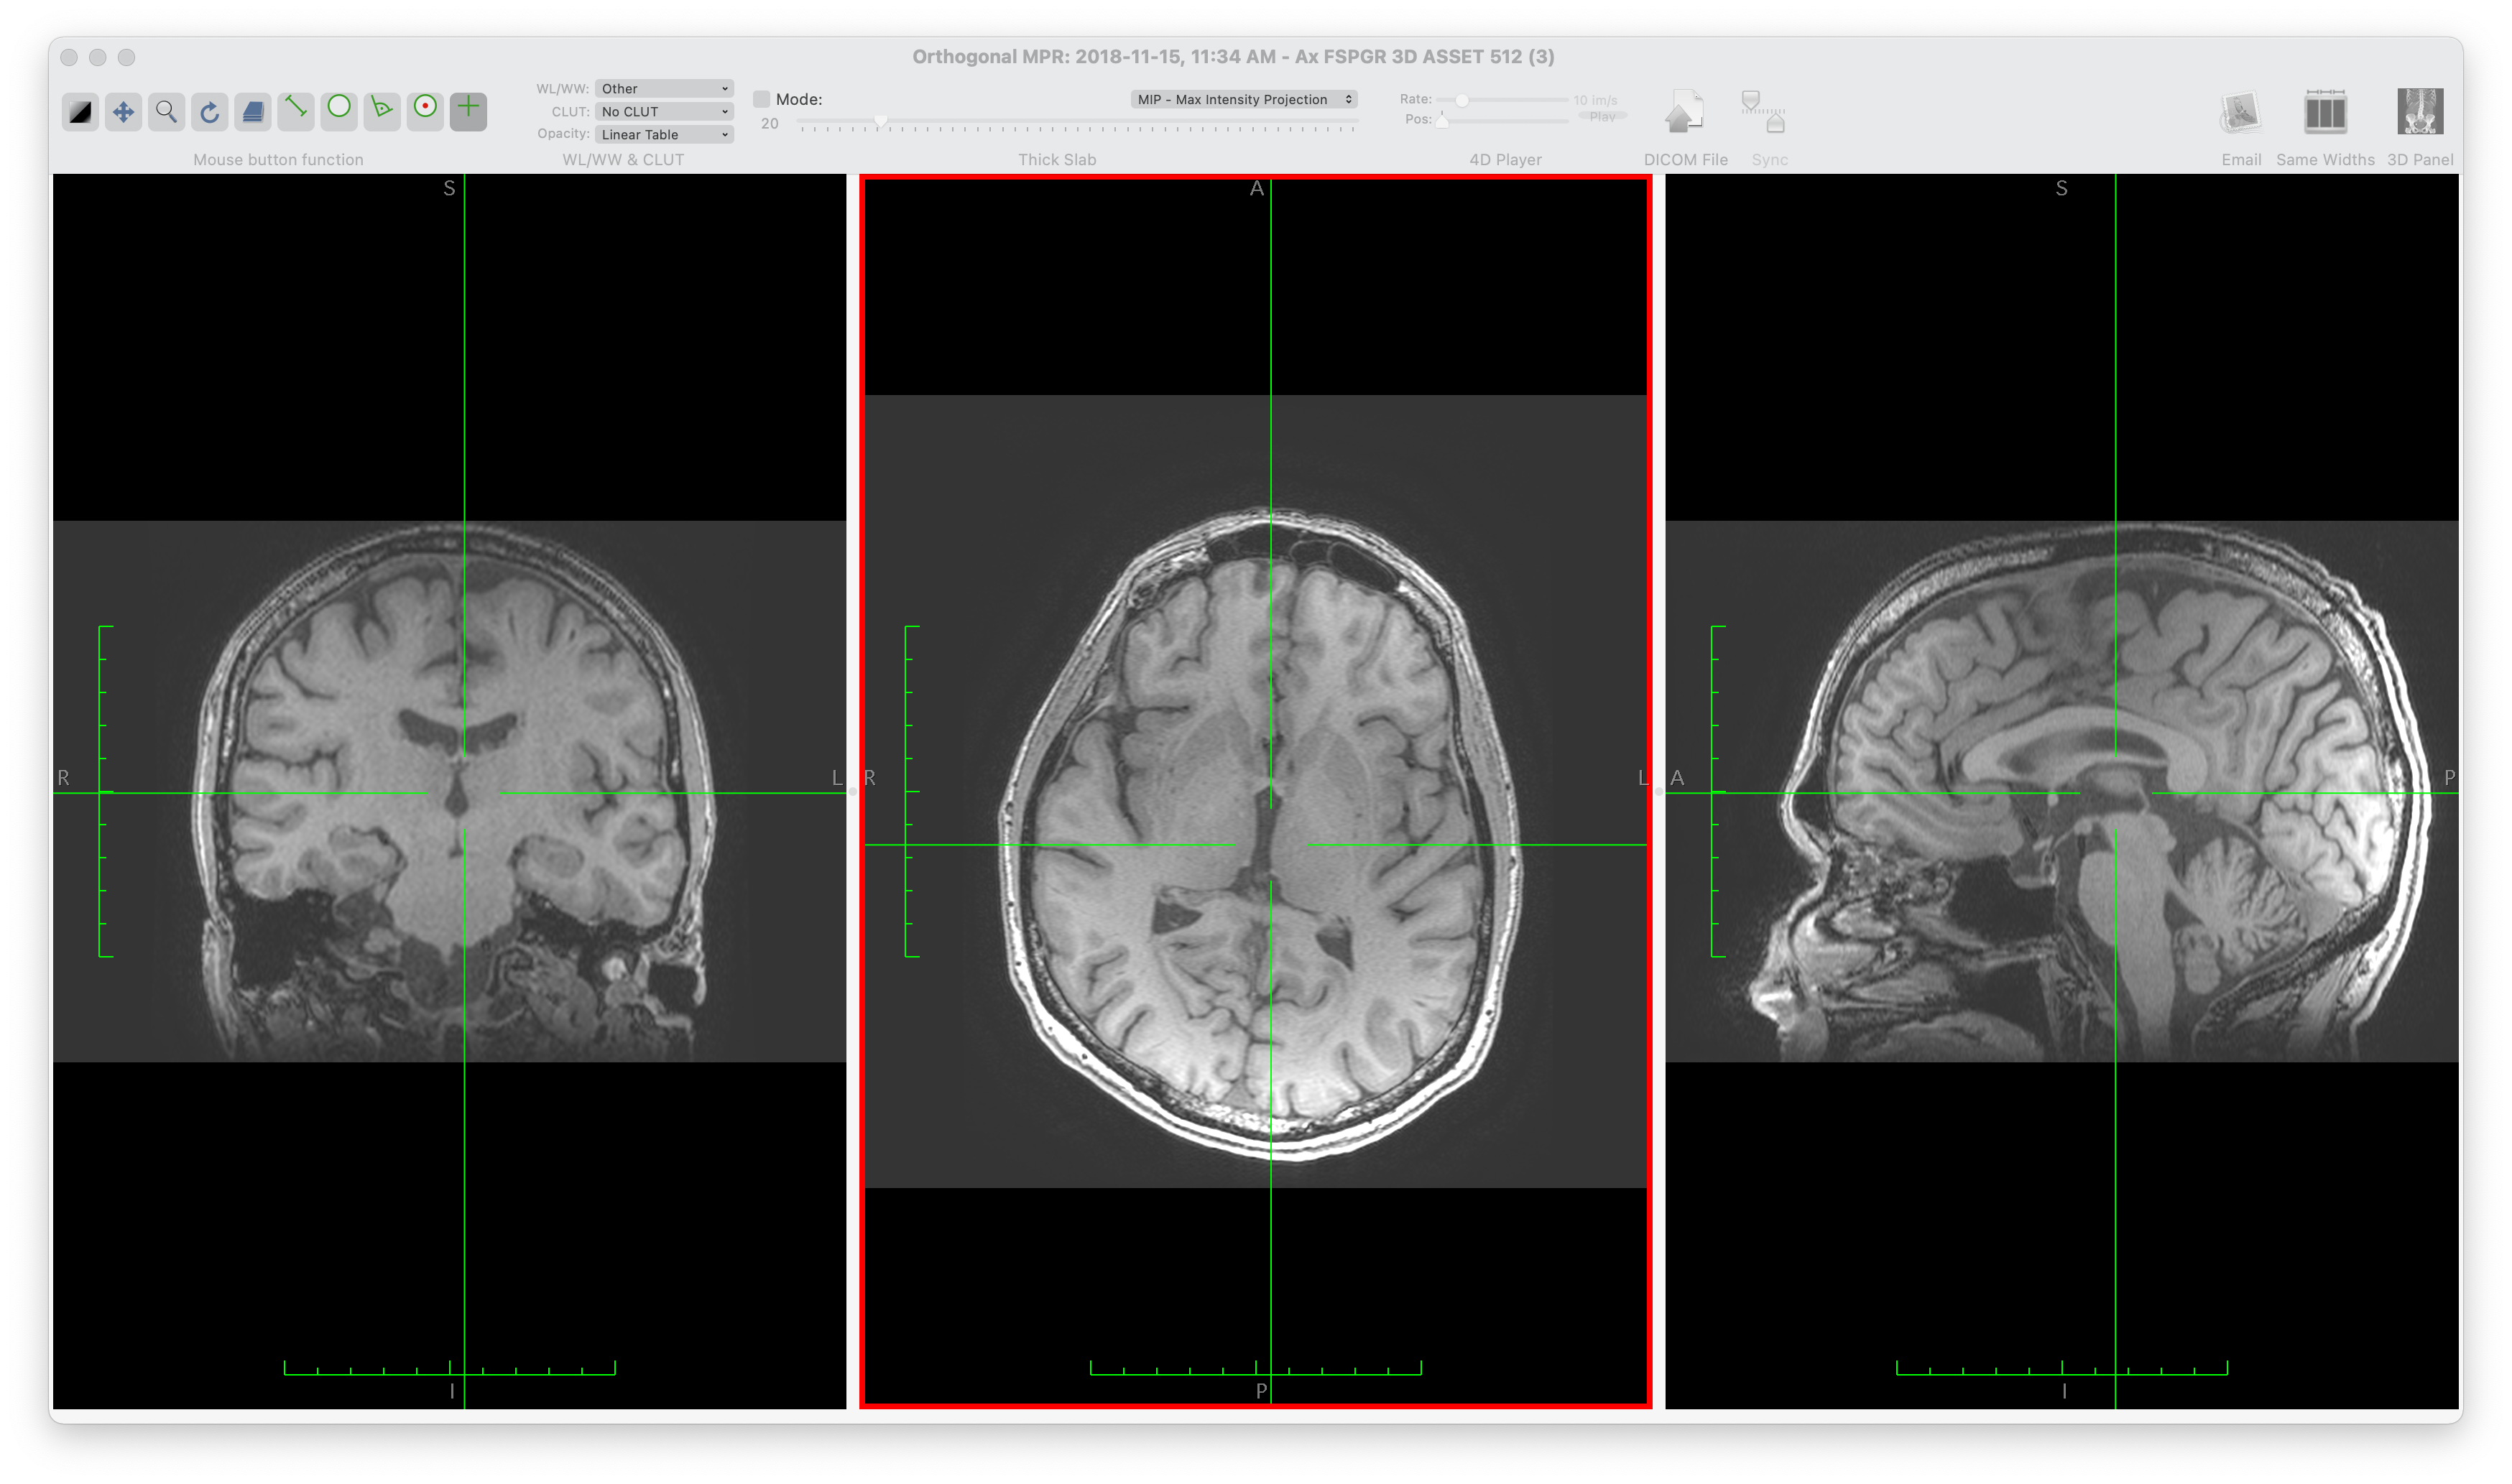
We aim to study the state of software development practice for Medical Imaging (MI) software. MI tools use images of the interior of the body (from sources such as Magnetic Resonance Imaging (MRI), Computed Tomography (CT), Positron Emission Tomography (PET) and Ultrasound) to provide information for diagnostic, analytic, and medical applications (Administration, 2021; Wikipedia contributors, 2021d; Zhang et al., 2008). Figure 1, which shows an image of the brain, highlights the importance and value of MI. Through MI medical practitioners and researchers can noninvasively gain insights into the human body, including information on injuries and illnesses. Given the importance of MI software and the high number of competing software projects, we wish to understand the merits and drawbacks of the current development processes, tools, and methodologies. We aim to assess through a software engineering lens the quality of the existing software with the hope of highlighting standout examples, understanding current pain points and providing guidelines and recommendations for future development.
1.1 Research Questions
Not only do we wish to gain insight into the state of the practice for MI software, we also wish to understand the development of research software in general. We wish to understand the impact of the often cited gap, or chasm, between software engineering and research software (Kelly, 2007; Storer, 2017). Although scientists spend a substantial proportion of their working hours on software development (Hannay et al., 2009a; Prabhu et al., 2011), many developers learn software engineering skills by themselves or from their peers, instead of from proper training (Hannay et al., 2009a). Hannay et al. (2009a) observe that many scientists showed ignorance and indifference to standard software engineering concepts. For instance, according to a survey by Prabhu et al. (2011), more than half of their 114 subjects did not use a proper debugger when coding.
To gain insights, we devised 10 research questions, which can be applied to MI, as well as to other domains, of research software (Smith et al., 2021; Smith and Michalski, 2022). We designed the questions to learn about the community’s interest in, and experience with, software artifacts, tools, principles, processes, methodologies, and qualities. When we mention artifacts we mean the documents, scripts and code that constitutes a software development project. Example artifacts include requirements, specifications, user manuals, unit tests, system tests, usability tests, build scripts, API (Application Programming Interface) documentation, READMEs, license documents, process documents, and code. Once we have learned what MI developers do, we then put this information in context by contrasting MI software against the trends shown by developers in other research software communities. Our aim is to collect enough information to understand the current pain points experienced by the MI software development community so that we can make some preliminary recommendations for future improvements.
We based the structure of the paper on the research questions, so for each research question below we point to the section that contains our answer. We start with identifying the relevant examples of MI software for the assessment exercise:
-
RQ1:
What MI software projects exist, with the constraint that the source code must be available for all identified projects? (Section 4)
- RQ3:
- RQ5:
-
RQ7:
How do MI projects compare to research software in general with respect to the artifacts present in their repositories? (Section 6)
- RQ9:
-
RQ11:
How do MI projects compare to research software in general with respect to principles, processes, and methodologies used? (Section 8)
-
RQ13:
What are the pain points for developers working on MI software projects? (Section 9)
-
RQ15:
How do the pain points of developers from MI compare to the pain points for research software in general? (Section 9)
-
RQ17:
For MI developers what specific best practices are taken to address the pain points and software quality concerns? (Section 9)
- RQ19:
1.2 Scope
To make the project feasible, we only cover MI visualization software. As a consequence we are excluding many other categories of MI software, including Segmentation, Registration, Visualization, Enhancement, Quantification, Simulation, plus MI archiving and telemedicine systems (Compression, Storage, and Communication) (as summarized by Bankman (2000) and Angenent et al. (2006)). We also exclude Statistical Analysis and Image-based Physiological Modelling (Wikipedia contributors, 2021c) and Feature Extraction, Classification, and Interpretation (Kim et al., 2011). Software that provides MI support functions is also out of scope; therefore, we have not assessed the toolkit libraries VTK (Schroeder et al., 2006) and ITK (McCormick et al., 2014). Finally, Picture Archiving and Communication System (PACS), which helps users to economically store and conveniently access images (Choplin et al., 1992), are considered out of scope.
1.3 Methodology Overview
We designed a general methodology to assess the state of the practice for research software (Smith et al., 2021; Smith and Michalski, 2022). Details can be found in Section 3. Our methodology has been applied to MI software (Dong, 2021a) and Lattice Boltzmann Solvers (Michalski, 2021; Smith et al., 2024). This methodology builds off prior work to assess the state of the practice for such domains as Geographic Information Systems (Smith et al., 2018b), Mesh Generators (Smith et al., 2016b), Seismology software (Smith et al., 2018e), and Statistical software for psychology (Smith et al., 2018c). In keeping with the previous methodology, we have maintained the constraint that the work load for measuring a given domain should be feasible for a team as small as one person, and for a short time, ideally around a person month of effort. We consider a person month as working days ( weeks in a month, with days of work per week) at person hours per day, or person hours.
With our methodology, we first choose a research software domain (in the current case MI) and identify a list of about 30 software packages. (For measuring MI we used 29 software packages.) We approximately measure the qualities of each package by filling in a grading template. Compared with our previous methodology, the new methodology also includes repository based metrics, such as the number of files, number of lines of code, percentage of issues that are closed, etc. With the quantitative data in the grading template, we rank the software with the Analytic Hierarchy Process (AHP) (Section 2 provides details). After this, as another addition to our previous methodology, we interview some development teams to further understand the status of their development process.
2 Background
To measure the existing MI software we need two sets of definitions: i) the definitions of relevant software license models (Section 2.1); and, ii) the definitions of the software qualities that we will be assessing (Section 2.2). In our assessment we rank the software packages for each quality; therefore, this section also provides the background on our ranking process — the Analytic Hierarchy Process (Section 2.3).
2.1 Software Categories
When assessing software packages, we need to know the software’s license. In particular, we need to know whether the source code will be available to us or not. We define three common software categories. We will only assess software that fits under the Open Source Software license.
-
•
Open Source Software (OSS) For OSS, the source code is openly accessible. Users have the right to study, change and distribute it under a license granted by the copyright holder. For many OSS projects, the development process relies on the collaboration of different contributors worldwide (Corbly, 2014). Accessible source code usually exposes more “secrets” of a software project, such as the underlying logic of software functions, how developers achieve their works, and the flaws and potential risks in the final product. Thus, OSS is suitable for researchers analyzing the qualities of a project.
-
•
Freeware Freeware is software that can be used free of charge. Unlike OSS, the authors of do not allow access or modify the source code (Project, 2006). To many end-users, the differences between freeware and OSS may not be relevant. However, software developers who wish to modify the source code, and researchers looking for insight into software development process may find the inaccessible source code a problem.
-
•
Commercial Software “Commercial software is software developed by a business as part of its business” (GNU, 2019). Typically speaking, commercial software requires users to pay to access all of its features, excluding access to the source code. However, some commercial software is also free of charge (GNU, 2019). Based on our experience, most commercial software products are not OSS.
2.2 Software Quality Definitions
Quality is defined as a measure of the excellence or worth of an entity. As is common practice, we do not think of quality as a single measure, but rather as a set of measures. That is, quality is a collection of different qualities, often called “ilities.” Below we list the 10 qualities of interest for this study. The order of the qualities follows the order used in Ghezzi et al. (2003), which puts related qualities (like correctness and reliability) together. Moreover, the order is roughly the same as the order developers consider qualities in practice.
- •
-
•
Correctness & Verifiability A program is correct if it matches its specification (Ghezzi et al., 2003, p. 17). The specification can either be explicitly or implicitly stated. The related quality of verifiability is the ease with which the software components or the integrated product can be checked to demonstrate its correctness.
- •
-
•
Robustness Software possesses the characteristic of robustness if it behaves “reasonably” in two situations: i) when it encounters circumstances not anticipated in the requirements specification, and ii) when users violate the assumptions in its requirements specification (Ghezzi et al., 2003, p. 19), (Boehm, 2007).
- •
- •
-
•
Reusability “The extent to which a software component can be used with or without adaptation in a problem solution other than the one for which it was originally developed” (Kalagiakos, 2003).
-
•
Understandability “The capability of the software product to enable the user to understand whether the software is suitable, and how it can be used for particular tasks and conditions of use” (ISO, 2001).
-
•
Visibility/Transparency The extent to which all the steps of a software development process and the current status of it are conveyed clearly (Ghezzi et al., 2003, p. 32).
-
•
Reproducibility “A result is said to be reproducible if another researcher can take the original code and input data, execute it, and re-obtain the same result” (Benureau and Rougier, 2017).
2.3 Analytic Hierarchy Process (AHP)
Saaty developed AHP in the 1970s, and people have widely used it since to make and analyze multiple criteria decisions (Vaidya and Kumar, 2006). AHP organizes multiple criteria in a hierarchical structure and uses pairwise comparisons between alternatives to calculate relative ratios (Saaty, 1990). AHP works with sets of options and criteria. In our project and since there are 29 options (software products) and 9 criteria (qualities). We rank the software for each of the qualities, and then we combine the quality rankings into an overall ranking based on the relative priorities between qualities.
The first step for ranking the software choices for a given quality involves a pairwise comparison between each of the software options for that quality. AHP expresses the comparison through an matrix . When comparing option and option , the value of is decided as follows, with the value of generally equal to (Saaty, 1990): if criterion and criterion are equally important, while if criterion is extremely more important than criterion . The natural numbers between 1 and 9 are used to show the different levels of relative importance between these two extremes. The above assumes that option is of equal, or more, importance compared to option (). If that is not the case, we reverse and and determine first, then .
Section 3.3 shows how we measure the software via a grading template. For the AHP process, the relevant measure is the subjective score from to for each quality for each package. To turn these subjective measures and into Saaty’s pair-wise scores for option versus option , respectively, we use the following calculation:
For example, we measured the usability for 3D Slicer and Ginkgo CADx as and , respectively; therefore, on the 9-point scale, 3D Slicer compared to Ginkgo CADx is 2 and Ginkgo CADx versus 3D Slicer is 1/2, as shown in the sample AHP calculations (Table 1).
The second step is to calculate the priority vector from . The vector ranks the software options by how well they achieve the given quality. The priority vector can be calculated by solving the equation (Saaty, 1990):
| (1) |
where is the maximal eigenvalue of . In this project, is approximated with the classic mean of normalized values approach (Ishizaka and Lusti, 2006):
| (2) |
Table 1 summarizes the above two steps for the quality of installability. The matrix is shown in the first set of columns, then the normalized version of and finally the average of the normalized values to form the vector in the last column.
|
3D Slicer |
Ginkgo |
XMedCon |
Gwyddion |
3D Slicer |
Ginkgo |
XMedCon |
Gwyddion |
AVG | |||
| 3D Slicer | 1 | 2 | 4 | 2 | 0.071 | 0.078 | 0.060 | 0.078 | 0.068 | ||
| Ginkgo | 1/2 | 1 | 3 | 1 | 0.036 | 0.039 | 0.045 | 0.039 | 0.041 | ||
| XMedCon | 1/4 | 1/3 | 1 | 1/3 | 0.018 | 0.013 | 0.015 | 0.013 | 0.015 | ||
| Gwyddion | 1/2 | 1 | 3 | 1 | 0.036 | 0.039 | 0.045 | 0.039 | 0.041 | ||
| SUM = | 14.01 | 25.58 | 66.75 | 25.58 | 1.000 | 1.000 | 1.000 | 1.000 | 1.000 | ||
We repeat the first and second steps for each of the qualities. The third step combines the quality rankings into an overall ranking. Following AHP, we need to first prioritize the qualities. The AHP method finds the priority of quality () in the same way that the score () was found for software package evaluated for a given quality (as shown above). That is, we conduct a pairwise comparison between the priority of different qualities to construct the matrix , and then we take the mean of normalized values for row to find the priority value for quality . If we introduce the notation that is the score for quality for package , then the overall score for package is found via:
3 Methodology
We developed a methodology for evaluating the state of the practice of research software (Smith et al., 2021; Smith and Michalski, 2022). The methodology can be instantiated for a specific domain of scientific software, which in the current case is medical imaging software for visualization. Our methodology involves and engages a domain expert partner throughout, as discussed in Section 3.1. The four main steps of the methodology are:
In the sections below we provide additional detail on the above steps, while concurrently giving examples of how we applied the methodology to the MI domain.
3.1 Interaction With Domain Expert
The Domain Expert is an important member of the state of the practice assessment team. Pitfalls exist if non-experts attempt to acquire an authoritative list of software, or try to definitively rank the software. Non-experts have the problem that they can only rely on information available on-line, which has the following drawbacks: i) the on-line resources could have false or inaccurate information; and, ii) the on-line resources could leave out relevant information that is so in-grained with experts that nobody thinks to explicitly record it.
Domain experts may be recruited from academia or industry. The only requirements are knowledge of the domain and a willingness to be engaged in the assessment process. The Domain Expert does not have to be a software developer, but they should be a user of domain software. Given that the domain experts are likely to be busy people, the measurement process cannot put too much of a burden on their time. For the current assessment, our Domain Expert (and paper co-author) is Dr. Michael Noseworthy, Professor of Electrical and Computer Engineering at McMaster University, Co-Director of the McMaster School of Biomedical Engineering, and Director of Medical Imaging Physics and Engineering at St. Joseph’s Healthcare, Hamilton, Ontario, Canada.
In advance of the first meeting with the Domain Expert, they are asked to create a list of top software packages in the domain. This is done to help the expert get in the right mind set in advance of the meeting. Moreover, by doing the exercise in advance, we avoid the potential pitfall of the expert approving the discovered list of software without giving it adequate thought.
The Domain Experts are asked to vet the collected data and analysis. In particular, they are asked to vet the proposed list of software packages and the AHP ranking. These interactions can be done either electronically or with in-person (or virtual) meetings.
3.2 List of Representative Software
We have a two-step process for selecting software packages: i) identify software candidates in the chosen domain; and, ii) filter the list to remove less relevant members (Smith et al., 2021).
We initially identified 48 MI candidate software projects from the literature (Björn, 2017; Brühschwein et al., 2019; Haak et al., 2015), on-line articles (Emms, 2019; Hasan, 2020; Mu, 2019), and forum discussions (Samala, 2014). The full list of 48 packages is available in Dong (2021a). To reduce the length of the list to a manageable number (29 in this case, as given in Section 4), we filtered the original list as follows:
-
1.
We removed the packages that did not have source code available, such as MicroDicom, Aliza, and jivex.
-
2.
We focused on the MI software that provides visualization functions, as described in Section 1.2. Furthermore, we removed seven packages that were toolkits or libraries, such as VTK, ITK, and dcm4che. We removed another three that were for PACS.
-
3.
We removed Open Dicom Viewer, since it has not received any updates in a long time (since 2011).
The Domain Expert provided a list of his top 12 software packages. We compared his list to our list of 29. We found 6 packages were on both lists: 3D Slicer, Horos, ImageJ, Fiji, MRIcron (we actually use the update version MRIcroGL) and Mango (we actually use the web version Papaya). Six software packages (AFNI, FSL, Freesurfer, Tarquin, Diffusion Toolkit, and MRItrix) were on the Domain Expert list, but not on our filtered list. However, when we examined those packages, we found they were out of scope, since their primary function was not visualization. The Domain Expert agreed with our final choice of 29 packages.
3.3 Grading Software
We grade the selected software using the measurement template summarized in Smith et al. (2021). The template provides measures of the qualities listed in Section 2.2, except for reproducibility, which is assessed through the developer interviews (Section 3.4). For each software package, we fill in the template questions. To stay within the target of 160 person hours to measure the domain, we allocated between one and four hours for each package. Project developers can be contacted for help regarding installation, if necessary, but we impose a cap of about two hours on the installation process, to keep the overall measurement time feasible. Figure 2 shows an excerpt of the spreadsheet. The spreadsheet includes a column for each measured software package.

The full template consists of 108 questions categorized under 9 qualities. We designed the questions to be unambiguous, quantifiable, and measurable with limited time and domain knowledge. We group the measures under headings for each quality, and one for summary information. The summary information (shown in Figure 2) is the first section of the template. This section summarizes general information, such as the software name, purpose, platform, programming language, publications about the software, the first release and the most recent change date, website, source code repository of the product, number of developers, etc. We follow the definitions given by Gewaltig and Cannon (2012) for the software categories. Public means software intended for public use. Private means software aimed only at a specific group, while the concept category is for software written simply to demonstrate algorithms or concepts. The three categories of development models are (open source, free-ware and commercial) are discussed in Section 2.1. Information in the summary section sets the context for the project, but it does not directly affect the grading scores.
For measuring each quality, we ask several questions and the typical answers are among the collection of “yes”, “no”, “n/a”, “unclear”, a number, a string, a date, a set of strings, etc. The grader assigns each quality an overall score, between 1 and 10, based on all the previous questions. Several of the qualities use the word “surface”. This is to highlight that, for these qualities in particular, the best that we can do is a shallow measure. For instance, we are not currently doing any experiments to measure usability. Instead, we are looking for an indication that the developers considered usability. We do this by looking for cues in the documentation, like a getting started manual, a user manual and a statement of expected user characteristics. Below is a summary of how we assess adoption of best practices by measuring each quality.
-
•
Installability We assess the following: i) existence and quality of installation instructions; ii) the quality of the user experience via the ease of following instructions, number of steps, automation tools; and, iii) whether there is a means to verify the installation. If any problem interrupts the process of installation or uninstallation, we give a lower score. We also record the Operating System (OS) used for the installation test.
-
•
Correctness & Verifiability We check each project to identify any techniques used to ensure this quality, such as literate programming, automated testing, symbolic execution, model checking, unit tests, etc. We also examine whether the projects use Continuous Integration and Continuous Delivery (CI/CD). For verifiability, we go through the documents of the projects to check for the presence of requirements specifications, theory manuals, and getting started tutorials. If a getting started tutorial exists and provides expected results, we follow it to check the correctness of the output.
-
•
Surface Reliability We check the following: i) whether the software breaks during installation; ii) the operation of the software following the getting started tutorial (if present); iii) whether the error messages are descriptive; and, iv) whether we can recover the process after an error.
-
•
Surface Robustness We check how the software handles unexpected/unanticipated input. For example, we prepare broken image files for MI software packages that load image files. We use a text file (.txt) with a modified extension name (.dcm) as an unexpected/unanticipated input. We load a few correct input files to ensure the function is working correctly before testing the unexpected/unanticipated ones.
-
•
Surface Usability We examine the project’s documentation, checking for the presence of getting started tutorials and/or a user manual. We also check whether users have channels to request support, such as an e-mail address, or issue tracker. Our impressions of usability are based on our interaction with the software during testing. In general, an easy-to-use graphical user interface will score high.
-
•
Maintainability We believe that the artifacts of a project, including source code, documents, and building scripts, significantly influence its maintainability. Thus, we check each project for the presence of such artifacts as API documentation, bug tracker information, release notes, test cases, and build scripts. We also check for the use of tools supporting issue tracking and version control, the percentages of closed issues, and the proportion of comment lines in the code.
-
•
Reusability We count the total number of code files for each project. Projects with numerous components potentially provide more choices for reuse. Furthermore, well-modularized code, which tends to have smaller parts in separate files, is typically easier to reuse. Thus, we assume that projects with more code files and fewer Lines of Code (LOC) per file are more reusable. We also consider projects with API documentation as delivering better reusability.
-
•
Surface Understandability Given that time is a constraint, we cannot look at all code files for each project; therefore, we randomly examine 10 code files for their understandability. We check the code’s style within each file, such as whether the identifiers, parameters, indentation, and formatting are consistent, whether the constants (other than 0 and 1) are not hardcoded, and whether the code is modularized. We also check the descriptive information for the code, such as documents mentioning the coding standard, the comments in the code, and the descriptions or links for details on algorithms in the code.
-
•
Visibility/Transparency To measure this quality, we check the existing documents to find whether the software development process and current status of a project are visible and transparent. We examine the development process, current status, development environment, and release notes for each project.
As part of filling in the measurement template, we use freeware tools to collect repository related data. GitStats (Gieniusz, 2019) is used to measure the number of binary files as well as the number of added and deleted lines in a repository. We also use this tool to measure the number of commits over different intervals of time. Sloc Cloc and Code (scc) (Boyter, 2021) is used to measure the number of text based files as well as the number of total, code, comment, and blank lines in a repository.
Both tools measure the number of text-based files in a git repository and lines of text in these files. Based on our experience, most text-based files in a repository contain programming source code, and developers use them to compile and build software products. A minority of these files are instructions and other documents. So we roughly regard the lines of text in text-based files as lines of programming code. The two tools usually generate similar but not identical results. From our understanding, this minor difference is due to the different techniques to detect if a file is text-based or binary.
For projects on GitHub we manually collect additional information, such as the numbers of stars, forks, people watching this repository, open pull requests, closed pull requests, and the number of months a repository has been on GitHub. We need to take care with the project creation date, since a repository can have a creation date much earlier than the first day on GitHub. For example, the developers created the git repository for 3D Slicer in 2002, but did not upload a copy of it to GitHub until 2020. Some GitHub data can be found using its GitHub Application Program Interface (API) via the following url: https://api.github.com/repos/[owner]/[repository] where [owner] and [repository] are replaced by the repo specific values. The number of months a repository has been on GitHub helps us understand the average change of metrics over time, like the average new stars per month.
The repository measures help us in many ways. Firstly, they help us get a fast and accurate project overview. For example, the number of commits over the last 12 months shows how active a project has been, and the number of stars and forks may reveal its popularity (used to assess RQRQ5:). Secondly, the results may affect our decisions regarding the grading scores for some software qualities. For example, if the percentage of comment lines is low, we double-check the understandability of the code; if the ratio of open versus closed pull requests is high, we pay more attention to maintainability.
As in Smith et al. (2016a), Virtual machines (VMs) were used to provide an optimal testing environment for each package. We used VMs because it is easier to start with a fresh environment, without having to worry about existing libraries and conflicts. Moreover, when the tests are complete the VM can be deleted, without any impact on the host operating system. The most significant advantage of using VMs is to level the playing field. Every software install starts from a clean slate, which removes “works-on-my-computer” errors. When filling in the measurement template, the grader notes the details for each VM, including hypervisor and operating system version.
When grading the software, we found 27 out of the 29 packages are compatible with two or three different OSes, such as Windows, macOS, and Linux, and 5 of them are browser-based, making them platform-independent. However, in the interest of time, we only performed the measurements for each project by installing it on one of the platforms. When it was an option, we selected Windows as the host OS.
3.4 Interview Methods
The repository-based measurements summarize the information we can collect from on-line resources. This information is incomplete because it doesn’t generally capture the development process, the developer pain points, the perceived threats to software quality, and the developers’ strategies to address these threats. Therefore, part of our methodology involves interviewing developers.
We based our interviews on a list of 20 questions, which can be found in Smith et al. (2021). Some questions are about the background of the software, the development teams, the interviewees, and how they organize their projects. We also ask about the developer’s understanding of the users. Some questions focus on the current and past difficulties, and the solutions the team has found, or plan to try. We also discuss documentation, both with respect to how it is currently done, and how it is perceived. A few questions are about specific software qualities, such as maintainability, understandability, usability, and reproducibility. The interviews are semi-structured based on the question list; we ask follow-up questions when necessary. The interview process presented here was approved by the McMaster University Research Ethics Board under the application number MREB#: 5219.
We sent interview requests to all 29 projects using contact information from projects websites, code repository, publications, and from biographic pages at the teams’ institutions. In the end nine developers from eight of the projects agreed to participate: 3D Slicer, INVESALIUS 3, dwv, BioImage Suite Web, ITK-SNAP, MRIcroGL, Weasis, and OHIF. We spent about 90 minutes for each interview. One participant was too busy to have an interview, so they wrote down their answers. In one case two developers from the same project agreed to be interviewed. We held the meetings on-line using either Zoom or Teams, which facilitated recording and automatic transcription. The full interview answers can be found in Dong (2021a).
4 Measurement Results
Table 2 shows the 29 software packages that we measured, along with summary data collected in the year 2020. We arrange the items in descending order of LOC. We found the initial release dates (Rlsd) for most projects and marked the two unknown dates with “?”. The date of the last update is the date of the latest update, at the time of measurement. We found funding information (Fnd) for only eight projects. For the Number Of Contributors (NOC) we considered anyone who made at least one accepted commit as a contributor. The NOC is not usually the same as the number of long-term project members, since many projects received change requests and code from the community. With respect to the OS, 25 packages work on all three OSs: Windows (W), macOS (M), and Linux (L). Although the usual approach to cross-platform compatibility was to work natively on multiple OSes, five projects achieved platform-independence via web applications. The full measurement data for all packages is available in Dong (2021b).
| Software | Rlsd | Updated | Fnd | NOC | LOC | OS | Web | ||
|---|---|---|---|---|---|---|---|---|---|
| W | M | L | |||||||
| ParaView (Ahrens et al., 2005) | 2002 | 2020-10 | ✓ | 100 | 886326 | ✓ | ✓ | ✓ | ✓ |
| Gwyddion (Nevcas and Klapetek, 2012) | 2004 | 2020-11 | 38 | 643427 | ✓ | ✓ | ✓ | ||
| Horos (horosproject.org, 2020) | ? | 2020-04 | 21 | 561617 | ✓ | ||||
| OsiriX Lite (SARL, 2019) | 2004 | 2019-11 | 9 | 544304 | ✓ | ||||
| 3D Slicer (Kikinis et al., 2014) | 1998 | 2020-08 | ✓ | 100 | 501451 | ✓ | ✓ | ✓ | |
| Drishti (Limaye, 2012) | 2012 | 2020-08 | 1 | 268168 | ✓ | ✓ | ✓ | ||
| Ginkgo CADx (Wollny, 2020) | 2010 | 2019-05 | 3 | 257144 | ✓ | ✓ | ✓ | ||
| GATE (Jan et al., 2004) | 2011 | 2020-10 | 45 | 207122 | ✓ | ✓ | |||
| 3DimViewer (TESCAN, 2020) | ? | 2020-03 | ✓ | 3 | 178065 | ✓ | ✓ | ||
| medInria (Fillard et al., 2012) | 2009 | 2020-11 | 21 | 148924 | ✓ | ✓ | ✓ | ||
| BioImage Suite Web (Papademetris et al., 2005) | 2018 | 2020-10 | ✓ | 13 | 139699 | ✓ | ✓ | ✓ | ✓ |
| Weasis (Roduit, 2021) | 2010 | 2020-08 | 8 | 123272 | ✓ | ✓ | ✓ | ||
| AMIDE (Loening, 2017) | 2006 | 2017-01 | 4 | 102827 | ✓ | ✓ | ✓ | ||
| XMedCon (Nolf et al., 2003) | 2000 | 2020-08 | 2 | 96767 | ✓ | ✓ | ✓ | ||
| ITK-SNAP (Yushkevich et al., 2006) | 2006 | 2020-06 | ✓ | 13 | 88530 | ✓ | ✓ | ✓ | |
| Papaya (Research Imaging Institute, 2019) | 2012 | 2019-05 | 9 | 71831 | ✓ | ✓ | ✓ | ||
| OHIF Viewer (Ziegler et al., 2020) | 2015 | 2020-10 | 76 | 63951 | ✓ | ✓ | ✓ | ✓ | |
| SMILI (Chandra et al., 2018) | 2014 | 2020-06 | 9 | 62626 | ✓ | ✓ | ✓ | ||
| INVESALIUS 3 (Amorim et al., 2015) | 2009 | 2020-09 | 10 | 48605 | ✓ | ✓ | ✓ | ||
| dwv (Martelli, 2021) | 2012 | 2020-09 | 22 | 47815 | ✓ | ✓ | ✓ | ✓ | |
| DICOM Viewer (Afsar, 2021) | 2018 | 2020-04 | ✓ | 5 | 30761 | ✓ | ✓ | ✓ | |
| MicroView (Innovations, 2020) | 2015 | 2020-08 | 2 | 27470 | ✓ | ✓ | ✓ | ||
| MatrixUser (Liu et al., 2016) | 2013 | 2018-07 | 1 | 23121 | ✓ | ✓ | ✓ | ||
| Slice:Drop (Haehn, 2013) | 2012 | 2020-04 | 3 | 19020 | ✓ | ✓ | ✓ | ✓ | |
| dicompyler (Panchal and Keyes, 2010) | 2009 | 2020-01 | 2 | 15941 | ✓ | ✓ | |||
| Fiji (Schindelin et al., 2012) | 2011 | 2020-08 | ✓ | 55 | 10833 | ✓ | ✓ | ✓ | |
| ImageJ (Rueden et al., 2017) | 1997 | 2020-08 | ✓ | 18 | 9681 | ✓ | ✓ | ✓ | |
| MRIcroGL (Lab, 2021) | 2015 | 2020-08 | 2 | 8493 | ✓ | ✓ | ✓ | ||
| DicomBrowser (Archie and Marcus, 2012) | 2012 | 2020-08 | 3 | 5505 | ✓ | ✓ | ✓ | ||
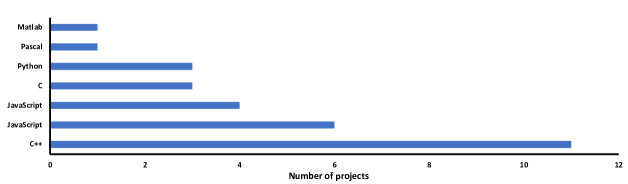
Figure 3 shows the primary languages versus the number of projects using them. The primary language is the language used for the majority of the project’s code; in most cases projects also use other languages. The most popular language is C++, with almost 40% of projects (11 of 29). The two least popular choices are Pascal and Matlab, with around 3% of projects each (1 of 29).
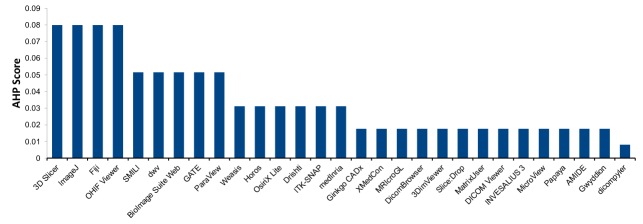
4.1 Installability
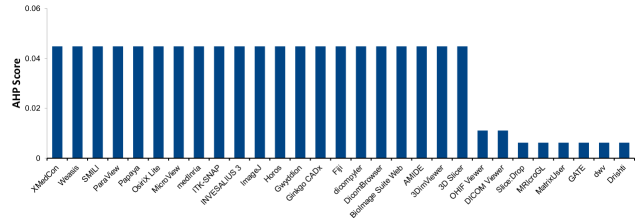
Figure 4 lists the installability scores. We found installation instructions for 16 projects. Among the ones without instructions, BioImage Suite Web and Slice:Drop do not need installation, since they are web applications. Installing 10 of the projects required extra dependencies. Five of them are web applications (as shown in Table 2) and depend on a browser; dwv, OHIF Viewer, and GATE needs extra dependencies to build; ImageJ and Fiji need an unzip tool; MatrixUser is based on Matlab; DICOM Viewer needs to work on a Nextcloud platform.
3D Slicer has the highest score because it had easy to follow installation instructions, and an automated, fast, frustration-free installation process. The installer added all dependencies automatically and no errors occurred during the installation and uninstallation steps. Many other software packages also had installation instructions and automated installers. We had no trouble installing the following packages: INVESALIUS 3, Gwyddion, XMedCon, and MicroView. We determined their scores based on the understandability of the instructions, installation steps, and user experience. Since BioImage Suite Web and Slice:Drop needed no installation, we gave them high scores. BioImage Suite Web also provided an option to download cache for offline usage, which was easy to apply.
GATE, dwv, and DICOM Viewer showed severe installation problems. We were not able to install them, even after a reasonable amount of time (2 hours). For dwv and GATE we failed to build from the source code, but we were able to proceed with measuring other qualities using a deployed on-line version for dwv, and a VM version for GATE. For DICOM Viewer we could not install the NextCloud dependency, and we did not have another option for running the software. Therefore, for DICOM Viewer we could not measure reliability or robustness. The other seven qualities could be measured, since they do not require installation.
MatrixUser has a lower score because it depends on Matlab. We assessed the score from the point of view of a user that would have to install Matlab and acquire a license. Of course, for users that already work within Matlab, the installability score should be higher.
4.2 Correctness & Verifiability
Figure 5 shows the scores of correctness and verifiability. Generally speaking, the packages with higher scores adopted more techniques to improve correctness, and had better documentation for us to verify against. For instance, we looked for evidence of unit testing, since it benefits most parts of the software’s life cycle, such as designing, coding, debugging, and optimization (Hamill, 2004). We only found evidence of unit testing for about half of the projects. We identified five projects using CI/CD tools: 3D Slicer, ImageJ, Fiji, dwv, and OHIF Viewer.
Even for some projects with well-organized documentation, requirements specifications and theory manuals were still missing. We could not identify theory manuals for all projects, and we did not find requirements specifications for most projects. The only requirements-related document we found was a road map of 3D Slicer, which contained design requirements for upcoming changes.
4.3 Surface Reliability
Figure 6 shows the AHP results. As shown in Section 4.1, most of the software products did not “break” during installation, or did not need installation; dwv and GATE broke in the building stage, and the processes were not recoverable; we could not install the dependency for DICOM Viewer. Of the seven software packages with a getting started tutorial and operation steps in the tutorial, most showed no error when we followed the steps. However, GATE could not open macro files and became unresponsive several times, without any descriptive error message. When assessing robustness (Section 4.4), we found that Drishti crashed when loading damaged image files, without showing any descriptive error message. We did not find any problems with the on-line version of dwv.
4.4 Surface Robustness
Figure 7 presents the scores for surface robustness. The packages with higher scores elegantly handled unexpected/unanticipated inputs, typically showing a clear error message. We may have underestimated the score of OHIF Viewer, since we needed further customization to load data.
Digital Imaging and Communications in Medicine (DICOM) “defines the formats for medical images that can be exchanged with the data and quality necessary for clinical use” (Association, 2021). According to their documentation, all 29 software packages should support the DICOM standard. To test robustness, we prepared two types of image files: correct and incorrect formats (with the incorrect format created by relabelled a text file to have the “.dcm” extension). All software packages loaded the correct format image, except for GATE, which failed for unknown reasons. For the broken format, MatrixUser, dwv, and Slice:Drop ignored the incorrect format of the file and loaded it regardless. They did not show any error message and displayed a blank image. MRIcroGL behaved similarly except that it showed a meaningless image. Drishti successfully detected the broken format of the file, but the software crashed as a result.
4.5 Surface Usability
Figure 8 shows the AHP scores for surface usability. The software with higher scores usually provided both comprehensive documented guidance and a good user experience. INVESALIUS 3 provided an excellent example of a detailed and precise user manual. GATE also provided numerous documents, but unfortunately we had difficulty understanding and using them. We found getting started tutorials for only 11 projects, but a user manual for 22 projects. MRIcroGL was the only project that explicitly documented expected user characteristics.
4.6 Maintainability
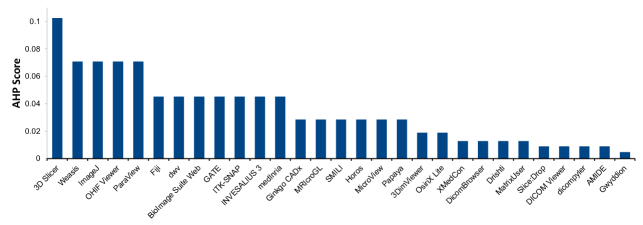
Figure 9 shows the ranking results for maintainability. We gave 3D Slicer the highest score because we found it to have the most comprehensive artifacts. For example, as far as we could find, only a few of the 29 projects had a product, developer’s manual, or API documentation, and only 3D Slicer, ImageJ, Fiji included all three documents. Moreover, 3D Slicer has a much higher percentage of closed issues (92%) compared to ImageJ (52%) and Fiji (64%). Table 3 shows which projects had these documents, in descending order of their maintainability scores.
| Software | Prod. Roadmap | Dev. Manual | API Doc. |
|---|---|---|---|
| 3D Slicer | ✓ | ✓ | ✓ |
| ImageJ | ✓ | ✓ | ✓ |
| Weasis | ✓ | ||
| OHIF Viewer | ✓ | ✓ | |
| Fiji | ✓ | ✓ | ✓ |
| ParaView | ✓ | ||
| SMILI | ✓ | ||
| medInria | ✓ | ||
| INVESALIUS 3 | ✓ | ||
| dwv | ✓ | ||
| BioImage Suite Web | ✓ | ||
| Gwyddion | ✓ | ✓ |
Twenty-seven of the 29 projects used git as the version control tool, with 24 of these using GitHub. AMIDE used Mercurial and Gwyddion used Subversion. XMedCon, AMIDE, and Gwyddion used SourceForge. DicomBrowser and 3DimViewer used BitBucket.
4.7 Reusability
Figure 10 shows the AHP results for reusability. As described in Section 3.3, we gave higher scores to the projects with API documentation. As shown in Table 3, seven projects had API documents. We also assumed that projects with more code files and less LOC per code file are more reusable. Table 4 shows the number of text-based files by project, which we used to approximate the number of code files. The table also lists the total number of lines (including comments and blanks), LOC, and average LOC per file. We arranged the items in descending order of their reusability scores.
| Software | Text Files | Total Lines | LOC | LOC/file |
|---|---|---|---|---|
| OHIF Viewer | 1162 | 86306 | 63951 | 55 |
| 3D Slicer | 3386 | 709143 | 501451 | 148 |
| Gwyddion | 2060 | 787966 | 643427 | 312 |
| ParaView | 5556 | 1276863 | 886326 | 160 |
| OsiriX Lite | 2270 | 873025 | 544304 | 240 |
| Horos | 2346 | 912496 | 561617 | 239 |
| medInria | 1678 | 214607 | 148924 | 89 |
| Weasis | 1027 | 156551 | 123272 | 120 |
| BioImage Suite Web | 931 | 203810 | 139699 | 150 |
| GATE | 1720 | 311703 | 207122 | 120 |
| Ginkgo CADx | 974 | 361207 | 257144 | 264 |
| SMILI | 275 | 90146 | 62626 | 228 |
| Fiji | 136 | 13764 | 10833 | 80 |
| Drishti | 757 | 345225 | 268168 | 354 |
| ITK-SNAP | 677 | 139880 | 88530 | 131 |
| 3DimViewer | 730 | 240627 | 178065 | 244 |
| DICOM Viewer | 302 | 34701 | 30761 | 102 |
| ImageJ | 40 | 10740 | 9681 | 242 |
| dwv | 188 | 71099 | 47815 | 254 |
| MatrixUser | 216 | 31336 | 23121 | 107 |
| INVESALIUS 3 | 156 | 59328 | 48605 | 312 |
| AMIDE | 183 | 139658 | 102827 | 562 |
| Papaya | 110 | 95594 | 71831 | 653 |
| MicroView | 137 | 36173 | 27470 | 201 |
| XMedCon | 202 | 129991 | 96767 | 479 |
| MRIcroGL | 97 | 50445 | 8493 | 88 |
| Slice:Drop | 77 | 25720 | 19020 | 247 |
| DicomBrowser | 54 | 7375 | 5505 | 102 |
| dicompyler | 48 | 19201 | 15941 | 332 |
4.8 Surface Understandability
Figure 11 shows the scores for surface understandability. All projects had a consistent coding style with parameters in the same order for all functions; modularized code; and, clear comments, indicating what is done, not how. However, we only found explicit identification of a coding standard for 3 out of the 29: 3D Slicer, Weasis, and ImageJ. We also found hard-coded constants (rather than symbolic constants) in medInria, dicompyler, MicroView, and Papaya. We did not find any reference to the algorithms used in projects XMedCon, DicomBrowser, 3DimViewer, BioImage Suite Web, Slice:Drop, MatrixUser, DICOM Viewer, dicompyler, and Papaya.
4.9 Visibility/Transparency
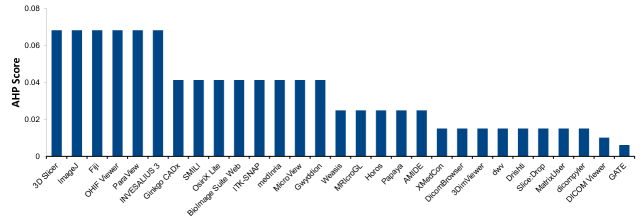
Figure 12 shows the AHP scores for visibility/transparency. Generally speaking, the teams that actively documented their development process and plans scored higher. Table 5 shows the projects that had documents for the development process, project status, development environment, and release notes, in descending order of their visibility/transparency scores.
| Software | Dev. Process | Proj. Status | Dev. Env. | Rls. Notes |
|---|---|---|---|---|
| 3D Slicer | ✓ | ✓ | ✓ | ✓ |
| ImageJ | ✓ | ✓ | ✓ | ✓ |
| Fiji | ✓ | ✓ | ✓ | |
| MRIcroGL | ✓ | |||
| Weasis | ✓ | ✓ | ||
| ParaView | ✓ | |||
| OHIF Viewer | ✓ | ✓ | ||
| DICOM Viewer | ✓ | ✓ | ||
| medInria | ✓ | ✓ | ||
| SMILI | ✓ | |||
| Drishti | ✓ | |||
| INVESALIUS 3 | ✓ | |||
| OsiriX Lite | ✓ | |||
| GATE | ✓ | |||
| MicroView | ✓ | |||
| MatrixUser | ✓ | |||
| BioImage Suite Web | ✓ | |||
| ITK-SNAP | ✓ | |||
| Horos | ✓ | |||
| dwv | ✓ | |||
| Gwyddion | ✓ |
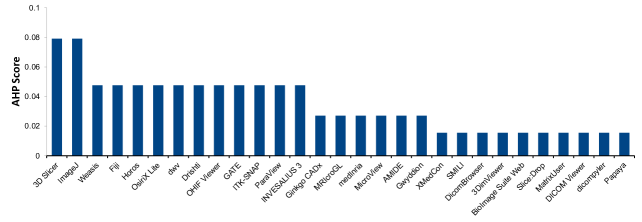
4.10 Overall Scores
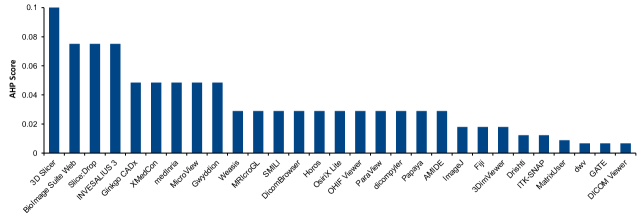
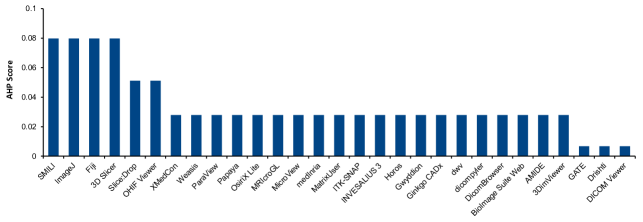
As described in Section 2.3, for our AHP measurements, we have nine criteria (qualities) and 29 alternatives (software packages). In the absence of a specific real world context, we assumed all nine qualities are equally important. Figure 13 shows the overall scores in descending order. Since we produced the scores from the AHP process, the total sum of the 29 scores is precisely 1.0.
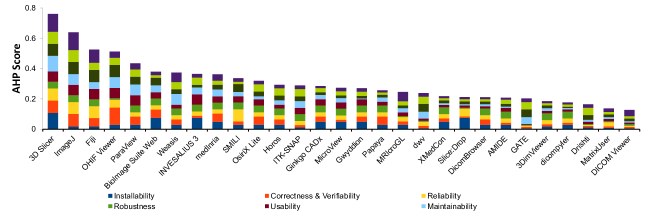
The top four software products 3D Slicer, ImageJ, Fiji, and OHIF Viewer have higher scores in most criteria. 3D Slicer has a score in the top two for all qualities; ImageJ ranks near the top for all qualities, except for correctness & verifiability. OHIF Viewer and Fiji have similar overall scores, with Fiji doing better in installability and OHIF Viewer doing better in correctness & verifiability. Given the installation problems, we may have underestimated the scores on reliability and robustness for DICOM Viewer, but we compared it equally for the other seven qualities.
5 Comparison to Community Ranking
To address RQRQ5: about how our ranking compares to the popularity of projects as judged by the scientific community, we make two comparisons:
-
•
A comparison of our ranking (from Section 4) with the community ratings on GitHub, as shown by GitHub stars, number of forks, and number of people watching the projects; and,
-
•
A comparison of top-rated software from our methodology with the top recommendations from our domain experts (as mentioned in Section 3.2).
Table 6 shows our ranking of the 29 MI projects, and their GitHub metrics, if applicable. As mentioned in Section 4.6, 24 projects used GitHub. Since GitHub repositories have different creation dates, we collect the number of months each stayed on GitHub, and calculate the average number of new stars, people watching, and forks per 12 months. Section 3.3 describes the method of getting the creation date. The items in Table 6 are listed in descending order of the average number of new stars per year. The non-GitHub items are listed in the order of our ranking. We collected all GitHub statistics in July 2021.
Generally speaking, most of the top-ranking MI software projects also received greater attention and popularity on GitHub. Between our ranking and the GitHub stars-per-year ranking, four of the top five software projects appear in both lists. Our top five packages are scattered among the first eight positions on the GitHub list. However, as discussed below there are discrepancies between the two lists.
In some cases projects are popular in the community, but were assigned a low rank by our methodology. This is the case for dwv. The reason for the low ranking is that, as mentioned in Section 4.1, we failed to build it locally, and used the test version on its websites for the measurements. We followed the instructions and tried to run the command “yarn run test” locally, which did not work. In addition, the test version did not detect a broken DICOM file and displayed a blank image as described in Section 4.4. We might underestimate the scores for dwv due to uncommon technical issues.
We also ranked DICOM Viewer much lower than its popularity. As mentioned in Section 4.1, it depended on the NextCloud platform that we could not successfully install. Thus, we might underestimate the scores of its surface reliability and surface robustness.
Further reason for discrepancies between our ranking and the community’s ranking is that we weighted all qualities equally. This is not likely how users implicitly rank the different qualities. As a result, some projects with high community popularity may have scored lower with our method because of a relatively higher (compared to the scientific community’s implicit ranking) weighting of the poor scores for some qualities. A further explanation for discrepancies between our measures and the star measures may also be due to inaccuracy with using stars to approximate popularity. Stars are not an ideal measure because stars represent the community’s feeling in the past more than they measure current preferences (Szulik, 2017). The issue with stars is that they tend only to be added, not removed. A final reason for inconsistencies between our ranking and the community’s ranking is that, as for consumer products, more factors influence popularity than just quality.
| Software | Comm. Rank | Our Rank | Stars/yr | Watches/yr | Forks/yr |
|---|---|---|---|---|---|
| 3D Slicer | 1 | 1 | 284 | 19 | 128 |
| OHIF Viewer | 2 | 4 | 277 | 19 | 224 |
| dwv | 3 | 19 | 124 | 12 | 51 |
| ImageJ | 4 | 2 | 84 | 9 | 30 |
| ParaView | 5 | 5 | 67 | 7 | 28 |
| Horos | 6 | 12 | 49 | 9 | 18 |
| Papaya | 7 | 17 | 45 | 5 | 20 |
| Fiji | 8 | 3 | 44 | 5 | 21 |
| DICOM Viewer | 9 | 29 | 43 | 6 | 9 |
| INVESALIUS 3 | 10 | 8 | 40 | 4 | 17 |
| Weasis | 11 | 7 | 36 | 5 | 19 |
| dicompyler | 12 | 26 | 35 | 5 | 14 |
| OsiriX Lite | 13 | 11 | 34 | 9 | 24 |
| MRIcroGL | 14 | 18 | 24 | 3 | 3 |
| GATE | 15 | 24 | 19 | 6 | 26 |
| Ginkgo CADx | 16 | 14 | 19 | 4 | 6 |
| BioImage Suite Web | 17 | 6 | 18 | 5 | 7 |
| Drishti | 18 | 27 | 16 | 4 | 4 |
| Slice:Drop | 19 | 21 | 10 | 2 | 5 |
| ITK-SNAP | 20 | 13 | 9 | 1 | 4 |
| medInria | 21 | 9 | 7 | 3 | 6 |
| SMILI | 22 | 10 | 3 | 1 | 2 |
| MatrixUser | 23 | 28 | 2 | 0 | 0 |
| MicroView | 24 | 15 | 1 | 1 | 1 |
| Gwyddion | 25 | 16 | n/a | n/a | n/a |
| XMedCon | 26 | 20 | n/a | n/a | n/a |
| DicomBrowser | 27 | 22 | n/a | n/a | n/a |
| AMIDE | 28 | 23 | n/a | n/a | n/a |
| 3DimViewer | 29 | 25 | n/a | n/a | n/a |
As shown in Section 3.2, our domain experts recommended a list of top software with 12 software products. All the top 4 entries from the Domain Expert’s list are among the top 12 ranked by our methodology. Three of the top four on both lists are the same: 3D Slicer, ImageJ, and Fiji. 3D Slicer is top project by both rankings (and by the GitHub stars measure as well). The Domain Expert ranked Horos as their second choice, while we ranked it twelfth. Our third ranked project, OHIF Viewer was not listed by the Domain Expert. Neither were the software packages that we ranked from fifth to eleventh (ParaView, Weasis, medInria, BioImage Suite Web, OsiriX Lite, INVESALIUS, and Gwyddion). The software mentioned by the Domain Expert that we did not rank were the six recommended packages that did not have visualization as the primary function (as discussed in Section 3.2). The differences between the list recommended by our methodology and the Domain Expert are not surprising. As mentioned above, our methodology weights all qualities equally, but that may not be the case for the Domain Expert’s impressions. Moreover, although the Domain Expert has significant experience with MI software, they have not used all 29 packages that were measured.
Although our ranking and the estimate of the community’s ranking are not perfect measures, they do suggest a correlation between best practices and popularity. We do not know which comes first, the use of best practices or popularity, but we do know that the top ranked packages tend to incorporate best practices. The next sections will explore how the practices of the MI community compare to the broader research software community. We will also investigate the practices from the top projects that others within the MI community, and within the broader research software community, can potentially adopt.
6 Comparison Between MI and Research Software for Artifacts
As part of filling in the measurement template (from Section 3.3), we summarized the artifacts observed in each MI package. Table 7 groups the artifacts by frequency into categories of common (20 to 29 (67%) packages), uncommon (10 to 19 (33-67%) packages), and rare (1 to 9 (33%) packages). Dong (2021b) summarizes the full measurements. Tables 3 and 5 show the details on which projects use which types of artifacts for documents related to maintainability and visibility, respectively.
| Common | Uncommon | Rare |
|---|---|---|
| README (29) | Build scripts (18) | Getting Started (9) |
| Version control (29) | Tutorials (18) | Developer’s manual (8) |
| License (28) | Installation guide (16) | Contributing (8) |
| Issue tracker (28) | Test cases (15) | API documentation (7) |
| User manual (22) | Authors (14) | Dependency list (7) |
| Release info. (22) | Frequently Asked Questions (FAQ) (14) | Troubleshooting guide (6) |
| Acknowledgements (12) | Product roadmap (5) | |
| Changelog (12) | Design documentation (5) | |
| Citation (11) | Code style guide (3) | |
| Code of conduct (1) | ||
| Requirements (1) |
We answer RQRQ7: by comparing the artifacts that we observed in MI repositories to those observed and recommended for research software in general. Our comparison may point out areas where some MI software packages fall short of current best practices. This is not intended to be a criticism of any existing packages, especially since in practice not every project needs to achieve the highest possible quality. However, rather than delve into the nuances of which software can justify compromising which practices we will write our comparison under the ideal assumption that every project has sufficient resources to match best practices.
Table 8 (based on data from (Smith and Michalski, 2022)) shows that MI artifacts generally match the recommendations found in nine current research software development guidelines:
-
•
United States Geological Survey Software Planning Checklist (USGS, 2019),
-
•
DLR (German Aerospace Centre) Software Engineering Guidelines (Schlauch et al., 2018),
-
•
Scottish Covid-19 Response Consortium Software Checklist (Brett et al., 2021),
-
•
Good Enough Practices in Scientific Computing (Wilson et al., 2016),
-
•
xSDK (Extreme-scale Scientific Software Development Kit) Community Package Policies (Smith et al., 2018a),
-
•
Trilinos Developers Guide (Heroux et al., 2008),
-
•
EURISE (European Research Infrastructure Software Engineers’) Network Technical Reference (Thiel, 2020),
-
•
CLARIAH (Common Lab Research Infrastructure for the Arts and Humanities) Guidelines for Software Quality (van Gompel et al., 2016), and
-
•
A Set of Common Software Quality Assurance Baseline Criteria for Research Projects (Orviz et al., 2017).
In Table 8 each row corresponds to an artifact. For a given row, a checkmark in one of the columns means that the corresponding guideline recommends this artifact. The last column shows whether the artifact appears in the measured set of MI software, either not at all (blank), commonly (C), uncommonly (U) or rarely (R). We did our best to interpret the meaning of each artifact consistently between guidelines and specific MI software, but the terminology and the contents of artifacts are not standardized. The challenge even exists for the ubiquitous README file. As illustrated by Prana et al. (2018), the content of README files shows significant variation between projects. Although some content is reasonably consistent, with 97% of README files contain at least one section describing the ‘What’ of the repository and 89% offering some ‘How’ content, other categories are more variable. For instance, information on ‘Contribution’, ‘Why’, and ‘Who’, appear in 28%, 26% and 53% of the analyzed files, respectively (Prana et al., 2018).
The frequency of checkmarks in Table 8 indicates the popularity of recommending a given artifact, but it does not imply that the most commonly recommended artifacts are the most important artifacts. Just because a guideline does not explicitly recommend an artifact, does not mean the guideline authors do not value that artifact. They may have excluded it because it is out of the scope of their recommendations, or outside their experience. For instance, an artifact related to uninstall is only explicitly mentioned by van Gompel et al. (2016), but other guideline authors would likely see its value. They may simply feel that uninstall is implied by install, or they may have never asked themselves whether they need separate uninstall instructions.
| USGS (2019) | Schlauch et al. (2018) | Brett et al. (2021) | Wilson et al. (2016) | Smith et al. (2018a) | Heroux et al. (2008) | Thiel (2020) | van Gompel et al. (2016) | Orviz et al. (2017) | MI | |
| LICENSE | ✓ | ✓ | ✓ | ✓ | ✓ | ✓ | ✓ | ✓ | C | |
| README | ✓ | ✓ | ✓ | ✓ | ✓ | ✓ | ✓ | C | ||
| CONTRIBUTING | ✓ | ✓ | ✓ | ✓ | ✓ | ✓ | ✓ | R | ||
| CITATION | ✓ | ✓ | ✓ | U | ||||||
| CHANGELOG | ✓ | ✓ | ✓ | ✓ | U | |||||
| INSTALL | ✓ | ✓ | ✓ | ✓ | U | |||||
| Uninstall | ✓ | |||||||||
| Dependency List | ✓ | ✓ | ✓ | R | ||||||
| Authors | ✓ | ✓ | ✓ | U | ||||||
| Code of Conduct | ✓ | R | ||||||||
| Acknowledgements | ✓ | ✓ | ✓ | U | ||||||
| Code Style Guide | ✓ | ✓ | ✓ | ✓ | R | |||||
| Release Info. | ✓ | ✓ | ✓ | C | ||||||
| Prod. Roadmap | ✓ | ✓ | ✓ | R | ||||||
| Getting started | ✓ | ✓ | ✓ | ✓ | R | |||||
| User manual | ✓ | ✓ | C | |||||||
| Tutorials | ✓ | U | ||||||||
| FAQ | ✓ | ✓ | ✓ | U | ||||||
| Issue Track | ✓ | ✓ | ✓ | ✓ | ✓ | ✓ | C | |||
| Version Control | ✓ | ✓ | ✓ | ✓ | ✓ | ✓ | ✓ | ✓ | C | |
| Build Scripts | ✓ | ✓ | ✓ | ✓ | ✓ | ✓ | U | |||
| Requirements | ✓ | ✓ | ✓ | R | ||||||
| Design Doc. | ✓ | ✓ | ✓ | ✓ | ✓ | ✓ | R | |||
| API Doc. | ✓ | ✓ | ✓ | ✓ | R | |||||
| Test Plan | ✓ | ✓ | ||||||||
| Test Cases | ✓ | ✓ | ✓ | ✓ | ✓ | ✓ | ✓ | ✓ | U |
Two of the items that appear in Table 7 do not appear in the software development guidelines shown in Table 8: Troubleshooting guide and Developer’s manual. Although the guidelines do not name these two artifacts, the information contained within them overlaps with the recommended artifacts. A Troubleshooting guideline contains information that would typically be found in a User manual. A Developer’s guide overlaps with information from the README, INSTALL, Uninstall, Dependency List, Release Information, API documentation and Design documentation. In our current analysis, we have identified artifacts by the names given by the software guidelines and MI examples. In the future, a more in-depth analysis would look at the knowledge fragments that are captured in the artifacts, rather than focusing on the names of the files that collect these fragments together.
Although the MI community shows examples of 88% (23 of 26) of the practices we found in research software guidelines (Table 8), we did not observe three recommended artifacts: i) Uninstall, ii) Test plans, and iii) Requirements. Uninstall is likely an omission caused by the focus on installing software. Given the storage capacity of current hardware, developers and users are not generally concerned with uninstall. Moreover, as mentioned above, uninstall is not particularly emphasized in existing recommendations.
Test plans describe the scope, approach, resources, and the schedule of planned test activities (van Vliet, 2000). The plan should cover details such as the makeup of the testing team, automated testing tools and technology to employ, the testing process, system tests, integration tests and unit tests. We did not observe test plans for MI software, but that doesn’t mean plans weren’t created; it means that the plans are not under version control. Test plans would have to at least be implicitly created, since we observed test cases with reasonable frequency for MI software (test cases are categorized as uncommon).
The other apparently neglected document is the requirements specification, which records the functionalities, expected performance, goals, context, design constraints, external interfaces and other quality attributes of the software (IEEE, 1998). If developers write requirements they typically are based on a template, which provide documentation structure, guidelines, and rules. Although there is no universally accepted template, examples include ESA (1991), IEEE (1998), NASA (1989), and Robertson and Robertson (1999).
MI software is like other research software in its neglect of requirements documentation. Although requirements documentation is recommended by some (Schlauch et al., 2018; Heroux et al., 2008; Smith and Koothoor, 2016), in practice research software developers often do not produce a proper requirements specification (Heaton and Carver, 2015). Sanders and Kelly (2008) interviewed 16 scientists from 10 disciplines and found that none of the scientists created requirements specifications, unless regulations in their field mandated such a document. Nguyen-Hoan et al. (2010) showed requirements are the least commonly produced type of documentation for research software in general. When looking at the pain points for research software developers, Wiese et al. (2019) found that software requirements and management is the software engineering discipline that most hurts scientific developers, accounting for 23% of the technical problems reported by study participants. The lack of support for requirements is likely due to the perception that up-front requirements are impossible for research software (Carver et al., 2007; Segal and Morris, 2008), but if we drop the insistence on “up-front” requirements, allowing instead for the requirements to be written iteratively and incrementally, requirements are feasible (Smith, 2016). Smith et al. (2007) provides a requirements template tailored to research software.
Table 8 shows several recommended artifacts that are rarely observed in practice. A theme among these rare artifacts is that, except for the user-focused getting started manual, they are developer-focused. The dependency list, which is a list of software library dependencies, was rarely observed, but this information is still likely present, just embedded in build scripts. The other developer-focused and rare artifacts are as follows:
-
•
A Contributing file provides new contributors with the information that they need to start adding/modifying the repository’s files. Abdalla (2016) provides a simple template for creating an open-source contributor guideline.
-
•
A Developer Code of Conduct explicitly states the expectations for developers on how they should treat one another (Tourani et al., 2017). The code outlines rules for communication and establishes enforcement mechanisms for violations. As Tourani et al. (2017) states, the developer code documents the spirit of a community so that anyone can comfortably contribute regardless of ethnicity, gender, or sexual orientation. Three popular codes of conduct are (Tourani et al., 2017): Contributor Covenant, Ubuntu Code of Conduct, and Django Code of Conduct. A code of conduct can improve inclusivity, which brings the benefit of a wider pool of contributors. For example, a code of conduct can improve the participation of women (Singh et al., 2021). A standard of ethical behaviour can be captured in the code, for projects that are looking to abide by a code of ethics, such as the IEEE Code of Ethics (IEEE-CS/ACM and Practices, 1999), or the Professional Engineers of Ontario code of ethics (Professional Engineers Act, 2021, p. 23–24).
-
•
Code Style Guidelines present standards for writing code. Style guides codify such elements as formatting, commenting, naming identifiers, best practices and dangers to avoid (Carty, 2020). For instance, most coding style guides will specify using ALLCAPS when naming symbolic constants. Understandability improves under standardization, since developers spend more time on the content of the code, and less time distracted by its style. Three sample style guides are: Google Java Style Guide, PEP8 Style Guide for Python, and Google C++Style Guide. Linting tools, like flake8 for Python, can be used to enforced coding styles, like the PEP8 standard.
-
•
A Product Roadmap explains the vision and direction for a product offering (Münch et al., 2019). Although they have different forms, all roadmaps cover the following: i) Where are we now?, ii) Where are we going?, and iii) How can we get there? (Phaal et al., 2005). As stated by Pichler (2012), a product roadmap provides the following benefits: continuity of purpose, facilitation of collaboration, and assistance with prioritization. Creating a roadmap involves the following steps: i) define and outline a strategic mission and product vision, ii) scan the environment, iii) revise and distill the product vision to write the product roadmap, and iv) estimate the product life cycle and evaluate the mix of planned development efforts (Vähäniitty et al., 2002).
-
•
Design Documentation explicitly states the design goals and priorities, records the likely changes, decomposes the complex system into separate modules, and specifies the relationship between the modules. Design documentation shows the syntax of the interface for the modules, and in some cases also documents the semantics. Some potential elements of design documentation include the following:
-
–
Representation of the system design and class design using Unified Modelling Language class diagrams. This approach is suited to object-oriented design and designs that use patterns (Gamma et al., 1995).
-
–
Rigorous documentation of the system design following the template for a Module Guide (MG) (Parnas et al., 1984). An MG organizes the modules in a hierarchy by their secrets.
-
–
An explanation of the design using data flow diagrams to show typical use cases for input transformation.
-
–
A table or graph showing the traceability between the requirements and the modules (or classes)
-
–
The syntax of the modules (or classes) by providing lists of the state variables, exported constants and all exported access programs for each module (or class). This shows the interface that can used to access each module’s services.
-
–
A formal specification of the semantics of input/output relationships and state transitions for each module using a Module Interface Specification (MIS) (Hoffman and Strooper, 1995). An MIS is an abstract model that formally shows each module’s access programs and the associated transitions and outputs based on their state, environment, and input variables. ElSheikh et al. (2004); Smith and Yu (2009) show the example of an MIS for a mesh generator.
-
–
-
•
API Documentation shows developers the services or data provided by the software application (or library) through such resources as its methods or objects (Meng et al., 2018). Understandability is improved by API documentation (Meng et al., 2018). API documentation can be generated using tools like Doxygen, pydoc, and javadoc.
The rare artifacts for MI software are similar to the rare artifacts for Lattice Boltzmann solvers (Michalski, 2021), except LBM software is more likely to have developer related artifacts, like Contributing, Dependency list, and Design documentation.
To improve MI software in the future, an increased use of checklists could help. Developers can use checklists to ensure they follow best practices. Some examples include checklists merging branches into master (Brown, 2015), checklists for saving and sharing changes to the project (Wilson et al., 2016), checklists for new and departing team members (Heroux and Bernholdt, 2018), checklists for processes related to commits and releases (Heroux et al., 2008) and checklists for overall software quality (Thiel, 2020; Institute, 2022). For instance, for Lattice Boltzmann solver software, ESPResSo has a checklist for managing releases (Michalski, 2021).
The above discussion shows that, taken together, MI projects fall somewhat short of recommended best practices for research software. However, MI software is not alone in this. Many, if not most, research projects fall short of best practices. A gap exists in research software development practices and software engineering recommendations (Storer, 2017; Kelly, 2007; Owojaiye et al., 2021). Johanson and Hasselbring (2018) observe that the state-of-the-practice for research software in industry and academia does not incorporate state-of-the-art SE tools and methods. This causes sustainability and reliability problems (Faulk et al., 2009). Rather than benefit from capturing and reusing previous knowledge, projects waste time and energy “reinventing the wheel” (de Souza et al., 2019).
7 Comparison of Tool Usage Between MI and Other Research Software
Developers use software tools to support the development, verification, maintenance, and evolution of software, software processes, and artifacts (Ghezzi et al., 2003, p. 501). MI software uses tools for CI/CD, user support, version control, documentation, and project management. To answer RQRQ9: we summarize the tool usage in these categories, and compare this to the usage by the research software community.
Table 9 summarizes the user support models by the number of projects using each model (projects may use more than one support model). We do not know whether the prevalent use of GitHub issues for user support is by design, or whether this just naturally happens as users seek help. The common use of GitHub by MI developers is not surprising, given that GitHub is the largest code host in the world, with over 128 million public repositories and over 23 million users (as of roughly February 26, 2020) (Kashyap, 2020).
| User Support Model | Num. Projects |
|---|---|
| GitHub issue | 24 |
| Frequently Asked Questions (FAQ) | 12 |
| Forum | 10 |
| E-mail address | 9 |
| GitLab issue, SourceForge discussions | 2 |
| Troubleshooting | 2 |
| Contact form | 1 |
From Section 4.6, 27 of the 29 projects used git as the version control tool, one used Mercurial and one used Subversion. The hosting is on GitHub for 24 packages, SourceForge for three and BitBucket for two. Although teams may have a process for accepting new contributions, no one discussed this during their interviews. However, most teams (eight of nine) mentioned using GitHub and pull requests to manage contributions from the community. The interviewees generally gave very positive feedback on using GitHub. Some teams previously used a different approach to version control and eventually transferred to git and GitHub. The past approaches included contributions from e-mail (three teams), contributions from forums (one team) and e-mailing the git repository back and forth between developers (one team).
The common use of version control for MI software illustrates considerable improvement from the poor adoption of version control tools that Wilson lamented in 2006 (Wilson, 2006). The proliferation of version control tools for MI matches the increase in the broader research software community. A little over 10 years ago Nguyen-Hoan et al. (2010) estimated that only 50% of research software projects use version control, but even at that time Nguyen-Hoan et al. (2010) noted an increase from previous usage levels. A survey in 2018 shows 81% of developers use a version control system (AlNoamany and Borghi, 2018). Smith (2018) has similar results, showing version control usage for alive projects in mesh generation, geographic information systems and statistical software for psychiatry increasing from 75%, 89% and 17% (respectively) to 100%, 95% and 100% (respectively) over a four-year period ending in 2018. (For completeness the same study showed a small decrease in version control usage for seismology software over the same time period, from 41% down to 36%). A recent survey by Carver et al. (2022) shows version control use among practitioners at over 95%, with 83/87 survey respondents indicating that they use it. All but one of the software guides cited in Section 6 includes the advice to use version control. (The USGS guide (USGS, 2019) was the only set of recommendations to not mention version control.) The high usage of version control tools in MI software matches the trend in research software in general.
As mentioned in Section 4.2, we identified five projects using CI/CD tools (about 17% of the assessed projects). We found which projects used CI/CD by examining the documentation and source code of all projects. The count of CI/CD usage may actually be higher, since traces of CI/CD usage may not always appear in a repository. This was the case for a study of LBM software, where interviews with developers showed that more projects used CI/CD than was evident from repository artifacts alone (Michalski, 2021). The 17% utilization for MI software contrasts with the high frequency with which research software development guidelines recommend continuous integration (Brett et al., 2021; Brown, 2015; Thiel, 2020; Zadka, 2018; van Gompel et al., 2016). Although there is currently little data available on CI/CD utilization for research software, our impression is that CI/CD is not yet common practice, despite its recommendation. This is certainly the case for LBM software, where usage numbers are similar to MI software, with only 12.5% of 24 LBM packages showing evidence of CI/CD in their repositories (Michalski, 2021). The survey of Carver et al. (2022) suggests higher use of CI/CD with 54% (54/100) of respondents indicating that they use it. However, that survey measures something different from the current one by surveying practitioners, rather than assessing projects. Additional information on CI/CD is given in the recommendations (Section 10.1).
For documentation tools and methods mentioned by the interviewees, the most popular (mentioned by about 30% of developers) were forum discussions and videos. The second most popular options (mentioned by about 20% of developers) were GitHub, wiki pages, workshops, and social media. The least frequently mentioned options (about 10% of developers) included writing books, and google forms. In contrasting MI software with LBM software, the most significant documentation tool difference is that LBM software often uses document generation tools, like doxygen and sphinx (Michalski, 2021), while MI does not appear to use these tools.
Some interviewees mentioned the project management tools they used. Generally speaking, the interviewees talked about two types of tools: i) trackers, including GitHub, issue trackers, bug trackers and Jira; and, ii) documentation tools, including GitHub, Wiki page, Google Doc, and Confluence. Of the specifically named tools in the above lists, interviewees mentioned GitHub 3 times, and each of the other tools once each.
Based on information provided by Jung et al. (2022), tool utilization for MI software has much in common with tool utilization for ocean modelling software. Both use tools for editing, compiling, code management, testing, building, and project management. From the data available, ocean modelling differs from MI software in its use of Kanban boards for project management.
8 Comparison of Principles, Process, and Methodologies to Research Software in General
We answer research question RQRQ11: by comparing the principles, processes, and methodologies used for MI software to what can be gleaned from the literature on research software in general. In our interviews with developers the responses about development model were vague, with only two interviewees following a definite development model. In some cases the interviewees felt their process was similar to an existing development model. Three teams (about 38%) either followed agile, or something similar to agile. Two teams (25%) either followed a waterfall process, or something similar. Three teams (about 38%) explicitly stated that their process was undefined or self-directed.
Our observations of an informally defined process, with elements of agile methods, matches what has been observed for research software in general. Scientific developers naturally use an agile philosophy (Ackroyd et al., 2008; Carver et al., 2007; Easterbrook and Johns, 2009; Segal, 2005; Heaton and Carver, 2015), or an amethododical process (Kelly, 2013), or a knowledge acquisition driven process (Kelly, 2015). A waterfall-like process can work for research software (Smith, 2016), especially if the developers work iteratively and incrementally, but externally document their work as if they followed a rationale design process (Parnas and Clements, 1986).
No interviewee introduced any strictly defined project management process. The most common approach was following the issues, such as bugs and feature requests. Additionally, the 3D Slicer team had weekly meetings to discuss the goals for the project; the INVESALIUS 3 team relied on the GitHub process for their project management; the ITK-SNAP team had a fixed six-month release pace; only the interviewee from the OHIF team mentioned that the team has a project manager; the 3D Slicer team and BioImage Suite Web team do nightly builds and tests. The OHIF developer believes that a better project management process can improve junior developer efficiency while also improving internal and external communication.
We identified the use of unit testing in less than half of the 29 projects. On the other hand, the interviewees believed that testing (including usability tests with users) was the top solution to improve correctness, usability, and reproducibility. This level of testing matches what was observed for LBM software (Michalski, 2021) and is apparently greater than the level of testing for ocean modelling software. Jung et al. (2022) reports that ocean modellers underemphasize testing.
As the observed artifacts in Table 7 show, none of the 29 projects emphasize documentation. None of them had theory manuals, although we did identify a road map in the 3D Slicer project. We did not find requirements specifications. Table 10 summarizes interviewees’ opinions on documentation. Interviewees from each of the eight projects thought that documentation was essential to their projects, and most of them said that it could save their time to answer questions from users and developers. Most of them saw the need to improve their documentation, and only three of them thought that their documentations conveyed information clearly enough. Nearly half of developers also believed that the lack of time prevented them from improving documentation.
| Opinion on Documentation | Num. Ans. |
|---|---|
| Documentation is vital to the project | 8 |
| Documentation of the project needs improvements | 7 |
| Referring to documentation saves time to answer questions | 6 |
| Lack of time to maintain good documentation | 4 |
| Documentation of the project conveys information clearly | 3 |
| Coding is more fun than documentation | 2 |
| Users help each other by referring to documentation | 1 |
As Table 8 suggests, an emphasis on documentation, especially for new developers, is echoed in research software guidelines. Multiple guidelines recommend a document explaining how to contribute to a project, often named CONTRIBUTING. Guidelines also recommend tutorials, user guides and quick start examples. Smith et al. (2018a) suggests including instructions specifically for on-boarding new developers. For open-source software in general (not just research software), Fogel (2005) recommends providing tutorial style examples, developer guidelines, demos, and screenshots.
9 Developer Pain Points
Based on interviews with nine developers (described in Section 3.4), we answer three research questions (first mentioned in Section 1.1): RQRQ13:) What are the pain points for developers working on research software projects?; RQRQ15:) How do the pain points of developers from MI compare to the pain points for research software in general?; and RQRQ17:) For MI developers what specific best practices are taken to address the pain points and software quality concerns?
Our interviews identified pain points related to a lack of time and funding, technology hurdles, improving correctness, and improving usability. In this section, we go through each pain point and contrast the MI experience with observations from other domains. We also cover potential ways to address the pain points, as promoted by the community. (Later, in Section 10, we propose additional pain mitigation strategies based on our experience.) In addition to pain points, we summarize MI developer strategies for improving maintainability and reproducibility. Although the interviewees did not explicitly identify these two qualities as pain points, we did discuss threats to these qualities and ways to improve them as part of our interview process (Smith et al., 2021). The interviewee’s practices for addressing pain points and improving quality can potentially be emulated by other MI developers. Moreover, these practices may provide examples that can be followed by other research software domains.
Pinto et al. (2018) lists some pain points that did not come up in our conversations with MI developers: interruptions while coding, scope bloat, lack of user feedback, hard to collaborate on software projects, and aloneness. Wiese et al. (2019) also mention two research software pain points that did not explicitly arise in our interviews: reproducibility, and software scope determination. To the list of pain points not discussed for MI, our study of LBM software (Smith et al., 2024) adds lack of software experience for the developers, technical debt, and documentation. We did not observe any pain points for MI that were not also observed for LBM. From the pain points mentioned above, although the topics of reproducibility and technical debt did not come up in our MI interviews, we covered these two topics as part of the discussion of software qualities, as summarized at the end of this section. Although previous studies show pain points that were not mentioned by MI developers, we cannot conclude that these pain points are not relevant for MI software development, since we only interviewed nine developers for about an hour each.
-
P1:
Lack of Development Time: Many interviewees thought lack of time, along with lack of funding (discussed next), were their most significant obstacles. Other domains of research software also experience the lack of time pain point (Pinto et al., 2018, 2016; Wiese et al., 2019). Our study of LBM software (Smith et al., 2024) also highlighted lack of time as a significant pain point.
Potential and proven solutions suggested by the interviewees include:
-
•
Shifting from development to maintenance when the team does not have enough developers for building new features and fixing bugs at the same time;
-
•
Improving documentation to save time answering users’ and developers’ questions;
-
•
Supporting third-party plugins and extensions; and,
-
•
Using GitHub Actions for CI/CD (Continuous Integration and Continuous Delivery.)
-
•
-
P3:
Lack of Funding: Developers felt the pain of having to attract funding to develop and maintain their software. For instance, the interviewees from 3D Slicer and OHIF said getting funding for software maintenance is more challenging than finding funding for research. The interviewee from ITK-SNAP thought more funding was a way to solve the lack of time problem, because they could hire more dedicated developers. On the other hand, the interviewee from Weasis did not feel that funding could solve the same problem, since they would still need time to supervise the project.
Funding challenges have also been noted by others (Gewaltig and Cannon, 2012; Goble, 2014; Katerbow and Feulner, 2018; Smith et al., 2024). Researchers that devote time to software have the additional challenge that funding agencies do not always count software when they are judging the academic excellence of the applicant. Wiese et al. (2019) reported developer pains related to publicity, since publishing norms have historically made it difficult to get credit for creating software. As studied by Howison and Bullard (2016), research software (specifically biology software, but the trend likely applies to other research software domains) is infrequently cited. Pinto et al. (2018) also mentions the lack of formal reward system for research software.
An interviewee proposed an idea for increasing funding: Licensing the software to commercial companies to integrate it into their products.
-
P5:
Technology Hurdles: The technology hurdles mentioned by MI developers include: hard to keep up with changes in OS and libraries, difficult to transfer to new technologies, hard to support multiple OSes, and hard to support lower-end computers. Developers expressed difficulty balancing between four factors: cross-platform compatibility, convenience to development and maintenance, performance, and security.
The pain point survey of Wiese et al. (2019) highlights that technology hurdles are an issue for research software in general. Some technical-related problems mentioned by Wiese et al. (2019) include dependency management, cross-platform compatibility (also mentioned by Pinto et al. (2018)), CI, hardware issues and operating system issues. From (Smith et al., 2024) technology pain points for LBM developers include setting up parallelization and CI.
The solutions proposed by the MI developers include the following:
-
•
Adopting a web-based approach with backend servers, to better support lower-end computers;
-
•
Using memory-mapped files to consume less computer memory, to better support lower-end computers;
-
•
Using computing power from the computers GPU for web applications;
-
•
Maintaining better documentations to ease the development and maintenance processes;
-
•
Improving performance via more powerful computers, which one interviewee pointed out has already happened.
As the above list shows, developers perceive that web-based applications will address the technology hurdle. Table 11 shows the teams’ choices between native application and web application. Most of the 29 teams (24 of 29, or 83%) chose to develop native applications. For the eight teams we interviewed, three of them were building web applications, and the MRIcroGL team was considering a web-based solution.
Software Team Native Application Web Application 3D Slicer ✓ INVESALIUS 3 ✓ dwv ✓ BioImage Suite Web ✓ ITK-SNAP ✓ MRIcroGL ✓ Weasis ✓ OHIF ✓ Total number among the eight teams 5 3 Total number among the 29 teams 24 5 Table 11: Teams’ choices between native application and web application The advantage for native applications is higher performance, while web applications have the advantage of cross-platform compatibility and a simpler build process. These web advantages mirror the native disadvantages of difficulty with cross-platform compatibility and a complex build process. The lower performance disadvantage of web applications can be improved with a server backend, but in this case there are disadvantages for privacy protection and server costs. These issues are discussed further in the recommendations (Section 10.2).
-
•
-
P7:
Ensuring Correctness: Interviewees identified multiple threats to correctness. The most frequently mentioned threat was complexity. Complexity enters the software by various means, including the large variety of data formats, complicated data standards, differing outputs between medical imaging machines, and the addition of (non-viewing related) functionality. Other threats to correctness identified include the following:
-
•
Lack of real world image data for testing, in part because of patient privacy concerns (Wiese et al. (2019) mentions that the pain point of privacy concerns also arises for research software in general);
-
•
Tests are expensive and time-consuming because of the need for huge datasets;
-
•
Software releases are difficult to manage;
-
•
No systematic unit testing; and,
-
•
No dedicated quality assurance team.
As implied by the above threats to correctness, testing was the most often mentioned strategy for MI developers for ensuring correctness. Seven teams mentioned test related activities, including test-driven development, component tests, integration tests, smoke tests, regression tests, self tests and automated tests. With the common emphasis on testing to improve correctness, MI software is ahead of some other scientific domains. For scientific software in general Pinto et al. (2018) mention the problem of insufficient testing and Hannay et al. (2009b) show that more developers think testing is important than the number that believe they have a sufficient understanding of testing concepts. Our study of LBM software suggests that this domain shares the challenges of insufficient testing and insufficient understanding of testing concepts (Smith et al., 2024). Automated testing is a specific challenge for LBM software since free testing services do not offer adequate facilities for large amounts of data (Smith et al., 2024). Although not specifically mentioned during our interviews, the large data sets for MI likely also cause a challenge for using free testing services, like GitHub Actions.
Research software in general often struggles with the oracle problem for testing because for many potential test cases the developer doesn’t have a means to judge the correctness of their calculated solutions (Hannay et al., 2009b; Kanewala and Bieman, 2013; Kelly et al., 2011; Wiese et al., 2019). The MI developers did not allude to this challenge, likely because for a give image (test case) it is possible to determine, potentially by using other software, the expected analysis results.
A frequently cited strategy for building confidence in correctness (mentioned by 3 interviewees) is a two state development process with stable releases and nightly builds. Other strategies for ensuring correctness that came up during the interviews include CI/CD, using de-identified copies of medical images for debugging, sending beta versions to medical workers who can access the data to do the tests, and collecting/maintaining a dataset of problematic images. Some additional strategies used by MI developers include:
-
•
Using open datasets.
-
•
If (part of) the team belongs to a medical school or a hospital, using the datasets they can access;
-
•
If the team has access to MRI scanners, self-building sample images for testing;
-
•
If the team has connections with MI equipment manufacturers, asking for their help on data format problems;
The feedback from the interviewees makes it clear that increased connections between the development team and medical professionals/institutions could ease the pain of ensuring correctness via testing.
-
•
-
P9:
Usability:
The discussion with the developers focused on usability issues for two classes of users: the end users and other developers. The threats to usability for end users include an unintuitive user interface, inadequate feedback from the interface (such as lack of a progress bar), users being unable to determine the purpose of the software, not all users knowing if the software includes certain features, not all users understanding how to use the command line tool, and not all users understanding that the software is a web application. For developers the threats to usability include not being able to find clear instructions on how to deploy the software, and the architecture being difficult for new developers to understand.
At least to some extent the problems for MI software users are due to holes in their background knowledge. The survey of Wiese et al. (2019) for research software in general also mentioned that users do not always have the expertise required to install or use the software. Smith et al. (2024) observes a similar pattern for LBM software, with several LBM developers noting that users sometimes try to use incorrect method combinations. Furthermore, some LBM users think that the packages will work out of the box to solve their cases, while in reality computational fluid dynamics knowledge needs to be applied to correctly modify the packages for a new endeavour.
To improve the usability of MI software, the most common strategies mentioned by developers are as follows:
-
•
Use documentation (user manuals, mailing lists, forums) (mentioned by 4 developers)
-
•
Usability tests and interviews with end users; and, (mentioned by 3 developers)
-
•
Adjusting the software according to user feedback. (mentioned by 3 developers)
Other suggested and practiced strategies include a graphical user interface, testing every release with active users, making simple things simple and complicated things possible, focusing on limited number of functions, icons with clear visual expressions, designing the software to be intuitive, having a UX (User eXperience) designer, dialog windows for important notifications, providing an example for users to follow, downsampling images to consume less memory, and providing an option to load only part of the data to boost performance. The last two points recognize that an important component of usability is performance, since poor performance frustrates users.
-
•
Up to this point, we have covered the pain points that came up in interviews with MI developers, along with a summary of the techniques that are currently used to address these pain points. Although the developers did not explicitly identify the qualities of maintainability and reproducibility as pain points in our interviews, as part of our interview questions (Section 3.4) they did share their approaches for improving these qualities, as discussed below.
-
Q1:
Maintainability: Nguyen-Hoan et al. (2010) rate maintainability as the third most important software quality for research software in general. The push for sustainable software (de Souza et al., 2019) is motivated by the pain that past developers have had with accumulating too much technical debt (Kruchten et al., 2012). For LBM software, Smith et al. (2024) identifies technical debt as one of the developer pain points.
To improve maintainability, the most popular (with five out of nine interviewees mentioning it) strategy is to use a modular approach, with often repeated functions in a library. Other strategies that were mentioned for improving maintainability include supporting third-party extensions, an easy-to-understand architecture, a dedicated architect, starting from simple solutions, and documentation. The 3D Slicer team used a well-defined structure for the software, which they named as an “event-driven MVC pattern”. Moreover, 3D Slicer discovers and loads necessary modules at runtime, according to the configuration and installed extensions. The BioImage Suite Web team had designed and re-designed their software multiple times in the last 10+ years. They found that their modular approach effectively supports maintainability (Joshi et al., 2011).
-
Q3:
Reproducibility: Although the MI developers did not mention reproducibility explicitly as a pain point, they did mention the need to improve documentation. Good documentation does not just address the pain points of lack of developer time (PP1:), technology hurdles (PP5:), usability PP9:, and maintainability. Documentation is also necessary for reproducibility. The challenges of inadequate documentation are a known problem for research software (Pinto et al., 2018; Wiese et al., 2019) and for non-research software (Lethbridge et al., 2003).
In our interviews, we discussed threats to reproducibility and strategies for improving it. The threats that were mentioned include closed-source software, no user interaction tests, no unit tests, the need to change versions of some common libraries, variability between CPUs, and misinterpretation of how manufacturers create medical images.
The most commonly cited (by 6 teams) strategy to improve reproducibility was testing (regression tests, unit tests, having good tests). The second most common strategy (mentioned by 5 teams) is making code, data, and documentation available, possibly by creating open-source libraries. Other ideas that were mentioned include running the same tests on all platforms, a dockerized version of the software to insulate it from the OS environment, using standard libraries, monitoring the upgrades of the library dependencies, clearly documenting the version information, bringing along the exact versions of all the dependencies with the software, providing checksums of the data, and benchmarking the software against other software that overlaps in functionality. Specifically one interviewee suggested using 3D Slicer as the benchmark to test their reproducibility.
10 Recommendations
In this section we provide recommendations to address the pain points from Section 9 to answer RQRQ19:. Our recommendations are not lists of criticisms for what should have been done in the past, or what should be done now; they are suggestions for consideration in the future. We expand on some of the ideas that came out of our interviews with developers (Section 9), including continuous integration, moving to web applications, and enriching the test data sets. We also bring in new ideas from our experience like employing linters, peer review, design for change and assurance cases. Our aim is to mention ideas that are at least somewhat beyond conventional best practices. The ideas listed here have the potential to become best practices in the medium to long-term. We list the ideas roughly in the order of increasing implementation effort.
10.1 Use Continuous Integration
Continuous integration involves frequent pushes to a code repository. With every push the software is built and tested (Humble and Farley, 2010, p. 13), (Shahin et al., 2017; Fowler, 2006). CI can take significant time and effort to set up and integrate into a team’s workflow, but the benefits are significant, as follows:
-
•
Elimination of headaches associated with a separate integration phase (Fowler, 2006), (Humble and Farley, 2010, p. 20). If developers postpone integration, integration problems are inevitable. Continuous integration means that problems are immediately obvious and the source of the problem can be isolated to the small increment that was just committed.
-
•
Detection and removal of bugs (Fowler, 2006) via automated testing. To improve productivity, defects are best discovered and fixed at the point where they are introduced (Humble and Farley, 2010, p. 23). Code is not the only source of errors; they are also found in the files and scripts related to configuration management (Humble and Farley, 2010, p. 18).
-
•
Everyone is always working on a stable base, since the rejection of inadequate commits means that the main branch will always be working. A stable base will always pass all tests. If the CI system uses generators and linters, it will also have current documentation and standard compliant code. A stable base improves developer productivity, allowing them to focus on coding, testing, and documentation.
CI consists of the following elements:
-
•
A version control system (Fowler, 2006). To be effective, all files should be under version control, not just code files. Anything that is needed to build, install and run the software should be under version control, including configuration files, build scripts, test harnesses, and operating system configuration files (Humble and Farley, 2010, p. 19). Fortunately for the MI, as shown in Section 4.6 all our measured projects use version control.
-
•
A fully automated build system (Fowler, 2006). As Humble and Farley (2010, p. 5) point out, deploying software manually is an anti-pattern. For MI software, Table 7 shows 18 of 29 packages (62%) were observed to include build scripts. Projects without a build system will need to add one to pursue using CI.
-
•
An automated test system (Fowler, 2006). Building quality software involves creating automated tests at the unit, component, and acceptance test level, and executing these tests whenever someone makes a change to the code, its configuration, the environment, or the software stack that it runs on (Humble and Farley, 2010, p. 83). As Table 7 shows, test cases are in the uncommon category for MI software artifacts, which means that some MI projects will need to increase their testing automation if they wish to pursue CI.
-
•
An automated system for other tasks, such as code checking, documentation building and web-site updating. These other tasks are not essential to CI, but they can be incorporated to improve the quality of the code and the communication between developers and users. For instance, a static analysis (possibly via linters) of the code may find poor programming practice or lack of adherence to adopted coding standards.
-
•
An integrated build system to pull everything together. Every time there is a check-in (for instance a pull request), the integration server automatically checks out the sources onto the integration machine, starts a build, runs tests, and informs the committer of the results.
To enable incorporation into a team’s workflow, Humble and Farley (2010, p. 60) explain that the usual approach for CI is to keep the build and test process short. Since MI files are large, the tests run with every check-in may need to focus on simple code interface tests, saving large tests for less frequent execution. A more sophisticated option to address the bottleneck for merges is CIVET (Continuous Integration, Verification, Enhancement, and Testing), which solves this problem by intelligently pinning, cancelling, and if necessary, restarting jobs as merges occur (Slaughter et al., 2021). A more sophisticated process management system can also enforce rules for pull requests, like checking that a test specification includes the test’s motivation, a test description, and a design description for all changes Slaughter et al. (2021).
Setting up a CI system has never been easier than it is today. A dedicated CI server (either physically or virtually) can be installed with tools such as Jenkins, Buildbot, Go, and Integrity. However, installation on your own server is often unnecessary since there are many hosted CI solutions, such as: Travis CI, GitHub Actions and CircleCI. All that is required to begin using a hosted CI is to select the service and then edit a few lines of a YAML configuration file in the project’s root directory.
Shahin et al. (2017) highlights the following challenges for adopting CI: lack of awareness and transparency, lack of expertise and skills, coordination and collaboration challenges, more pressure and workload for team members, general resistance to change, scepticism and distrust on continuous practices. The most common reason given for not adopting CI is that developers are not familiar enough with CI (Hilton et al., 2016). Shahin et al. (2017) observes that these problems can be mitigated via improving testing activities, planning and documentation, promoting a team mindset, adopting new rules and policies, and decomposing development into smaller units.
Continuous integration and delivery helps with addressing several pain points. For instance, CI/CD helps reduce development time (PP1:) by removing the need for a time-consuming integration stage and by automating regression testing. Automated regression tests also help with ensuring correctness (PP7:) and the quality of reproducibility (QQ3:).
10.2 Move To Web Applications
Section 9 describes the pain point of technology hurdles (PP5:), which motivates considering the use of web applications. Here we give further advice to help with deciding whether to adopt a web application. The decision will be based on whether, on balance, the web application improves the four factors identified by developers: compatibility, maintainability, performance, and security. To enable decision-making, a team will need to prioritize between these factors, based on their objectives and experience. The suggestions are intended to provide ideas and avenues for exploration; a web application will not be the right fit for all projects and all teams.
-
•
Modern technologies may improve frontend performance. Web applications with only a frontend usually perform worse than native applications. However, new technologies may ease this difference. For example, some JavaScript libraries can help the frontend harness the power of the computer’s GPU and accelerate graphical computing. In addition, there are new frameworks helping developers with cross-platform compatibility. For example, the Flutter project enables support for web, mobile, and desktop OS with one codebase. Other options include Vue, Angular and React, and Elm.
-
•
Backend servers can potentially deliver high performance. Web applications with backend servers may perform even better than native applications. If a team needs to support lower-end computers, it is good to use back-end servers for heavy computing tasks. For backend servers where traffic and latency is not an issue, options include Django, Laravel and Node.js. The advantage of Django is that it provides access to Python libraries. For backend servers where traffic and latency is an issue, Gin is an option.
-
•
Backend servers can have low costs. Serverless solutions from major cloud service providers (like Amazon Web Services (AWS) and Google Cloud Platform) may be worth exploring. Serverless solutions still use a server, but the server provider only charges the team when they use the server. The solution is event-driven, and costs the team by the number of requests processed. Thus, serverless can be very cost-effective for less intensively used functions.
-
•
Web transmission may diminish security. Transferring sensitive data on-line can be a problem for projects requiring high security. Regulations for some MI applications may forbid doing web transmissions. In this case, a web application with a backend may not be an option.
10.3 Enrich the Testing Datasets
As described in Section 9, ensuring correctness (PP7:) via testing can be problematic because of limited access to real-world medical imaging datasets. We build on the suggestions we heard from our interviewees as follows:
-
•
Build and maintain good connections to datasets. A team can build connections with professionals working in the medical domain, who may have access to private datasets and can perform tests for the team. If a team has such professionals as internal members, the process can be simplified.
-
•
Collect and maintain datasets over time. A team may face problems caused by various unique inputs over the years of software development. This data should be collected and maintained over time to form a good, comprehensive, dataset for testing.
-
•
Search for open data sources. In general, there are many open MI datasets. For instance, there are Chest X-ray Datasets by National Institute of Health (Wang et al., 2017), Cancer Imaging Archive (Prior et al., 2017), MedPix by National Library of Medicine (Smirniotopoulos, 2014), and datasets for liver (Bilic et al., 2019) and brain (B. H. Menze et al., 2015) tumor segmentation benchmarks. A team developing MI software should be able to find more open datasets according to their needs.
-
•
Create sample data for testing. If a team can access tools creating sample data, they may also self-build datasets for testing. For example, an MI software development team can use an MRI scanner to create images of objects, animals, and volunteers. The team can build the images based on specific testing requirements.
-
•
Remove privacy from sensitive data. For data with sensitive information, a team can ask the data owner to remove such information or add noise to protect privacy. One example is using de-identified copies of medical images for testing.
-
•
Establish community collaboration in the domain. During our interviews with developers in the MI domain, we heard many stories of asking for supports from other professionals or equipment manufacturers. However, we believe that broader collaboration between development teams can address this problem better. Some datasets are too sensitive to share, but if the community has some kind of “group discussion”, teams can better express their needs, and professionals can better offer voluntary support for testing. Ultimately, the community can establish a nonprofit organization as a third party, which maintains large datasets, tests Open Source Software (OSS) in the domain, and protects privacy.
10.4 Employ Linters
A linter is a tool that statically analyzes code to find programming errors, suspicious constructs, and stylistic inconsistencies (Wikipedia, 2022). Linters can be used as an ad hoc check for code files, but they really come into their own when used as part of a CI system, as discussed in Section 10.1. Almost none of the research software guidelines that we consulted, summarized in Section 6, mention linters. The one exception is Thiel (2020). Despite the lack of mention in the guidelines, we believe that linters have the potential to improve code quality at a relatively low cost.
Linters have the following benefits: finding potential bugs, finding memory leaks, improving performance, standardizing code with respect to formatting, removing silly errors before code reviews, and catching potential security issues (SourceLevel, 2022). Most popular programming languages have an accompanying linter. For example, Python has the options of PyLint, flake8 and Black (Zadka, 2018).
We recommend the use of linters because they are relatively easy to incorporate into a developer’s workflow, and they address several MI pain points (Section 9). For instance, linters address the lack of development time (PP1:) by increasing the developer’s productive time via guarding against making frustrating, time-consuming, mundane mistakes. Moreover, since a linter can include rules that capture the wisdom of senior programmers, it can help newer developers avoid common mistakes. With respect to the technology hurdle pain point (PP5:), linters can assist with the move toward web applications (Section 10.2). For instance, ESLint in React is a pluggable linter that lets the developer know if they have imported something and not used it, if a function could be short-handed, if there are indentation inconsistencies, etc. (Whitehouse, 2018). By insisting on code standardization linters can reduce technical debt and thus improve maintainability (QQ1:). Although linters are tools for code analysis, the idea of statically checking for adherence to basic rules can be extended to check documentation. Smith et al. (2018d) shows how the use of tools to enforce documentation standards partially explains the relatively higher quality of statistical tools that are part of the Comprehensive R Archive Network (CRAN).
10.5 Conduct a Mix of Rigorous and Informal Peer Reviews
We advocate incorporating peer review into the development process, as frequently recommended for research software (Heroux et al., 2008; Givler, 2020; Orviz et al., 2017; USGS, 2019). In most cases a modern, lightweight review, should be adequate. Modern code review is informal, tool-based, asynchronous, and focused on reviewing code changes (Sadowski et al., 2018). Managing a project via GitHub pull requests is an example of a modern approach to reviewing code. Software development organizations have moved to this lightweight style of code review because of the inefficiencies of rigorous inspections (Rigby and Bird, 2013). However, for important parts of the code, developers may benefit from mixing in a more rigorous approach.
Fagan (1976) began work on rigorous review via code inspection. Elements of a typical inspection include reviewing the code against a checklist (checking the consistency of variable names, look for terminating loops, etc.), performing specific review tasks (such as summarizing the code’s purpose, cross-referencing the code to the technical manual, creating a data dictionary for a given module, etc.) Rigorous inspection finds 60-65% of latent defects on average, and often tops 85% in defect removal efficiency (Jones, 2008). The success rate of code inspection is generally higher than most forms of testing, which average between 30 — 35% for defect removal efficiency (Ebert and Jones, 2009; Jones, 2008). For research software, (Kelly and Shepard, 2000) show a task based inspection approach can be effective. Task based inspection is an ideal fit with an issue tracking system, like GitHub. The review tasks can be issues, so that they can be easily assigned, monitored and recorded. Potential issues include assigning junior developers to test getting-started tutorial and installation instructions.
As indicated in Section 8 some MI projects use modern code review, via issue tracking and the use of GitHub. Those MI projects not incorporating modern code review would likely benefit by adopting it. Although a rigorous code inspection is likely not worth the required resources, for critical parts of the code, developers may want to adopt a more rigorous approach. For instance, developers may drop the modern trend of asynchronous review and instead occasionally use synchronous review to help uncover errors and disseminate best practices throughout the team. For instance, teams could periodically meet, either in-person or virtually, and have junior members walk through their code. In-person reviews will likely help realize the benefits of modern code review noticed by Bird and Bacchelli (2013): defect detection, knowledge transfer, increased team awareness, and creation of alternative solutions to problems.
Due to improving code quality and increasing knowledge transfer, peer review addresses the same pain points and qualities as linters (Section 10.4): PP1:, PP5:, and QQ1:. Peer review can potentially find misunderstandings in how the code implements the required theory, which will improve the software’s correctness (PP7:). The benefits of peer review for addressing pain points can be increased by extending the review from just code, to also reviewing all software artifacts, including documentation, build scripts, test cases and the development process itself.
10.6 Design For Change
In our “state of the practice” assessment exercise for LBM software (Smith et al., 2024), we noticed that LBM developers implicitly used modularization based on the principle of design for change to improve maintainability (QQ1:). We recommend that MI developers use the same principle for their modularizations. Although the advice to modularize research software to handle complexity is common (Wilson et al., 2014; Stewart et al., 2017; Storer, 2017), specific guidelines on how to divide the software into modules is less prevalent. Not every decomposition is a good design for supporting change, as shown by Parnas (1972). For instance, a design with low cohesion and high coupling (Ghezzi et al., 2003, p. 48) will make change difficult. Especially in research software, where change is inevitable, designers need to produce a modularization that supports change. Jung et al. (2022) points out that ocean modelling software is currently feeling the pain of not emphasizing modularization in legacy code.
Specific examples of design for change for LBM software (Smith et al., 2024) include the following:
-
•
pyLBM has decoupled geometries and models of their system using abstraction and modularization of the source code, to make it easy to add new features. The pyLBM design allows for independent changes to the geometry and the model. pyLBM also redeveloped data structures to ease future change.
-
•
TCLB (Rokicki and Laniewski-Wollk, 2016) is designed to allow for the addition of some LBM features, but changes to major aspects of the system would be difficult. For example, “implementing a new model will be an easy contribution”, but changes to the “Cartesian mesh … will be a nightmare” (Smith et al., 2024). The design of TCLB highlights that not every conceivable change needs to be supported, only the likely changes.
As the LBM examples above illustrate, developers can accomplish design for change by first identifying likely changes, either implicitly or explicitly, and second by hiding each likely change behind a well-defined module interface. This approach mirrors the recommendations from Parnas (1972). Section 6 lists ideas for how to document the design, including the likely changes, so that they are more visible to others.
10.7 Assurance Case
To ensure correctness (PP7: and to achieve the quality of reproducibility (QQ3:), we recommend considering the use of assurance cases. Rinehart et al. (2015) defines an assurance case as “[a] reasoned and compelling argument, supported by a body of evidence, that a system, service, or organization will operate as intended for a defined application in a defined environment.” An assurance cases provide an organized and explicit argument that the software and its documentation achieves desired qualities, such as correctness and reproducibility. Although assurance cases have been successfully employed for safety critical systems (Rinehart et al., 2015), this technique is relatively new for research software (Smith et al., 2020b; Smith, 2018).
One way to present an assurance case is through the Goal Structuring Notation (GSN) (Spriggs, 2012), which make arguments clear, easy to read and, hence, easy to challenge. GSN starts with a Top Goal (Claim), like “Program X delivers correct outputs when used for its intended use/purpose in its intended environment.” We then decompose this top goal into Sub-Goals, which themselves may be further decomposed. The purpose of the decomposition is to take the abstract higher level goals and bring them down to something concrete that can be proven. The decomposition ends with the terminal Sub-Goals that are supported by Solutions (Evidence). Typical evidence will consist of documents, expert reviews, test case results, peer review, etc. Within the GSN framework, there are also strategy blocks, which describe the rationale for decomposing a Goal or Sub-Goal into more detailed Sub-Goals. A common tool for creating, editing, and presenting, a GSN argument is Astah.
Smith et al. (2020b) shows the example of arguing for the correctness of the Analysis of Functional NeuroImages (AFNI) package 3dfim+ (Ward, 2000). 3dfim+ analyzes the activity of the brain by computing the correlation between an ideal signal and the measured brain signal for each voxel. The assurance case for the correctness of 3dfim+ has the top level decomposed into four sub-goals, as shown in Figure 14. This example follows the same pattern as used for medical devices (Wassyng et al., 2015). The first sub-goal (GR) argues for the quality of the documentation of the requirements. The second sub-goal (GD) says that the design complies with the requirements and the third proposes that the implementation also complies with the requirements. The fourth sub-goal (GA) claims that the inputs to 3dfim+ will satisfy the operational assumptions, since we need valid input to make an argument for the correctness of the output.
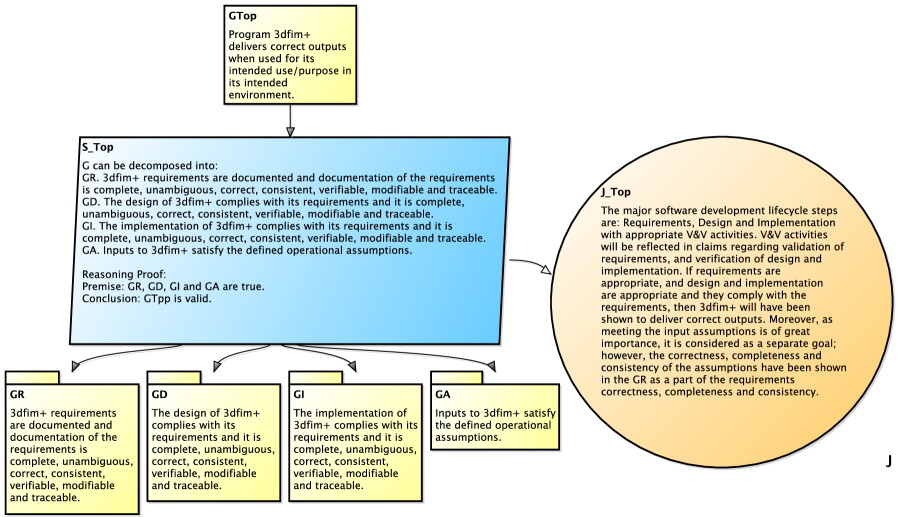
Preparing an assurance case for the pre-existing 3dfim+ software shows the value of an assurance cases for research software. Although Smith et al. (2020a) found no errors in the output of the existing software, the rigour of the proposed approach did lead to finding ambiguities and omissions in the existing documentation, such as missing information on the coordinate system convention. In addition, a potential concern for the software itself was identified from the GA argument: running the software does not produce any warning about the obligation of the user to provide data that matches the parametric statistical model employed for the correlation calculations.
10.8 Generate All Things
To address developer pain points, we propose automatically generating MI code and its documentation via a “Generate All Things” (GAT) approach. A GAT approach uses models to capture knowledge in domains such as physics, computing, mathematics, documentation, and certification. Developers combine and transform knowledge via explicit “recipes”, which weave it together to generate the desired code, documentation, test cases, inspection reports and build scripts. A recipe can even potentially be written to generate an assurance case (Section 10.7). Our definition of GAT implies generation of all software artifacts, not just the code. GAT moves development to a higher level of abstraction so that domain experts can work without concern for low-level implementation details. GAT allows developers to optimally generate code and documentation, reduce the likelihood of errors, eliminate redundancy, and automate maintenance. With a GAT approach MI developers can experiment with different algorithm choices, different input formats, different outputs formats, etc.
Part of GAT is code generation. In the future, some believe that code generation will transform coding, documentation, design, and verification (Johanson and Hasselbring, 2018; Smith, 2018). GAT removes the distraction of writing software, allowing developers to focus on their science. A GAT approach removes the maintenance headaches of documentation duplicates and near duplicates (Luciv et al., 2018), since developers capture knowledge once and transform it as needed. Code generation has previously been applied to improve research software, such as linear algebra software packages like Blitz++ (Veldhuizen, 1998), and ATLAS (Automatically Tuned Linear Algebra Software) (Whaley et al., 2001). Software/hardware generation has been applied for digital signal processing in Spiral (Püschel et al., 2001). A generative approach has also been used for a family of efficient, type-safe Gaussian elimination algorithms Carette and Kiselyov (2011). (Logg et al., 2012) use code generation when solving partial differential equations in FEniCS (Finite Element and Computational Software). Matkerim et al. (2013) and Ober et al. (2018) use code generation for High Performance Computing (HPC), using UML (Unified Modelling Language) for their domain models. Szymczak et al. (2016) presents initial work on the GAT approach, Smith and Carette (2021) presents a motivating example, and (Carette et al., 2021) provides a prototype.
A GAT approach addresses multiple pain points. For example, a generative approach can decrease development time (PP1:) by automation, once the necessary infrastructure is in place. The GAT approach addresses the technology related pain point (PP5:) because technology information can be captured in the models and transformed as needed. To ensure correctness (PP7:), a GAT approach should be correct by construction. If there are mistakes, GAT has the advantage that they are propagated throughout the generated artifacts, which greatly increases the chance that someone will notice the mistake. Maintainability (QQ1:) is addressed because developers write the recipes used for generation at a high level making them relatively easy to change. Usability (PP9:) is addressed because of the emphasis on generating up-to-date documentation. GAT facilitates reproducibility (QQ3:) because at any time all the code and documentation can be regenerated. The generator can include explicit traceability to show the dependence of the software on specific versions of software libraries.
11 Threats to Validity
Below we categorize and list the threats to validity that we have identified. Our categories come from an analysis of software engineering secondary studies by Ampatzoglou et al. (2019), where a secondary study analyzes the data from a set of primary studies. Ampatzoglou et al. (2019) is appropriate because a common example of a secondary study is a systematic literature review. Our methodology is a systematic software review — the primary studies are the software packages, and our work collects and analyzes these primary studies. We identified similar threats to validity in our assessment of the state of the practice of Lattice Boltzmann Solvers (Smith et al., 2024).
11.1 Reliability
A study is reliable if repetition of the study by different researchers using the original study’s methodology would lead to the same results (Runeson and Höst, 2009). Reliability means that data and analysis are independent of the specific researcher(s) doing the study. For the current study the identified reliability related threats are as follows:
-
•
One individual does the manual measures for all packages. A different evaluator might find different results, due to differences in abilities, experiences, and biases.
-
•
The manual measurements for the full set of packages took several months. Over this time the software repositories may have changed and the reviewer’s judgement may have drifted.
In Smith et al. (2016a) we reduced concern over the reliability risk associated with the reviewer’s judgement by demonstrating that the measurement process is reasonably reproducible. In Smith et al. (2016a) we graded five software products by two reviewers. Their rankings were almost identical. As long as each grader uses consistent definitions, the relative comparisons in the AHP results will be consistent between graders.
11.2 Construct Validity
Runeson and Höst (2009) defines construct validity as the adopted metrics representing what they are intended to measure. Our construct threats are often related to how we assume our measurements influences the various software qualities, as summarized in Section 3.3. Specifically, our construct validity related threats include the following:
-
•
We make indirect measurement of software qualities since meaningful direct measures for qualities like maintainability, reusability and verifiability, are unavailable. We follow the usual assumption that developers achieve higher quality by following procedures and adhering to standards (van Vliet, 2000, p. 112).
-
•
As mentioned in Section 4.1, we could not install or build dwv, GATE, and DICOM Viewer. We used a deployed on-line version for dwv, a VM version for GATE, but no alternative for DICOM Viewer. We might underestimate their rank due to these technical issues.
-
•
Measuring software robustness only involved two pieces of data. This is likely part of the reason for limited variation in the robustness scores (Figure 7). We could add more robustness data by pushing the software to deal with more unexpected situations, like a broken Internet connection, but this would require a larger investment of measurement time.
-
•
We may have inaccurately estimated maintainability by assuming a higher ratio of comments to source code improves maintainability. Moreover, we assumed that maintainability is improved if a high percentage of issues are closed, but a project may have a wealth of open issues, and still be maintainable.
-
•
We assess reusability by the number of code files and LOC per file. This measure is indicative of modularity, but it does not necessarily mean a good modularization. The modules may not be general enough to be easily reused, or the formatting may be poor, or the understandability of the code may be low.
-
•
The understandability measure relies on 10 random source code files, but the 10 files will not necessarily be representative.
-
•
As discussed in Section 4.10, our overall AHP ranking makes the unrealistic assumption of equal weighting.
-
•
We approximated popularity by stars and watches (Section 5), but this assumption may not be valid.
-
•
As mentioned in Section 3.4, one interviewee was too busy to participate in a full interview, so they provided written answers instead. Since we did not have the chance to explain our questions or ask them follow-up questions, there is a possibility of misinterpretation of the questions or answers.
-
•
In building Table 8 some judgement was necessary on our part, since not all guidelines use the same names for artifacts that contain essentially the same information.
11.3 Internal Validity
Internal validity means that discovered causal relations are trustworthy and cannot be explained by other factors (Runeson and Höst, 2009). In our methodology the internal validity threats include the following:
-
•
In our search for software packages (Section 3.2), we may have missed a relevant package.
-
•
Our methodology assumes that all relevant software development activities will leave a trace in the repositories, but this is not necessarily true. For instance, the possibility exists that CI usage was higher than what we observed through the artifacts (Section 7). As another example, although we saw little evidence of requirements (Section 7), maybe teams keep this kind of information outside their repos, possibly in journal papers or technical reports.
-
•
We interviewed a relatively small sample of 8 teams. Their pain points (Section 9) may not be representative of the rest of their community.
11.4 External Validity
If the results of a study can be generalized (applied) to other situations/cases, then the study is externally valid (Runeson and Höst, 2009). We are confident that our search was exhaustive. We do not believe that we missed any highly popular examples. Therefore, the bulk of our validity concerns are internal (Section 11.3). However, our hope is that the trends observed, and the lessons learned for MI software can be applied to other research software. With that in mind we identified the following threat to external validity:
-
•
We cannot generalize our results if the development of MI software is fundamentally different from other research software.
Although there are differences, like the importance of data privacy for MI data, we found the approach to developing LBM software (Smith et al., 2024) and MI software to be similar. Except for the domain specific aspects, we believe that the trends observed in the current study are externally valid for other research software.
12 Future Work
The following recommendations for future state of the practice measurement exercises, for MI or for other domains, could address some threats to validity mentioned above. Moreover, some ideas may make the data collection more efficient.
-
•
We would like to make surface measurements less shallow. For example:
-
–
Surface reliability: our current measurement relies on the processes of installation and getting started tutorials. However, not all software needs installation or has a getting started tutorial. We could devise a list of operation steps (with the help of the Domain Expert), perform the same operations with each software, and record any errors.
-
–
Surface robustness: we used damaged images as inputs for this measuring MI software. This process is similar to fuzz testing (Wikipedia contributors, 2021b), which is one type of fault injection (Wikipedia contributors, 2021a). We may adopt more fault injection methods, and identify tools and libraries to automate this process.
-
–
Surface usability: we can design usability tests and test all software projects with end-users. The end-users can be volunteers and domain experts. Ideas for getting started are available in Smith et al. (2021).
-
–
Surface understandability: our current method does not require understanding the source code. As software engineers, perhaps we can select a small module of each project, read the source code and documentation, try to understand the logic, and score the ease of the process.
-
–
Maintainability: we can add a measure modifiability as part of the measurement of maintainability. An experiment could be conducted asking participants to make modifications, observing the study subjects during the modifications, testing the resulting software and surveying the participants (Smith et al., 2021).
-
–
-
•
We can further automate the measurements on the grading template. For example, with automation scripts and the GitHub API, we may save significant time on retrieving the GitHub metrics through a GitHub Metric Collector. This Collector can take GitHub repository links as input, automatically collect metrics from the GitHub API, and record the results.
-
•
We can improve some interview questions. Some examples are:
-
–
In one question we ask, “Do you think improving this process can tackle the current problem?” The problem is that this is a yes-or-no question, which is not informative. We could change the question to “By improving this process, what current problems can be tackled?”;
-
–
We can ask for more details about the modular approach, such as “What principles did you use to divide code into modules? Can you describe an example of using your principles?”.
-
–
-
•
We can better organize the interview questions. Since we use audio conversion tools to transcribe the answers, we should make the transcription easier to read. For example, we can order them together for questions about the five software qualities and compose a similar structure for each.
-
•
We can mark the follow-up interview questions with keywords. For example, say “this is a follow-up question” every time asking one. Thus, we record this sentence in the transcription, and it will be much easier to distinguish the follow-up questions from the 20 designed questions.
13 Conclusions
We analyzed the state of the practice for the MI domain with the goal of understanding current practice, answering our ten research questions (Section 1.1) and providing recommendations for current and future projects. Our methods in Section 3 form a general process to evaluate domain-specific software, that we apply to the specific domain of MI software. We identified 48 MI software candidates, then, with the help of the Domain Expert selected 29 of them to our final list.
Section 4 lists our measurement results for ranking the 29 projects for nine software qualities. Our ranking results appear credible since they are mostly consistent with the ranking from the scientific community implied by the GitHub stars-per-year metric. As discussed in Section 5, four of the top five software projects appear in both our list and in the GitHub popularity list. Moreover, our top five packages appear among the first eight positions on the GitHub list. The noteworthy discrepancies between the two lists are for the packages that we were unable to install (dwv and Dicom Viewer).
Based on our grading scores 3D Slicer, ImageJ, Fiji and OHIF Viewer are the top four software performers. However, the separation between the top performers and the others is not extreme. Almost all packages do well on at least a few qualities, as shown in Table 13, which summarizes the packages ranked first and second for each quality. Almost 70% (20 of 29) of the software packages appear in the top two for at least two qualities. The only packages that do not appear in Table 13, or only appear once, are Papaya, MatrixUser, MRIcroGL, XMedCon, dicompyler, DicomBrowser, AMIDE, 3DimViewer, and Drishti. The shortness of this list suggests parity with respect to adoption of best practices for MI software overall.
| Quality | Ranked 1st or 2nd |
|---|---|
| Installability | 3D Slicer, BioImage Suite Web, Slice:Drop, INVESALIUS |
| \pbox3.0cmCorrectness | |
| and Verifiability | OHIF Viewer, 3D Slicer, ImageJ |
| Reliability | SMILI, ImageJ, Fiji, 3D Slicer, Slice:Drop, OHIF Viewer |
| Robustness | XMedCon, Weasis, SMILI, ParaView, OsiriX Lite, MicroView, medInria, ITK-SNAP, INVESALIUS, ImageJ, Horos, Gwyddion, Fiji, dicompyler, DicomBrowser, BioImage Suite Web, AMIDE, 3DimViewer, 3D Slicer, OHIF Viewer, DICOM Viewer |
| Usability | 3D Slicer, ImageJ, Fiji, OHIF Viewer, ParaView, INVESALIUS, Ginkgo CADx, SMILI, OsiriX Lite, BioImage Suite Web, ITK-SNAP, medInria, MicroView, Gwyddion |
| Maintainability | 3D Slicer, Weasis, ImageJ, OHIF Viewer, ParaView |
| Reusability | 3D Slicer, ImageJ, Fiji, OHIF Viewer, SMILI, dwv, BioImage Suite Web, GATE, ParaView |
| \pbox3.0cmUnderstandability | 3D Slicer, ImageJ, Weasis, Fiji, Horos, OsiriX Lite, dwv, Drishti, OHIF Viewer, GATE, ITK-SNAP, ParaView, INVESALIUS |
| \pbox3.0cmVisibility and | |
| Transparency | ImageJ, 3D Slicer, Fiji |
| Overall Quality | 3D Slicer, ImageJ |
For insight into devising future methods and tools, we interviewed nine developers (from eight teams) to learn about their pain points (Section 9). We also discussed qualities of potential concern. The identified pain points and qualities of concern include:
- PP1:
-
Lack of development time,
- PP3:
-
Lack of funding,
- PP5:
-
Technology hurdles,
- PP7:
-
Ensuring correctness,
- PP9:
-
Usability,
- QQ1:
-
Quality of maintainability, and
- QQ3:
-
Quality of reproducibility.
Despite the pain points, overall MI software is in a healthy state for software development practices. In our survey of the selected projects we observed 88% of the documentation artifacts recommended by research software development guidelines (Section 6). With respect to tools, MI is keeping pace with other research software with 100% of the projects using version control (with 93% specifically using git) (Section 7). We observed that the MI developers tend to follow the typical research software trend of using a quasi-agile software development process (Section 8).
Although the state of the practice for MI software is healthy, we did notice areas where practice seems to lag behind the research software development guidelines. For instance, the guidelines recommend three artifacts that were not observed: uninstall instructions, test plans, and requirements documentation. We observed the following recommended artifacts, but only rarely: contributing file, developer code of conduct, code style guidelines, product roadmap, design documentation, and API documentation (Section 6). Although software development tool use seems healthy, we found the use of CI/CD behind typical usage rates (17% of the projects used CI/CD) (Section 7). With respect to the development process, developer identified areas for improvement included testing (only 50% of projects were identified to have unit testing) and documentation (only three out of nine developers felt their documentation was clear enough) (Section 8).
Our interviewees proposed strategies to improve the state of the practice, to address the identified pain points, and to improve software quality. To their list (Section 9) we added some of our own recommended strategies (Section 10). Below we summarize the proposed strategies, with traceability to where we discuss the strategy, and to the relevant pain points.
- 1.
- 2.
- 3.
- 4.
- 5.
- 6.
- 7.
- 8.
- 9.
- 10.
Acknowledgements
We would like to thank Peter Michalski and Oluwaseun Owojaiye for fruitful discussions on topics relevant to this paper. We would also like to thank Jason Balaci for advice on web applications.
Conflict of Interest
On behalf of all authors, the corresponding author states that there is no conflict of interest.
References
- (1)
- Abdalla (2016) Safia Abdalla. 2016. A template for creating open source contributor guidelines. https://opensource.com/life/16/3/contributor-guidelines-template-and-tips.
- Ackroyd et al. (2008) Karen S. Ackroyd, Steve H. Kinder, Geoff R. Mant, Mike C. Miller, Christine A. Ramsdale, and Paul C. Stephenson. 2008. Scientific Software Development at a Research Facility. IEEE Software 25, 4 (July/August 2008), 44–51.
- Administration (2021) U.S. Food & Drug Administration. 2021. Medical Imaging. https://www.fda.gov/radiation-emitting-products/radiation-emitting-products-and-procedures/medical-imaging. [Online; accessed 25-July-2021].
- Afsar (2021) Aysel Afsar. 2021. DICOM Viewer. https://github.com/ayselafsar/dicomviewer. [Online; accessed 27-May-2021].
- Ahrens et al. (2005) J. Ahrens, Berk Geveci, and Charles Law. 2005. ParaView: An End-User Tool for Large Data Visualization. Visualization Handbook (01 2005).
- AlNoamany and Borghi (2018) Yasmin AlNoamany and John A. Borghi. 2018. Towards computational reproducibility: researcher perspectives on the use and sharing of software. PeerJ Computer Science 4, e163 (September 2018), 1–25.
- Amorim et al. (2015) Paulo Amorim, Thiago Franco de Moraes, Helio Pedrini, and Jorge Silva. 2015. InVesalius: An Interactive Rendering Framework for Health Care Support. 10. https://doi.org/10.1007/978-3-319-27857-5_5
- Ampatzoglou et al. (2019) Apostolos Ampatzoglou, Stamatia Bibi, Paris Avgeriou, Marijn Verbeek, and Alexander Chatzigeorgiou. 2019. Identifying, Categorizing and Mitigating Threats to Validity in Software Engineering Secondary Studies. Information and Software Technology 106 (02 2019). https://doi.org/10.1016/j.infsof.2018.10.006
- Angenent et al. (2006) S. Angenent, Eric Pichon, and Allen Tannenbaum. 2006. Mathematical methods in medical image processing. Bulletin (new series) of the American Mathematical Society 43 (07 2006), 365–396. https://doi.org/10.1090/S0273-0979-06-01104-9
- Archie and Marcus (2012) Kevin Archie and Daniel Marcus. 2012. DicomBrowser: Software for Viewing and Modifying DICOM Metadata. Journal of digital imaging : the official journal of the Society for Computer Applications in Radiology 25 (02 2012), 635–45. https://doi.org/10.1007/s10278-012-9462-x
- Association (2021) Medical Imaging Technology Association. 2021. About DICOM: Overview. https://www.dicomstandard.org/about-home. [Online; accessed 11-August-2021].
- B. H. Menze et al. (2015) B. H. Menze, A. Jakab, S. Bauer, J. Kalpathy-Cramer, K. Farahani, J. Kirby, Y. Burren, N. Porz, J. Slotboom, R. Wiest, L. Lanczi, E. Gerstner, M. -A. Weber, T. Arbel, B. B. Avants, N. Ayache, P. Buendia, D. L. Collins, N. Cordier, J. J. Corso, A. Criminisi, T. Das, H. Delingette, Ç. Demiralp, C. R. Durst, M. Dojat, S. Doyle, J. Festa, F. Forbes, E. Geremia, B. Glocker, P. Golland, X. Guo, A. Hamamci, K. M. Iftekharuddin, R. Jena, N. M. John, E. Konukoglu, D. Lashkari, J. A. Mariz, R. Meier, S. Pereira, D. Precup, S. J. Price, T. R. Raviv, S. M. S. Reza, M. Ryan, D. Sarikaya, L. Schwartz, H. -C. Shin, J. Shotton, C. A. Silva, N. Sousa, N. K. Subbanna, G. Szekely, T. J. Taylor, O. M. Thomas, N. J. Tustison, G. Unal, F. Vasseur, M. Wintermark, D. H. Ye, L. Zhao, B. Zhao, D. Zikic, M. Prastawa, M. Reyes, and K. Van Leemput. 2015. The Multimodal Brain Tumor Image Segmentation Benchmark (BRATS). IEEE Transactions on Medical Imaging 34, 10 (Oct. 2015), 1993–2024.
- Bankman (2000) Isaac N. Bankman. 2000. Preface. In Handbook of Medical Imaging, Isaac N. Bankman (Ed.). Academic Press, San Diego, xi – xii. https://doi.org/10.1016/B978-012077790-7/50001-1
- Benureau and Rougier (2017) F. Benureau and N. Rougier. 2017. Re-run, Repeat, Reproduce, Reuse, Replicate: Transforming Code into Scientific Contributions. ArXiv e-prints (Aug. 2017). arXiv:1708.08205 [cs.GL]
- Bilic et al. (2019) Patrick Bilic, Patrick Ferdinand Christ, Eugene Vorontsov, Grzegorz Chlebus, Hao Chen, Qi Dou, Chi-Wing Fu, Xiao Han, Pheng-Ann Heng, Jürgen Hesser, Samuel Kadoury, Tomasz K. Konopczynski, Miao Le, Chunming Li, Xiaomeng Li, Jana Lipková, John S. Lowengrub, Hans Meine, Jan Hendrik Moltz, Chris Pal, Marie Piraud, Xiaojuan Qi, Jin Qi, Markus Rempfler, Karsten Roth, Andrea Schenk, Anjany Sekuboyina, Ping Zhou, Christian Hülsemeyer, Marcel Beetz, Florian Ettlinger, Felix Grün, Georgios Kaissis, Fabian Lohöfer, Rickmer Braren, Julian Holch, Felix Hofmann, Wieland H. Sommer, Volker Heinemann, Colin Jacobs, Gabriel Efrain Humpire Mamani, Bram van Ginneken, Gabriel Chartrand, An Tang, Michal Drozdzal, Avi Ben-Cohen, Eyal Klang, Michal Marianne Amitai, Eli Konen, Hayit Greenspan, Johan Moreau, Alexandre Hostettler, Luc Soler, Refael Vivanti, Adi Szeskin, Naama Lev-Cohain, Jacob Sosna, Leo Joskowicz, and Bjoern H. Menze. 2019. The Liver Tumor Segmentation Benchmark (LiTS). CoRR abs/1901.04056 (2019). arXiv:1901.04056 http://arxiv.org/abs/1901.04056
- Bird and Bacchelli (2013) Christian Bird and Alberto Bacchelli. 2013. Expectations, Outcomes, and Challenges of Modern Code Review. In Proceedings of the International Conference on Software Engineering (proceedings of the international conference on software engineering ed.). IEEE. https://www.microsoft.com/en-us/research/publication/expectations-outcomes-and-challenges-of-modern-code-review/
- Björn (2017) Kari Björn. 2017. Evaluation of Open Source Medical Imaging Software: A Case Study on Health Technology Student Learning Experience. Procedia Computer Science 121 (01 2017), 724–731. https://doi.org/10.1016/j.procs.2017.11.094
- Boehm (2007) Barry W Boehm. 2007. Software engineering: Barry W. Boehm’s lifetime contributions to software development, management, and research. Vol. 69. John Wiley & Sons.
- Boyter (2021) Ben Boyter. 2021. Sloc Cloc and Code. https://github.com/boyter/scc. [Online; accessed 27-May-2021].
- Brett et al. (2021) Alys Brett, James Cook, Peter Fox, Ian Hinder, John Nonweiler, Richard Reeve, and Robert Turner. 2021. Scottish Covid-19 Response Consortium. https://github.com/ScottishCovidResponse/modelling-software-checklist/blob/main/software-checklist.md.
- Brown (2015) Titus Brown. 2015. Notes from“How to grow a sustainable software development process (for scientific software)”. http://ivory.idyll.org/blog/2015-growing-sustainable-software-development-process.html.
- Brühschwein et al. (2019) Andreas Brühschwein, Julius Klever, Anne-Sophie Hoffmann, Denise Huber, Elisabeth Kaufmann, Sven Reese, and Andrea Meyer-Lindenberg. 2019. Free DICOM-Viewers for Veterinary Medicine: Survey and Comparison of Functionality and User-Friendliness of Medical Imaging PACS-DICOM-Viewer Freeware for Specific Use in Veterinary Medicine Practices. Journal of Digital Imaging (03 2019). https://doi.org/10.1007/s10278-019-00194-3
- Carette and Kiselyov (2011) Jacques Carette and Oleg Kiselyov. 2011. Multi-stage programming with Functors and Monads: Eliminating abstraction overhead from generic code. Sci. Comput. Program. 76, 5 (2011), 349–375.
- Carette et al. (2021) Jacques Carette, Spencer Smith, Jason Balaci, Anthony Hunt, Ting-Yu Wu, Samuel Crawford, Dong Chen, Dan Szymczak, Brooks MacLachlan, Dan Scime, and Maryyam Niazi. 2021. Drasil. https://github.com/JacquesCarette/Drasil/tree/v0.1-alpha
- Carty (2020) David Carty. 2020. Follow Google’s lead with programming style guides. https://www.techtarget.com/searchsoftwarequality/feature/Follow-Googles-lead-with-programming-style-guides.
- Carver et al. (2007) Jeffrey C. Carver, Richard P. Kendall, Susan E. Squires, and Douglass E. Post. 2007. Software Development Environments for Scientific and Engineering Software: A Series of Case Studies. In ICSE ’07: Proceedings of the 29th International Conference on Software Engineering. IEEE Computer Society, Washington, DC, USA, 550–559. https://doi.org/10.1109/ICSE.2007.77
- Carver et al. (2022) Jeffrey C. Carver, Nicholas Weber, Karthik Ram, Sandra Gesing, and Daniel S. Katz. 2022. A Survey of the State of the Practice for Research Software in the United States. PeerJ Computer Science 8:e963 (2022). https://doi.org/10.7717/peerj-cs.963
- Chandra et al. (2018) Shekhar Chandra, Jason Dowling, Craig Engstrom, Ying Xia, Anthony Paproki, Ales Neubert, David Rivest-Hénault, Olivier Salvado, Stuart Crozier, and Jurgen Fripp. 2018. A lightweight rapid application development framework for biomedical image analysis. Computer Methods and Programs in Biomedicine 164 (07 2018). https://doi.org/10.1016/j.cmpb.2018.07.011
- Choplin et al. (1992) Robert Choplin, J Boehme, and C Maynard. 1992. Picture archiving and communication systems: an overview. Radiographics : a review publication of the Radiological Society of North America, Inc 12 (02 1992), 127–9. https://doi.org/10.1148/radiographics.12.1.1734458
- Corbly (2014) James Edward Corbly. 2014. The Free Software Alternative: Freeware, Open Source Software, and Libraries. Information Technology and Libraries 33, 3 (Sep. 2014), 65–75. https://doi.org/10.6017/ital.v33i3.5105
- de Souza et al. (2019) Mario Rosado de Souza, Robert Haines, Markel Vigo, and Caroline Jay. 2019. What Makes Research Software Sustainable? An Interview Study With Research Software Engineers. CoRR abs/1903.06039 (2019). arXiv:1903.06039 http://arxiv.org/abs/1903.06039
- Dong (2021a) Ao Dong. 2021a. Assessing the State of the Practice for Medical Imaging Software. Master’s thesis. McMaster University, Hamilton, ON, Canada.
- Dong (2021b) Ao Dong. 2021b. Software Quality Grades for MI Software. Mendeley Data, V1, doi: 10.17632/k3pcdvdzj2.1. https://doi.org/10.17632/k3pcdvdzj2.1
- Easterbrook and Johns (2009) Steve M. Easterbrook and Timothy C. Johns. 2009. Engineering the Software for Understanding Climate Change. Comuting in Science & Engineering 11, 6 (November/December 2009), 65–74. https://doi.org/10.1109/MCSE.2009.193
- Ebert and Jones (2009) C. Ebert and C. Jones. 2009. Embedded Software: Facts, Figures, and Future. Computer 42, 4 (April 2009), 42–52. https://doi.org/10.1109/MC.2009.118
- ElSheikh et al. (2004) Ahmed H. ElSheikh, W. Spencer Smith, and Samir E. Chidiac. 2004. Semi-formal design of reliable mesh generation systems. Advances in Engineering Software 35, 12 (2004), 827–841.
- Emms (2019) Steve Emms. 2019. 16 Best Free Linux Medical Imaging Software. https://www.linuxlinks.com/medicalimaging/. [Online; accessed 02-February-2020].
- ESA (1991) ESA. February 1991. ESA Software Engineering Standards, PSS-05-0 Issue 2. Technical Report. European Space Agency.
- Fagan (1976) M. E. Fagan. 1976. Design and code inspections to reduce errors in program development. IBM Systems Journal 15, 3 (1976), 182–211. https://doi.org/10.1147/sj.153.0182
- Faulk et al. (2009) S. Faulk, E. Loh, M. L. V. D. Vanter, S. Squires, and L. G. Votta. 2009. Scientific Computing’s Productivity Gridlock: How Software Engineering Can Help. Computing in Science Engineering 11, 6 (Nov 2009), 30–39. https://doi.org/10.1109/MCSE.2009.205
- Fillard et al. (2012) Pierre Fillard, Nicolas Toussaint, and Xavier Pennec. 2012. Medinria: DT-MRI processing and visualization software. (04 2012).
- Fogel (2005) Karl Fogel. 2005. Producing Open Source Software: How to Run a Successful Free Software Project. O’Reilly Media, Inc.
- Fowler (2006) Martin Fowler. 2006. Continuous Integration. https://martinfowler.com/articles/continuousIntegration.html.
- Gamma et al. (1995) E. Gamma, R. Helm, J. Vlissides, and I R Johnson. 1995. Design Patterns: Elements of Reusable Object-Oriented Software. Addison-Wesley Professional.
- Gewaltig and Cannon (2012) Marc-Oliver Gewaltig and Robert Cannon. 2012. Quality and sustainability of software tools in neuroscience. Cornell University Library (May 2012), 20 pp.
- Ghezzi et al. (2003) Carlo Ghezzi, Mehdi Jazayeri, and Dino Mandrioli. 2003. Fundamentals of Software Engineering (2nd ed.). Prentice Hall, Upper Saddle River, NJ, USA.
- Gieniusz (2019) Tomasz Gieniusz. 2019. GitStats. https://github.com/tomgi/git_stats. [Online; accessed 27-May-2021].
- Givler (2020) Ray Givler. 2020. A Checklist of Basic Software Engineering Practices for Data Analysts and Data Scientists. https://www.linkedin.com/pulse/checklist-basic-software-engineering-practices-data-analysts-givler/?articleId=6681691007303630849.
- GNU (2019) GNU. 2019. Categories of free and nonfree software. https://www.gnu.org/philosophy/categories.html. [Online; accessed 20-May-2021].
- Goble (2014) Carole Goble. 2014. Better Software, Better Research. IEEE Internet Computing 18, 5 (2014), 4–8. https://doi.org/10.1109/MIC.2014.88
- Haak et al. (2015) Daniel Haak, Charles-E Page, and Thomas Deserno. 2015. A Survey of DICOM Viewer Software to Integrate Clinical Research and Medical Imaging. Journal of digital imaging 29 (10 2015). https://doi.org/10.1007/s10278-015-9833-1
- Haehn (2013) Daniel Haehn. 2013. Slice:drop: collaborative medical imaging in the browser. 1–1. https://doi.org/10.1145/2503541.2503645
- Hamill (2004) Paul Hamill. 2004. Unit test frameworks: Tools for high-quality software development. O’Reilly Media.
- Hannay et al. (2009a) Jo Erskine Hannay, Carolyn MacLeod, Janice Singer, Hans Petter Langtangen, Dietmar Pfahl, and Greg Wilson. 2009a. How do scientists develop and use scientific software?. In 2009 ICSE Workshop on Software Engineering for Computational Science and Engineering. 1–8. https://doi.org/10.1109/SECSE.2009.5069155
- Hannay et al. (2009b) Jo Erskine Hannay, Carolyn MacLeod, Janice Singer, Hans Petter Langtangen, Dietmar Pfahl, and Greg Wilson. 2009b. How Do Scientists Develop and Use Scientific Software?. In Proceedings of the 2009 ICSE Workshop on Software Engineering for Computational Science and Engineering (SECSE ’09). IEEE Computer Society, Washington, DC, USA, 1–8. https://doi.org/10.1109/SECSE.2009.5069155
- Hasan (2020) Mehedi Hasan. 2020. Top 25 Best Free Medical Imaging Software for Linux System. https://www.ubuntupit.com/top-25-best-free-medical-imaging-software-for-linux-system/. [Online; accessed 30-January-2020].
- Heaton and Carver (2015) Dustin Heaton and Jeffrey C. Carver. 2015. Claims About the Use of Software Engineering Practices in Science. Inf. Softw. Technol. 67, C (Nov. 2015), 207–219. https://doi.org/10.1016/j.infsof.2015.07.011
- Heroux and Bernholdt (2018) Michael A. Heroux and David E. Bernholdt. 2018. Better (Small) Scientific Software Teams, tutorial in Argonne Training Program on Extreme-Scale Computing (ATPESC). https://press3.mcs.anl.gov//atpesc/files/2018/08/ATPESC_2018_Track-6_3_8-8_1030am_Bernholdt-Better_Scientific_Software_Teams.pdf. https://doi.org/articles/journal_contribution/ATPESC_Software_Productivity_03_Better_Small_Scientific_Software_Teams/6941438
- Heroux et al. (2008) Michael A. Heroux, James M. Bieman, and Robert T. Heaphy. 2008. Trilinos Developers Guide Part II: ASC Softwar Quality Engineering Practices Version 2.0. https://faculty.csbsju.edu/mheroux/fall2012_csci330/TrilinosDevGuide2.pdf.
- Hilton et al. (2016) Michael Hilton, Timothy Tunnell, Kai Huang, Darko Marinov, and Danny Dig. 2016. Usage, costs, and benefits of continuous integration in open-source projects. In 2016 31st IEEE/ACM International Conference on Automated Software Engineering (ASE). 426–437.
- Hoffman and Strooper (1995) Daniel M. Hoffman and Paul A. Strooper. 1995. Software Design, Automated Testing, and Maintenance: A Practical Approach. International Thomson Computer Press, New York, NY, USA.
- horosproject.org (2020) horosproject.org. 2020. Horos. https://github.com/horosproject/horos. [Online; accessed 27-May-2021].
- Howison and Bullard (2016) James Howison and Julia Bullard. 2016. Software in the Scientific Literature: Problems with Seeing, Finding, and Using Software Mentioned in the Biology Literature. J. Assoc. Inf. Sci. Technol. 67, 9 (sep 2016), 2137–2155. https://doi.org/10.1002/asi.23538
- Humble and Farley (2010) Jez Humble and David G. Farley. 2010. Continuous Delivery: Reliable Software Releases through Build, Test, and Deployment Automation. Addison-Wesley, Upper Saddle River, NJ. http://my.safaribooksonline.com/9780321601919
- IEEE (1991) IEEE. 1991. IEEE Standard Glossary of Software Engineering Terminology. Standard. IEEE.
- IEEE (1998) IEEE. 1998. Recommended Practice for Software Requirements Specifications. IEEE Std 830-1998 (Oct. 1998), 1–40. https://doi.org/10.1109/IEEESTD.1998.88286
- IEEE-CS/ACM and Practices (1999) Joint Task Force on Software Engineering Ethics IEEE-CS/ACM and Professional Practices. 1999. Code of Ethics, IEEE Computer Society. https://www.computer.org/education/code-of-ethics.
- Innovations (2020) Parallax Innovations. 2020. Microview. https://github.com/parallaxinnovations/MicroView/. [Online; accessed 27-May-2021].
- Institute (2022) Software Sustainability Institute. 2022. Online sustainability evaluation. https://www.software.ac.uk/resources/online-sustainability-evaluation.
- Ishizaka and Lusti (2006) Alessio Ishizaka and Markus Lusti. 2006. How to derive priorities in AHP: A comparative study. Central European Journal of Operations Research 14 (12 2006), 387–400. https://doi.org/10.1007/s10100-006-0012-9
- ISO (2001) ISO. 2001. Iec 9126-1: Software engineering-product quality-part 1: Quality model. Geneva, Switzerland: International Organization for Standardization 21 (2001).
- ISO/IEC (2011) ISO/IEC. 2011. Systems and software engineering - Systems and software Quality Requirements and Evaluation (SQuaRE) - System and software quality models. Standard. International Organization for Standardization.
- ISO/TR (2002) ISO/TR. 2002. Ergonomics of human-system interaction — Usability methods supporting human-centred design. Standard. International Organization for Standardization.
- ISO/TR (2018) ISO/TR. 2018. Ergonomics of human-system interaction — Part 11: Usability: Definitions and concepts. Standard. International Organization for Standardization.
- Jan et al. (2004) Sama Jan, Giovanni Santin, Daniel Strul, S Staelens, K Assié, Damien Autret, Stéphane Avner, Remi Barbier, Manuel Bardiès, Peter Bloomfield, David Brasse, Vincent Breton, Peter Bruyndonckx, Irene Buvat, AF Chatziioannou, Yunsung Choi, YH Chung, Claude Comtat, Denise Donnarieix, and Christian Morel. 2004. GATE: a simulation toolkit for PET and SPECT. Physics in medicine and biology 49 (11 2004), 4543–61. https://doi.org/10.1088/0031-9155/49/19/007
- Johanson and Hasselbring (2018) Arne N. Johanson and Wilhelm Hasselbring. 2018. Software Engineering for Computational Science: Past, Present, Future. Computing in Science & Engineering Accepted (2018), 1–31.
- Jones (2008) Capers Jones. 2008. Measuring Defect Potentials and Defect Removal Efficiency. Crosstalk, The Journal of Defense Software Engineering 21, 6 (June 2008), 11–13.
- Joshi et al. (2011) Alark Joshi, Dustin Scheinost, Hirohito Okuda, Dominique Belhachemi, Isabella Murphy, Lawrence Staib, and Xenophon Papademetris. 2011. Unified Framework for Development, Deployment and Robust Testing of Neuroimaging Algorithms. Neuroinformatics 9 (03 2011), 69–84. https://doi.org/10.1007/s12021-010-9092-8
- Jung et al. (2022) Reiner Jung, Sven Gundlach, and Wilhelm Hasselbring. 2022. Thematic Domain Analysis for Ocean Modeling. Environmental Modelling & Software (Jan 2022), 105323. https://doi.org/10.1016/j.envsoft.2022.105323
- Kalagiakos (2003) Panagiotis Kalagiakos. 2003. The Non-Technical Factors of Reusability. In Proceedings of the 29th Conference on EUROMICRO. IEEE Computer Society, 124.
- Kanewala and Bieman (2013) U. Kanewala and J. M. Bieman. 2013. Techniques for testing scientific programs without an oracle. In Software Engineering for Computational Science and Engineering (SE-CSE), 2013 5th International Workshop on. 48–57. https://doi.org/10.1109/SECSE.2013.6615099
- Kashyap (2020) Neeraj Kashyap. 2020. GitHub’s Path to 128M Public Repositories. https://towardsdatascience.com/githubs-path-to-128m-public-repositories-f6f656ab56b1.
- Katerbow and Feulner (2018) Matthias Katerbow and Georg Feulner. 2018. Recommendations on the development, use and provision of Research Software. https://doi.org/10.5281/zenodo.1172988
- Kelly (2013) Diane Kelly. 2013. Industrial Scientific Software: A Set of Interviews on Software Development. In Proceedings of the 2013 Conference of the Center for Advanced Studies on Collaborative Research (Ontario, Canada) (CASCON ’13). IBM Corp., Riverton, NJ, USA, 299–310. http://dl.acm.org/citation.cfm?id=2555523.2555555
- Kelly (2015) Diane Kelly. 2015. Scientific software development viewed as knowledge acquisition: Towards understanding the development of risk-averse scientific software. Journal of Systems and Software 109 (2015), 50–61. https://doi.org/10.1016/j.jss.2015.07.027
- Kelly and Shepard (2000) Diane Kelly and Terry Shepard. 2000. Task-directed software inspection technique: an experiment and case study. In CASCON ’00: Proceedings of the 2000 conference of the Centre for Advanced Studies on Collaborative research (Mississauga, Ontario, Canada). IBM Press, 6. http://portal.acm.org/citation.cfm?id=782040#
- Kelly (2007) Diane F. Kelly. 2007. A Software Chasm: Software Engineering and Scientific Computing. IEEE Software 24, 6 (2007), 120–119. https://doi.org/10.1109/MS.2007.155
- Kelly et al. (2011) Diane F. Kelly, W. Spencer Smith, and Nicholas Meng. 2011. Software Engineering for Scientists. Computing in Science & Engineering 13, 5 (Oct. 2011), 7–11.
- Kikinis et al. (2014) Ron Kikinis, Steve Pieper, and Kirby Vosburgh. 2014. 3D Slicer: A Platform for Subject-Specific Image Analysis, Visualization, and Clinical Support. Vol. 3. 277–289. https://doi.org/10.1007/978-1-4614-7657-3_19
- Kim et al. (2011) Tae-Yun Kim, Jaebum Son, and Kwanggi Kim. 2011. The Recent Progress in Quantitative Medical Image Analysis for Computer Aided Diagnosis Systems. Healthcare informatics research 17 (09 2011), 143–9. https://doi.org/10.4258/hir.2011.17.3.143
- Kruchten et al. (2012) Philippe Kruchten, Robert L Nord, and Ipek Ozkaya. 2012. Technical debt: From metaphor to theory and practice. IEEE Software 29, 6 (2012), 18–21.
- Lab (2021) Chris Rorden’s Lab. 2021. MRIcroGL. https://github.com/rordenlab/MRIcroGL. [Online; accessed 27-May-2021].
- Lenhard et al. (2013) Jörg Lenhard, Simon Harrer, and Guido Wirtz. 2013. Measuring the installability of service orchestrations using the square method. In 2013 IEEE 6th International Conference on Service-Oriented Computing and Applications. IEEE, 118–125.
- Lethbridge et al. (2003) T.C. Lethbridge, J. Singer, and A. Forward. 2003. How software engineers use documentation: the state of the practice. IEEE Software 20, 6 (2003), 35–39. https://doi.org/10.1109/MS.2003.1241364
- Limaye (2012) Ajay Limaye. 2012. Drishti, A Volume Exploration and Presentation Tool. Proc SPIE 8506, 85060X. https://doi.org/10.1117/12.935640
- Liu et al. (2016) Fang Liu, Julia Velikina, Walter Block, Richard Kijowski, and Alexey Samsonov. 2016. Fast Realistic MRI Simulations Based on Generalized Multi-Pool Exchange Tissue Model. IEEE Transactions on Medical Imaging PP (10 2016), 1–1. https://doi.org/10.1109/TMI.2016.2620961
- Loening (2017) Andy Loening. 2017. AMIDE. https://sourceforge.net/p/amide/code/ci/default/tree/amide-current/. [Online; accessed 27-May-2021].
- Logg et al. (2012) A. Logg, K.-A. Mardal, and G. N. Wells (Eds.). 2012. Automated Solution of Differential Equations by the Finite Element Method. Lecture Notes in Computational Science and Engineering, Vol. 84. Springer. https://doi.org/10.1007/978-3-642-23099-8
- Luciv et al. (2018) D. V. Luciv, D. V. Koznov, G. A. Chernishev, A. N. Terekhov, K. Yu. Romanovsky, and D. A. Grigoriev. 2018. Detecting Near Duplicates in Software Documentation. Programming and Computer Software 44, 5 (01 Sep 2018), 335–343. https://doi.org/10.1134/S0361768818050079
- Martelli (2021) Yves Martelli. 2021. dwv. https://github.com/ivmartel/dwv. [Online; accessed 27-May-2021].
- Matkerim et al. (2013) Bazargul Matkerim, Darhan Akhmed-Zaki, and Manuel Barata. 2013. Development High Performance Scientific Computing Application Using Model-Driven Architecture. Applied Mathematical Sciences 7, 100 (2013), 4961–4974.
- McCormick et al. (2014) Matthew McCormick, Xiaoxiao Liu, Julien Jomier, Charles Marion, and Luis Ibanez. 2014. ITK: Enabling Reproducible Research and Open Science. Frontiers in neuroinformatics 8 (02 2014), 13. https://doi.org/10.3389/fninf.2014.00013
- Meng et al. (2018) Michael Meng, Stephanie Steinhardt, and Andreas Schubert. 2018. Application Programming Interface Documentation: What Do Software Developers Want? Journal of Technical Writing and Communication 48, 3 (2018), 295–330. https://doi.org/10.1177/0047281617721853 arXiv:https://doi.org/10.1177/0047281617721853
- Michalski (2021) Peter Michalski. 2021. State of The Practice for Lattice Boltzmann Method Software. Master’s thesis. McMaster University, Hamilton, Ontario, Canada.
- Mu (2019) Hamza Mu. 2019. 20 Free & open source DICOM viewers for Windows. https://medevel.com/free-dicom-viewers-for-windows/. [Online; accessed 31-January-2020].
- Münch et al. (2019) Jürgen Münch, Stefan Trieflinger, and Dominic Lang. 2019. Product Roadmap – From Vision to Reality: A Systematic Literature Review. In 2019 IEEE International Conference on Engineering, Technology and Innovation (ICE/ITMC). 1–8. https://doi.org/10.1109/ICE.2019.8792654
- Musa et al. (1987) JD Musa, Anthony Iannino, and Kazuhira Okumoto. 1987. Software reliability: prediction and application.
- NASA (1989) NASA. 1989. Software requirements DID, SMAP-DID-P200-SW, Release 4.3. Technical Report. National Aeronautics and Space Agency.
- Nevcas and Klapetek (2012) D Nevcas and P Klapetek. 2012. Gwyddion: an open-source software for spm data analysis. Cent Eur J Phys 10 (01 2012).
- Nguyen-Hoan et al. (2010) Luke Nguyen-Hoan, Shayne Flint, and Ramesh Sankaranarayana. 2010. A Survey of Scientific Software Development. In Proceedings of the 2010 ACM-IEEE International Symposium on Empirical Software Engineering and Measurement (Bolzano-Bozen, Italy) (ESEM ’10). ACM, New York, NY, USA, Article 12, 10 pages. https://doi.org/10.1145/1852786.1852802
- Nolf et al. (2003) E Nolf, Tony Voet, Filip Jacobs, R Dierckx, and Ignace Lemahieu. 2003. (X)MedCon * An OpenSource Medical Image Conversion Toolkit. European Journal of Nuclear Medicine and Molecular Imaging 30 (08 2003), S246. https://doi.org/10.1007/s00259-003-1284-0
- Ober et al. (2018) Ileana Ober, Marc Palyart, Jean-Michel Bruel, and David Lugato. 2018. On the use of models for high-performance scientific computing applications: an experience report. Software & Systems Modeling 17, 1 (01 Feb 2018), 319–342. https://doi.org/10.1007/s10270-016-0518-0
- Orviz et al. (2017) Pablo Orviz, Álvaro López García, Doina Cristina Duma, Giacinto Donvito, Mario David, and Jorge Gomes. 2017. A set of common software quality assurance baseline criteria for research projects. https://doi.org/10.20350/digitalCSIC/12543
- Owojaiye et al. (2021) Oluwaseun Owojaiye, W. Spencer Smith, Jacques Carette, Peter Michalski, and Ao Dong. 2021. State of Sustainability for Research Software (poster). In SIAM-CSE 2021 Conference on Computational Science and Engineering, Minisymposterium: Software Productivity and Sustainability for CSE. https://doi.org/10.6084/m9.figshare.14039888.v2
- Panchal and Keyes (2010) A. Panchal and R. Keyes. 2010. SU-GG-T-260: Dicompyler: An Open Source Radiation Therapy Research Platform with a Plugin Architecture. Medical Physics - MED PHYS 37 (06 2010). https://doi.org/10.1118/1.3468652
- Papademetris et al. (2005) Xenophon Papademetris, Marcel Jackowski, Nallakkandi Rajeevan, Robert Constable, and Lawrence Staib. 2005. BioImage Suite: An integrated medical image analysis suite. 1 (01 2005).
- Parnas et al. (1984) D.L. Parnas, P.C. Clement, and D. M. Weiss. 1984. The modular structure of complex systems. In International Conference on Software Engineering. 408–419.
- Parnas (1972) David L. Parnas. 1972. On the Criteria To Be Used in Decomposing Systems into Modules. Comm. ACM 15, 2 (Dec. 1972), 1053–1058.
- Parnas and Clements (1986) David Lorge Parnas and Paul C Clements. 1986. A rational design process: How and why to fake it. IEEE transactions on software engineering 2 (1986), 251–257.
- Phaal et al. (2005) R. Phaal, C.J.P. Farrukh, and D.R. Probert. 2005. Developing a technology roadmapping system. In A Unifying Discipline for Melting the Boundaries Technology Management:. 99–111. https://doi.org/10.1109/PICMET.2005.1509680
- Pichler (2012) Roman Pichler. 2012. Working with an Agile Product Roadmap. https://www.romanpichler.com/blog/agile-product-roadmap/.
- Pinto et al. (2016) Gustavo Pinto, Igor Steinmacher, and Marco Aurélio Gerosa. 2016. More Common Than You Think: An In-depth Study of Casual Contributors. In 2016 IEEE 23rd International Conference on Software Analysis, Evolution, and Reengineering (SANER), Vol. 1. 112–123. https://doi.org/10.1109/SANER.2016.68
- Pinto et al. (2018) Gustavo Pinto, Igor Wiese, and Luis Felipe Dias. 2018. How Do Scientists Develop and Use Scientific Software? An External Replication. In Proceedings of 25th IEEE International Conference on Software Analysis, Evolution and Reengineering. 582–591. https://doi.org/10.1109/SANER.2018.8330263
- Prabhu et al. (2011) Prakash Prabhu, Thomas B. Jablin, Arun Raman, Yun Zhang, Jialu Huang, Hanjun Kim, Nick P. Johnson, Feng Liu, Soumyadeep Ghosh, Stephen Beard, Taewook Oh, Matthew Zoufaly, David Walker, and David I. August. 2011. A Survey of the Practice of Computational Science (SC ’11). Association for Computing Machinery, New York, NY, USA, Article 19, 12 pages. https://doi.org/10.1145/2063348.2063374
- Prana et al. (2018) Gede Artha Azriadi Prana, Christoph Treude, Ferdian Thung, Thushari Atapattu, and David Lo. 2018. Categorizing the Content of GitHub README Files. arXiv:1802.06997 [cs.SE]
- Prior et al. (2017) F. Prior, Kirk Smith, Ashish Sharma, Justin Kirby, Lawrence Tarbox, Ken Clark, William Bennett, Tracy Nolan, and John Freymann. 2017. The public cancer radiology imaging collections of The Cancer Imaging Archive. Scientific Data 4 (09 2017), sdata2017124. https://doi.org/10.1038/sdata.2017.124
- Professional Engineers Act (2021) Professional Engineers Act. 2021. Professional Engineers Act, RSO 1990, c P. 28. https://canlii.ca/t/5568z.
- Project (2006) The Linux Information Project. 2006. Freeware Definition. http://www.linfo.org/freeware.html. [Online; accessed 20-May-2021].
- Püschel et al. (2001) Markus Püschel, Bryan Singer, Manuela Veloso, and José M. F. Moura. 2001. Fast Automatic Generation of DSP Algorithms. In International Conference on Computational Science (ICCS) (Lecture Notes In Computer Science, Vol. 2073). Springer, 97–106.
- Research Imaging Institute (2019) UTHSCSA Research Imaging Institute. 2019. Papaya. https://github.com/rii-mango/Papaya. [Online; accessed 27-May-2021].
- Rigby and Bird (2013) Peter C. Rigby and Christian Bird. 2013. Convergent Contemporary Software Peer Review Practices. In Proceedings of the 2013 9th Joint Meeting on Foundations of Software Engineering (Saint Petersburg, Russia) (ESEC/FSE 2013). Association for Computing Machinery, New York, NY, USA, 202–212. https://doi.org/10.1145/2491411.2491444
- Rinehart et al. (2015) David J. Rinehart, John C. Knight, and Jonathan Rowanhill. 2015. Current Practices in Constructing and Evaluating Assurance Cases with Applications to Aviation. Technical Report CR-2014-218678. National Aeronautics and Space Administration (NASA), Langley Research Centre, Hampton, Virginia.
- Robertson and Robertson (1999) Suzanne Robertson and James Robertson. 1999. Mastering the Requirements Process. ACM Press/Addison-Wesley Publishing Co, New York, NY, USA, Chapter Volere Requirements Specification Template, 353–391.
- Roduit (2021) Nicolas Roduit. 2021. Weasis. https://github.com/nroduit/nroduit.github.io. [Online; accessed 27-May-2021].
- Rokicki and Laniewski-Wollk (2016) J. Rokicki and L. Laniewski-Wollk. 2016. Adjoint lattice Boltzmann for topology optimization on multi-GPU architecture. Computers & Mathematics with Applications 71, 3 (2016), 833–848.
- Rueden et al. (2017) Curtis Rueden, Johannes Schindelin, Mark Hiner, Barry Dezonia, Alison Walter, and Kevin Eliceiri. 2017. ImageJ2: ImageJ for the next generation of scientific image data. BMC Bioinformatics 18 (11 2017). https://doi.org/10.1186/s12859-017-1934-z
- Runeson and Höst (2009) Per Runeson and Martin Höst. 2009. Guidelines for conducting and reporting case study research in software engineering. Empirical Software Engineering 14, 2 (19 Dec 2009), 131–164. https://doi.org/10.1007/s10664-008-9102-8
- Saaty (1990) Thomas L. Saaty. 1990. How to make a decision: The analytic hierarchy process. European Journal of Operational Research 48, 1 (1990), 9–26. https://doi.org/10.1016/0377-2217(90)90057-I Desicion making by the analytic hierarchy process: Theory and applications.
- Sadowski et al. (2018) Caitlin Sadowski, Emma Söderberg, Luke Church, Michal Sipko, and Alberto Bacchelli. 2018. Modern code review: a case study at google. In Proceedings of the 40th International Conference on Software Engineering: Software Engineering in Practice. 181–190.
- Samala (2014) Ravi Samala. 2014. Can anyone suggest free software for medical images segmentation and volume? https://www.researchgate.net/post/Can_anyone_suggest_free_software_for_medical_images_segmentation_and_volume. [Online; accessed 31-January-2020].
- Sanders and Kelly (2008) Rebecca Sanders and Diane Kelly. 2008. Dealing with Risk in Scientific Software Development. IEEE Software 4 (July/August 2008), 21–28.
- SARL (2019) Pixmeo SARL. 2019. OsiriX Lite. https://github.com/pixmeo/osirix. [Online; accessed 27-May-2021].
- Schindelin et al. (2012) Johannes Schindelin, Ignacio Arganda-Carreras, Erwin Frise, Verena Kaynig, Mark Longair, Tobias Pietzsch, Stephan Preibisch, Curtis Rueden, Stephan Saalfeld, Benjamin Schmid, Jean-Yves Tinevez, Daniel White, Volker Hartenstein, Kevin Eliceiri, Pavel Tomancak, and Albert Cardona. 2012. Fiji: An Open-Source Platform for Biological-Image Analysis. Nature methods 9 (06 2012), 676–82. https://doi.org/10.1038/nmeth.2019
- Schlauch et al. (2018) Tobias Schlauch, Michael Meinel, and Carina Haupt. 2018. DLR Software Engineering Guidelines. https://doi.org/10.5281/zenodo.1344612
- Schroeder et al. (2006) Will Schroeder, Bill Lorensen, and Ken Martin. 2006. The visualization toolkit. Kitware.
- Segal (2005) Judith Segal. 2005. When Software Engineers Met Research Scientists: A Case Study. Empirical Software Engineering 10, 4 (Oct. 2005), 517–536. https://doi.org/10.1007/s10664-005-3865-y
- Segal and Morris (2008) Judith Segal and Chris Morris. 2008. Developing Scientific Software. IEEE Software 25, 4 (July/August 2008), 18–20.
- Shahin et al. (2017) Mojtaba Shahin, Muhammad Ali Babar, and Liming Zhu. 2017. Continuous Integration, Delivery and Deployment: A Systematic Review on Approaches, Tools, Challenges and Practices. IEEE Access 5 (2017), 3909–3943. https://doi.org/10.1109/ACCESS.2017.2685629
- Singh et al. (2021) Vandana Singh, Brice Bongiovanni, and William Brandon. 2021. Codes of conduct in Open Source Software—for warm and fuzzy feelings or equality in community? Software Quality Journal (2021). https://doi.org/10.1007/s11219-020-09543-w
- Slaughter et al. (2021) Andrew Slaughter, Cody Permann, Jason Miller, Brian Alger, and Stephen Novascone. 2021. Continuous Integration, In-Code Documentation, and Automation for Nuclear Quality Assurance Conformance. Nuclear Technology 207 (01 2021), 1–8. https://doi.org/10.1080/00295450.2020.1826804
- Smirniotopoulos (2014) James Smirniotopoulos. 2014. MedPix Medical Image Database. https://doi.org/10.13140/2.1.3403.3608
- Smith et al. (2018a) Barry Smith, Roscoe Bartlett, and xSDK Developers. 2018a. xSDK Community Package Policies. https://doi.org/10.6084/m9.figshare.4495136.v6
- Smith et al. (2020a) Spencer Smith, Jacques Carette, Olu Owojaiye, Peter Michalski, and Ao Dong. 2020a. Quality Definitions of Qualities. (2020). Manuscript in preparation.
- Smith and Michalski (2022) Spencer Smith and Peter Michalski. 2022. Digging Deeper Into the State of the Practice for Domain Specific Research Software. In Proceedings of the International Conference on Computational Science, ICCS. 1–15.
- Smith et al. (2024) Spencer Smith, Peter Michalski, Jacques Carette, and Zahra Keshavarz-Motamed. 2024. State of the Practice for Lattice Boltzmann Method Software. Archives of Computational Methods in Engineering 31, 1 (Jan 2024), 313–350. https://doi.org/10.1007/s11831-023-09981-2
- Smith et al. (2018c) Spencer Smith, Yue Sun, and Jacques Carette. 2018c. Statistical Software for Psychology: Comparing Development Practices Between CRAN and Other Communities. arXiv:1802.07362 [cs.SE]
- Smith et al. (2018e) Spencer Smith, Zheng Zeng, and Jacques Carette. 2018e. Seismology software: state of the practice. Journal of Seismology 22 (05 2018). https://doi.org/10.1007/s10950-018-9731-3
- Smith (2016) W. Spencer Smith. 2016. A Rational Document Driven Design Process for Scientific Computing Software. In Software Engineering for Science, Jeffrey C. Carver, Neil Chue Hong, and George Thiruvathukal (Eds.). Taylor & Francis, Chapter Section I – Examples of the Application of Traditional Software Engineering Practices to Science, 33–63.
- Smith (2018) W. Spencer Smith. 2018. Beyond Software Carpentry. In 2018 International Workshop on Software Engineering for Science (held in conjunction with ICSE’18). 1–8.
- Smith and Carette (2021) W. Spencer Smith and Jacques Carette. 2021. Sustainable Software via Generation. In Proceedings of the 1st Annual Booth Resource and Innovation Cluster (BRIC) Symposium. 21.
- Smith et al. (2021) W. Spencer Smith, Jacques Carette, Peter Michalski, Ao Dong, and Oluwaseun Owojaiye. 2021. Methodology for Assessing the State of the Practice for Domain X. https://arxiv.org/abs/2110.11575.
- Smith and Koothoor (2016) W. Spencer Smith and Nirmitha Koothoor. 2016. A Document-Driven Method for Certifying Scientific Computing Software for Use in Nuclear Safety Analysis. Nuclear Engineering and Technology 48, 2 (April 2016), 404–418. https://doi.org/10.1016/j.net.2015.11.008
- Smith et al. (2007) W. Spencer Smith, Lei Lai, and Ridha Khedri. 2007. Requirements Analysis for Engineering Computation: A Systematic Approach for Improving Software Reliability. Reliable Computing, Special Issue on Reliable Engineering Computation 13, 1 (Feb. 2007), 83–107. https://doi.org/10.1007/s11155-006-9020-7
- Smith et al. (2016a) W. Spencer Smith, Adam Lazzarato, and Jacques Carette. 2016a. State of Practice for Mesh Generation Software. Advances in Engineering Software 100 (Oct. 2016), 53–71.
- Smith et al. (2018b) W. Spencer Smith, Adam Lazzarato, and Jacques Carette. 2018b. State of the Practice for GIS Software. arXiv:1802.03422 [cs.SE]
- Smith et al. (2016b) W Spencer Smith, D Adam Lazzarato, and Jacques Carette. 2016b. State of the practice for mesh generation and mesh processing software. Advances in Engineering Software 100 (2016), 53–71.
- Smith et al. (2020b) W. Spencer Smith, Mojdeh Sayari Nejad, and Alan Wassyng. 2020b. Raising the Bar: Assurance Cases for Scientific Computing Software. Computing in Science and Engineering 23, 1 (Feb. 2020), 47–57.
- Smith et al. (2018d) W. Spencer Smith, Yue Sun, and Jacques Carette. 2018d. Statistical Software for Psychology: Comparing Development Practices Between CRAN and Other Communities. https://arxiv.org/abs/1802.07362. 33 pp..
- Smith and Yu (2009) W. Spencer Smith and Wen Yu. 2009. A Document Driven Methodology for Improving the Quality of a Parallel Mesh Generation Toolbox. Advances in Engineering Software 40, 11 (Nov. 2009), 1155–1167. https://doi.org/10.1016/j.advengsoft.2009.05.003
- SourceLevel (2022) SourceLevel. 2022. What is a linter and why your team should use it? https://sourcelevel.io/blog/what-is-a-linter-and-why-your-team-should-use-it.
- Spriggs (2012) John Spriggs. 2012. GSN - The Goal Structuring Notation. Springer-Verlag, London.
- Stewart et al. (2017) Graeme Stewart et al. 2017. A Roadmap for HEP Software and Computing R&D for the 2020s. arXiv (2017). arXiv:1712.06982 [physics.comp-ph]
- Storer (2017) Tim Storer. 2017. Bridging the Chasm: A Survey of Software Engineering Practice in Scientific Programming. ACM Comput. Surv. 50, 4, Article 47 (Aug. 2017), 32 pages. https://doi.org/10.1145/3084225
- Szulik (2017) Keenan Szulik. 2017. Don’t judge a project by its GitHub stars alone. https://blog.tidelift.com/dont-judge-a-project-by-its-github-stars-alone.
- Szymczak et al. (2016) Daniel Szymczak, W. Spencer Smith, and Jacques Carette. 2016. Position Paper: A Knowledge-Based Approach to Scientific Software Development. In Proceedings of SE4Science’16 in conjunction with the International Conference on Software Engineering (ICSE). In conjunction with ICSE 2016, Austin, Texas, United States. 4 pp..
- TESCAN (2020) TESCAN. 2020. 3DimViewer. https://bitbucket.org/3dimlab/3dimviewer/src/master/. [Online; accessed 27-May-2021].
- Thiel (2020) Carsten Thiel. 2020. EURISE Network Technical Reference. https://technical-reference.readthedocs.io/en/latest/.
- Tourani et al. (2017) Parastou Tourani, Bram Adams, and Alexander Serebrenik. 2017. Code of conduct in open source projects. In 2017 IEEE 24th International Conference on Software Analysis, Evolution and Reengineering (SANER). 24–33. https://doi.org/10.1109/SANER.2017.7884606
- USGS (2019) USGS. 2019. USGS (United States Geological Survey) Software Plannning Checklist. https://www.usgs.gov/media/files/usgs-software-planning-checklist.
- Vähäniitty et al. (2002) Jarno Vähäniitty, Casper Lassenius, and Kristian Rautiainen. 2002. An Approach to Product Roadmapping in Small Software Product Businesses. University of Technologie, Software Business and Engineering Institute, Helsinki, Finland.
- Vaidya and Kumar (2006) Omkarprasad S. Vaidya and Sushil Kumar. 2006. Analytic hierarchy process: An overview of applications. European Journal of Operational Research 169, 1 (2006), 1–29. https://doi.org/10.1016/j.ejor.2004.04.028
- van Gompel et al. (2016) Maarten van Gompel, Jauco Noordzij, Reinier de Valk, and Andrea Scharnhorst. 2016. Guidelines for Software Quality, CLARIAH Task Force 54.100. https://github.com/CLARIAH/software-quality-guidelines/blob/master/softwareguidelines.pdf.
- van Vliet (2000) Hans van Vliet. 2000. Software Engineering (2nd ed.): Principles and Practice. John Wiley & Sons, Inc., New York, NY, USA.
- Veldhuizen (1998) Todd. L. Veldhuizen. 1998. Arrays in Blitz++. In Proceedings of the 2nd International Scientific Computing in Object-Oriented Parallel Environments (ISCOPE’98), Lecture Notes in Computer Science. Springer-Verlag.
- Wang et al. (2017) Xiaosong Wang, Yifan Peng, Le Lu, Zhiyong Lu, Mohammadhadi Bagheri, and Ronald Summers. 2017. ChestX-ray8: Hospital-scale Chest X-ray Database and Benchmarks on Weakly-Supervised Classification and Localization of Common Thorax Diseases. arXiv:1705.02315 (05 2017).
- Ward (2000) B. Douglas Ward. 2000. Program 3dfim+. Biophysics Research Institute, Medical College of Wisconsin. https://afni.nimh.nih.gov/afni/doc/manual/3dfim+.pdf
- Wassyng et al. (2015) Alan Wassyng, Neeraj Kumar Singh, Mischa Geven, Nicholas Proscia, Hao Wang, Mark Lawford, and Tom Maibaum. 2015. Can Product-Specific Assurance Case Templates Be Used as Medical Device Standards? IEEE Design & Test 32, 5 (2015), 45–55. https://doi.org/10.1109/MDAT.2015.2462720
- Whaley et al. (2001) R. C. Whaley, A. Petitet, and J. J. Dongarra. 2001. Automated empirical optimization of software and the ATLAS project. Parallel Comput. 27, 1–2 (2001), 3–35.
- Whitehouse (2018) Ross Whitehouse. 2018. Setting up ESLint in React. https://medium.com/@RossWhitehouse/setting-up-eslint-in-react-c20015ef35f7.
- Wiese et al. (2019) I. S. Wiese, I. Polato, and G. Pinto. 2019. Naming the Pain in Developing Scientific Software. IEEE Software (2019), 1–1. https://doi.org/10.1109/MS.2019.2899838
- Wikipedia (2022) Wikipedia. 2022. Lint (software). https://en.wikipedia.org/wiki/Lint_(software).
- Wikipedia contributors (2021a) Wikipedia contributors. 2021a. Fault injection — Wikipedia, The Free Encyclopedia. https://en.wikipedia.org/w/index.php?title=Fault_injection&oldid=1039005082 [Online; accessed 28-August-2021].
- Wikipedia contributors (2021b) Wikipedia contributors. 2021b. Fuzzing — Wikipedia, The Free Encyclopedia. https://en.wikipedia.org/w/index.php?title=Fuzzing&oldid=1039424308 [Online; accessed 28-August-2021].
- Wikipedia contributors (2021c) Wikipedia contributors. 2021c. Medical image computing — Wikipedia, The Free Encyclopedia. https://en.wikipedia.org/w/index.php?title=Medical_image_computing&oldid=1034877594 [Online; accessed 25-July-2021].
- Wikipedia contributors (2021d) Wikipedia contributors. 2021d. Medical imaging — Wikipedia, The Free Encyclopedia. https://en.wikipedia.org/w/index.php?title=Medical_imaging&oldid=1034887445 [Online; accessed 25-July-2021].
- Wilson et al. (2014) Greg Wilson, D. A. Aruliah, C. Titus Brown, Neil P. Chue Hong, Matt Davis, Richard T. Guy, Steven H. D. Haddock, Kathryn D. Huff, Ian M. Mitchell, Mark D. Plumbley, Ben Waugh, Ethan P. White, and Paul Wilson. 2014. Best Practices for Scientific Computing. PLoS Biol 12, 1 (Jan. 2014), e1001745. https://doi.org/10.1371/journal.pbio.1001745
- Wilson et al. (2016) Greg Wilson, Jennifer Bryan, Karen Cranston, Justin Kitzes, Lex Nederbragt, and Tracy K. Teal. 2016. Good Enough Practices in Scientific Computing. CoRR abs/1609.00037 (2016). http://arxiv.org/abs/1609.00037
- Wilson (2006) Gregory V. Wilson. 2006. Where’s the Real Bottleneck in Scientific Computing? Scientists would do well to pick some tools widely used in the software industry. American Scientist 94, 1 (2006). http://www.americanscientist.org/issues/pub/wheres-the-real-bottleneck-in-scientific-computing
- Wollny (2020) Gert Wollny. 2020. Ginkgo CADx. https://github.com/gerddie/ginkgocadx. [Online; accessed 27-May-2021].
- Yushkevich et al. (2006) Paul A. Yushkevich, Joseph Piven, Heather Cody Hazlett, Rachel Gimpel Smith, Sean Ho, James C. Gee, and Guido Gerig. 2006. User-Guided 3D Active Contour Segmentation of Anatomical Structures: Significantly Improved Efficiency and Reliability. Neuroimage 31, 3 (2006), 1116–1128.
- Zadka (2018) Moshe Zadka. 2018. How to open source your Python library. https://opensource.com/article/18/12/tips-open-sourcing-python-libraries.
- Zhang et al. (2008) Xiaofeng Zhang, Nadine Smith, and Andrew Webb. 2008. 1 - Medical Imaging. In Biomedical Information Technology, David Dagan Feng (Ed.). Academic Press, Burlington, 3–27. https://doi.org/10.1016/B978-012373583-6.50005-0
- Ziegler et al. (2020) Erik Ziegler, Trinity Urban, Danny Brown, James Petts, Steve D. Pieper, Rob Lewis, Chris Hafey, and Gordon J. Harris. 2020. Open Health Imaging Foundation Viewer: An Extensible Open-Source Framework for Building Web-Based Imaging Applications to Support Cancer Research. JCO Clinical Cancer Informatics 4 (2020), 336–345. https://doi.org/10.1200/CCI.19.00131 arXiv:https://doi.org/10.1200/CCI.19.00131 PMID: 32324447.