Rare Beauty and Charm Decays

Angel Campoverde on Behalf of the LHCb Collaboration University of the Chinese Academy of Sciences,
19A Yuquan Road, Beijing, China
Abstract

There are two main ways of looking for new physics, direct searches and precision measurements. The latter are sensitive to a broader spectrum of models; they also can be sensitive to higher energy scales than what can be reached through direct searches. We will provide an update of several precision measurements carried out by the LHCb collaboration. In particular, we will show the measurement of Rϕ​π(s)superscriptsubscript𝑅italic-Ο•πœ‹π‘ R_{\phi\pi}^{(s)}, the search for Bc+β†’Ο€+​μ+β€‹ΞΌβˆ’β†’superscriptsubscript𝐡𝑐superscriptπœ‹superscriptπœ‡superscriptπœ‡B_{c}^{+}\to\pi^{+}\mu^{+}\mu^{-} and Bsβ†’ΞΌ+β€‹ΞΌβˆ’β€‹Ξ³β†’subscript𝐡𝑠superscriptπœ‡superscriptπœ‡π›ΎB_{s}\to\mu^{+}\mu^{-}\gamma and an amplitude analysis of the Ξ›b0β†’p​Kβˆ’β€‹Ξ³β†’superscriptsubscriptΛ𝑏0𝑝superscript𝐾𝛾\Lambda_{b}^{0}\to pK^{-}\gamma decay.

1 Introduction

LHCb is one of the experiments at CERN and its main goals include the study of beauty and charm decays. The measurements in the following sections use proton-proton collision data collected from 2011 to 2018 at 7 TeV, 8 TeV and 13 TeV, amounting in total to 9 fb-1. Although not every analysis uses the whole dataset.

Rare decays are a powerful tool that can be used to search for new physics. They benefit from both a low Standard Model background and from the partial cancellation of systematic effects, due to the fact that the observables are measured as ratios of correlated quantities. On the other hand, an anomaly’s interpretation as new physics is not as straightforward as the presence of an excess in a mass spectrum would be in a direct search. Despite the partial cancellation of systematic effects, these measurements require a superb knowledge of detector effects. Extensive and detailed calibration studies need to be carried out in order to access these observables.

2 Measurement of ℬ​(Ο•β†’ΞΌ+β€‹ΞΌβˆ’)/ℬ​(Ο•β†’e+​eβˆ’)ℬ→italic-Ο•superscriptπœ‡superscriptπœ‡β„¬β†’italic-Ο•superscript𝑒superscript𝑒\mathcal{B}(\phi\to\mu^{+}\mu^{-})/\mathcal{B}(\phi\to e^{+}e^{-})

This analysis measures the ratio of branching ratios for D(s)+β†’Ο€+​ϕ​(β„“+β€‹β„“βˆ’)β†’superscriptsubscript𝐷𝑠superscriptπœ‹italic-Ο•superscriptβ„“superscriptβ„“D_{(s)}^{+}\to\pi^{+}\phi(\ell^{+}\ell^{-}) decays between the final states with muons and electrons, normalized by the B+β†’K+​J/ψ(β†’β„“+β€‹β„“βˆ’)β†’superscript𝐡annotatedsuperscriptπΎπ½πœ“β†’absentsuperscriptβ„“superscriptβ„“B^{+}\to K^{+}J/\psi(\to\ell^{+}\ell^{-}) decay:

Rϕ​π(s)=ℬ​(D(s)+β†’Ο€+​ϕ​(ΞΌ+β€‹ΞΌβˆ’))ℬ​(D(s)+β†’Ο€+​ϕ​(e+​eβˆ’))/ℬ​(B+β†’K+​J/ψ(β†’ΞΌ+β€‹ΞΌβˆ’))ℬ​(B+β†’K+​J/ψ(β†’e+​eβˆ’)).superscriptsubscript𝑅italic-Ο•πœ‹π‘ β„¬β†’superscriptsubscript𝐷𝑠superscriptπœ‹italic-Ο•superscriptπœ‡superscriptπœ‡β„¬β†’superscriptsubscript𝐷𝑠superscriptπœ‹italic-Ο•superscript𝑒superscript𝑒ℬ→superscript𝐡annotatedsuperscriptπΎπ½πœ“β†’absentsuperscriptπœ‡superscriptπœ‡β„¬β†’superscript𝐡annotatedsuperscriptπΎπ½πœ“β†’absentsuperscript𝑒superscript𝑒R_{\phi\pi}^{(s)}=\frac{\mathcal{B}(D_{(s)}^{+}\to\pi^{+}\phi(\mu^{+}\mu^{-}))}{\mathcal{B}(D_{(s)}^{+}\to\pi^{+}\phi(e^{+}e^{-}))}\Bigg{/}\frac{\mathcal{B}(B^{+}\to K^{+}J/\psi(\to\mu^{+}\mu^{-}))}{\mathcal{B}(B^{+}\to K^{+}J/\psi(\to e^{+}e^{-}))}.

Given that ϕ​(1020)β†’β„“+β€‹β„“βˆ’β†’italic-Ο•1020superscriptβ„“superscriptβ„“\phi(1020)\to\ell^{+}\ell^{-} and J/Οˆβ†’β„“+β€‹β„“βˆ’β†’π½πœ“superscriptβ„“superscriptβ„“J/\psi\to\ell^{+}\ell^{-} are dominated by the electromagnetic interaction, it is expected that both the branching fraction ratio involving D(s)+superscriptsubscript𝐷𝑠D_{(s)}^{+} and the one involving B+superscript𝐡B^{+} decays be unity. The B+superscript𝐡B^{+} decays are also used to extract corrections to simulation that will be applied to the D(s)+superscriptsubscript𝐷𝑠D_{(s)}^{+} decays. This study is aimed at confirming the portability of the corrections from the q2superscriptπ‘ž2q^{2} bin 111q2superscriptπ‘ž2q^{2} will be defined, from now on, as the square of the mass of the dilepton. associated with the J/Οˆπ½πœ“J/\psi meson to the one associated with the ϕ​(1020)italic-Ο•1020\phi(1020) meson. Thus, the usage of the B+superscript𝐡B^{+} decay for normalization purposes would serve to reduce biases in the calibration.

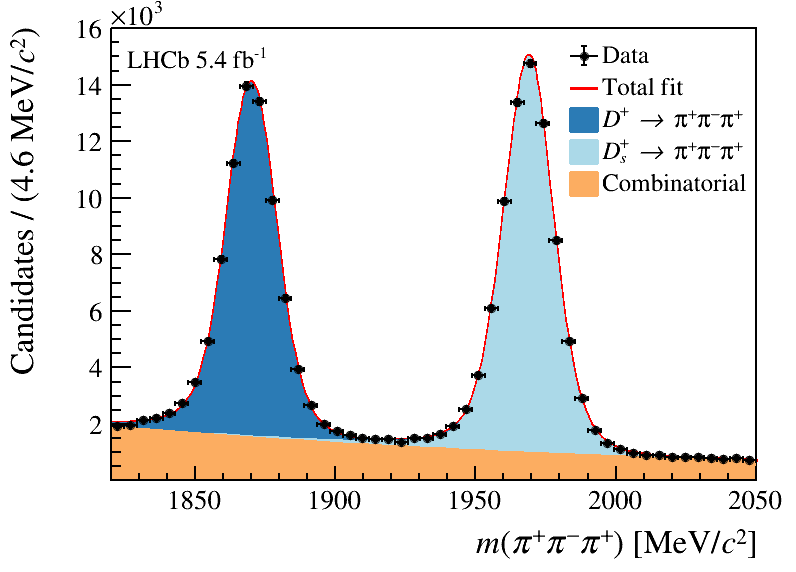
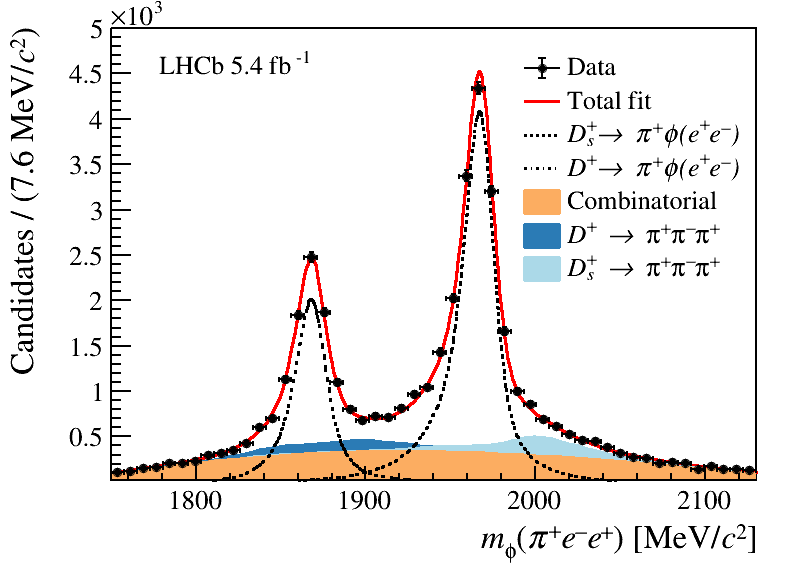
Given the soft nature of the leptons in this study, the trigger efficiency would be too low if the analysis would target events triggered by only the signal leptons. Therefore, also events triggered by the pion and any object not associated with the signal candidate are used. The measurement of the branching fractions requires extracting the yields through fits to the D(s)+superscriptsubscript𝐷𝑠D_{(s)}^{+}-candidate invariant mass distribution. The leptons in this analysis originate from an intermediate resonance, the ϕ​(1020)italic-Ο•1020\phi(1020) meson. Therefore, it is possible to use a mass constraint around its PDG[10] value to improve the resolution of the D(s)+superscriptsubscript𝐷𝑠D_{(s)}^{+} candidate’s mass.

2.1 Background estimation

The main backgrounds are D+β†’Kβ†’e++​π→eβˆ’βˆ’β€‹Ο€+β†’superscript𝐷subscriptsuperscript𝐾→absentsuperscript𝑒subscriptsuperscriptπœ‹β†’absentsuperscript𝑒superscriptπœ‹D^{+}\to K^{+}_{\to e^{+}}\pi^{-}_{\to e^{-}}\pi^{+} and D+β†’Ο€β†’e++​π→eβˆ’βˆ’β€‹Ο€+β†’superscript𝐷subscriptsuperscriptπœ‹β†’absentsuperscript𝑒subscriptsuperscriptπœ‹β†’absentsuperscript𝑒superscriptπœ‹D^{+}\to\pi^{+}_{\to e^{+}}\pi^{-}_{\to e^{-}}\pi^{+} decays 222Here the subscript xβ†’esubscriptπ‘₯β†’absent𝑒x_{\to e} symbolizes a particle xπ‘₯x that has been reconstructed as an electron.. In the former case, the background is reduced by assigning to the electrons the K+superscript𝐾K^{+} and Ο€βˆ’superscriptπœ‹\pi^{-} mass hypotheses and then applying a veto around the mass of the D+superscript𝐷D^{+}. In the latter case, the reduction happens by using particle identification (PID) requirements; however this background cannot be ignored in the fit, thus one needs to model it. For that reason, a control region is built by inverting the PID requirements on the electrons, as shown in FigΒ 1(a). From this control region, the shape of the background is extrapolated to the signal region. Additionally, the combinatorial background is modelled in the fit for both the electron and the muon channels. In the electron channel, the mass constraint on the dielectron is responsible for a warping of the normally exponential shape, thus a third degree polynomial is used to fit this component.

Refer to caption
(a)
Refer to caption
(b)
Figure 1: On the left, fit to misID backgrounds in a PID inverted control region. On the right, fit to the signal region in the electron channel.

2.2 Systematics and results

The fit to the signal region in the electron channel can be seen in figureΒ 1(b). The main systematics in this analysis stem from the simulation’s modelling of the detector occupancy and the q2superscriptπ‘ž2q^{2} resolution. Both of these quantities are studied with simulation, corrected using collision data from the normalization mode. However, these corrections do not allow a full cancellation of the systematics, given the difference in the kinematics of the signal and normalization modes.

The values of Rϕ​πsubscript𝑅italic-Ο•πœ‹R_{\phi\pi}, measured separately with D+superscript𝐷D^{+} and Ds+superscriptsubscript𝐷𝑠D_{s}^{+} decays are:

Rϕ​πd=1.026Β±0.020​(stat)Β±0.056​(syst),superscriptsubscript𝑅italic-Ο•πœ‹π‘‘plus-or-minus1.0260.020stat0.056systR_{\phi\pi}^{d}=1.026\pm 0.020\leavevmode\nobreak\ (\text{stat})\pm 0.056\leavevmode\nobreak\ (\text{syst}),
Rϕ​πs=1.017Β±0.013​(stat)Β±0.051​(syst).superscriptsubscript𝑅italic-Ο•πœ‹π‘ plus-or-minus1.0170.013stat0.051systR_{\phi\pi}^{s}=1.017\pm 0.013\leavevmode\nobreak\ (\text{stat})\pm 0.051\leavevmode\nobreak\ (\text{syst}).

While their combination is:

Rϕ​π=1.022Β±0.012​(stat)Β±0.048​(syst).subscript𝑅italic-Ο•πœ‹plus-or-minus1.0220.012stat0.048systR_{\phi\pi}=1.022\pm 0.012\leavevmode\nobreak\ (\text{stat})\pm 0.048\leavevmode\nobreak\ (\text{syst}).

From this value, together with the measured branching fraction of Ο•β†’e+​eβˆ’β†’italic-Ο•superscript𝑒superscript𝑒\phi\to e^{+}e^{-}Β [10], the most precise measurement of the branching fraction of Ο•β†’ΞΌ+β€‹ΞΌβˆ’β†’italic-Ο•superscriptπœ‡superscriptπœ‡\phi\to\mu^{+}\mu^{-} is obtained as:

ℬ​(Ο•β†’ΞΌ+β€‹ΞΌβˆ’)=(3.045Β±0.049​(stat)Β±0.148​(syst))Γ—10βˆ’4.ℬ→italic-Ο•superscriptπœ‡superscriptπœ‡plus-or-minus3.0450.049stat0.148systsuperscript104\mathcal{B}(\phi\to\mu^{+}\mu^{-})=(3.045\pm 0.049\leavevmode\nobreak\ (\text{stat})\pm 0.148\leavevmode\nobreak\ (\text{syst}))\times 10^{-4}.

3 Measurement of RΟ€+​μ+β€‹ΞΌβˆ’/J/ψsubscript𝑅superscriptπœ‹superscriptπœ‡superscriptπœ‡π½πœ“R_{\pi^{+}\mu^{+}\mu^{-}/J/\psi} and RΟˆβ€‹(2​S)/J/ψsubscriptπ‘…πœ“2π‘†π½πœ“R_{\psi(2S)/J/\psi}

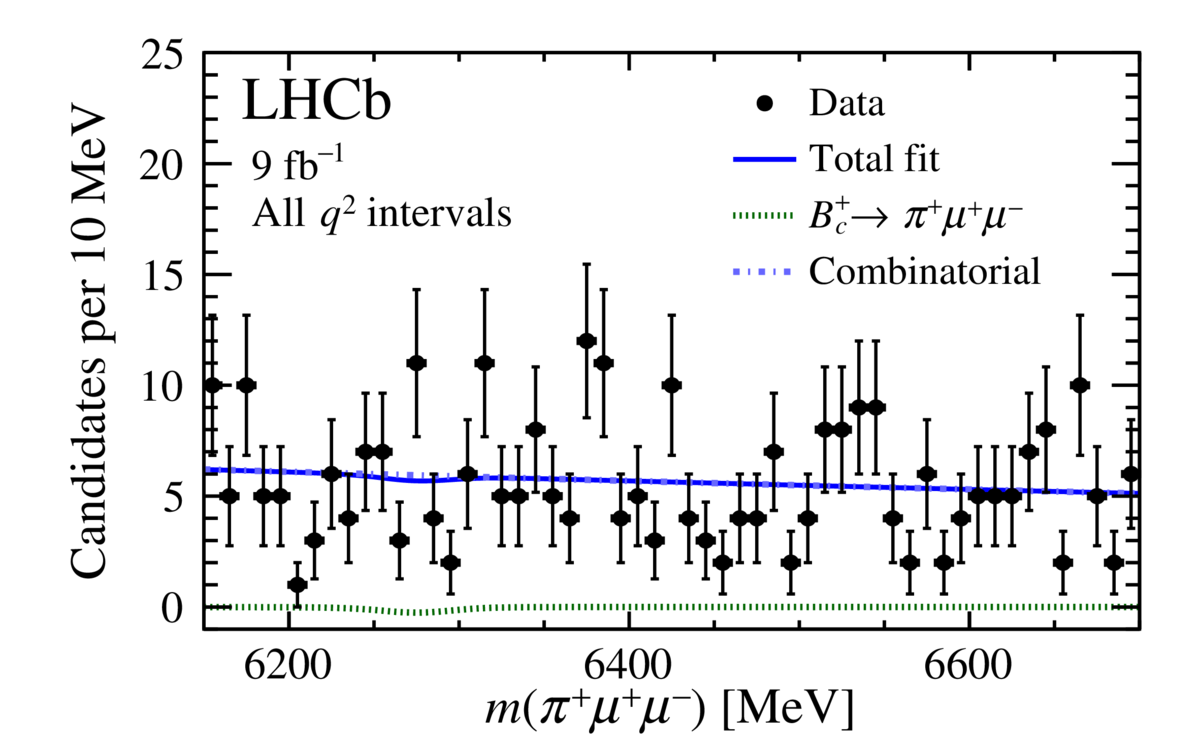
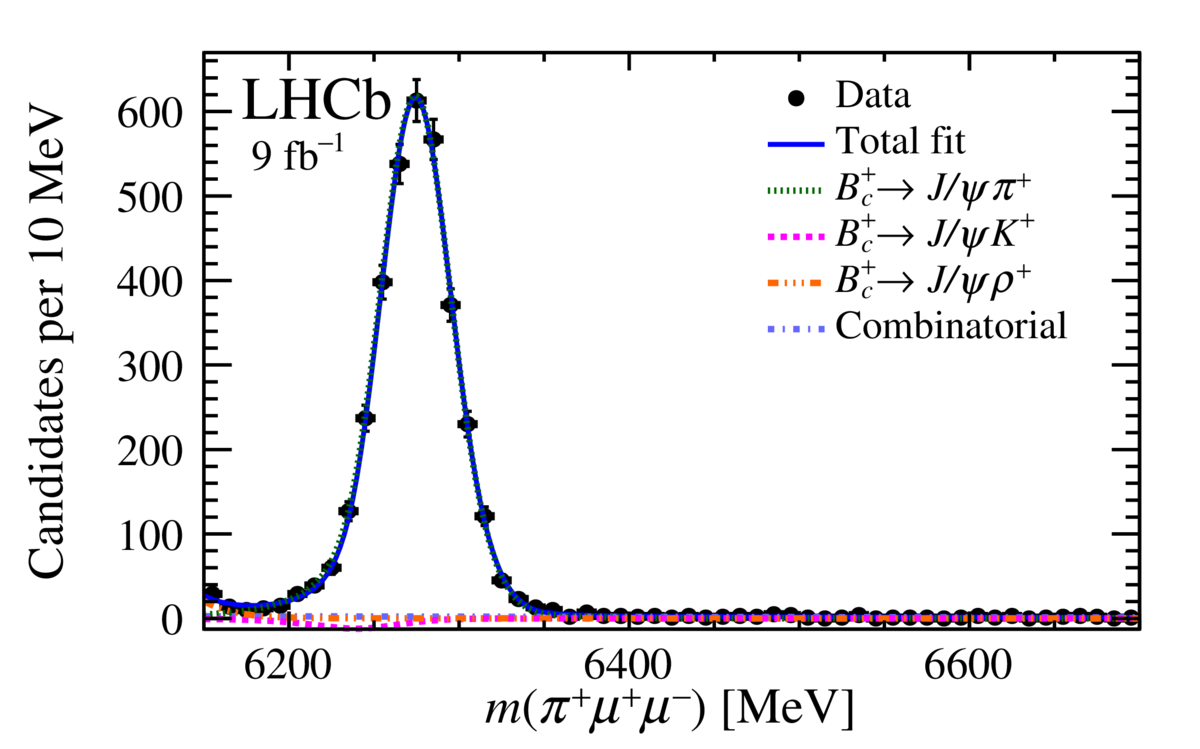
In this section we will present the first search for the non resonant decay Bc+β†’Ο€+​μ+β€‹ΞΌβˆ’β†’superscriptsubscript𝐡𝑐superscriptπœ‹superscriptπœ‡superscriptπœ‡B_{c}^{+}\to\pi^{+}\mu^{+}\mu^{-}. This search was carried out using the full 9 fb-1 of data collected by the LHCb detector. The events collected are required to have a signal muon firing the trigger. As done in the past section, this measurement profits from the use of a normalization decay, Bc+β†’Ο€+​J/ψ(β†’ΞΌ+β€‹ΞΌβˆ’)β†’superscriptsubscript𝐡𝑐annotatedsuperscriptπœ‹π½πœ“β†’absentsuperscriptπœ‡superscriptπœ‡B_{c}^{+}\to\pi^{+}J/\psi(\to\mu^{+}\mu^{-}), to partially cancel systematic effects. Thus, the quantity measured can be written as:

RΟ€+​μ+β€‹ΞΌβˆ’/J/Οˆβ‰‘β„¬β€‹(Bc+β†’Ο€+​μ+β€‹ΞΌβˆ’)ℬ(Bc+β†’J/ψ(β†’ΞΌ+ΞΌβˆ’)Ο€+).R_{\pi^{+}\mu^{+}\mu^{-}/J/\psi}\equiv\frac{\mathcal{B}(B_{c}^{+}\to\pi^{+}\mu^{+}\mu^{-})}{\mathcal{B}(B_{c}^{+}\to J/\psi(\to\mu^{+}\mu^{-})\pi^{+})}.

As a validation of the efficiencies, the normalization mode is also used to measure:

RΟˆβ€‹(2​S)/J/Οˆβ‰‘β„¬β€‹(Bc+β†’Οˆβ€‹(2​S)​π+)ℬ​(Bc+β†’J/Οˆβ€‹Ο€+).subscriptπ‘…πœ“2π‘†π½πœ“β„¬β†’superscriptsubscriptπ΅π‘πœ“2𝑆superscriptπœ‹β„¬β†’superscriptsubscriptπ΅π‘π½πœ“superscriptπœ‹R_{\psi(2S)/J/\psi}\equiv\frac{\mathcal{B}(B_{c}^{+}\to\psi(2S)\pi^{+})}{\mathcal{B}(B_{c}^{+}\to J/\psi\pi^{+})}.

The analysis is done in four bins of q2superscriptπ‘ž2q^{2} and a mass constrain on the dimuon system around the charmonium’s PDG mass is applied to measure RΟˆβ€‹(2​S)/J/ψsubscriptπ‘…πœ“2π‘†π½πœ“R_{\psi(2S)/J/\psi}. Furthermore a mass window of 50 MeV/c2absentsuperscript𝑐2/c^{2} around the charmonium is used to select the resonant modes.

3.1 Background estimation and selection

In the fit to the resonant modes, the partially reconstructed components Bc+→ρ+​μ+β€‹ΞΌβˆ’β†’superscriptsubscript𝐡𝑐superscript𝜌superscriptπœ‡superscriptπœ‡B_{c}^{+}\to\rho^{+}\mu^{+}\mu^{-}, Bc+β†’J/Οˆβ€‹Ο+β†’superscriptsubscriptπ΅π‘π½πœ“superscript𝜌B_{c}^{+}\to J/\psi\rho^{+} and Bc+β†’Οˆβ€‹(2​S)​ρ+β†’superscriptsubscriptπ΅π‘πœ“2𝑆superscript𝜌B_{c}^{+}\to\psi(2S)\rho^{+} with ρ→π+​π0β†’πœŒsuperscriptπœ‹superscriptπœ‹0\rho\to\pi^{+}\pi^{0} are included. Potential backgrounds, where double misidentification happens, like Bc+β†’Ο€+β€‹Ο€βˆ’β€‹Ο€+β†’superscriptsubscript𝐡𝑐superscriptπœ‹superscriptπœ‹superscriptπœ‹B_{c}^{+}\to\pi^{+}\pi^{-}\pi^{+} or Bc+β†’ccΒ―(β†’ΞΌβ†’Ο€++,ΞΌβˆ’)Ο€β†’ΞΌ++B_{c}^{+}\to c\bar{c}(\to\mu^{+}_{\to\pi^{+}},\mu^{-})\pi^{+}_{\to\mu^{+}} are suppressed by PID requirements. In the signal region fit, only the combinatorial background is modeled, the other backgrounds are negligible.

The selection uses a BDT trained with simulated signal events and data in the sidebands of the signal region as proxies for the signal and background respectively.

3.2 Results

Fig.Β 2 shows the fit to the signal region and the normalization dataset. As can be seen, no signal is present and therefore upper limits are set with the Feldman-Cousins approach.

Refer to caption
Refer to caption
Figure 2: Fits to the signal (left) and normalization (right) datasets.

There is no theoretical prediction for the branching fraction of Bc+β†’Ο€+​μ+β€‹ΞΌβˆ’β†’superscriptsubscript𝐡𝑐superscriptπœ‹superscriptπœ‡superscriptπœ‡B_{c}^{+}\to\pi^{+}\mu^{+}\mu^{-}, and the result of this analysis:

ℬ​(Bc+β†’Ο€+​μ+β€‹ΞΌβˆ’)ℬ​(Bc+β†’Ο€+​J/ψ)<2.1Γ—10βˆ’4,ℬ→superscriptsubscript𝐡𝑐superscriptπœ‹superscriptπœ‡superscriptπœ‡β„¬β†’superscriptsubscript𝐡𝑐superscriptπœ‹π½πœ“2.1superscript104\frac{\mathcal{B}(B_{c}^{+}\to\pi^{+}\mu^{+}\mu^{-})}{\mathcal{B}(B_{c}^{+}\to\pi^{+}J/\psi)}<2.1\times 10^{-4},

is the first upper limit for this ratio. While:

ℬ​(Bc+β†’Ο€+β€‹Οˆβ€‹(2​S))ℬ​(Bc+β†’Ο€+​J/ψ)=0.254Β±0.018​(stat)Β±0.03​(syst)Β±0.005​(BF),ℬ→superscriptsubscript𝐡𝑐superscriptπœ‹πœ“2𝑆ℬ→superscriptsubscript𝐡𝑐superscriptπœ‹π½πœ“plus-or-minus0.2540.018stat0.03syst0.005BF\frac{\mathcal{B}(B_{c}^{+}\to\pi^{+}\psi(2S))}{\mathcal{B}(B_{c}^{+}\to\pi^{+}J/\psi)}=0.254\pm 0.018\leavevmode\nobreak\ (\text{stat})\pm 0.03\leavevmode\nobreak\ (\text{syst})\pm 0.005\leavevmode\nobreak\ (\text{BF}),

is the most precise measurement to date.
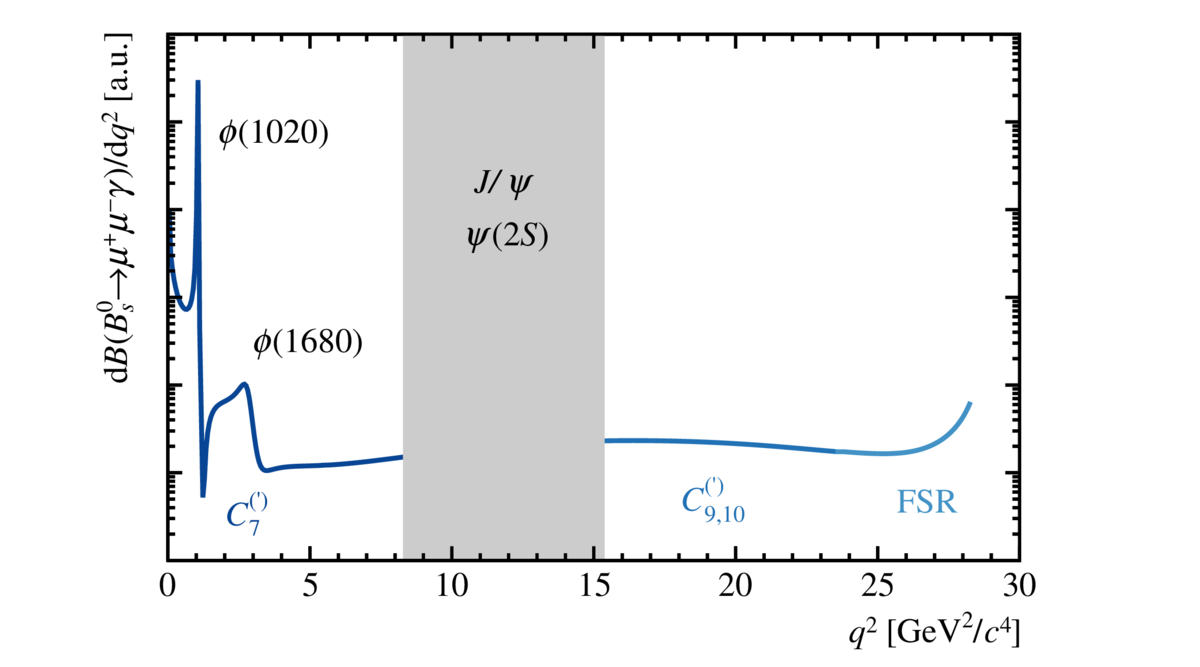
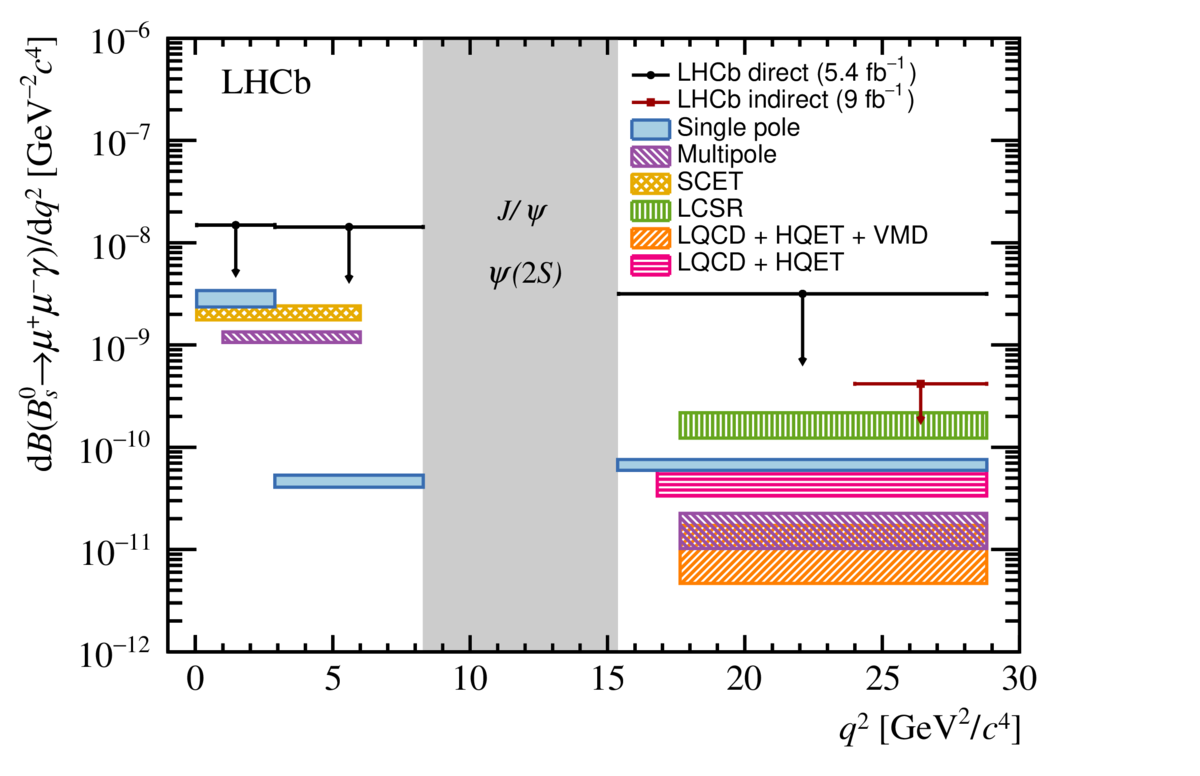
4 Search for the Bs0β†’ΞΌ+β€‹ΞΌβˆ’β€‹Ξ³β†’superscriptsubscript𝐡𝑠0superscriptπœ‡superscriptπœ‡π›ΎB_{s}^{0}\to\mu^{+}\mu^{-}\gamma decay

This search uses 5.4 fb-1 of data collected at s=13𝑠13\sqrt{s}=13 TeV. The measurement uses events in which either the candidate’s decay products or particles not associated with the candidate fire the trigger. Unlike in Bs0β†’ΞΌ+β€‹ΞΌβˆ’β†’superscriptsubscript𝐡𝑠0superscriptπœ‡superscriptπœ‡B_{s}^{0}\to\mu^{+}\mu^{-}, the presence of the photon allows the dimuon invariant mass to go lower; this in turn allows to explore the operators π’ͺ7(β€²)\mathcal{O}_{7}^{(^{\prime})}, π’ͺ9,10(β€²)\mathcal{O}_{9,10}^{(^{\prime})}, π’ͺ1,2subscriptπ’ͺ12\mathcal{O}_{1,2} and π’ͺ9,10(β€²)\mathcal{O}_{9,10}^{(^{\prime})}. The regions where the analysis is sensitive to different operators are shown inΒ Fig.3(a). The presence of the photon also lifts the chiral suppression present in Bs0β†’ΞΌ+β€‹ΞΌβˆ’β†’superscriptsubscript𝐡𝑠0superscriptπœ‡superscriptπœ‡B_{s}^{0}\to\mu^{+}\mu^{-}, such that both decays have branching fractions at the same order of magnitude.

Upper limits of:

ℬ​(Bs0β†’ΞΌ+β€‹ΞΌβˆ’β€‹Ξ³)<2β‹…10βˆ’9,ℬ→superscriptsubscript𝐡𝑠0superscriptπœ‡superscriptπœ‡π›Ύβ‹…2superscript109\mathcal{B}(B_{s}^{0}\to\mu^{+}\mu^{-}\gamma)<2\cdot 10^{-9},

at 95% confidence level have been already set byΒ [7] for which this process is a partially reconstructed background and where the photon was not reconstructed; also it is limited to m​(ΞΌ+,ΞΌβˆ’)>4.9​GeV/c2π‘šsuperscriptπœ‡superscriptπœ‡4.9GeVsuperscript𝑐2m(\mu^{+},\mu^{-})>4.9\,\text{GeV}/c^{2}. However this is the first dedicated search for this decay. As was done in the last section, this analysis also carries out the search in bins of q2superscriptπ‘ž2q^{2} as shown in tableΒ 1. The results are obtained with and without a veto around the ϕ​(1020)italic-Ο•1020\phi(1020) mass.

Table 1: Mass range definition, predicted branching fraction, and the expected fraction of signal yield in the different q2superscriptπ‘ž2q^{2} bins.
q2superscriptπ‘ž2q^{2} bin I II III
q2superscriptπ‘ž2q^{2} [ GeV/2c2{}^{2}/c^{2}] [4​mΞΌ2,2.89]4superscriptsubscriptπ‘šπœ‡22.89[4m_{\mu}^{2},2.89] [2.89,8.29]2.898.29[2.89,8.29] [15.37,mBs2]15.37superscriptsubscriptπ‘šsubscript𝐡𝑠2[15.37,m_{B_{s}}^{2}]
m​(ΞΌ+,ΞΌβˆ’)π‘šsuperscriptπœ‡superscriptπœ‡m(\mu^{+},\mu^{-}) [ GeV/c2absentsuperscript𝑐2{}/c^{2}] [2​mΞΌ,1.70]2subscriptπ‘šπœ‡1.70[2m_{\mu},1.70] [1.70,2.88]1.702.88[1.70,2.88] [3.92,mBs]3.92subscriptπ‘šsubscript𝐡𝑠[3.92,m_{B_{s}}]
1010×ℬ​(Bsβ†’ΞΌ+β€‹ΞΌβˆ’β€‹Ξ³)superscript1010ℬ→subscript𝐡𝑠superscriptπœ‡superscriptπœ‡π›Ύ10^{10}\times\mathcal{B}(B_{s}\to\mu^{+}\mu^{-}\gamma) 82Β±15plus-or-minus821582\pm 15 2.54Β±0.34plus-or-minus2.540.342.54\pm 0.34 9.1Β±1.1plus-or-minus9.11.19.1\pm 1.1
Fraction of Bsβ†’ΞΌ+β€‹ΞΌβˆ’β€‹Ξ³β†’subscript𝐡𝑠superscriptπœ‡superscriptπœ‡π›ΎB_{s}\to\mu^{+}\mu^{-}\gamma 87% 2.7% 9.8%

The analysis uses Bs0β†’J/ψ(β†’ΞΌ+ΞΌβˆ’)Ξ·(β†’Ξ³Ξ³)B_{s}^{0}\to J/\psi(\to\mu^{+}\mu^{-})\eta(\to\gamma\gamma) as the normalization decay due to its well known branching fraction and its similarity to the signal decay. While the control mode was chosen as Bs0β†’Ο•(β†’K+Kβˆ’)Ξ³B_{s}^{0}\to\phi(\to K^{+}K^{-})\gamma due to its large statistics and its three body topology, also present in the signal.

4.1 Background estimation and selection

Both photons and muons have to satisfy minimum pTsubscript𝑝𝑇p_{T} requirements, while the muons are also required to satisfy PID criteria. Requirements are also imposed on the vertex fit quality and the pTsubscript𝑝𝑇p_{T} of the Bs0superscriptsubscript𝐡𝑠0B_{s}^{0}.

This study includes in the fitting model combinatorial, partially reconstructed and peaking backgrounds. The former is modelled with an exponential and corresponds to candidates made from random combinations of photons and muons. The latter is made of decays where at least one particle was not reconstructed. These candidates show up as a broad distribution below the Bs0superscriptsubscript𝐡𝑠0B_{s}^{0} mass. Three partially reconstructed decays were considered Bs0β†’ΞΌ+β€‹ΞΌβˆ’β€‹Ο•(β†’Ο€+β€‹Ο€βˆ’β€‹Ο€0)β†’superscriptsubscript𝐡𝑠0annotatedsuperscriptπœ‡superscriptπœ‡italic-Ο•β†’absentsuperscriptπœ‹superscriptπœ‹superscriptπœ‹0B_{s}^{0}\to\mu^{+}\mu^{-}\phi(\to\pi^{+}\pi^{-}\pi^{0}), Bdβ†’ΞΌ+β€‹ΞΌβˆ’β€‹Ξ·β€²(→ρ0​γ)β†’subscript𝐡𝑑annotatedsuperscriptπœ‡superscriptπœ‡superscriptπœ‚β€²β†’absentsuperscript𝜌0𝛾B_{d}\to\mu^{+}\mu^{-}\eta^{{}^{\prime}}(\to\rho^{0}\gamma) and Bdβ†’Dβˆ’β€‹ΞΌ+​νμ→subscript𝐡𝑑superscript𝐷superscriptπœ‡subscriptπœˆπœ‡B_{d}\to D^{-}\mu^{+}\nu_{\mu} with Dβˆ’β†’Ο€0β€‹ΞΌβˆ’β€‹Ξ½ΞΌβ†’superscript𝐷superscriptπœ‹0superscriptπœ‡subscriptπœˆπœ‡D^{-}\to\pi^{0}\mu^{-}\nu_{\mu}. The peaking backgrounds considered are Bs0β†’ΞΌ+β€‹ΞΌβˆ’β€‹Ξ·β†’superscriptsubscript𝐡𝑠0superscriptπœ‡superscriptπœ‡πœ‚B_{s}^{0}\to\mu^{+}\mu^{-}\eta, B0β†’ΞΌ+β€‹ΞΌβˆ’β€‹Ξ·β†’superscript𝐡0superscriptπœ‡superscriptπœ‡πœ‚B^{0}\to\mu^{+}\mu^{-}\eta and B0β†’ΞΌ+β€‹ΞΌβˆ’β€‹Ο€0β†’superscript𝐡0superscriptπœ‡superscriptπœ‡superscriptπœ‹0B^{0}\to\mu^{+}\mu^{-}\pi^{0} decays.

4.2 Results

The fits to the signal region in the four q2superscriptπ‘ž2q^{2} bins show no evident signal, therefore upper limits are set and these are shown inΒ Fig.3(b). The values with and without the ϕ​(1020)italic-Ο•1020\phi(1020) veto on the lowest q2superscriptπ‘ž2q^{2} bin at 90% (95%) CL are respectively:

ℬ​(Bs0β†’ΞΌ+β€‹ΞΌβˆ’β€‹Ξ³)<2.9​(3.4)Γ—10βˆ’8,ℬ→superscriptsubscript𝐡𝑠0superscriptπœ‡superscriptπœ‡π›Ύ2.93.4superscript108\mathcal{B}(B_{s}^{0}\to\mu^{+}\mu^{-}\gamma)<2.9(3.4)\times 10^{-8},
ℬ​(Bs0β†’ΞΌ+β€‹ΞΌβˆ’β€‹Ξ³)<2.5​(2.8)Γ—10βˆ’8.ℬ→superscriptsubscript𝐡𝑠0superscriptπœ‡superscriptπœ‡π›Ύ2.52.8superscript108\mathcal{B}(B_{s}^{0}\to\mu^{+}\mu^{-}\gamma)<2.5(2.8)\times 10^{-8}.
Refer to caption
(a)
Refer to caption
(b)
Figure 3: On the left, q2superscriptπ‘ž2q^{2} spectrum alongside the operators to which the analysis is sensitive in each region. On the right, upper limits on the branching ratio for Bs0β†’ΞΌ+β€‹ΞΌβˆ’β€‹Ξ³β†’superscriptsubscript𝐡𝑠0superscriptπœ‡superscriptπœ‡π›ΎB_{s}^{0}\to\mu^{+}\mu^{-}\gamma and theoretical predictions.

5 Amplitude analysis of the Ξ›b0β†’p​Kβˆ’β€‹Ξ³β†’superscriptsubscriptΛ𝑏0𝑝superscript𝐾𝛾\Lambda_{b}^{0}\to pK^{-}\gamma decay

This analysis uses the full 9 fb-1 of data collected by LHCb. A similar study has been carried out with Ξ›b0β†’p​Kβˆ’β€‹J/Οˆβ†’superscriptsubscriptΛ𝑏0𝑝superscriptπΎπ½πœ“\Lambda_{b}^{0}\to pK^{-}J/\psiΒ [5]. However the presence of a photon allows for the p​K𝑝𝐾pK system mass to reach values of up to 2.52.52.5 GeV/c2absentsuperscript𝑐2/c^{2}. The analysis strategy consists on performing an unbinned maximum likelihood fit to the reconstructed Ξ›b0superscriptsubscriptΛ𝑏0\Lambda_{b}^{0} invariant mass spectrum in fully selected data to separate signal from background and then perform background subtraction with the sPlotΒ [9] technique. This background subtracted data is later used in the amplitude analysis.

5.1 Background estimation and selection

The mass fit models combinatorial and partially reconstructed backgrounds. Both D0β†’K​Kβ†’superscript𝐷0𝐾𝐾D^{0}\to KK and D0β†’K​π→superscript𝐷0πΎπœ‹D^{0}\to K\pi can contribute to the background when combined with a random photon and when one of the hadrons is misidentified. However vetoing around the D0superscript𝐷0D^{0} mass distorts the acceptance and thus these decays have been modeled in the fit. Another decay included in the fit is the partially reconstructed Ξ›b0β†’pKβˆ—βˆ’(β†’Kβˆ’Ο€0)Ξ³\Lambda_{b}^{0}\to pK^{*-}(\to K^{-}\pi^{0})\gamma. The fits are performed separately for Run I and Run II data, due to the large differences in the data taking conditions.

5.2 Results

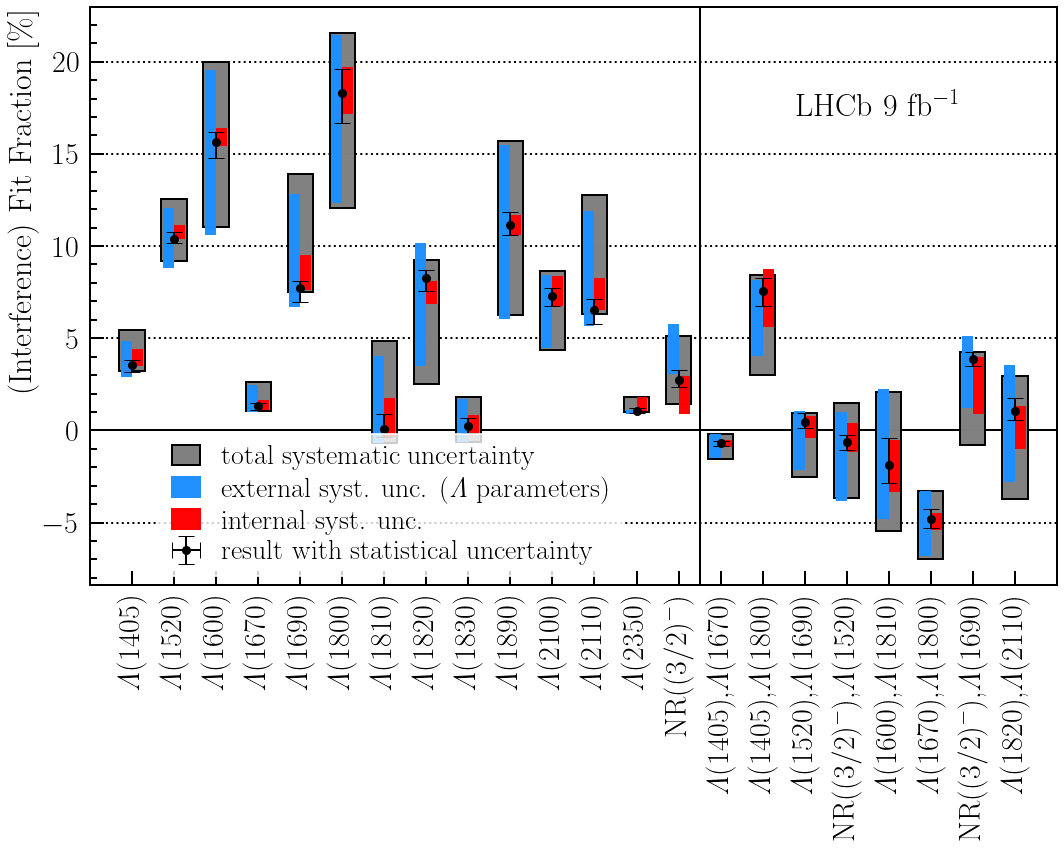
The model used in the amplitude analysis was taken fromΒ [8]. Only contributions from well established ΛΛ\Lambda resonances are taken into account, alongside a non-resonant component which was seen to improve the quality of the fit. The amplitude analysis uses a 2D unbinned maximum likelihood fit with observables as mΞ›b0​(p​K)subscriptπ‘šsuperscriptsubscriptΛ𝑏0𝑝𝐾m_{\Lambda_{b}^{0}}(pK) and mΞ›b0​(p​γ)subscriptπ‘šsuperscriptsubscriptΛ𝑏0𝑝𝛾m_{\Lambda_{b}^{0}}(p\gamma) masses. The subscript here means that the mass of the Ξ›b0superscriptsubscriptΛ𝑏0\Lambda_{b}^{0} candidate was constrained to the PDG mass in order to improve the resolution. The means and widths of the resonances were taken as external inputs and these constitute the leading source of uncertainty in the analysis as can be seen in Fig.Β 4. While the subleading uncertainties stem from sources such as the amplitude model, the uncertainty in the acceptance or the limited size of the simulated samples. Multiple local minima are present, with different values for the nuisance parameters; however the fit fractions and interference amplitudes show consistent values.

Refer to caption
Figure 4: Decay amplitudes for transitions through several intermediate states in Ξ›b0β†’p​Kβˆ’β€‹Ξ³β†’superscriptsubscriptΛ𝑏0𝑝superscript𝐾𝛾\Lambda_{b}^{0}\to pK^{-}\gamma decays as well as the interferences.

6 Summary

We have shown the most precise measurement of the ϕ​(1020)β†’ΞΌ+β€‹ΞΌβˆ’β†’italic-Ο•1020superscriptπœ‡superscriptπœ‡\phi(1020)\to\mu^{+}\mu^{-} branching fraction, the corresponding study also proved that efficiencies at low q2superscriptπ‘ž2q^{2} are well understood by the LHCb collaboration. We have also shown the first upper limits on the branching fraction of Bc+β†’Ο€+​μ+β€‹ΞΌβˆ’β†’superscriptsubscript𝐡𝑐superscriptπœ‹superscriptπœ‡superscriptπœ‡B_{c}^{+}\to\pi^{+}\mu^{+}\mu^{-} decays. The first dedicated search for Bs0β†’ΞΌ+β€‹ΞΌβˆ’β€‹Ξ³β†’superscriptsubscript𝐡𝑠0superscriptπœ‡superscriptπœ‡π›ΎB_{s}^{0}\to\mu^{+}\mu^{-}\gamma was also discussed, which extends previous studies of the Bs0β†’ΞΌ+β€‹ΞΌβˆ’β†’superscriptsubscript𝐡𝑠0superscriptπœ‡superscriptπœ‡B_{s}^{0}\to\mu^{+}\mu^{-} process. Finally, a thorough amplitude analysis of Ξ›b0β†’p​Kβˆ’β€‹Ξ³β†’superscriptsubscriptΛ𝑏0𝑝superscript𝐾𝛾\Lambda_{b}^{0}\to pK^{-}\gamma decays has provided new insights into the contributions of different ΛΛ\Lambda baryons to this process. These studies will greatly benefit from the data that LHCb will collect in Run 3.

References

References

  • [1] LHCb Collaboration, submitted to JHEP, [arXiv:2402.01336].
  • [2] LHCb Collaboration, submitted to JHEP, [arXiv:2312.12228].
  • [3] LHCb Collaboration, submitted to JHEP, [arXiv:2404.03375].
  • [4] LHCb Collaboration, submitted to JHEP, [arXiv:2403.03710].
  • [5] LHCb Collaboration, Phys Rev Lett, 115, 072001 (2015).
  • [6] LHCb Collaboration, Phys Rev Lett, 131, 051803 (2023).
  • [7] LHCb Collaboration, Phys Rev D, 105, 012010 (2022).
  • [8] Albrecht, J., Amhis, Y., Beck, A. et al., JHEP, 06, 116 (2020).
  • [9] Muriel Pivk, Francois R. Le Diberder, Nucl.Instrum.Meth.A555:356-369 (2005)
  • [10] P.A. Zyla et al. (Particle Data Group), Prog. Theor. Exp. Phys. 2020, 083C01 (2020)