Wall-resolved large eddy simulations of a pitching NACA0012 incurring in deep dynamic stall
Department of Aerospace Science and Technology
Politecnico di Milano
Milano, 20156
giacomo.baldan@polimi.it
&
Department of Aerospace Science and Technology
Politecnico di Milano
Milano, 20156
alberto.guardone@polimi.it
Abstract
This study investigates the flow evolution past a pitching NACA0012 airfoil undergoing deep dynamic stall using a wall-resolved large eddy simulation approach. Numerical results are validated against experimental data from Lee and Gerontakos (2004) at Reynolds number Re = 135 000 and a reduced frequency = 0.1. A comprehensive analysis of the computational grid span size is presented, highlighting the critical requirement for a span-to-chord ratio of at least one. Furthermore, a comparative assessment with state-of-the-art RANS and hybrid RANS/LES turbulence models is conducted to identify the sources of potential discrepancies between the numerical simulations and the experimental data. All the numerical models demonstrate the same behavior and exhibit similar differences with the experiments.
1 Introduction
Dynamic stall presents a significant challenge within the domain of aerodynamic design. It manifests as a transient, unsteady phenomenon impacting airfoils subjected to rapid variations in angle of attack. This behavior deviates considerably from the well-established theory of static stall, where a progressive reduction in lift occurs with increasing angle of attack. The pivotal factor in dynamic stall is the disruption of the attached boundary layer. This triggers the formation of the dynamic stall vortex (DSV) that convects downstream along the suction surface of the airfoil. The subsequent development and interaction of DSV with the boundary layer lead to complex flow separation phenomena (Marilyn J. et al., 2020). Dynamic stall induces flow separation over a substantial portion of the airfoil at angle of attacks exceeding the critical static stall limit. The consequence of this extensive flow separation is a drastic, and often delayed, reduction in lift, potentially accompanied by a significant increase in drag and pitch down moment. This behavior can have a profound impact on the performance and stability of aerodynamic structures. Notably, dynamic stall plays a crucial role in several key areas such as: helicopter rotor blades, wind turbines, and high-performance aircraft maneuvers.
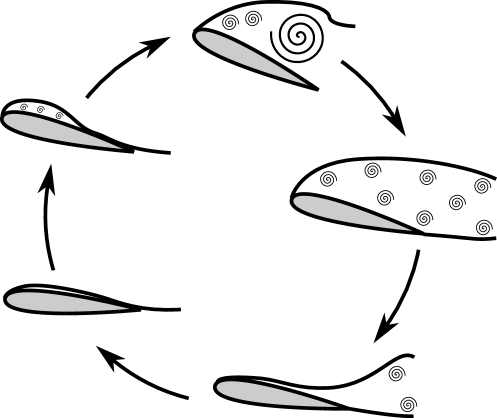
Focusing on the physics of the dynamic stall problem in pitching airfoils, it is possible to identify five main phases. Figure 1 presents a sketch of the flow in each of these stages. During the initial portion of the cycle, the airfoil experiences attached flow due to the low angles of incidence. As the angle of attack increases throughout the upstroke phase, a laminar separation bubble forms on the profile. Concurrently, the boundary layer transitions from laminar to turbulent flow, initiating at the trailing edge and progressing forward. The interaction between these two phenomena triggers the formation of the dynamic stall vortex, which subsequently convects rearward. Upon reaching the maximum angle of incidence and at the beginning of the downstroke phase, the flow over the airfoil suction side becomes fully stalled. Reattachment starts at a reduced angles of attack due to the negative pitch rate which increases the effective angle of attack.
The complex and transient nature of dynamic stall presents a significant obstacle in computational modeling and design optimization (Gardner et al., 2023; Baldan et al., 2024). Research efforts are primarily focused on developing robust high-fidelity computational fluid dynamics (CFD) tools and low-fidelity reduced order models (ROMs) to be used in flow control strategies. Indeed, by gaining a deeper understanding of dynamic stall and its impact, the design and control of aerodynamic structures can be improved (Gardner et al., 2019; Hariharan et al., 2014). This will ultimately lead to safer and more efficient flight, improved wind energy generation, and robust performance across diverse operating conditions.
Looking at high-fidelity simulations, many contributions using large eddy simulations (LES) can be found in the literature.
In particular, several aspects have been numerically investigated for finite wings ranging from aspect ratio (Hammer et al., 2022) to sweep angle (Hammer et al., 2023) and compressibility effects (Benton and Visbal, 2020).
Another aspect of dynamic stall study is the analysis of nominal infinite wings obtained imposing periodic boundary conditions in the spanwise direction.
According to the best practice for detached-eddy simulations (DES), presented in Shur et al. (1999), to reproduce the DSV is necessary a spanwise size of at least one chord.
Indeed, it is well known that the characteristic dimension of the DSV is on the order of the airfoil chord length when incurring in deep dynamic stall (McCroskey, 1981).
Despite the just mentioned considerations, a significant portion of LES literature employs extruded airfoil geometries with spanwise lengths ranging from only 5% to 20% of the chord size.
In Guillaud et al. (2018), a pitching NACA0012 airfoil at Re is investigated using a numerical model with spanwise length of .
In particular, the analysis focuses into the influence of the reduced frequency on the aerodynamic coefficients drop delay in comparison with the static case.
Other works on dynamic stall phenomenology and control have been developed by Benton and Visbal (2019b, a); Visbal and Benton (2018).
They leverage high-frequency control to mitigate the strong burst of the aerodynamic loads due to the leading edge vortex (LEV) detachment.
The effect of the Reynolds number on the laminar separation bubble (LSB) is also part of the investigation.
However, the airfoil extrusion in all the contributions is limited to , and .
Recently, Lee and Gross (2024) tried to match other LES results present in the literature reproducing a ramp-up motion with spanwise size equal to and a sinusoidal pitching test case using a wide grid.
The former is in good agreement with the reference data of Gupta and Ansell (2019) while the latter shows large discrepancies in the downstroke phase compared to Benton and Visbal (2019b).
On the contrary, Visbal and Garmann (2018) analyze the span effect starting from and up to in a ramp-up motion.
They showed that there is an effect when the DSV approaches the trailing edge of the profile and starts to interact with the trailing edge vortex (TEV).
A difference is present also in the loads especially for the moment coefficient.
Despite the span analysis at the beginning of the work, they focused their investigation on the LSB and DSV generation and all the following displayed results refer to the case.
Another contribution by the same authors, Visbal and Garmann (2019), focuses on the numerical simulations of typical experimental setups.
Namely, the aspect ratio of the wing section together with end walls and end tips is considered.
They provide a quantification of the discrepancy magnitude among all the configurations, but they do not report any comparison with real experimental data.
Less recent contributions tried to match experiments with large eddy simulations.
Patil et al. (2018) delves into the analysis of an H-Darrieus rotor trying to match wind tunnel data.
They were able to capture the attached flow behavior but not the stalled region.
The span size is limited to .
Other examples are Badoe et al. (2019); Kasibhotla and Tafti (2014) that investigates pitching NACA0012 airfoils at transitional Reynolds number using meshes with spanwise length of and , respectively.
Another critical aspect in the use of high-fidelity simulations to model dynamic stall phenomena is the difference present between numerics and experiments. If other numerical approaches are considered, such as unsteady Reynolds-Averaged Navier-Stokes (RANS) models and hybrid RANS/LES techniques, an even larger number of works is present in literature (Kim and Xie, 2016; Karbasian and Kim, 2016; Khalifa et al., 2021, 2023; Geng et al., 2018; Zanotti and Gibertini, 2013; Zanotti et al., 2014b, a; Avanzi et al., 2022, 2021; Gardner and Richter, 2020; Baldan and Guardone, 2024a, b). Most of this works conclude that the discrepancies between experimental data and numerical simulations rely on the adopted turbulence model to close the RANS system. A vast number of turbulence models have been adopted ranging from one equation Spalart-Allmaras formulation (Spalart and Allmaras, 1992) to full Reynolds stress model (RSM) (Launder et al., 1975), and including the well-known (Launder and Spalding, 1974) and SST (Menter, 1994). Also, transition models are leveraged, for instance the recent SST with intermittency equation (Menter et al., 2004). Regarding hybrid strategies, common choices are detached eddy simulations (DES) (Spalart et al., 1997) and their improved versions (DDES, IDDES). More recent approaches are scale adaptive simulations (SAS) (Menter and Egorov, 2010) and stress-blended eddy simulations (SBES) (Menter, 2018).
This work proposes a numerical investigation of a NACA0012 airfoil undergoing sinusoidal pitching motion at a Reynolds number of 135 000 and a reduced frequency of k = 0.1. The study utilizes a wall-resolved large eddy simulation approach to analyze the influence of spanwise length on the aerodynamic behavior during both the upstroke and downstroke phases. Span sizes ranging from to are examined. Furthermore, the obtained numerical results are compared with the experimental data proposed by Lee and Gerontakos (2004). Additionally, a comparison will be presented with current state-of-the-art RANS and hybrid RANS/LES models. This comparative analysis aims to elucidate whether the observed discrepancies between the numerical results and the experimental data stem from the turbulence model employed or other effects.
2 Numerical setup
The present numerical simulations replicate the experimental conditions presented in Lee and Gerontakos (2004). A NACA0012 airfoil with a 0.15 m chord underlying a sinusoidal pitching motion defined as:
| (1) | ||||
is investigated, where is the pitching frequency, is the mean angle of attach, and is the angular oscillation amplitude. The present simulations are carried out at Reynolds number Re = and reduced frequency . The free-stream velocity is while the reference pressure is set to .
2.1 Grid generation
| Span size | Nodes | Hexahedra | |||||||
|---|---|---|---|---|---|---|---|---|---|
| 934 | 334 | 201 | 62.7M | 62.1M | |||||
| - | - | 401 | 125.1M | 124.3M | - | - | - | - | |
| - | - | 801 | 249.9M | 248.6M | - | - | - | - | |
| - | - | 1201 | 374.7M | 372.8M | - | - | - | - |
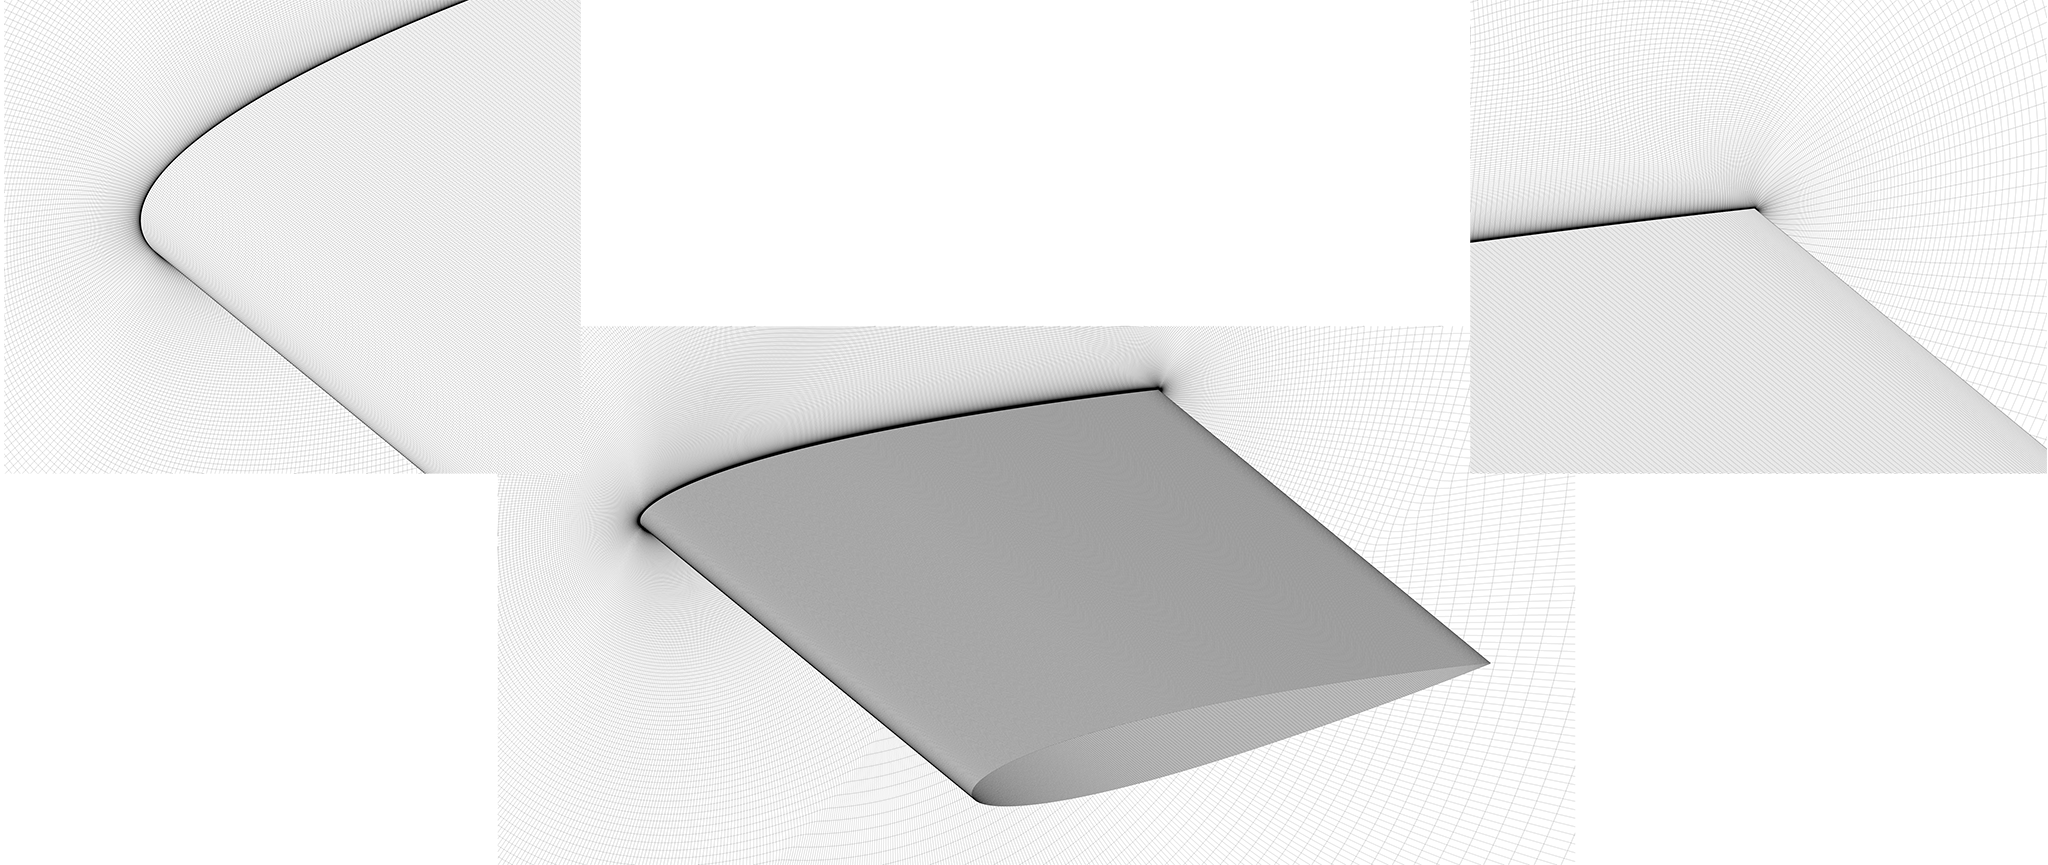
The CFD mesh is generated using Fidelity Pointwise v2023.2 Cadence (2023). To avoid the non-physical flow patterns caused by the typical C-grid strong anisotropic elements, especially near the trailing edge Baldan and Guardone (2024b), the O-grid is adopted in this research. Table 1 reports the details of the grids, where is the coordinate over the profile, is the direction normal to the surface, and is the spanwise direction.
The O-grid is obtained through a hyperbolic extrusion in the normal direction starting from the profile surface. The wall-normal spacing follows a geometric progression with a growth rate of 1.03. The standard values required for Wall-Resolved Large Eddy Simulation (WRLES), typically demanding resolution values of , , and Piomelli and Balaras (2002); Georgiadis et al. (2010), are always satisfied at the wall, even for the most demanding flow condition when the acceleration, due to the high angle of attack, increases the velocity at more than twice the free-stream value. Thus, the first layer is positioned at over the surface. Another critical aspect in the mesh to capture dynamic stall phenomena is the element size at the leading and at the trailing edges. The leading edge spacing is extremely important since it covers the region where the laminar separation bubble resides during the pitch up phase and subsequently the dynamic stall vortex is generated. The same consideration can be applied also to the trailing edge since stall also starts from the back of the profile. Also for this reason the blunt trailing edge is jointed with a circle that avoids the imposition of the separation point and at the same time increases the orthogonality of the grid allowing a faster convergence. The element size at the nose of the airfoil is while at the trailing edge is . In order to reduce the number of points of the meshes the pressure side of the airfoil, which is not directly involved in the DSV advection, is discretized with a lower number of points. Specifically, the suction side has 550 nodes, the pressure side instead is limited to 385. This results in an average spacing on the upper surface of and on the lower surface of . In all the meshes the farfield is placed at from the airfoil to reduce the boundary influences.
The three-dimensional grid is obtained through a uniform extrusion of the two-dimensional O-grid in the direction. The number of points is retrieved respecting the LES requirements (Choi and Moin, 2012). For the smallest mesh, extending for in span, the number of points is equal to 201. When moving to larger grids, the element size is kept the same resulting in 401, 801, and 1201 nodes for meshes with span size of , , and , respectively. Figure 2 illustrates the three-dimensional grid with span size.
2.2 Numerical methods
The steady incompressible RANS equations and the filtered unsteady NS ones are solved using ANSYS Fluent 2023R2 (ANSYS, 2023). A second-order upwind discretization in space is adopted. Gradients are retrieved through a least square cell-based method, and fluxes are obtained with the Rhie-Chow momentum-based formulation. The SIMPLE method is leveraged to solve the pressure-velocity equations in the steady framework while for the LES solution SIMPLEC method is used. The time evolution is obtained through a bounded second-order implicit time integration scheme.
Moving on to boundary conditions, the farfield marker present in the original mesh is split in two parts. For this reason, a marker is set for cells with positive , corresponding to the coordinate around which the grid rotates and being the direction of the free-stream flow. Farfield faces are thus separated using the mark imposing a velocity inlet and a pressure outlet boundary conditions. The inflow velocity is imposed together with the turbulence intensity of 0.08% as in the wind tunnel. A non-slip and non penetrating condition is imposed on the airfoil. The surfaces at the tips of the extruded O-grid features a translational conformal periodic condition to grant a nominally infinite wing.
RANS system is closed using the SST turbulence model with the addition of the intermittency equation (Menter et al., 2004), in which a differential transport equation is solved for the intermittency, to better describe the transition of the boundary layer from laminar to turbulent.
Moving to large eddy simulations, WALE subgrid scale model is used since it grants the right eddy viscosity trend in near-wall areas without requiring any dumping function or transition between the bulk flow and the boundary layer. The model provides the asymptotic behavior at the wall locations (Chapman and Kuhn, 1986). In order to grant a CFL close to one, the pitching cycle is discretized into 144 000 time steps that correspond to or, adimensionalizing it, convection times.
The airfoil pitching motion is prescribed through the rigid motion of the entire grid. Indeed, the angular velocity is imposed in Fluent using a user-defined expression equal to . The mean rotation, instead, is granted through a rigid rotation of the mesh before starting the simulation. In order to speed up temporal convergence, the simulation is performed in three different stages. Firstly, a steady RANS simulation with the mesh rotated at is performed until force coefficient convergence is reached. After that, the time-dependent pitching simulation is evolved. The mesh rotation is imposed to obtain a negative pitch rate after the steady simulation (Baldan and Guardone, 2023). This allows to reach unsteady convergence faster since the flow is evolved at lower angle of attack and is attached to the profile. The first pitch down quarter of the cycle is neglected. Finally, an entire pitching cycle is computed, and data are collected.
Following each simulation, the pressure coefficient and skin friction coefficient distributions over the wing section are extracted every 40 time steps. These unstructured outputs from Fluent are subsequently mapped onto the structured mesh of the wing section using a k-d tree algorithm, which efficiently identifies the nearest neighbors Virtanen et al. (2020). For post-processing, the skin friction value at each point is converted to its signed magnitude. The sign is determined based on the direction calculated from the and components of . The positive geometric direction is aligned with the curvilinear coordinate that extends from the leading edge to the trailing edge. When the geometric direction and the numerically computed direction coincide, the sign is positive. Conversely, if they oppose each other, the sign is negative. This process allows for the identification of regions with flow separation.
3 Results
The present section discusses the results obtained with the previously described numerical models. Specifically, the effect of the span-to-chord ratio is investigated in Section 3.1, while Section 3.2 reports the comparison of the proposed LES with other numerical approaches.
3.1 Span-to-chord ratio effect
The initial stage of the investigation centers on the impact of employing computational grids with limited spanwise dimensions when encountering dynamic stall phenomena. Four distinct grid sizes are employed for this analysis: , , , and .
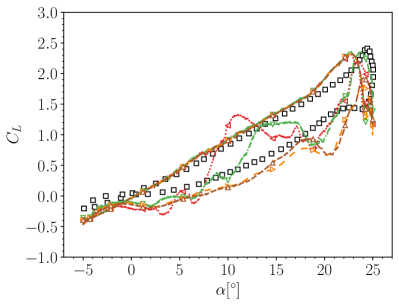
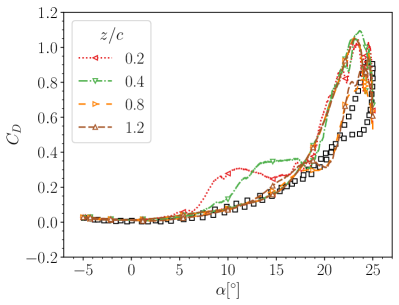
The primary focus is on the aerodynamic loads experienced throughout the complete pitching cycle. Figure 3 depicts the lift and drag coefficients as functions of the angle of incidence. When the flow remains predominantly attached, during both the initial portion of the upstroke and the last part of the downstroke, the behavior displayed by the grids exhibits a high degree of similarity. However, a significant divergence is observed between the two smaller grids when the LSB detaches and subsequently induces the DSV at an angle of incidence of approximately 22 degrees. Notably, the first peak in lift during the pitch down phase surpasses the values obtained with the other two grids. This disparity becomes even more pronounced at lower angles of attack, where the interaction between the TEV and the DSV results in a lift peak that even exceeds the value observed during the climb phase. A comparable trend is also observed with regards to the drag coefficient. Lastly, larger grids exhibit a trend similar to experimental data during the pitch down, although a lift offset is present.
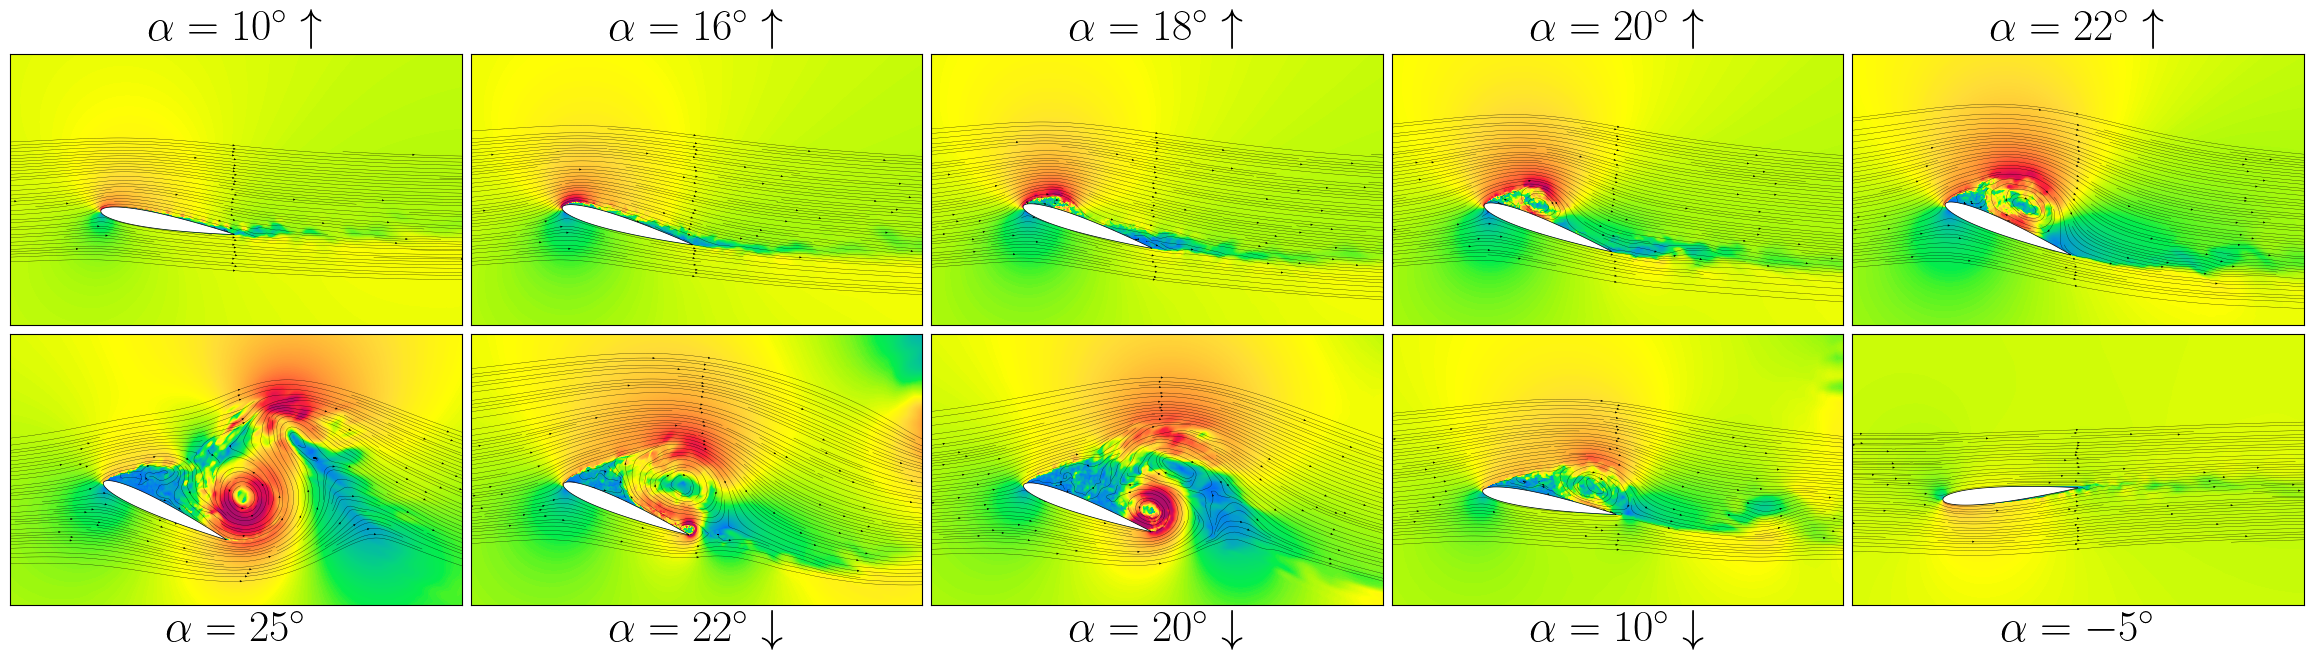
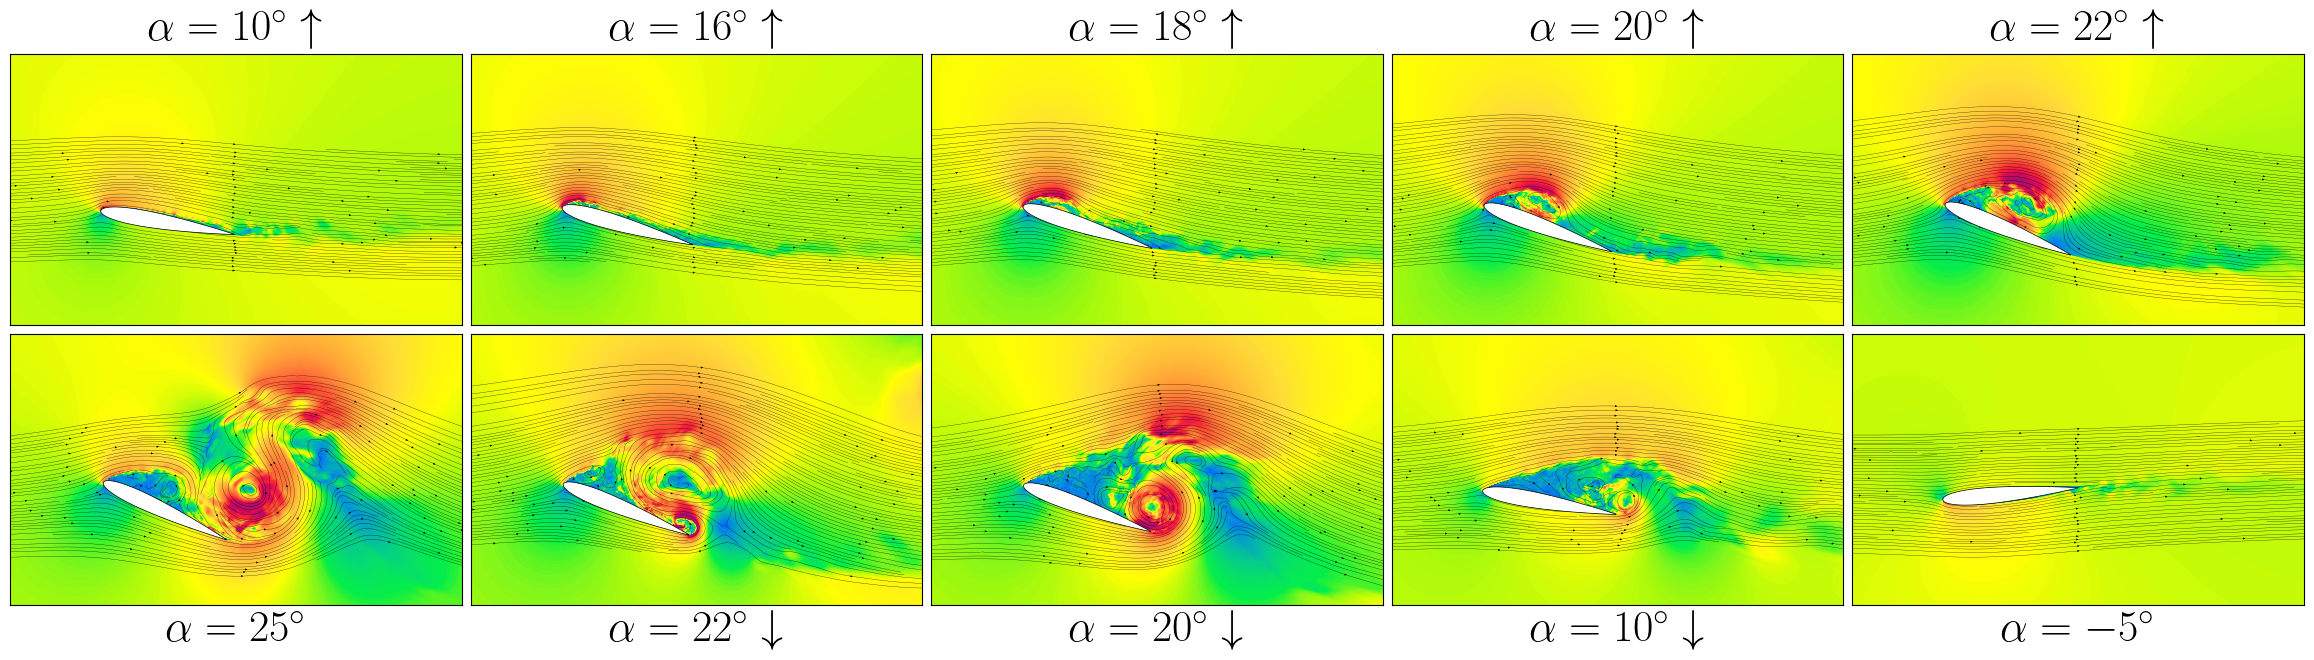
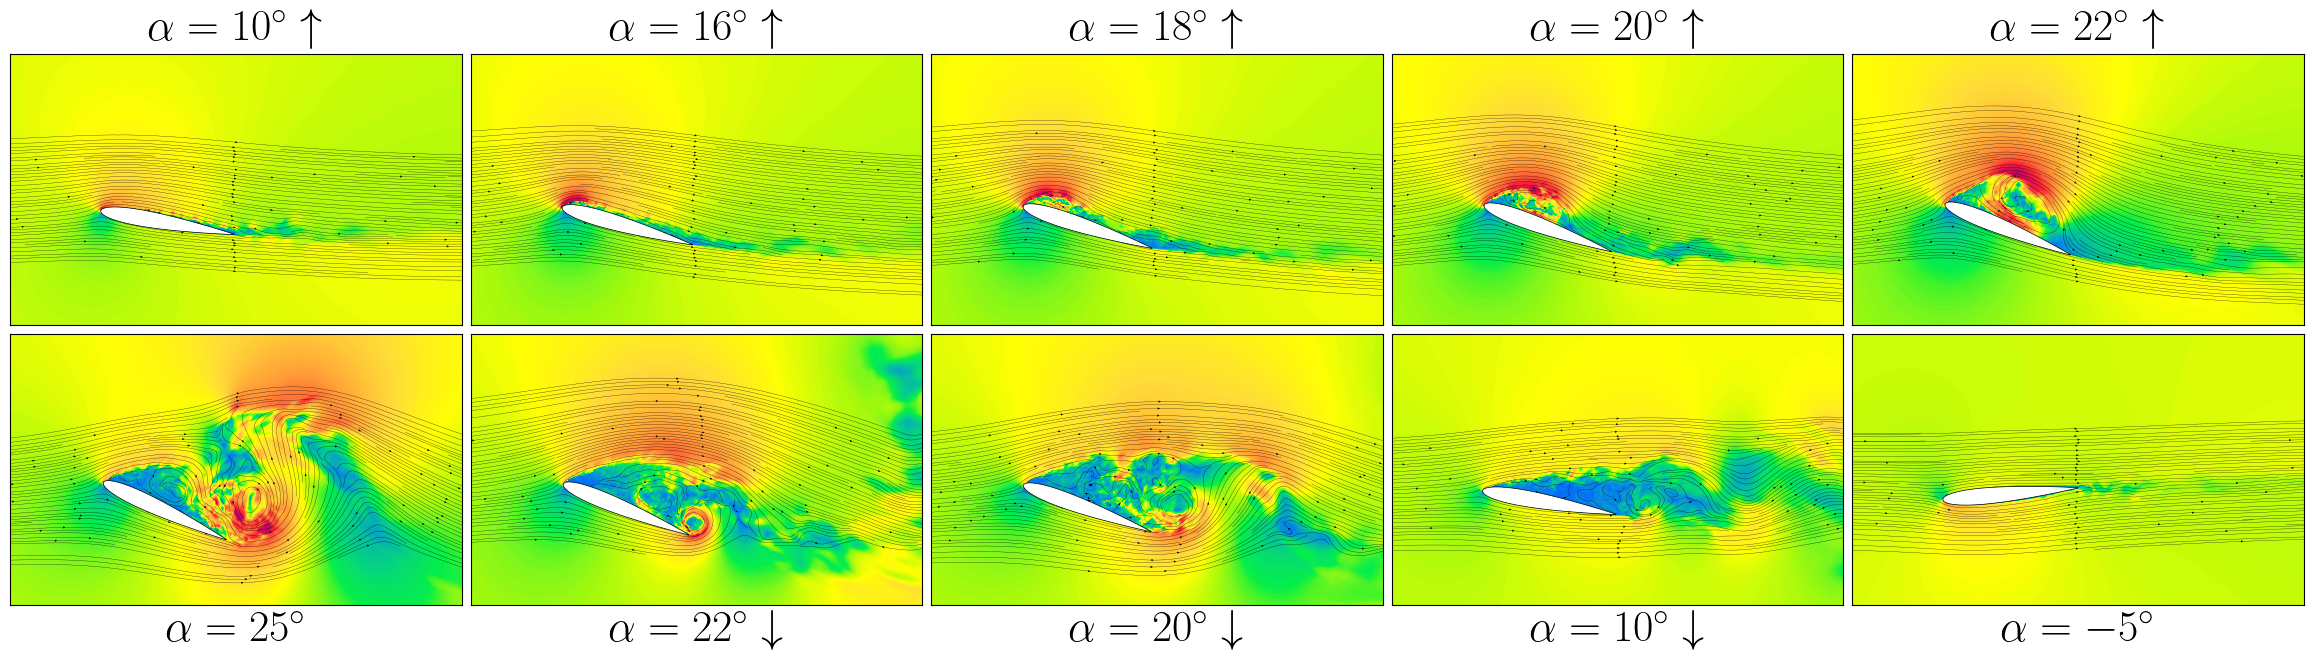
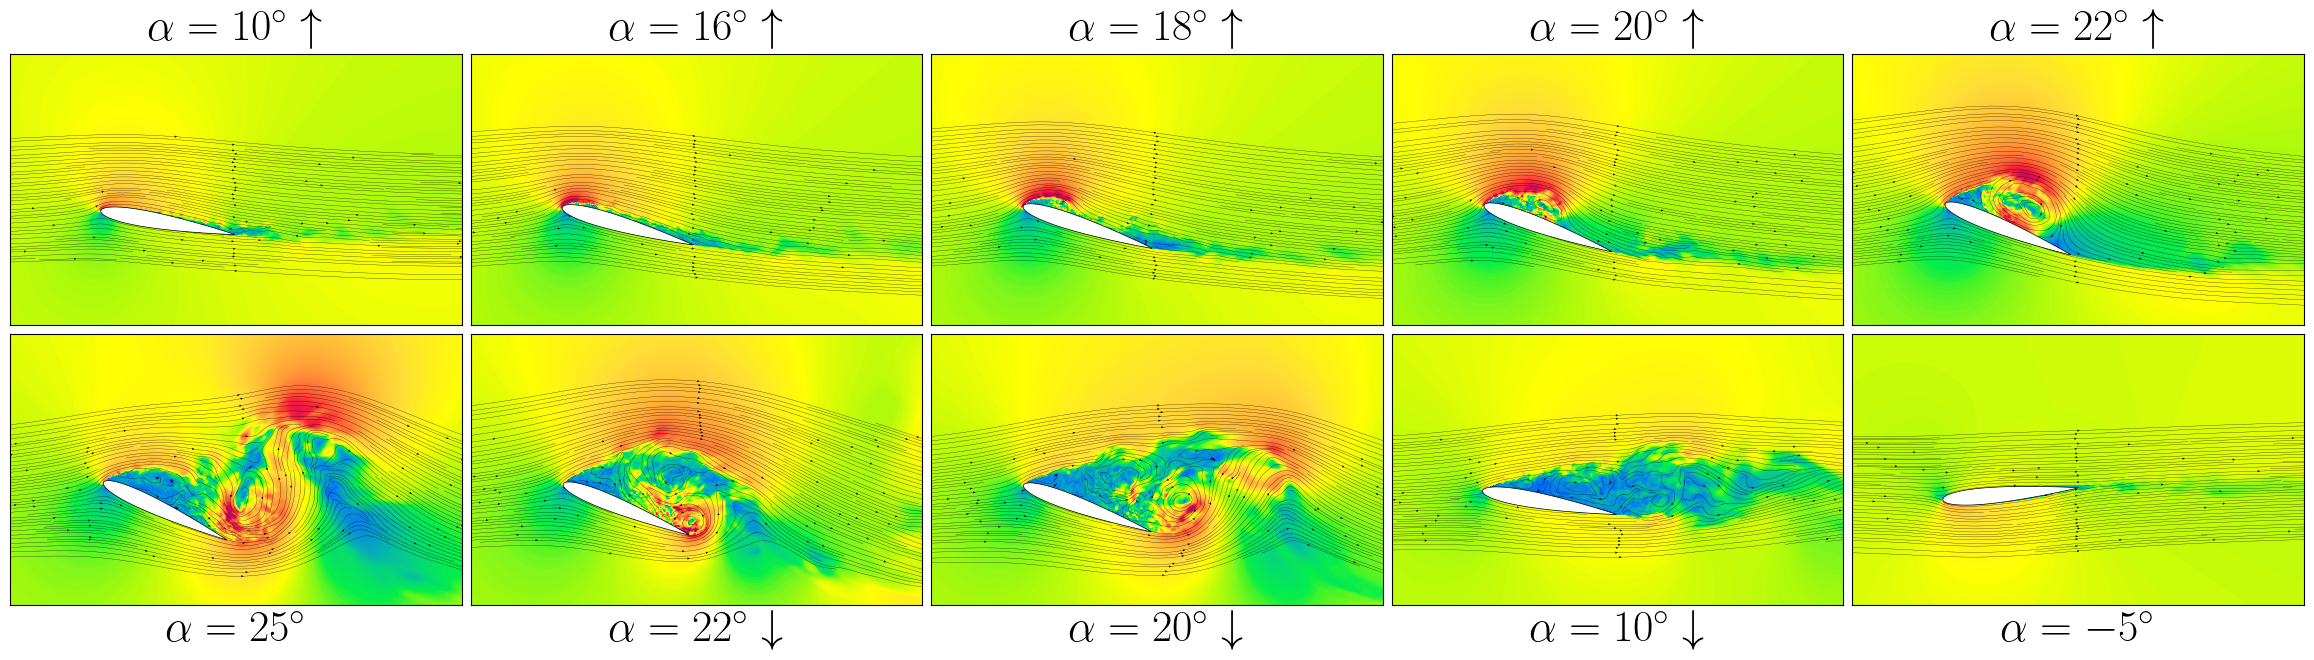
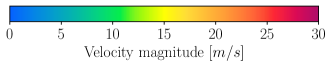
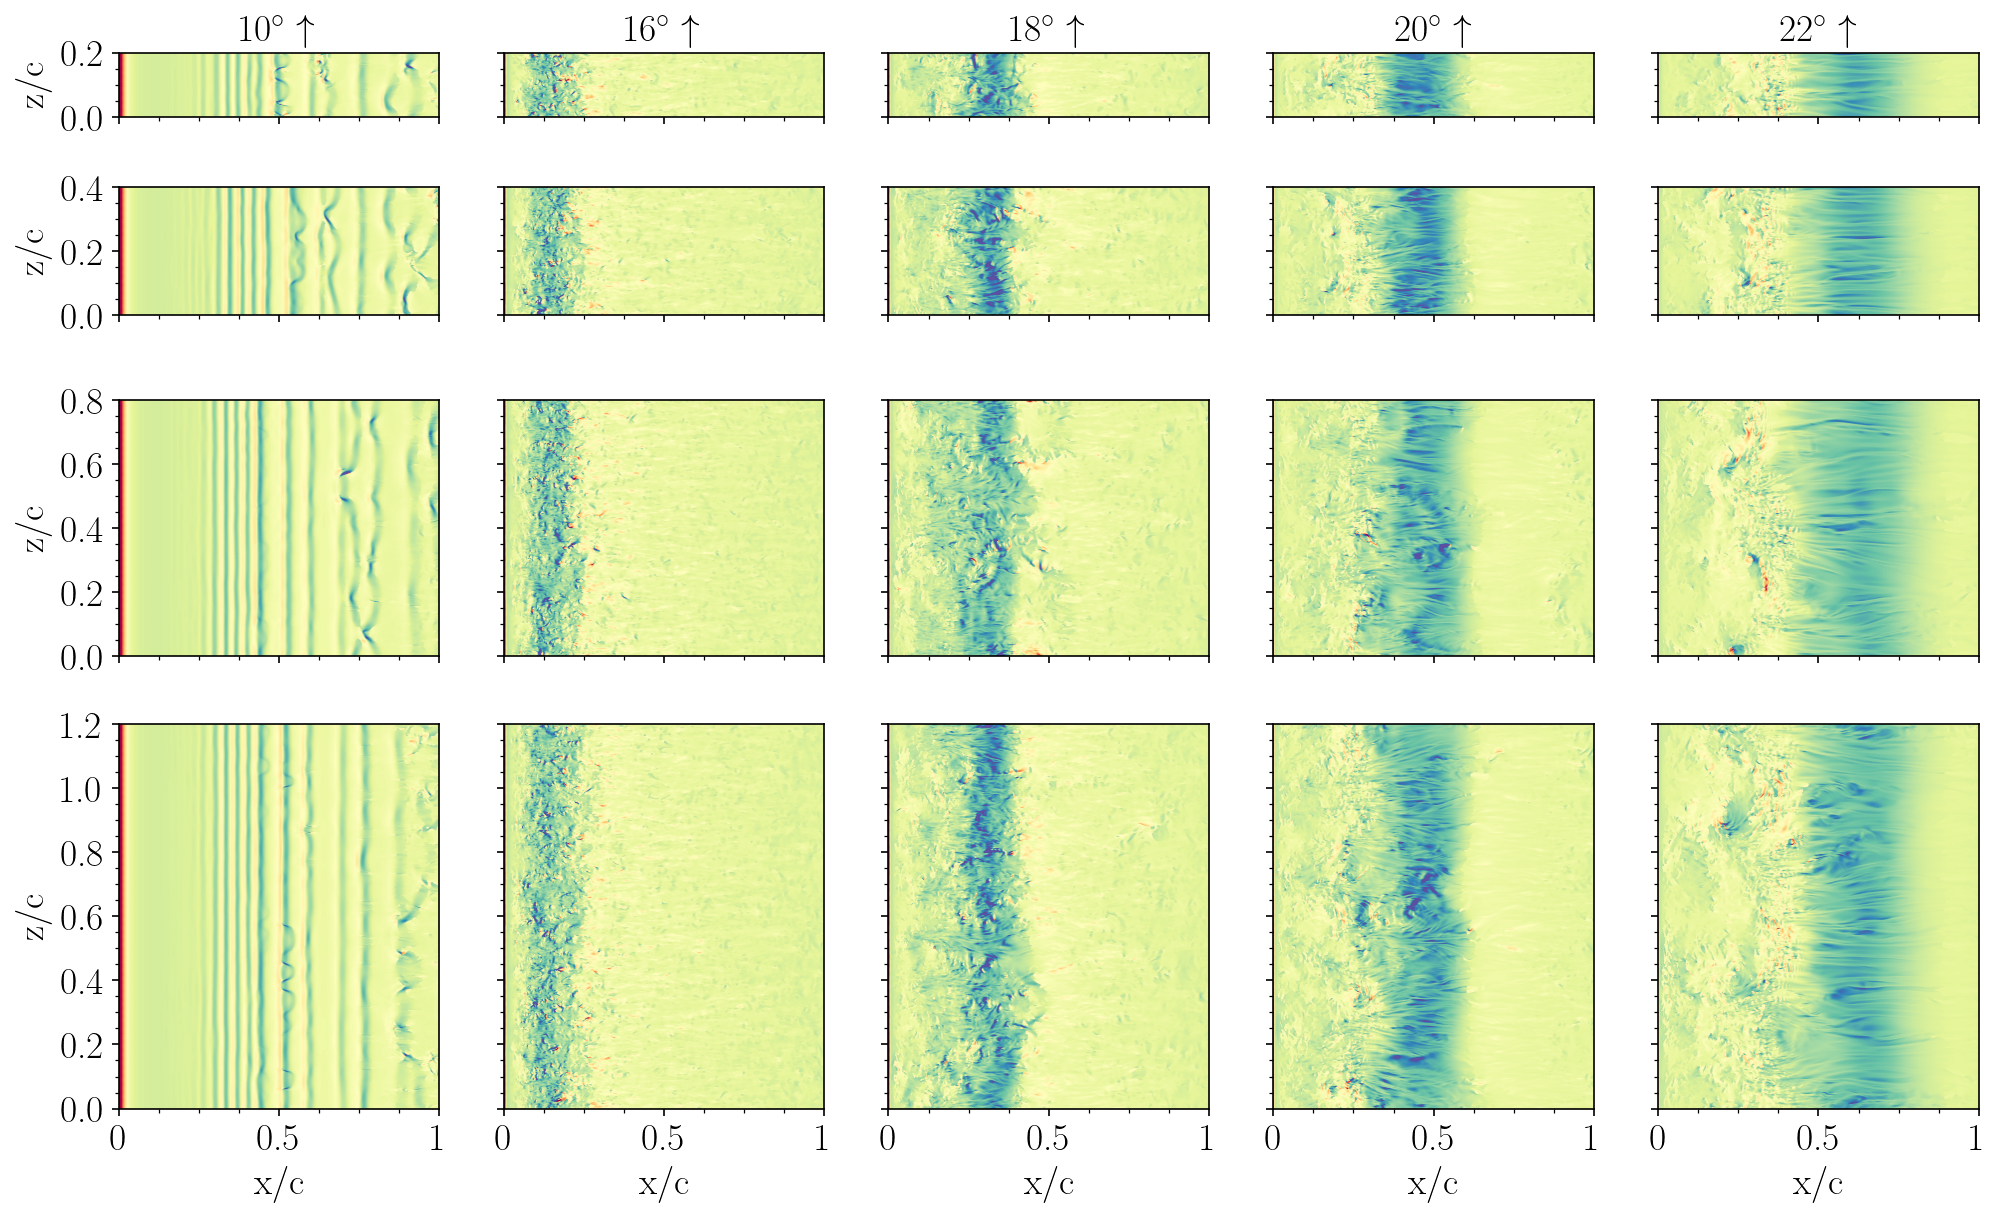
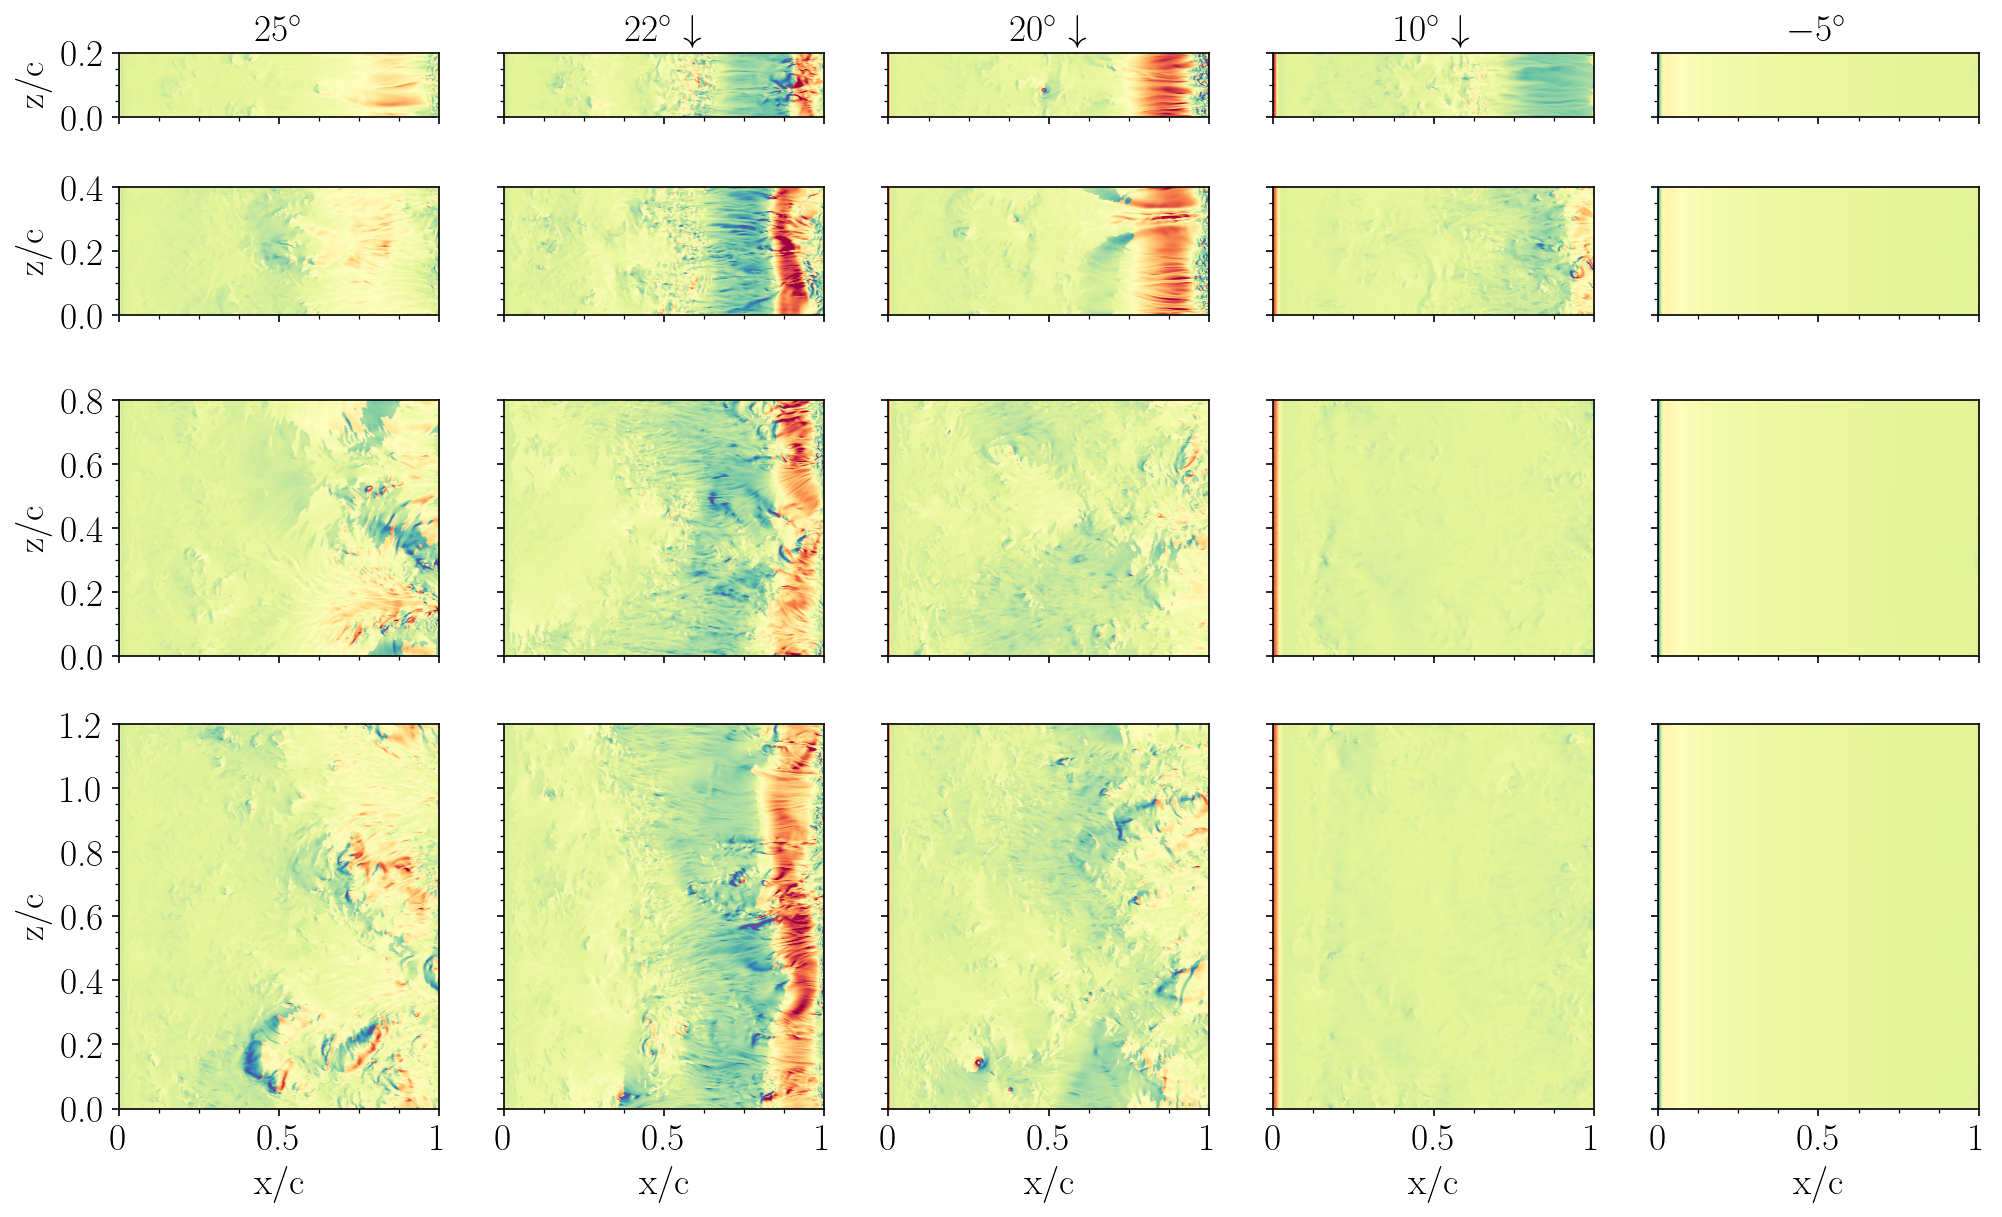
Figure 4 illustrates the instantaneous velocity magnitude contours at peculiar angles, providing a more detailed understanding of the influence of the span size. The figure initially confirms that mesh size has no impact on flow structures during the upstroke phase. This is evident from the qualitatively similar appearance of the subfigures in the first row for each grid. Focusing on the angle of maximum incidence where the DSV is fully developed, we observe a significant effect of the span-to-chord ratio on the flow field. For grids with a ratio of 0.2 and even 0.4, the boundary conditions enforce a predominantly two-dimensional character on the flow. This is manifested by a more defined DSV core and a higher peak velocity magnitude. In contrast, grids with larger spanwise extensions exhibit smaller turbulence scale structures, likely due to interactions in the spanwise direction. This phenomenon becomes particularly pronounced during the descent phase of the profile. Here, the smaller grids reveal the presence of a distinct vortical structure absent in the other cases. A peculiar difference is available at equal to 10 degrees, where the two grids with larger spans exhibit distinct behaviors. The largest grid displays a completely stalled flow, while the grid with a span of still presents oscillatory patterns in the wake region.
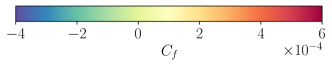
Further insight into the spanwise effects is provided by analyzing the skin friction coefficient distribution on the wing section’s upper surface. Figure 5 presents the distribution for the previously investigated angles of attack across all four meshes. The observations regarding the upstroke phase are corroborated by the alignment of the recirculation zone, identified by negative values. The most significant discrepancies arise at the maximum angle of incidence, along with the descending phase at 20 and 10 degrees. These contours demonstrate the development of three-dimensionality within the flow field when sufficient spanwise extension is available. Interestingly, a departure from prior observations is seen at 22 degrees, where the trends exhibit a high degree of similarity between all meshes. Additionally, the qualitative behavior at 10 degrees appears comparable for the two largest grids.
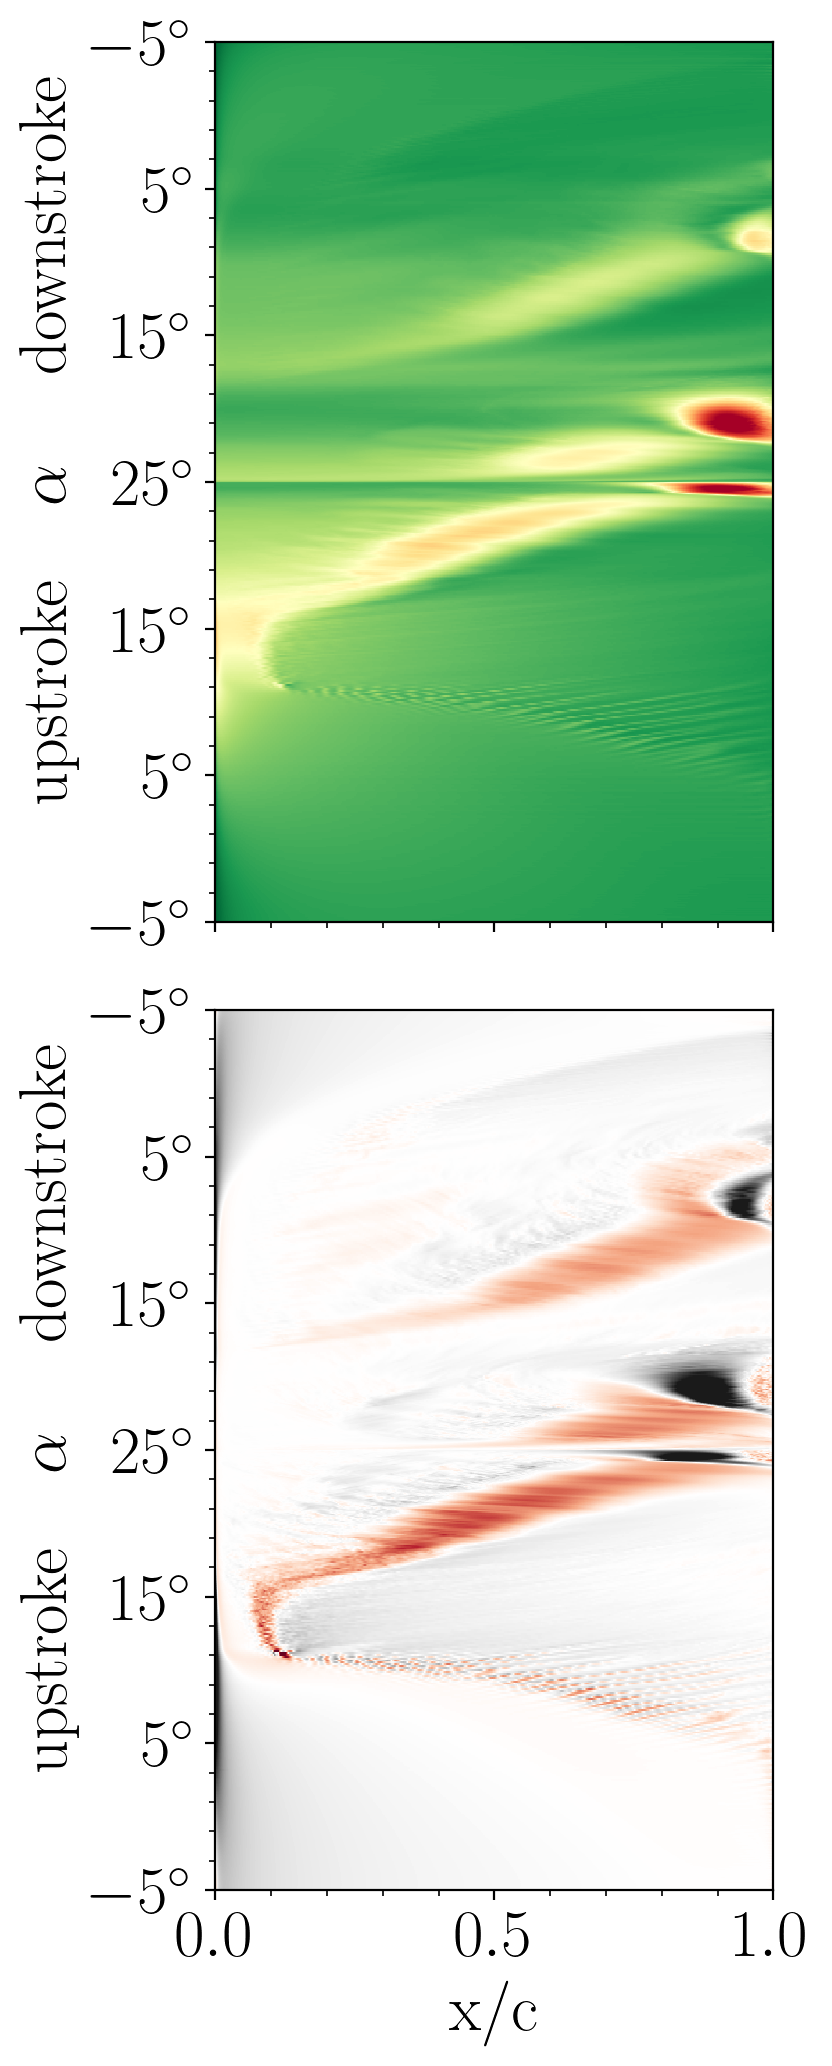
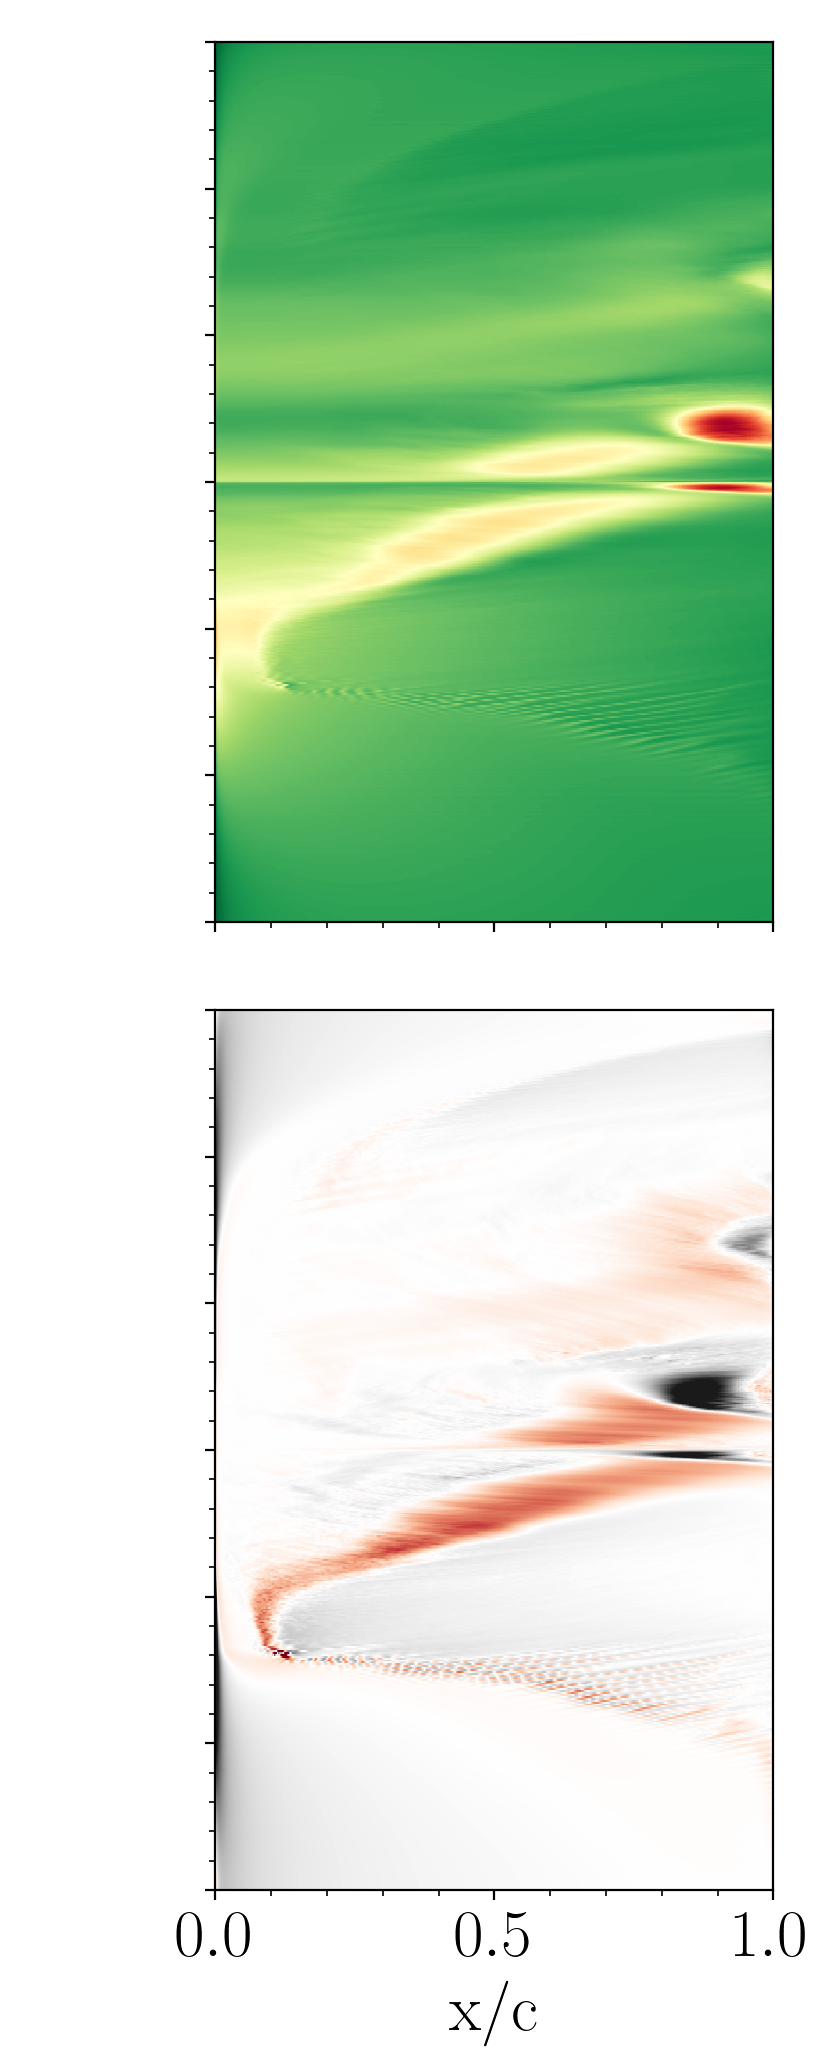
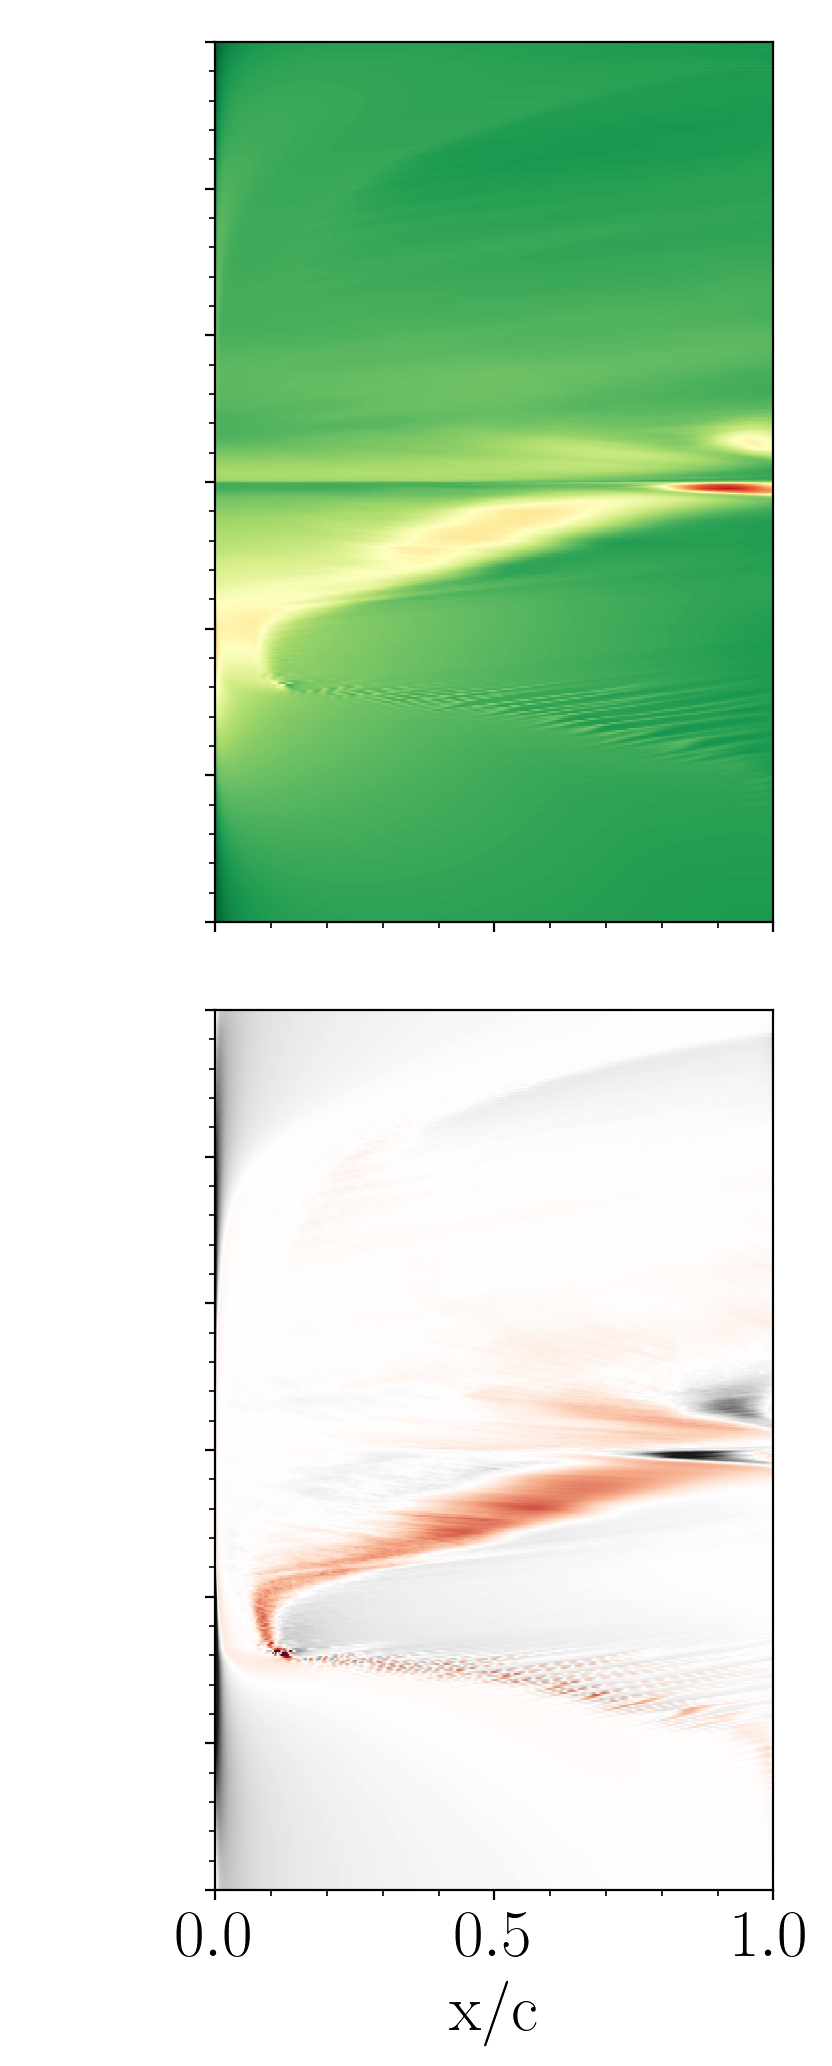
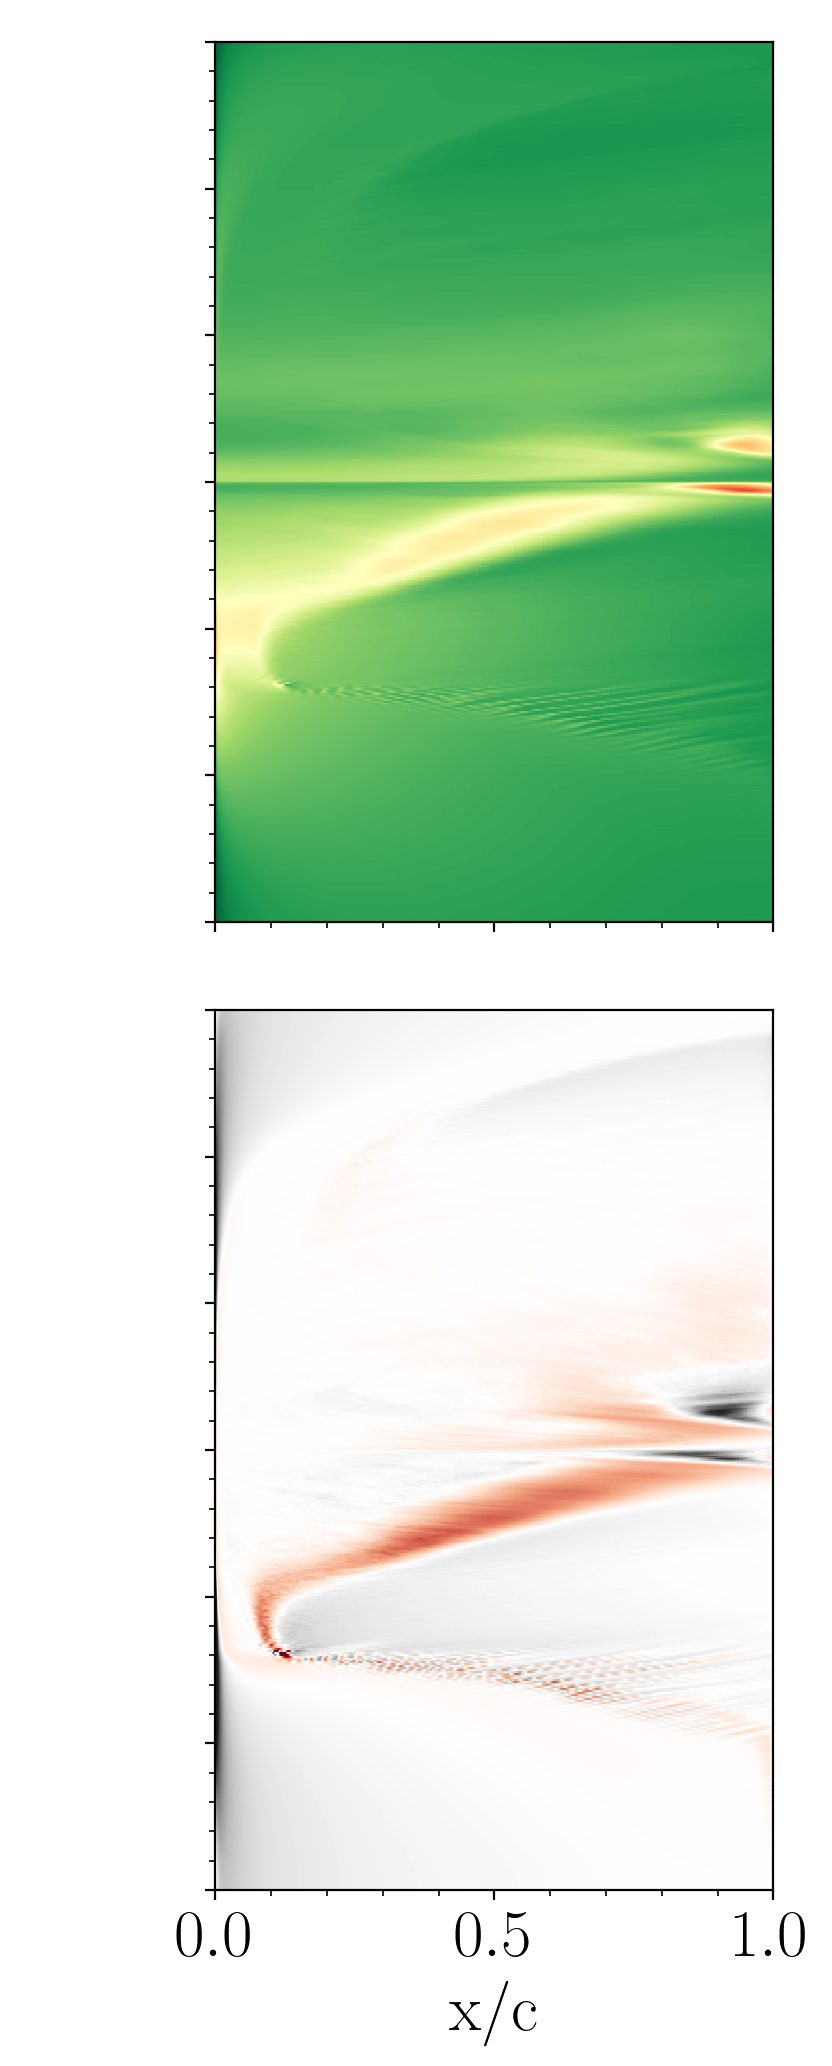
Figure 6 depicts the time-dependent evolution of the DSV and TEV by presenting the spanwise-averaged and trends on the suction side of the airfoil. This investigation offers additional insights beyond the previous analyses. We observe the boundary layer undergoing the transition from laminar to turbulent regime. The transition starts at the trailing edge around an angle of attack of 2 degrees and progresses towards the LSB at 10 degrees. Beyond 15 degrees, the development of the DSV becomes evident. It grows until it reaches the trailing edge at 22 degrees, where it interacts with the TEV. The subsequent behavior varies depending on the grid size. For grids with of 0.2 and 0.4, two distinct pressure coefficient peaks are observed at the trailing edge, followed by a weaker third one. Additionally, the detachment of another vortex from the mid-chord region is visible. In contrast, the behavior for the grids with larger spans is different. The trailing edge experiences a pressure coefficient peak, albeit lower in magnitude compared to the smaller grids, upon the first interaction with the DSV. This is followed by a weaker peak, and subsequently, the flow becomes completely stalled, exhibiting no discernible trends.
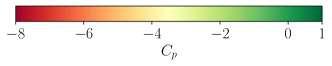
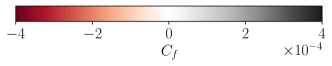
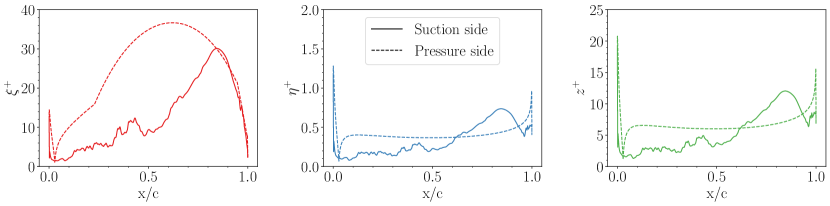
To conclude the mesh analysis, Figure 7 presents the wall units averaged in the spanwise direction for the grid with the largest span extent, evaluated at the maximum angle of incidence, 25 degrees. The reported values adhere to the recommended practices for WRLES. However, the value is more conservative with respect to the just mentioned LES range and is closer to 1. This value satisfies the requirement imposed by the RANS turbulence model adopted in the flow initialization.
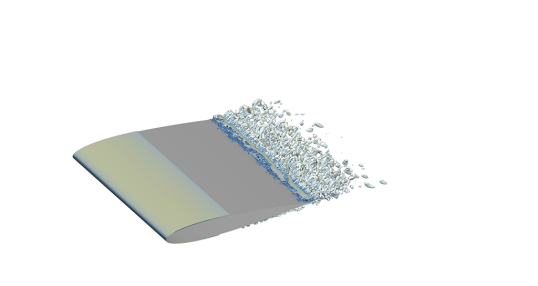
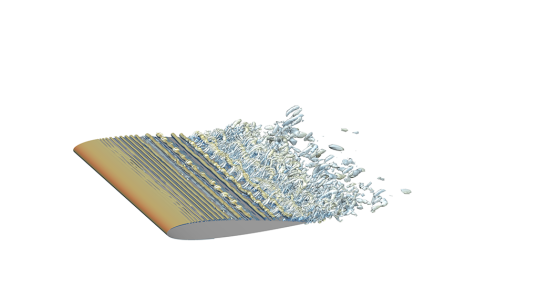
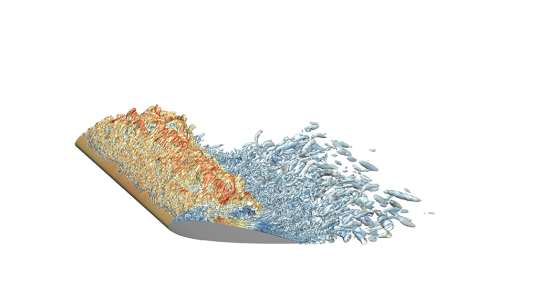
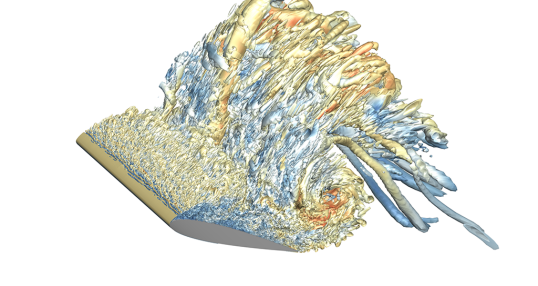
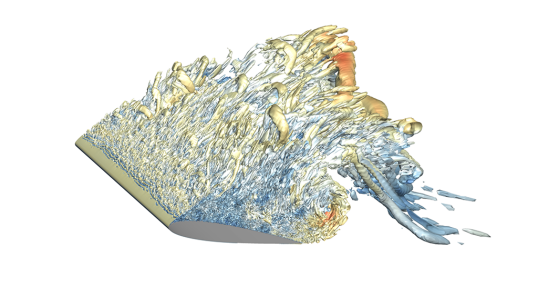
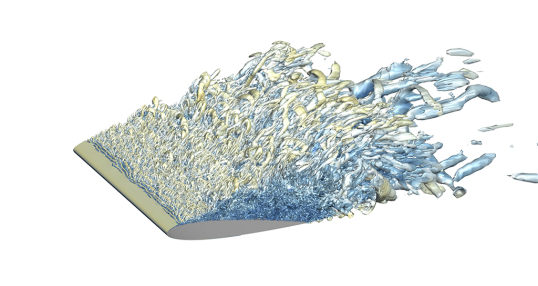
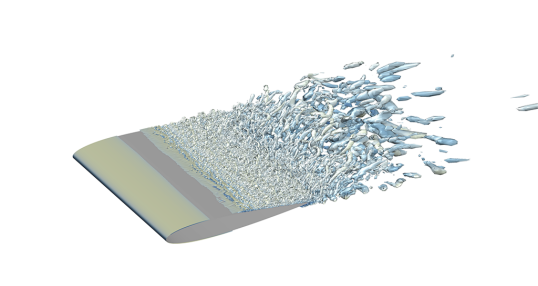
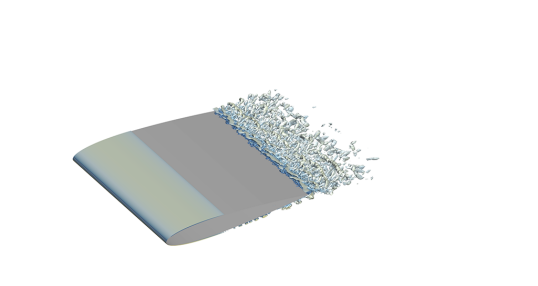
Figure 8 presents a visualization of the three-dimensional dynamic stall structures using the Q-criterion iso-surface with velocity magnitude contours. A key observation is the difference in the fields at identical angles of attack but during ascent and descent phases. Analyzing each phase, the laminar-to-turbulent boundary layer transition is visible during the 10-degree in the upstroke phase, characterized by the presence of instabilities and hairpin structures. At an angle of approximately 20 degrees, the DSV begins to develop, exhibiting a primarily two-dimensional structure. As the angle of attack reaches its maximum, where the DSV is fully developed and interacts with the TEV, the flow is completely three-dimensional exhibiting spanwise variations. The descent phase at 20 and 10 degrees is still fully stalled and three-dimensional. Subsequently, as the angle of attack approaches zero, the flow starts to laminarize. Finally, at the lowest incidence, the flow presents some instabilities on the lower side of the wing section.
3.2 Comparison with RANS and hybrid RANS/LES approaches
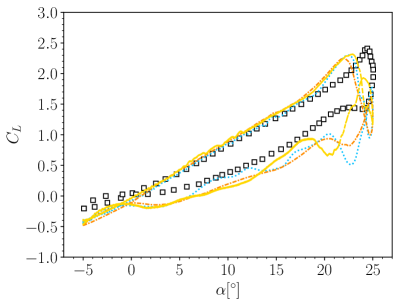
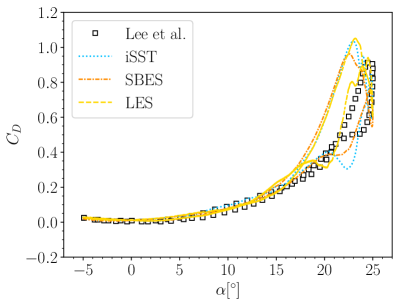
In conclusion, we conduct a comparative analysis of the just presented LES results with those obtained from previous studies by Baldan and Guardone (2024b). Two approaches were employed in the prior work: a two-dimensional unsteady RANS simulation and a three-dimensional approach utilizing hybrid RANS/LES techniques. For the RANS simulation, the SST turbulence model was implemented in conjunction with the intermittency equation, referred to as iSST, to enhance the description of the laminar-to-turbulent transition within the boundary layer. The hybrid model employed a Stress-Blended Eddy Simulation approach coupled with the same RANS turbulence model. The reference data for the LES simulations is based on the mesh with a span-to-chord ratio of 1.2.
Figure 9 presents a comparison of the profile loads obtained from the numerical simulations and the experimental data by Lee and Gerontakos (2004). The results reveal a high degree of agreement between the numerical models for attached flow conditions, with their curves nearly overlapping. Notably, the most significant discrepancy between the numerical and experimental data lies in the angle of attack corresponding to peak lift. Interestingly, the simulations anticipate, with respect to the experimental data, the angle at which the DSV is convected downwards and this behavior is consistent across all numerical models, including the WRLES approach. In contrast, during the initial descent phase of the profile, characterized by fully stalled flow, the models exhibit some divergence. However, as the angle of incidence decreases, they converge towards a unified solution. It has to be highlighted that in the stall portion cycle-to-cycle variations are not considered due to the large computational resource requirements of large eddy simulations. Despite an offset from the experimental data persists, the overall behavior of simulations aligns well with the experiments.
4 Conclusions
This work employed wall-resolved large eddy simulations to investigate the impact of grid resolution on pitching airfoils. The study revealed a critical dependency of key flow structures, particularly the three-dimensionality of the dynamic stall vortex, on the spanwise grid size. While existing literature offers case studies with limited span-to-chord ratios, 0.1-0.2, these were found to be inadequate for capturing the full complexity of the phenomenon. Consequently, results obtained with such grids are unreliable except for the attached flow region involving the laminar separation bubble formation and the dynamic stall vortex generation. This highlights the growing challenge of studying the phenomenon with high-fidelity models at increasing Reynolds numbers due to the ever-increasing mesh size requirements.
Furthermore, a comparison with computational models based on RANS equations suggested a surprising result. The key discrepancies between numerical simulations and experimental data are not primarily due to turbulence models, as commonly reported. These discrepancies might instead be linked to other factors such as wind tunnel effects or the inherent limitations in accurately replicating the surface roughness of the wind tunnel wing section model within the computational models.
Acknowledgments
The authors acknowledge Leonardo SpA – Helicopter Division for granting access to the davinci-1 supercomputer.
References
- ANSYS (2023) ANSYS. Fluent 2023R2. https://www.ansys.com/products/fluids/ansys-fluent, 2023.
- Avanzi et al. (2021) Filippo Avanzi, Francesco De Vanna, Yin Ruan, and Ernesto Benini. Design-assisted of pitching aerofoils through enhanced identification of coherent flow structures. Designs, 5(1), 2021. ISSN 2411-9660. doi:10.3390/designs5010011. URL https://www.mdpi.com/2411-9660/5/1/11.
- Avanzi et al. (2022) Filippo Avanzi, Francesco De Vanna, Yin Ruan, and Ernesto Benini. Enhanced identification of coherent structures in the flow evolution of a pitching wing. In AIAA SCITECH 2022 Forum, 2022. doi:10.2514/6.2022-0182. URL https://arc.aiaa.org/doi/abs/10.2514/6.2022-0182.
- Badoe et al. (2019) Charles E. Badoe, Zheng-Tong Xie, and Neil D. Sandham. Large eddy simulation of a heaving wing on the cusp of transition to turbulence. Computers & Fluids, 184:64–77, 2019. ISSN 0045-7930. doi:https://doi.org/10.1016/j.compfluid.2019.03.023. URL https://www.sciencedirect.com/science/article/pii/S0045793019300970.
- Baldan and Guardone (2023) Giacomo Baldan and Alberto Guardone. Pattern recognition of the flow around a pitching NACA 0012 airfoil in dynamic stall conditions. In Aeronautics and Astronautics, 2023. doi:10.21741/9781644902813-35.
- Baldan and Guardone (2024a) Giacomo Baldan and Alberto Guardone. A deep neural network physics-based reduced order model for unsteady aerodynamics of pitching airfoils. 2024a.
- Baldan and Guardone (2024b) Giacomo Baldan and Alberto Guardone. The effects of turbulence modeling on dynamic stall. 2024b.
- Baldan et al. (2024) Giacomo Baldan, Verena Heuschneider, Matti Mitropoulos, Ilkay Yavrucuk, and Alberto Guardone. Numerical and experimental investigation of stall on the MERIT rotor in hover. The Vertical Flight Society, 2024.
- Benton and Visbal (2019a) S. I. Benton and M. R. Visbal. The onset of dynamic stall at a high, transitional Reynolds number. Journal of Fluid Mechanics, 861:860–885, 2019a. doi:10.1017/jfm.2018.939.
- Benton and Visbal (2019b) Stuart I. Benton and Miguel R. Visbal. Extending the Reynolds number range of high-frequency control of dynamic stall. AIAA Journal, 57(7):2675–2681, 2019b. doi:10.2514/1.J058324. URL https://doi.org/10.2514/1.J058324.
- Benton and Visbal (2020) Stuart I. Benton and Miguel R. Visbal. Effects of compressibility on dynamic-stall onset using large-eddy simulation. AIAA Journal, 58(3):1194–1205, 2020. doi:10.2514/1.J058681.
- Cadence (2023) Cadence. Fidelity Pointwise 2023.2. https://www.cadence.com/en_US/home/tools/system-analysis/computational-fluid-dynamics/pointwise.html, 2023.
- Chapman and Kuhn (1986) Dean R Chapman and Gary D Kuhn. The limiting behaviour of turbulence near a wall. Journal of Fluid Mechanics, 170:265–292, 1986. doi:10.1017/S0022112086000885.
- Choi and Moin (2012) Haecheon Choi and Parviz Moin. Grid-point requirements for large eddy simulation: Chapman’s estimates revisited. Physics of Fluids, 24(1):011702, 01 2012. ISSN 1070-6631. doi:10.1063/1.3676783.
- Gardner and Richter (2020) A. D. Gardner and K. Richter. Effect of the model-sidewall connection for a dynamic stall airfoil experiment. Journal of Aircraft, 57(1):173–178, 2020. doi:10.2514/1.C035613.
- Gardner et al. (2019) A.D. Gardner, C.C. Wolf, and M. Raffel. Review of measurement techniques for unsteady helicopter rotor flows. Progress in Aerospace Sciences, 111:100566, 2019. ISSN 0376-0421. doi:https://doi.org/10.1016/j.paerosci.2019.100566. URL https://www.sciencedirect.com/science/article/pii/S0376042119300016.
- Gardner et al. (2023) Anthony D. Gardner, Anya R. Jones, Karen Mulleners, Jonathan W. Naughton, and Marilyn J. Smith. Review of rotating wing dynamic stall: Experiments and flow control. Progress in Aerospace Sciences, 137:100887, 2023. ISSN 0376-0421. doi:https://doi.org/10.1016/j.paerosci.2023.100887.
- Geng et al. (2018) F. Geng, I. Kalkman, A.S.J. Suiker, and B. Blocken. Sensitivity analysis of airfoil aerodynamics during pitching motion at a reynolds number of . Journal of Wind Engineering and Industrial Aerodynamics, 183:315–332, 2018. ISSN 0167-6105. doi:https://doi.org/10.1016/j.jweia.2018.11.009. URL https://www.sciencedirect.com/science/article/pii/S0167610518301806.
- Georgiadis et al. (2010) Nicholas J Georgiadis, Donald P Rizzetta, and Christer Fureby. Large-eddy simulation: current capabilities, recommended practices, and future research. AIAA Journal, 48(8):1772–1784, 2010. doi:10.2514/1.J050232.
- Guillaud et al. (2018) N. Guillaud, G. Balarac, and E. Goncalvès. Large eddy simulations on a pitching airfoil: Analysis of the reduced frequency influence. Computers & Fluids, 161:1–13, 2018. ISSN 0045-7930. doi:https://doi.org/10.1016/j.compfluid.2017.11.002. URL https://www.sciencedirect.com/science/article/pii/S0045793017303961.
- Gupta and Ansell (2019) Rohit Gupta and Phillip J. Ansell. Unsteady flow physics of airfoil dynamic stall. AIAA Journal, 57(1):165–175, 2019. doi:10.2514/1.J057257. URL https://doi.org/10.2514/1.J057257.
- Hammer et al. (2022) Patrick R. Hammer, Daniel J. Garmann, and Miguel R. Visbal. Effect of aspect ratio on finite-wing dynamic stall. AIAA Journal, 60(12):6581–6593, 2022. doi:10.2514/1.J062109. URL https://doi.org/10.2514/1.J062109.
- Hammer et al. (2023) Patrick R. Hammer, Daniel J. Garmann, and Miguel R. Visbal. Effect of aspect ratio on swept-wing dynamic stall. AIAA Journal, 61(10):4367–4377, 2023. doi:10.2514/1.J063039.
- Hariharan et al. (2014) Nathan S. Hariharan, T Alan Egolf, and Lakshmi N. Sankar. Simulation of rotor in hover: Current state, challenges and standardized evaluation. In 52nd Aerospace Sciences Meeting, 2014. doi:10.2514/6.2014-0041.
- Karbasian and Kim (2016) Hamid Reza Karbasian and Kyung Chun Kim. Numerical investigations on flow structure and behavior of vortices in the dynamic stall of an oscillating pitching hydrofoil. Ocean Engineering, 127:200–211, 2016. ISSN 0029-8018. doi:https://doi.org/10.1016/j.oceaneng.2016.10.005. URL https://www.sciencedirect.com/science/article/pii/S0029801816304450.
- Kasibhotla and Tafti (2014) Venkata Ravishankar Kasibhotla and Danesh Tafti. Large eddy simulation of the flow past pitching NACA0012 airfoil at 1E5 Reynolds number. volume Volume 1A of Fluids Engineering Division Summer Meeting, page V01AT09A011, 08 2014. doi:10.1115/FEDSM2014-21588.
- Khalifa et al. (2021) Nabil M. Khalifa, Amir S. Rezaei, and Haitham E. Taha. Comparing the performance of different turbulence models in predicting dynamic stall. In AIAA Scitech 2021 Forum, 2021. doi:10.2514/6.2021-1651. URL https://arc.aiaa.org/doi/abs/10.2514/6.2021-1651.
- Khalifa et al. (2023) Nabil M. Khalifa, Amirsaman Rezaei, and Haithem E. Taha. On computational simulations of dynamic stall and its three-dimensional nature. Physics of Fluids, 35(10):105143, 10 2023. ISSN 1070-6631. doi:10.1063/5.0170251.
- Kim and Xie (2016) Yusik Kim and Zheng-Tong Xie. Modelling the effect of freestream turbulence on dynamic stall of wind turbine blades. Computers & Fluids, 129:53–66, 2016. ISSN 0045-7930. doi:https://doi.org/10.1016/j.compfluid.2016.02.004. URL https://www.sciencedirect.com/science/article/pii/S0045793016300226.
- Launder et al. (1975) B. E. Launder, G. J. Reece, and W. Rodi. Progress in the development of a Reynolds-stress turbulence closure. Journal of Fluid Mechanics, 68(3):537–566, 1975. doi:10.1017/S0022112075001814.
- Launder and Spalding (1974) B.E. Launder and D.B. Spalding. The numerical computation of turbulent flows. Computer Methods in Applied Mechanics and Engineering, 3(2):269–289, 1974. ISSN 0045-7825. doi:10.1016/0045-7825(74)90029-2. URL https://www.sciencedirect.com/science/article/pii/0045782574900292.
- Lee and Gross (2024) Sunyoung Lee and Andreas Gross. Large-eddy simulations of dynamic stall for a NACA0012 wing section. In AIAA SCITECH 2024 Forum, 2024. doi:10.2514/6.2024-1352. URL https://arc.aiaa.org/doi/abs/10.2514/6.2024-1352.
- Lee and Gerontakos (2004) T. Lee and P. Gerontakos. Investigation of flow over an oscillating airfoil. Journal of Fluid Mechanics, 512:313–341, 2004. doi:10.1017/S0022112004009851.
- Marilyn J. et al. (2020) Smith Marilyn J., Anthony D. Gardner, Rohit Jain, Peters David, and François Richez. Rotating wing dynamic stall: State of the art and future directions. In 76th Annual Forum & Technology Display Vertical Flight Society, 2020. doi:https://doi.org/10.4050/F-0076-2020-16472.
- McCroskey (1981) W.J. McCroskey. The Phenomenon of Dynamic Stall. Defense Technical Information Center, 1981.
- Menter (2018) F. Menter. Stress-Blended Eddy Simulation (SBES) – A new paradigm in hybrid RANS-LES modeling. In Progress in Hybrid RANS-LES Modelling, pages 27–37. Springer International Publishing, 2018. ISBN 978-3-319-70031-1. doi:10.1007/978-3-319-70031-1_3.
- Menter (1994) F. R. Menter. Two-equation eddy-viscosity turbulence models for engineering applications. AIAA Journal, 32(8):1598–1605, 1994. doi:10.2514/3.12149.
- Menter et al. (2004) F. R. Menter, R. B. Langtry, S. R. Likki, Y. B. Suzen, P. G. Huang, and S. Völker. A correlation-based transition model using local variables – Part I: Model formulation. Journal of Turbomachinery, pages 413–422, 03 2004. ISSN 0889-504X. doi:10.1115/1.2184352.
- Menter and Egorov (2010) Florian R. Menter and Y. Egorov. The Scale-Adaptive Simulation method for unsteady turbulent flow predictions. Part 1: Theory and model description. Flow, Turbulence and Combustion, 85:113–138, 2010. doi:10.1007/s10494-010-9264-5.
- Patil et al. (2018) Rohit Patil, László Daróczy, Gábor Janiga, and Dominique Thévenin. Large eddy simulation of an H-Darrieus rotor. Energy, 160:388–398, 2018. ISSN 0360-5442. doi:https://doi.org/10.1016/j.energy.2018.06.203. URL https://www.sciencedirect.com/science/article/pii/S0360544218312684.
- Piomelli and Balaras (2002) Ugo Piomelli and Elias Balaras. Wall-layer models for large-eddy simulations. Annual Review of Fluid Mechanics, 34(1):349–374, 2002. doi:10.1146/annurev.fluid.34.082901.144919. URL https://www.annualreviews.org/content/journals/10.1146/annurev.fluid.34.082901.144919.
- Shur et al. (1999) M. Shur, P.R. Spalart, M. Strelets, and A. Travin. Detached-eddy simulation of an airfoil at high angle of attack. In Engineering Turbulence Modelling and Experiments 4, pages 669–678. Elsevier Science Ltd, Oxford, 1999. ISBN 978-0-08-043328-8. doi:https://doi.org/10.1016/B978-008043328-8/50064-3. URL https://www.sciencedirect.com/science/article/pii/B9780080433288500643.
- Spalart and Allmaras (1992) Philippe Spalart and Steven Allmaras. A one-equation turbulence model for aerodynamic flows. In 30th Aerospace Sciences Meeting and Exhibit, 1992. doi:10.2514/6.1992-439. URL https://arc.aiaa.org/doi/abs/10.2514/6.1992-439.
- Spalart et al. (1997) Philippe Spalart, W-H Jou, Michael Strelets, and Steven Allmaras. Comments on the feasibility of les for wings, and on a hybrid rans/les approach. 01 1997.
- Virtanen et al. (2020) Pauli Virtanen, Ralf Gommers, Travis E. Oliphant, Matt Haberland, Tyler Reddy, David Cournapeau, Evgeni Burovski, Pearu Peterson, Warren Weckesser, Jonathan Bright, Stéfan J. van der Walt, Matthew Brett, Joshua Wilson, K. Jarrod Millman, Nikolay Mayorov, Andrew R. J. Nelson, Eric Jones, Robert Kern, Eric Larson, C J Carey, İlhan Polat, Yu Feng, Eric W. Moore, Jake VanderPlas, Denis Laxalde, Josef Perktold, Robert Cimrman, Ian Henriksen, E. A. Quintero, Charles R. Harris, Anne M. Archibald, Antônio H. Ribeiro, Fabian Pedregosa, Paul van Mulbregt, and SciPy 1.0 Contributors. SciPy 1.0: Fundamental Algorithms for Scientific Computing in Python. Nature Methods, 17:261–272, 2020. doi:10.1038/s41592-019-0686-2.
- Visbal and Benton (2018) Miguel R. Visbal and Stuart I. Benton. Exploration of high-frequency control of dynamic stall using large-eddy simulations. AIAA Journal, 56(8):2974–2991, 2018. doi:10.2514/1.J056720. URL https://doi.org/10.2514/1.J056720.
- Visbal and Garmann (2018) Miguel R. Visbal and Daniel J. Garmann. Analysis of dynamic stall on a pitching airfoil using high-fidelity large-eddy simulations. AIAA Journal, 56(1):46–63, 2018. doi:10.2514/1.J056108. URL https://doi.org/10.2514/1.J056108.
- Visbal and Garmann (2019) Miguel R. Visbal and Daniel J. Garmann. Investigation of spanwise end effects on dynamic stall of a pitching wing section. Journal of Aircraft, 56(6):2118–2130, 2019. doi:10.2514/1.C035427. URL https://doi.org/10.2514/1.C035427.
- Zanotti et al. (2014a) A. Zanotti, S. Melone, R. Nilifard, and A. D’Andrea. Experimental-numerical investigation of a pitching airfoil in deep dynamic stall. Proceedings of the Institution of Mechanical Engineers, Part G: Journal of Aerospace Engineering, 228(4):557–566, 2014a. doi:10.1177/0954410013475954.
- Zanotti et al. (2014b) A. Zanotti, R. Nilifard, G. Gibertini, A. Guardone, and G. Quaranta. Assessment of 2D/3D numerical modeling for deep dynamic stall experiments. Journal of Fluids and Structures, 51:97–115, 2014b. ISSN 0889-9746. doi:https://doi.org/10.1016/j.jfluidstructs.2014.08.004. URL https://www.sciencedirect.com/science/article/pii/S0889974614001819.
- Zanotti and Gibertini (2013) Alex Zanotti and Giuseppe Gibertini. Experimental investigation of the dynamic stall phenomenon on a NACA 23012 oscillating airfoil. Proceedings of the Institution of Mechanical Engineers, Part G: Journal of Aerospace Engineering, 227(9):1375–1388, 2013. doi:10.1177/0954410012454100.