SEMv3: A Fast and Robust Approach to Table Separation Line Detection
Abstract
Table structure recognition (TSR) aims to parse the inherent structure of a table from its input image. The “split-and-merge” paradigm is a pivotal approach to parse table structure, where the table separation line detection is crucial. However, challenges such as wireless and deformed tables make it demanding. In this paper, we adhere to the “split-and-merge” paradigm and propose SEMv3 (SEM: Split, Embed and Merge), a method that is both fast and robust for detecting table separation lines. During the split stage, we introduce a Keypoint Offset Regression (KOR) module, which effectively detects table separation lines by directly regressing the offset of each line relative to its keypoint proposals. Moreover, in the merge stage, we define a series of merge actions to efficiently describe the table structure based on table grids. Extensive ablation studies demonstrate that our proposed KOR module can detect table separation lines quickly and accurately. Furthermore, on public datasets (e.g. WTW, ICDAR-2019 cTDaR Historical and iFLYTAB), SEMv3 achieves state-of-the-art (SOTA) performance. The code is available at https://github.com/Chunchunwumu/SEMv3.
1 Introduction
Tables serve as efficient tools for organizing and presenting crucial information in documents. The structure of a table and the content within its cells collaboratively convey the information in the table. Table structure typically refers to the relationships between cells in a table, involving the spanning of rows and columns. Table structure recognition (TSR) aims to extract inherent structure of a table from unstructured tabular data (table image or scanned document). Table structure recognition plays a crucial role in document digitization and intelligent document analysis Chi et al. (2019); Zheng et al. (2021).
The TSR methods based on deep learning can be broadly categorized into three paradigms: image-to-markup based, region based and split-and-merge based. Image-to-markup based TSR methods Zhong et al. (2020); Smock et al. (2022) directly generate table structure tokens from table images, which exhibit weaknesses in handling large tables due to the length of generation. Region based TSR methods Long et al. (2021); Liu et al. (2022) initially detect the cell boxes and then predict the logical adjacency of the detected table cells. However, in detecting table cells, they face challenge in robustly handling cases where visual clues are not obvious, such as wireless tables or blank cells. Split-and-merge based TSR methods Zhang et al. (2024); Wang et al. (2023); Lyu et al. (2023) initially employs a split sub-network to detect table row and column separation lines. Subsequently, these separation lines are intersected to delineate the table grids. A merge sub-network is then utilized to merge the over-split table grids into table cells. Recently, split-and-merge based approach for TSR has attracted a lot of research attention.
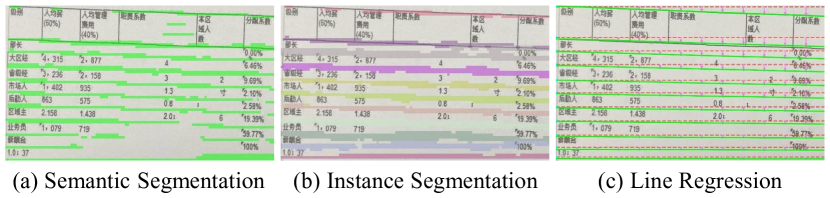
In the pipeline of split-and-merge based solution, the results of table separation line detection highly impact the accuracy of table structure recognition. Due to the diversity in table styles, accurately detecting table separation lines is challenging. As illustrated in Fig. 1, the prevailing approaches for table separation line detection can be categorized according to the following types. The first type methods Schreiber et al. (2017); Zhang et al. (2022); Ma et al. (2023) address the separation line detection through semantic segmentation, which require complex mask-to-line post-processing to parse table separation lines, as shown in Fig. 1(a). The second paradigm conceives the table separation line detection task within the framework of instance segmentation Zhang et al. (2024), as shown in Fig. 1(b). Each separation line instance has a similar slender appearance. In order to distinguish different instances, position-sensitive instance representation features are important. However, position-sensitive instance information is difficult to learn during the training process based on instance segmentation loss. This leads to less robust separation line detection results compared to our method. The third paradigm formulates separation line detection as a line regression problem Lin et al. (2022).
In order to strengthen the robustness of separation line detection, we introduce a new Keypoints Offset Regression module (KOR) in this paper. This module approaches separation line detection from a line regression perspective, as shown in Fig. 1(c). Specifically, KOR represents a separation line as keypoints and regresses the offsets between the line and its keypoint proposals to accurately locate the line. Compared to other segmentation-based separation line detection methods, our approach eliminates the need for complex mask-to-line post-processing and is more robust. In contrast to previous line regression methods Lin et al. (2022); Wang et al. (2023); Lyu et al. (2023), we do not directly predict the absolute coordinates of line keypoints within the table image. Instead, we predict the offsets from the proposals, effectively incorporating the location prior of the keypoints, which reduces the difficulty of regression.
Following the split stage, the over-split table grids are merged in the merge stage. In order to achieve a precise and effective merging of these table grids, we introduce the concept of a “merge action” to denote the merging operation for each table grid. We utilize only simple convolutional layers in the construction of the merge module to predict the merging actions of the grids.
We amalgamate the Keypoints Offset Regression module (KOR) with the merge module, constituting an end-to-end table structure recognition system denominated SEMv3. Our primary contributions are delineated as follows:
-
•
We propose Keypoints Offset Regression module (KOR) to robustly and quickly detect the table separation line. KOR represents separation lines with a series of keypoints, locating these keypoints by regressing the offset from proposals to keypoints.
-
•
We define the merging action of each grid to describe table structure, which can effectively improve the accuracy of merging.
-
•
Our proposed SEMv3 attains state-of-the-art results on prominent public benchmarks, including ICDAR-2019 cTDaR Historical Gao et al. (2019), WTW Long et al. (2021), and iFLYTAB Zhang et al. (2024). SEMv3 excels in diverse and challenging TSR scenarios, encompassing wireless tables, and deformed tables.
2 Related Work
2.1 Image-to-markup Based TSR
Image-to-markup based TSR methods Zhong et al. (2020); Nassar et al. (2022); Huang et al. (2023) use encoder-decoder architecture to generate table structure markups from a table image. However, auto-regressive decoding the structure markups causes error accumulation and inefficient inference. DRCC Shen et al. (2023) adopts a cascaded two-step decoder architecture, predicting row tags first and then cell tags for each row in a semi-autoregressive manner. This approach alleviates the error accumulation problem specific to auto-regressive models. OTSL Lysak et al. (2023) introduces a new table structure representation language, reducing the difficulty of decoding structure tokens. Nevertheless, Image-to-markup based TSR methods require a substantial amount of training data to achieve optimal performance.
2.2 Region Based TSR
Region based TSR methods Xue et al. (2019); Zou and Ma (2020); Prasad et al. (2020); Xiao et al. (2022) initially identify primitive regions, such as text segments or cell boxes, and subsequently recover the logical relationships among these primitive regions. To achieve accurate primitive region detection, methods like Raja et al. (2020); Qiao et al. (2021); Zheng et al. (2021) leverage the characteristics of cell arrangement to introduce additional constraints. However, these constraints are effective only for tables without deformations. For a more precise recovery of the logical positions of primitive regions, FLAG Liu et al. (2021) and NCGM Liu et al. (2022) enhance the feature representation of nodes in the relational graph. LORE Xing et al. (2023) employs a cascaded structure to regress the logical position of cells. Limited by cell detection, the performance of these methods in handling blank cells and wireless tables still needs improvement.
2.3 Split-and-merge Based TSR
Split-and-merge based TSR methods detect table separation lines to parse table grids, then merge the over-split grids into table cells. In the split stage, early methods Schreiber et al. (2017); Tensmeyer et al. (2019); Zhang et al. (2022) assume that the table lines are aligned, so they could not handle tables with deformations. In order to address deformed table samples, RobusTabNet Ma et al. (2023) utilized spatial CNN (SCNN) Pan et al. (2018) to enhance the feature representation of separation lines. TRACE Baek et al. (2023) predict the mask of visible and non-visible lines separately. But RobusTabNet and TRACE require complex post-processing of mask-to-line. SEMv2 Zhang et al. (2024) addresses separation line detection in the way of instance segmentation. SEMv2 aggregates instance convolution kernels with global information and then obtains separation line instance-level masks by convolving instance convolution kernels with instance-independent feature maps. However, the position-insensitivity of the instance convolution kernels results in less robust line detection. TSRFormer Lin et al. (2022) is the first to define table separation line detection as line regression and uses Dert to directly regress the position of keypoints. TSRFormer with DQ-DETR Wang et al. (2023) introduces dynamic object queries to gradually regress keypoints. Nevertheless, this approach reduces the efficiency of line regression. GridFormer Lyu et al. (2023) completes splitting by directly predicting the coordinates of grid corners.
In the merge stage, RobusTabNet and TSRFormer predict the merging relationship between grids using a relational network Zhang et al. (2017), which do not take advantage of global features of grid cells structure. SEMv2 predicts a merging map for each grid, which is redundant. RNN networks Cho et al. (2014) are used in SEM Zhang et al. (2022) to predict cell merging map serially. It is time-consuming and needs additional text information from Off-the-shelf OCR engine.
3 Method
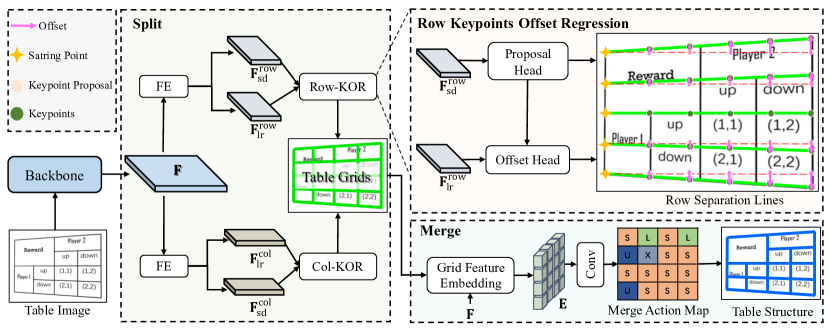
As illustrated in Fig. 2, SEMv3 extracts visual features from the backbone. The split module predicts the row and column separation lines by regressing the offsets between proposals and the keypoints. And then the separation lines are intersected to obtain the table grids. The merge module merges the over-split grids into cells by predicting the merge actions based on starting grid of grids.
To obtain the visual features of the input table image, we use Resnet-34 He et al. (2016) with FPN Lin et al. (2017a) as backbone to generate four different levels of features . Subsequently, we amalgamate the information from all levels of the FPN pyramid into a single output . and represent the width and height of the input table image, respectively. is the number of feature channel.
3.1 KOR Based Split Module
Within the split module, two parallel branches are attached to the shared feature map F for the detection of row and column separation lines, respectively. Each branch includes two modules: a feature enhancement module to enrich the context information of F, and a keypoints offset regression module (KOR) aimed at detecting the separation lines. In the following sections, we will elucidate the details of these two modules by using the row separation line detection branch as an illustrative example.
3.1.1 Feature Enhancement Module
Inspired by RobusTabNet Ma et al. (2023), We employ the Spatial CNN module Pan et al. (2018) to enhance the feature F. The spatial CNN module enhances visual features through efficient row and column messaging. We combine repeat 4 down-sample blocks Lin et al. (2022) and two cascaded spatial CNN into feature enhancement module. We obtain the row start point detection feature and the row line regression feature through two row feature enhancement modules with non-shared parameters based on row information passing. Likewise, we calculate enhanced features and for columns.
3.1.2 Keypoints Offset Regression Module
Separation line representation. To unify the definition of separation lines in wired tables and wireless tables, we consider the visible cell border line as the separation line in wired tables. For wireless table, we define median line of separation region Schreiber et al. (2017) as row/column separation line. We represent the row separation line with keypoints . denotes the number of keypoints. is determined by the width of input image and the sampling step size , as defined in Eq.1.
| (1) |
The x-coordinates of the keypoints are denoted as , where . Given that the x-coordinates are fixed, the position of a row separation line can be defined solely by the y-coordinates of its keypoints. To predict these y-coordinates, we regress the y-axis offset between the keypoints and their proposals. The first keypoint in the row separation line is designated as the starting point. The keypoint proposals share the same x-coordinates as the keypoints and have y-coordinates identical to the starting point, as shown in the Row Keypoints Offset Regression subplot of Fig. 2.
Keypoint proposal head. The x-axis coordinate of the starting point is fixed at 0. Drawing inspiration from SEMv2 Zhang et al. (2024) and TSRFormer Lin et al. (2022), we classify whether each row has a starting point to determine the y-axis coordinate of the starting point of the row separation line. We predict the probability of each row having a starting point using row-wise average pooling and a softmax operation on the row start point detection feature . Subsequently, we apply Non-Maximum Suppression (NMS) Zhang et al. (2024) to eliminate duplicate starting point predictions. We then sample keypoint proposals for each row separation line, which are horizontally aligned with the starting point.
Keypoint offset head. The deformation of table can result in that keypoint proposals do not accurately represent the curved separation line. To address this challenge, we further predict the offset between the proposals and the ground truth keypoints. The offset helps in refining the location of the keypoints. We sample features of proposals from the row line regression feature based on the coordinates of the proposals. Here, indicates the number of row separation lines. We obtain the whole separation line representation features for each row separation line by averaging the proposals features belonging to the same row, as following:
| (2) |
To ensure that each keypoint can consider the information of whole line, we concatenate the line representation features of each row to the feature of the proposals in the channel dimension. In Eq.3, K denotes the keypoint feature.
| (3) |
Instead of using a fully connected network to predict the offsets of keypoints, we employ a convolution layer on the keypoint feature K to predict the offset in the row separation line detection branch. This operation allows each keypoint to pay attention to the information of adjacent keypoints, thereby ensuring a smooth separation line.
After predicting row and column separation lines, we create the intersection of the row and column separation lines to obtain quadrilateral boxes of grids . and denote the number of rows and columns of the grid, respectively.
3.2 Merge Module
3.2.1 Grids Feature Embedding
The representation feature of the grids is the sum of visual features extracted by the RoiAlign He et al. (2017) algorithm and the absolute position embedding (PE) Xu et al. (2020) of the grids. is the number of the representation feature channel.
| (4) |
The PE employs a fully connected network to map normalized top-left corner and bottom-right corner coordinates of the grid to dimensions. To enhance , we introduce a row/column-based self-attention mechanism, which automatically aggregates features from other grids, resulting in the enhanced grid representation feature E.
3.2.2 Merge Action Prediction
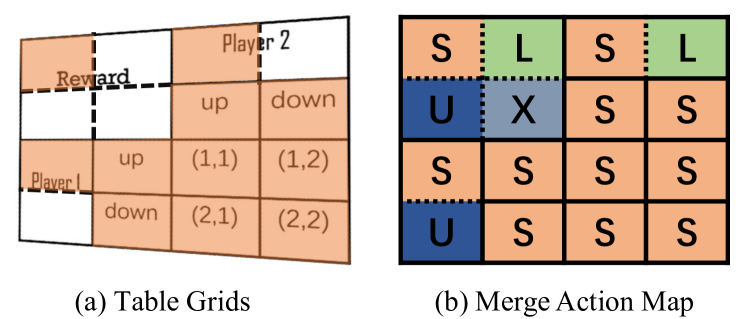
Inspired by OTSL Lysak et al. (2023) and Formerge Nguyen et al. (2023), we define the merging action of a grid to depict the table structure, as shown in Fig. 3. The upper-left grid in a cell serves as the starting grid, as illustrated in Fig 3(a). As shown in Fig. 3(b), the merging action for starting grids is Stay, implying that these grids do not need to merge either to the left or upwards. The merge action for grids in the same row as the starting grids is Left, suggesting that these grids need to merge with the ones on their left. The merge action for grids in the same column as the starting grids is Upward, indicating that these grids need to merge with the ones above them. The merge action for the remaining grids in the same cell is X, which denotes merging both upwards and to the left. This novel definition of merge action allows us to succinctly and comprehensively characterize the grid based table structure with only one merge action map, as shown in Fig. 3(b).
According to the definition of merge action, the starting grids play a pivotal role in determining the merge action of the remaining grids within the same cell. To enhance the accuracy of merge action prediction, we introduce an auxiliary branch for the classification of starting grids. This helps in identifying the starting grids during the prediction of merge action. In this branch, we transform E into the starting grid classification feature, , using a convolutional layer. is used to classify the starting grids. Finally, we concatenate and E channel-wise to predict the merge action.
3.3 Training Object
Starting points detection loss. We supervise the prediction of starting points using binary cross-entropy loss . This is represented as:
| (5) |
Although the starting point has a width of only 1 pixel, we enlarge the range of starting points for ease of training. Here, represents the ground truth distribution of starting points for the row separation line. In wireless tables, is set to 1 if the row is located in the separation region. For wired tables, is 1 if the row is located in the neighborhood of starting points with a width of 8. We also calculate the loss for column starting points.
Keypoints offset regression loss. denotes to the ground truth offset between the keypoint proposal in the row separation line. The loss of row line keypoints offset is calculated with L2 loss, as:
| (6) |
We define the column line keypoints offset loss in the same manner.
Merge action classification loss. We use focal loss in in both predicting starting grids and merge actions.
| (7) |
| (8) |
The loss for starting grid classification and merge action prediction are denoted as and respectively. is set to 1 if a grid is a starting grid. The symbol represents a merge action, which can take one of four values: S, L, U, or X. The term refers to the focal loss Lin et al. (2017b).
Overall loss. All the modules in SEMv3 are trained end-to-end. The overall loss function is a summation of several component losses, as shown below:
| (9) |
4 Experiment
4.1 Implementation
We use Resnet-34 pretrained on ImageNet Krizhevsky et al. (2012) with FPN as backbone. And the feature channel number is 256, grid feature channel number is 512. The sampling step size is 32. Models are trained end-to-end for 100 epochs. We use Adam Kingma and Ba (2014) as the optimizer. The initial learning rate is , and the learning rate is adjusted to according to the cosine annealing strategy Loshchilov and Hutter (2016). All experiments are implemented in Pytorch v1.7.1 and conducted on 4 Nvidia Tesla V100 GPUs with 24GB RAM memory. During the training process, the ground truth grid boxes coordinates are used when extracting grid represent feature using RoIAlign.
| Methods | P | R | F1 |
|---|---|---|---|
| TabStructNet Raja et al. (2020) | 82.2 | 78.7 | 80.4 |
| FLAGNet Liu et al. (2021) | 85.2 | 83.8 | 84.5 |
| NCGM Liu et al. (2022) | 84.6 | 86.1 | 85.3 |
| SEMv2 Zhang et al. (2024) | 89.2 | 82.8 | 85.9 |
| LORE Xing et al. (2023) | 87.9 | 88.7 | 88.3 |
| SEMv3 | 90.3 | 88.4 | 89.3 |
| Methods | P | R | F1 |
|---|---|---|---|
| Cycle-CenterNet Long et al. (2021) | 93.3 | 91.5 | 92.4 |
| NCGM Liu et al. (2022) | 93.7 | 94.6 | 94.1 |
| TSRFormer-DQ Wang et al. (2023) | 94.5 | 94.0 | 94.3 |
| SEMv2 Zhang et al. (2024) | 93.8 | 93.4 | 93.6 |
| Xing et al. (2023) | 94.5 | 95.9 | 95.1 |
| SEMv3 | 94.8 | 95.4 | 95.1 |
4.2 Datasets and Metric
We evaluate the performance of our method on several public datasets. These datasets encompass a wide range of challenging scenarios related to table structure recognition.
ICDAR-2019 cTDaR Historical Gao et al. (2019) dataset contains 600 training samples and 150 testing samples from archival historical documents. This dataset presents several challenges, including a limited number of training sets, unclear row and column separation lines, and deformation in the table area. We use the cell adjacency relationship (IoU=0.6) Göbel et al. (2012); Gao et al. (2019) as the evaluation metric of this dataset.
WTW Long et al. (2021) contains 14581 wired table images collected from real business scenarios. There are seven difficult cases in this dataset: inclined tables, curved tables, occluded or blurred tables, tables with extreme aspect ratios, overlaid tables, multi-colored tables, and irregular tables. Metric on WTW is the cell adjacency relationship (IoU=0.6) Göbel et al. (2012); Gao et al. (2019).
iFLYTAB Zhang et al. (2024) contains 12,103 training samples and 5,188 testing samples. The dataset includes a variety of complex examples from both electronic documents and natural scenes. Based on the table data collection scenarios and table characteristics, iFLYTAB is further divided into four subsets: Wired-Digital (WDD), Wired-Camera-Capture (WDC), Wireless-Digital (WLD), and Wireless-Camera-Capture (WLC). We use the cell adjacency relationship Göbel et al. (2012) followed SEMv2 Zhang et al. (2024) as the evaluation metric. To evaluate the performance of the split stage, we use grid detection with an IoU of 0.9 Long et al. (2021) as the metric. F1-G represents the F1-score for grid detection, in Table 5.
SciTSR Chi et al. (2019) and PubTabNet Zhong et al. (2020) are from scientific literature PDF, where table samples have aligned axis. The test subset of SciTSR, SciTSR-comp, is composed of 716 complex tables containing span-cells. We evaluate our method with the cell adjacency relationship metric Göbel et al. (2012) on SciTSR-comp. TEDS and TEDS-Struct Zhong et al. (2020) is used to evaluate performance on PubTabNet.
4.3 Comparison with State-of-the-arts
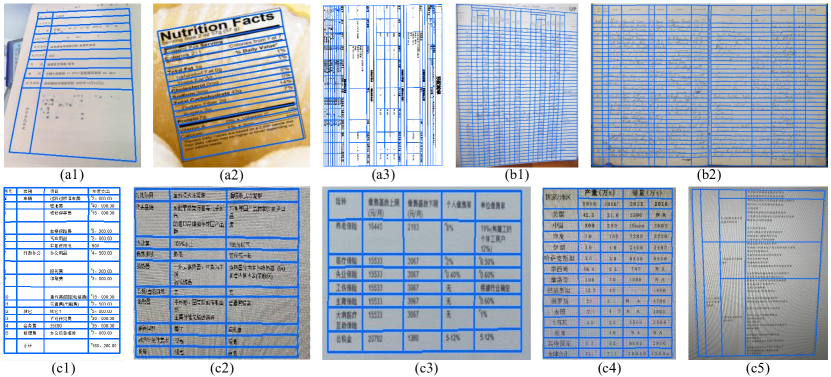
Our method focuses on robustly recovering the table structure from deformed and wireless tables in challenging scenarios. On the following three challenging datasets, our method achieves SOTA. On ICDAR-2019 cTDaR Historical dataset, we achieve 88.9% F1 score, as shown in Table 1. On WTW dataset, we achieve performance with SOTA, as shown in Table 2. Notably, LORE who is the second best on these two datasets takes 0.5 for IoU when evaluating models while we take 0.6. On iFLYTAB dataset, as shown in Table 3, we improve SEMv2 by 0.9% F1 score. As shown in Fig. 4, Our approach performs well on challenging table samples, e.g., deformed tables, blurred tables, wireless tables.
| Methods | P | R | F1 |
|---|---|---|---|
| SEM Zhang et al. (2022) | 81.7 | 74.5 | 78.0 |
| SEMv2 Zhang et al. (2024) | 93.8 | 93.3 | 93.5 |
| SEMv3 | 94.4 | 94.2 | 94.4 |
Our model also demonstrates comparable performance to SOTA in simpler scenarios involving electronic documents. However, the testing dataset of SciTSR has been manually rectified in various ways, resulting in an unfair comparison on the SciTSR dataset. On the PubTabNet, the performance of our method is slightly inferior to that of LORE, which belongs to the region-based methods. In the split-and-merge based methods, we achieve performance comparable to SOTA.
4.4 Ablation Studies
| Methods | SciTSR-COMP | PubTabNet | |||
|---|---|---|---|---|---|
| P | R | F1 | TEDS | TEDS-S | |
| RobusTabNet | 99.0 | 98.4 | 98.7 | - | 97.0 |
| TSRFormer | 99.1 | 98.7 | 98.9 | - | 97.5 |
| LORE | 99.4 | 99.2 | 99.3 | 98.1 | - |
| TSRFormer-DQ | 99.1 | 98.6 | 98.8 | - | 97.5 |
| SEMv2 | 98.7 | 98.6 | 98.7 | - | 97.5 |
| SEMv3 | 99.1 | 98.9 | 99.0 | 97.3 | 97.5 |
| System | Split | Merge | WLC | WLD | WDC | WDD | Total | ||||||
|---|---|---|---|---|---|---|---|---|---|---|---|---|---|
| IS | KOR | MP | MA | F1 | F1-G | F1 | F1-G | F1 | F1-G | F1 | F1-G | F1 | |
| T1 | ✓ | ✓ | 90.8 | 18.5 | 92.4 | 24.0 | 95.3 | 59.1 | 95.5 | 51.8 | 93.3 | ||
| T2 | ✓ | ✓ | 91.7 | 37.1 | 92.8 | 53.7 | 95.5 | 64.6 | 95.3 | 63.6 | 93.6 | ||
| T3 | ✓ | ✓ | 91.6 | 20.4 | 93.1 | 27.2 | 96.5 | 60.6 | 96.3 | 53.0 | 94.0 | ||
| T4 | ✓ | ✓ | 92.5 | 37.9 | 93.4 | 59.9 | 96.4 | 64.6 | 96.3 | 63.2 | 94.4 | ||
To verify the effectiveness of our split and merge module, we undertake ablation experiments through several systems designed as shown in Table 5. In the split stage, the Instance Segmentation (IS) based separation line detection module from SEMv2, employs dynamic convolution to generate a segmentation mask for each separation line. We add a new convolutional layer to generate instance-independent features, following the original SEMv2 settings. In this paper, we introduce the KOR module to detect separation lines by regressing the offset between the key points and their proposals. In the merge stage, we propose a merge action based merging module(MA). Also, we implemented the ParaDec merge module in SEMv2 to predict the merge map (MP) for each grid.
4.4.1 The Robustness of the Split Module
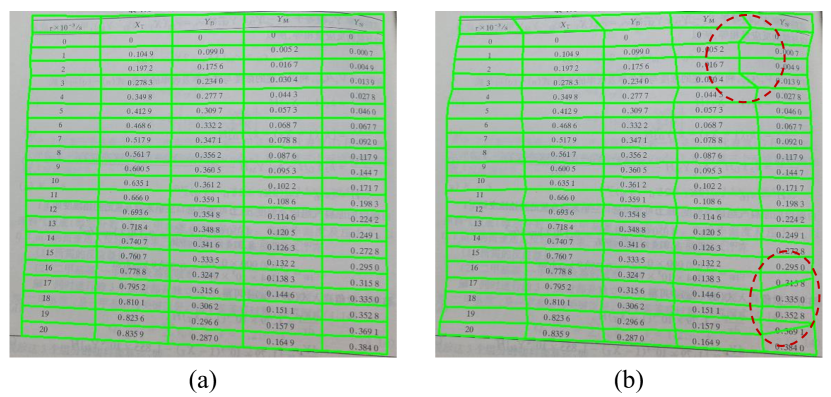
To establish the robustness of our split module, we compare the performances of IS and KOR under same merge modules. T1 and T2 serve to compare the performance of IS and KOR under the MP merge module. On the other hand, T3 and T4 illustrate the performance of IS and KOR under the MA merge module. Under both merge module settings, our KOR consistently achieves superior split results, as evidenced by the F1-G. This is particularly notable with the wireless tables (WLD and WLC), where KOR performs almost twice as well as IS. As depicted in Fig. 5, the split results of T1 and T2 on the wireless tables clearly demonstrate that KOR produces split lines of higher quality. Furthermore, our KOR proves to be more stable compared to the IS split results when the merge module changes.
4.4.2 The Speed of the Split Module
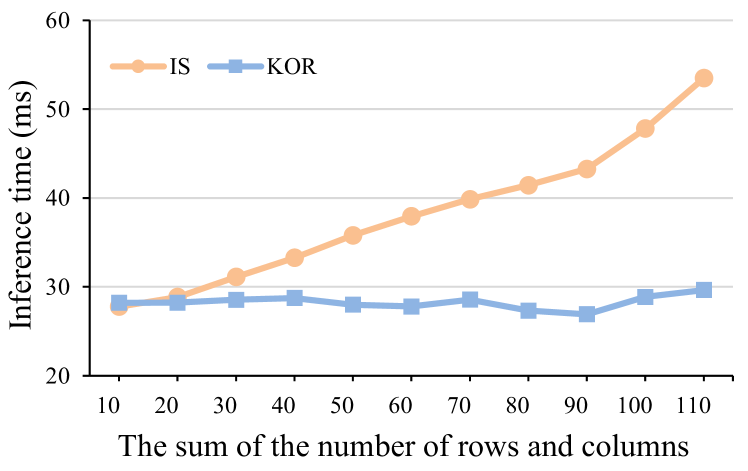
The IS split module generates a mask for each table separation line, leading to a computational cost that increases linearly with the number of rows and columns. Conversely, our method consistently represents the position of lines with a single offset map, meaning the computational cost does not significantly increase with the growth in rows and columns. We evaluated the inference time of both split modules on the SciTSR test dataset, with images resized to . As illustrated in Fig. 6, the x-axis represents the sum of the number of rows and columns with a step of 10, while the y-axis represents the inference time. The inference time of our KOR is less affected by the increase in the number of rows and columns. Particularly in cases with a large number of rows and columns, KOR is significantly faster than IS.
4.4.3 The Effectiveness of the Merge Module
As shown in Table 5, MA always outperforms MP when the split module is kept constant. MA have a positive gain on the detection accuracy of separation lines with IS. Our merge module can significantly reduce the memory occupancy. The space complexity of MA is , but MP has a space complexity of . Benefiting from our modeling of the merge action, we can merge over-split grids with high accuracy using a much simpler network structure than SEMv2.
5 Conclusion
In this paper, we introduce SEMv3, a fast and robust table structure recognizer that adheres to the split-and-merge paradigm. In the split stage, we propose a split module (KOR) based on keypoints offset regression for robust and fast detection of split lines. KOR detects separation lines by regressing the offset between the keypoint proposals and the line. During the merge phase, we define a grid-based merge action to effectively characterize the table structure. Our method achieves state-of-the-art performance on the ICDAR-2019 cTDaR Historical, WTW, iFLYTAB datasets, demonstrating its effectiveness on table samples in challenging scenarios, such as wireless tables and deformed tables. Ablation experiments show that our split module KOR is fast, robust, and achieves significant improvement on wireless tables. Our merge module is also efficient.
Contribution Statement
Chunxia Qin: Conceptualization, Methodology, Writing - original draft,review and editing. Zhenrong Zhang: Conceptualization, Methodology, Writing -review and editing. Pengfei Hu: Writing -review and editing. Chenyu Liu: Methodology, Writing -review and editing, Resources. Jiefeng Ma: Writing -review and editing. Jun Du: Methodology, Writing - review and editing.
References
- Baek et al. [2023] Youngmin Baek, Daehyun Nam, Jaeheung Surh, Seung Shin, and Seonghyeon Kim. Trace: Table reconstruction aligned to corner and edges. In Document Analysis and Recognition - ICDAR 2023: 17th International Conference, page 472–489, 2023.
- Chi et al. [2019] Zewen Chi, Heyan Huang, Heng-Da Xu, Houjin Yu, Wanxuan Yin, and Xian-Ling Mao. Complicated table structure recognition. arXiv preprint arXiv:1908.04729, 2019.
- Cho et al. [2014] Kyunghyun Cho, Bart van Merriënboer, Dzmitry Bahdanau, and Yoshua Bengio. On the properties of neural machine translation: Encoder–decoder approaches. In Proceedings of SSST-8, Eighth Workshop on Syntax, Semantics and Structure in Statistical Translation, pages 103–111, October 2014.
- Gao et al. [2019] Liangcai Gao, Yilun Huang, Hervé Déjean, Jean-Luc Meunier, Qinqin Yan, Yu Fang, Florian Kleber, and Eva Lang. Icdar 2019 competition on table detection and recognition (ctdar). In 2019 International Conference on Document Analysis and Recognition (ICDAR), pages 1510–1515, 2019.
- Göbel et al. [2012] Max Göbel, Tamir Hassan, Ermelinda Oro, and Giorgio Orsi. A methodology for evaluating algorithms for table understanding in pdf documents. In Proceedings of the 2012 ACM Symposium on Document Engineering, page 45–48, 2012.
- He et al. [2016] Kaiming He, Xiangyu Zhang, Shaoqing Ren, and Jian Sun. Deep residual learning for image recognition. In 2016 IEEE Conference on Computer Vision and Pattern Recognition (CVPR), pages 770–778, 2016.
- He et al. [2017] Kaiming He, Georgia Gkioxari, Piotr Dollár, and Ross Girshick. Mask r-cnn. In 2017 IEEE International Conference on Computer Vision (ICCV), pages 2980–2988, 2017.
- Huang et al. [2023] Yongshuai Huang, Ning Lu, Dapeng Chen, Yibo Li, Zecheng Xie, Shenggao Zhu, Liangcai Gao, and Wei Peng. Improving table structure recognition with visual-alignment sequential coordinate modeling. In Proceedings of the IEEE/CVF Conference on Computer Vision and Pattern Recognition (CVPR), pages 11134–11143, June 2023.
- Kingma and Ba [2014] Diederik Kingma and Jimmy Ba. Adam: A method for stochastic optimization. Computer Science, 2014.
- Krizhevsky et al. [2012] Alex Krizhevsky, I. Sutskever, and G. Hinton. Imagenet classification with deep convolutional neural networks. Advances in neural information processing systems, 25(2), 2012.
- Lin et al. [2017a] Tsung-Yi Lin, Piotr Dollár, Ross Girshick, Kaiming He, Bharath Hariharan, and Serge Belongie. Feature pyramid networks for object detection. In 2017 IEEE Conference on Computer Vision and Pattern Recognition (CVPR), pages 936–944, 2017.
- Lin et al. [2017b] Tsung-Yi Lin, Priya Goyal, Ross Girshick, Kaiming He, and Piotr Dollár. Focal loss for dense object detection. In Proceedings of the IEEE international conference on computer vision, pages 2980–2988, 2017.
- Lin et al. [2022] Weihong Lin, Zheng Sun, Chixiang Ma, Mingze Li, Jiawei Wang, Lei Sun, and Qiang Huo. Tsrformer: Table structure recognition with transformers. In Proceedings of the 30th ACM International Conference on Multimedia, pages 6473–6482, 2022.
- Liu et al. [2021] Hao Liu, Xin Li, Bing Liu, Deqiang Jiang, Yinsong Liu, Bo Ren, and Rongrong Ji. Show, read and reason: Table structure recognition with flexible context aggregator. In Proceedings of the 29th ACM International Conference on Multimedia, pages 1084–1092, 2021.
- Liu et al. [2022] Hao Liu, Xin Li, Bing Liu, Deqiang Jiang, Yinsong Liu, and Bo Ren. Neural collaborative graph machines for table structure recognition. In Proceedings of the IEEE/CVF Conference on Computer Vision and Pattern Recognition, pages 4533–4542, 2022.
- Long et al. [2021] Rujiao Long, Wen Wang, Nan Xue, Feiyu Gao, Zhibo Yang, Yongpan Wang, and Gui-Song Xia. Parsing table structures in the wild. In Proceedings of the IEEE/CVF International Conference on Computer Vision (ICCV), pages 944–952, October 2021.
- Loshchilov and Hutter [2016] Ilya Loshchilov and Frank Hutter. Sgdr: Stochastic gradient descent with warm restarts. arXiv preprint arXiv:1608.03983, 2016.
- Lysak et al. [2023] Maksym Lysak, Ahmed Nassar, Nikolaos Livathinos, Christoph Auer, and Peter Staar. Optimized table tokenization for table structure recognition. In Document Analysis and Recognition - ICDAR 2023: 17th International Conference, San José, CA, USA, August 21–26, 2023, Proceedings, Part II, page 37–50, 2023.
- Lyu et al. [2023] Pengyuan Lyu, Weihong Ma, Hongyi Wang, Yuechen Yu, Chengquan Zhang, Kun Yao, Yang Xue, and Jingdong Wang. Gridformer: Towards accurate table structure recognition via grid prediction. In Proceedings of the 31st ACM International Conference on Multimedia, page 7747–7757, 2023.
- Ma et al. [2023] Chixiang Ma, Weihong Lin, Lei Sun, and Qiang Huo. Robust table detection and structure recognition from heterogeneous document images. Pattern Recognition, 133:109006, 2023.
- Nassar et al. [2022] Ahmed Nassar, Nikolaos Livathinos, Maksym Lysak, and Peter Staar. Tableformer: Table structure understanding with transformers. In Proceedings of the IEEE/CVF Conference on Computer Vision and Pattern Recognition (CVPR), pages 4614–4623, June 2022.
- Nguyen et al. [2023] Nam Quan Nguyen, Anh Duy Le, Anh Khoa Lu, Xuan Toan Mai, and Tuan Anh Tran. Formerge: Recover spanning cells in complex table structure using transformer network. In International Conference on Document Analysis and Recognition, pages 522–534, 2023.
- Pan et al. [2018] Xingang Pan, Jianping Shi, Ping Luo, Xiaogang Wang, and Xiaoou Tang. Spatial as deep: Spatial cnn for traffic scene understanding. In Proceedings of the Thirty-Second AAAI Conference on Artificial Intelligence and Thirtieth Innovative Applications of Artificial Intelligence Conference and Eighth AAAI Symposium on Educational Advances in Artificial Intelligence, 2018.
- Prasad et al. [2020] Devashish Prasad, Ayan Gadpal, Kshitij Kapadni, Manish Visave, and Kavita Sultanpure. Cascadetabnet: An approach for end to end table detection and structure recognition from image-based documents. In Proceedings of the IEEE/CVF conference on computer vision and pattern recognition workshops, pages 572–573, 2020.
- Qiao et al. [2021] Liang Qiao, Zaisheng Li, Zhanzhan Cheng, Peng Zhang, Shiliang Pu, Yi Niu, Wenqi Ren, Wenming Tan, and Fei Wu. Lgpma: Complicated table structure recognition with local and global pyramid mask alignment. In International conference on document analysis and recognition, pages 99–114, 2021.
- Raja et al. [2020] Sachin Raja, Ajoy Mondal, and C. V. Jawahar. Table structure recognition using top-down and bottom-up cues. In Computer Vision – ECCV 2020: 16th European Conference, Glasgow, UK, August 23–28, 2020, Proceedings, Part XXVIII, page 70–86, 2020.
- Schreiber et al. [2017] Sebastian Schreiber, Stefan Agne, Ivo Wolf, Andreas Dengel, and Sheraz Ahmed. Deepdesrt: Deep learning for detection and structure recognition of tables in document images. In 2017 14th IAPR International Conference on Document Analysis and Recognition (ICDAR), 2017.
- Shen et al. [2023] Huawen Shen, Xiang Gao, Jin Wei, Liang Qiao, Yu Zhou, Qiang Li, and Zhanzhan Cheng. Divide rows and conquer cells: Towards structure recognition for large tables. In Proceedings of the Thirty-Second International Joint Conference on Artificial Intelligence, pages 1369–1377, 2023.
- Smock et al. [2022] Brandon Smock, Rohith Pesala, and Robin Abraham. Pubtables-1m: Towards comprehensive table extraction from unstructured documents. In Proceedings of the IEEE/CVF Conference on Computer Vision and Pattern Recognition (CVPR), pages 4634–4642, June 2022.
- Tensmeyer et al. [2019] Chris Tensmeyer, Vlad I. Morariu, Brian Price, Scott Cohen, and Tony Martinez. Deep splitting and merging for table structure decomposition. In 2019 International Conference on Document Analysis and Recognition (ICDAR), pages 114–121, 2019.
- Wang et al. [2023] Jiawei Wang, Weihong Lin, Chixiang Ma, Mingze Li, Zheng Sun, Lei Sun, and Qiang Huo. Robust table structure recognition with dynamic queries enhanced detection transformer. Pattern Recognition, 144:109817, 2023.
- Xiao et al. [2022] Bin Xiao, Murat Simsek, Burak Kantarci, and Ala Abu Alkheir. Table structure recognition with conditional attention. arXiv preprint arXiv:2203.03819, 2022.
- Xing et al. [2023] Hangdi Xing, Feiyu Gao, Rujiao Long, Jiajun Bu, Qi Zheng, Liangcheng Li, Cong Yao, and Zhi Yu. Lore: Logical location regression network for table structure recognition. In Proceedings of the Thirty-Seventh AAAI Conference on Artificial Intelligence and Thirty-Fifth Conference on Innovative Applications of Artificial Intelligence and Thirteenth Symposium on Educational Advances in Artificial Intelligence, 2023.
- Xu et al. [2020] Yiheng Xu, Minghao Li, Lei Cui, Shaohan Huang, Furu Wei, and Ming Zhou. Layoutlm: Pre-training of text and layout for document image understanding. In Proceedings of the 26th ACM SIGKDD International Conference on Knowledge Discovery & Data Mining, pages 1192–1200, 2020.
- Xue et al. [2019] Wenyuan Xue, Qingyong Li, and Dacheng Tao. Res2tim: Reconstruct syntactic structures from table images. In 2019 international conference on document analysis and recognition (ICDAR), pages 749–755, 2019.
- Zhang et al. [2017] Ji Zhang, Mohamed Elhoseiny, Scott Cohen, Walter Chang, and Ahmed Elgammal. Relationship proposal networks. In 2017 IEEE Conference on Computer Vision and Pattern Recognition (CVPR), pages 5226–5234, 2017.
- Zhang et al. [2022] Zhenrong Zhang, Jianshu Zhang, Jun Du, and Fengren Wang. Split, embed and merge: An accurate table structure recognizer. Pattern Recognition, 126:108565, 2022.
- Zhang et al. [2024] Zhenrong Zhang, Pengfei Hu, Jiefeng Ma, Jun Du, Jianshu Zhang, Baocai Yin, Bing Yin, and Cong Liu. Semv2: Table separation line detection based on instance segmentation. Pattern Recognition, page 110279, 2024.
- Zheng et al. [2021] Xinyi Zheng, Douglas Burdick, Lucian Popa, Xu Zhong, and Nancy Xin Ru Wang. Global table extractor (gte): A framework for joint table identification and cell structure recognition using visual context. In Proceedings of the IEEE/CVF Winter Conference on Applications of Computer Vision (WACV), pages 697–706, January 2021.
- Zhong et al. [2020] Xu Zhong, Elaheh ShafieiBavani, and Antonio Jimeno Yepes. Image-based table recognition: data, model, and evaluation. In European conference on computer vision, pages 564–580, 2020.
- Zou and Ma [2020] Yajun Zou and Jinwen Ma. A deep semantic segmentation model for image-based table structure recognition. In 2020 15th IEEE International Conference on Signal Processing (ICSP), volume 1, pages 274–280, 2020.