The long-period spectroscopic orbit and dust creation in the Wolf-Rayet binary system WR 125
Abstract
Several long-period binaries with a carbon-rich Wolf-Rayet star and an O star produce dust in their wind collisions. In eccentric binaries, this is seen most strongly near periastron passage. The exact conditions leading to dust creation require orbital properties to be determined, which is difficult owing to their long periods. Recently, the binary system WR 125 (WC7+O9III) began a dust creation episode seen through an infrared outburst first detected by NEOWISE-R, which was the first outburst detected since 1991. We present new near- and mid-infrared photometry, which we use to show consistency between the two outbursts and derive an orbital period of 28.12 yr. We use a long time-series of optical spectra to place the first constraints on its orbital elements, on the assumption that this system will produce dust near periastron. The orbit has a mild eccentricity of 0.290.12 and is only derived for the Wolf-Rayet component, as the O star’s radial velocities have noise that is likely larger than the expected semi-amplitude of the orbit. We also present SOFIA/FORCAST grism spectroscopy to examine the infrared spectral energy distribution (SED) of the dust during this outburst, comparing its properties to other WCd binaries, deriving a dust temperature of 580 K in 2021. This collection of observations will allow us to plan future observations of this system and place the system in the context of dust-creating Wolf-Rayet binaries.
1 Introduction
A classical Wolf-Rayet star is a massive, evolved star that has lost its outer envelope to reveal a compact, hydrogen-depleted, hot star with a strong stellar wind. These stars are usually either nitrogen-rich (spectral type WN) or carbon-rich (WC), and could form through either strong stellar winds (Conti, 1975) which would likely also include episodic mass loss (Smith & Owocki, 2006), or through binary interactions (e.g., Vanbeveren et al., 1998; Eldridge, 2009). The WC stars are sometimes observed to form dust, which is inferred through excess emission at infrared wavelengths first discovered by Allen et al. (1972). The dust production is often seen as persistent or periodic, but episodic bursts are also seen in some systems. Periodic and persistent dust makers are often seen in binary systems as first discovered with WR 140 (WC7+O5.5I; Williams et al., 1978) and WR 48a (WC9; Danks et al., 1983). Both of these systems were observed to show rapid increases in the infrared attributed to dust formation. WR 140 was subsequently shown to be a high-eccentricity binary with dust formation near periastron passage (Williams et al., 1990). It is predicted that near the time of a periastron passage, the density of wind collisions between the WC star and a companion OB star trigger dust formation. In contrast to the long-period episodically-producing dustar WR 140, persistent dust makers tend to be in low eccentricity orbits. Curiously, some such systems like Velorum have never been observed to form dust, although very similar to ones that do.
The dust production in WC binaries could be of cosmological importance. Both Marchenko & Moffat (2007) and Lau et al. (2021) suggest that the formation of WC binaries could be the first source of dust in a low metallicity environment. They can form dust earlier than supernovae because the higher mass and hence more rapidly evolving WC star can form through binary interactions before the supernova takes place, where the primary star loses its envelope through Roche lobe overflow onto its OB companion. Then, as the Roche lobe overflow ends, the strong stellar winds of the two stars will form a shock interface conducive to dust formation down stream from the heated apex.
Of the WC binary “dustars”, the prototype is often considered to be WR 140. This system has a very well-established orbit, both spectroscopically (Fahed et al., 2011; Thomas et al., 2021) and with a visual orbit established through interferometry (Monnier et al., 2011; Thomas et al., 2021). It has a long 7.93 yr period with high eccentricity () with the dust formation triggered by a changing gas density in the shock front near periastron. At this binary phase, the increase in the density of the shocked gas prompts increased X-ray production, but this seems to switch to cooling via optical emission lines at phases very close to periastron, perhaps allowing the conditions for dust production to occur (Pollock et al., 2021).
Williams et al. (2009) found that the dust around this prototype “dustar” (WR 140) survived at least two cycles from imaging fossil dust around the system at mid-infrared wavelengths. The overarching question of dust survivability in these hostile environments was still open however in part due to limited spatial resolution and sensitivity with ground-based imaging, although Marchenko et al. (2003) showed from ground-based mid-IR imagery that the dust in WR140 very likely reached the ISM. With a short exposure using JWST+MIRI at mid-infrared wavelengths, Lau et al. (2022) showed that the dust survives at distances out to 70,000 AU from WR 140, likely implying that the dust should survive and be included in the dust budget of galaxies.
WR 125 is a near spectroscopic twin to WR 140 (Abbott et al., 1986), and is the topic of this paper, first noted as IC 14-36 by Iriarte & Chavira (1956). Williams et al. (1987) observed this star with infrared photometry but found it not to show variation in its infrared flux. However, its near twin status prompted continued infrared monitoring until Williams et al. (1992) discovered an infrared outburst in the years 1990–1991. Williams et al. (1994) reported on additional infrared photometry of WR 125 during this outburst and presented some of the first optical spectroscopy of the system. They confirmed that the emission line dilution is caused by an O9III companion star based on the optical absorption lines present. Furthermore, Williams et al. (1994) presented infrared spectroscopy of the system and the dust cloud, finding no signatures of the WR wind lines in the 10 m region, nor the 11.52 m graphite feature, suggesting that the dust had to be amorphous carbon.
Very little progress was made on WR 125 for many years following this initial discovery of dust creation and that the star had remarkable similarities to WR 140. While the star had been occasionally included in infrared sky surveys, infrared monitoring was largely absent. The launch of the Wide-field Infrared Survey Explorer (WISE) in 2009, which was reactivated (Mainzer et al., 2014) as the Near-Earth Object Wide-field Infrared Survey Explorer (NEOWISE-R) in 2013 December following a hibernation of the satellite that began in 2011 February. While NEOWISE-R was unable to observe at the longer wavelengths from the WISE mission, its continued sky monitoring at 3.4 and 4.6 m showed that the WR 125 system began a second dust creation outburst in 2018 as reported by Williams (2019), indicating that the binary was once again approaching the phases amenable to dust production.
The increase in infrared flux observed with the NEOWISE-R mission (Williams, 2019) has prompted a few new studies into WR 125. Midooka et al. (2019) reported on a few public X-ray observations of WR 125 taken with the Swift and XMM-Newton X-ray observatories. The observations, largely taken prior to the start of the current dusty outburst, were fairly constant in their flux and shape. The flux was the same as observed in 1981 with the Einstein satellite, but the flux was lower during the previous dust outburst in 1991 as observed with ROSAT. This is likely similar to that of the prototype of the dust-making WC binaries, WR 140, which also shows an X-ray dip at some phases close to periastron as described by Pollock et al. (2021).
In addition to the X-ray observations, Endo et al. (2022) presented a mid-infrared spectrum of the system taken with Subaru and the COMICS instrument. They found that the system shows a broad 8 m feature that was also seen in several WCd stars observed with ISO and the SWS instrument. This feature is a typical “unidentified infrared” (UIR) band, which often correlates to other infrared features. These UIR features are also seen in spatially-resolved spectroscopy of the dust surrounding WR 140 and imaged with JWST (Lau et al., 2022). Endo et al. (2022) presented MIR spectroscopic observations of WR 125 obtained in 2019 that were characterized with a blackbody temperature of nearly 800 K after removing the underlying stellar flux. This was hotter dust than seen in the other WR binaries they used as a comparison from ISO observations, likely as it was more recently formed. They also derived a period of 28.1 yr by a comparison of a single infrared flux point with the light curve presented by Williams et al. (1992, 1994).
Many of these results show that WR 125 is a prime target for additional observations and understanding the dust production around these systems. To date, no spectroscopic orbit has been measured, and a time-series analysis of the infrared photometry is strongly needed. To that end, we present new observations in Section 2 and analyze the time-series photometry in Section 3 to obtain a period with higher confidence than elsewhere. In Section 4, we present the first spectroscopic orbit of the system. We present an infrared spectrum taken with SOFIA and FORCAST in Section 5. We discuss these findings in Section 6, and then conclude our study.
2 Observations
2.1 Infrared Photometry
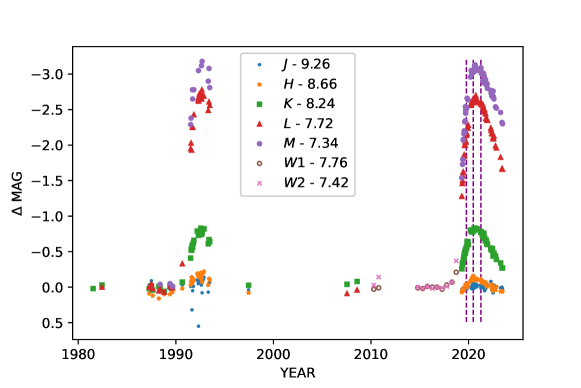
Near- and mid-infrared photometry of WR 125 has been collected with the Sternberg Astronomical Institute’s (SAI) Crimean Laboratory of Moscow State University using a photometer with an InSb photovoltaic detector cooled with liquid nitrogen (Shenavrin et al., 2011). Observations have been taken regularly since the beginning of the current dust creation episode that was observed with NEOWISE-R (Williams, 2019) and are shown in Fig. 1; subsequent observations of WR 125 with NEOWISE-R are severely saturated. The new data allow comparison with the previously observed outburst. One of these observations was also used by Endo et al. (2022). Each data point consists of multiple sub-exposures of 30–60 s with a total integration time of 5–10 minutes in each of the filters and 20–25 minutes in the filter. The observations are compared to the standard star BS 7488 (Johnson et al., 1966) observations taken before or after each observation of the target. The light curve is tabulated as an online data file. In addition to these new data, along with the archival measurements from Williams et al. (1992, 1994), we include the two measurements from 2007 and 2008 taken at UKIRT and reported by Endo et al. (2022) in this analysis. For our analysis, we have combined and data into one light curve, as this is also how archival data (e.g., Williams et al., 1994) have been presented.
2.2 Optical Spectroscopy
We have collected spectroscopy of WR 125 with three instruments. These spectra typically have a signal-to-noise of at least 100 at wavelengths longer than Å and were all reduced using standard pipelines and techniques for the instruments used. The first set of spectra were obtained with the Keck I telescope and the Low Resolution Imaging Spectrometer (LRIS; Oke et al., 1995; Rockosi et al., 2010) on seven independent nights, which provides spectra with wavelength coverage from Å to Å. The spectrograph had a dispersion of 0.64 Å pixel-1 and we typically obtained a signal-to-noise of 100 per sub-exposure with a 5-minute exposure.
We also collected spectra with the Keck II telescope and the Echellette Spectrograph and Imager (ESI; Sheinis et al., 2002). These data have a resolving power of 13,000 and cover several orders of the spectrum between 3900 Å and 1.1 m. Near the C III 5696 line, our data had a typical signal-to-noise of 100 in an order of the spectrograph covering 5100 to 5970 Å with a dispersion of 0.21 Å pixel-1. A typical spectrum was obtained with a 5-minute exposure.
Lastly, we obtained a few spectra with Gemini-North and the Gemini Multi-Object Spectrograph (GMOS; Hook et al., 2004). We used the B600 grating with the G5307 blocking filter to obtain spectra between 4115 Å and 7410 Å, with a dispersion of 1.0 Å pixel-1. In the vicinity of the C III 5696 line, our data had a typical signal-to-noise of 100 for an exposure of 100 s.
2.3 SOFIA Infrared Spectroscopy
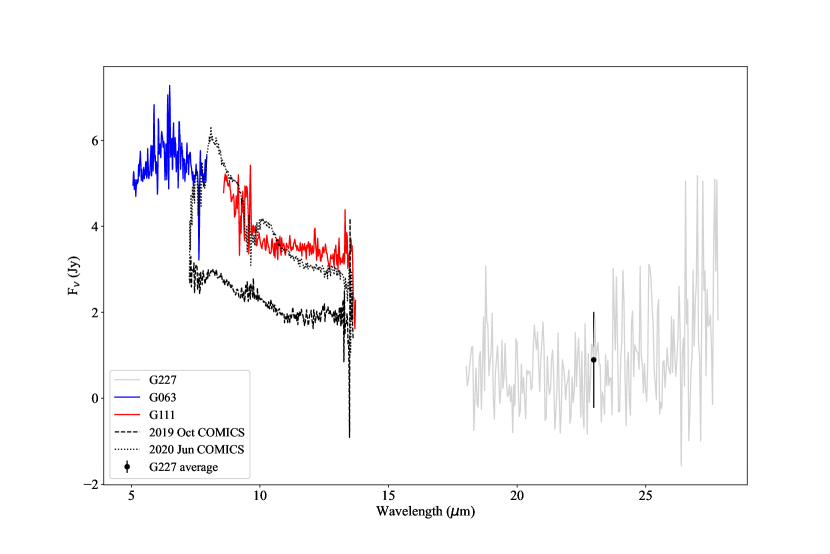
We obtained mid-IR grism spectroscopy using the FORCAST instrument (Herter et al., 2013, 2018) onboard SOFIA (Temi et al., 2018) during the peak of the recent dust creation outburst. These observations, taken on 2021 April 8, used both the G063 and G111 grating setups. The G063 setup covers the wavelength range of 4.9–8.0 m, but we found the spectra near the edge of the chip to be too noisy for analysis, effectively reducing the useful range to 5.1–7.9 m. The G111 setup was used for a spectrum in the range of 4.9–8.0 m. Both of these spectra were taken with the 2.4 slit, yielding a spectral resolving power of and respectively. There was an additional spectrum taken with the G227 setup that covers the 17.6-–27.7 m range. This setup provided very low signal-to-noise, so we use this primarily to provide a flux point at 23 m. All data were processed through the typical SOFIA pipelines. The FORCAST grism data are known to have variable slit-losses, adding uncertainty to the flux calibration, but these data should be accurate to a few percent (e.g., Gehrz et al., 2021).
3 The Orbital Period from the Infrared Photometry
Fig. 1 shows the infrared light curve of WR 125. In this figure, we see that the near-infrared -band flux does not show much excess during the two outbursts, while -band shows a slight excess. The -band flux reaches nearly a magnitude of excess during an outburst, while /-band and -band reach about 2.5 and 3 magnitudes of excess compared to the quiescent flux. We note that the amplitude of the / and outbursts are heterogeneous, but the amplitude of variation at these wavelengths is so large that we have not attempted to put the data on a common scale. The addition of the two points in 2007-2008 from UKIRT and knowing the -band magnitude reported in 2MASS (taken between 1997.5 and 2001.1 Skrutskie et al., 2006) was 8.2140.017, provides enough information to know that these two recorded outbursts were consecutive outbursts for the system despite poor coverage in the time-series as they rule out the presence of another outbust mid-way between the two observed outbursts.
Given the nature of WR 125, we can use the infrared light curve to derive a binary period. We began our time-series analysis with Fourier techniques using Period04 (Lenz & Breger, 2005). Fourier techniques assume a sinusoidal function, which is not the observed shape of the light curve we see in Fig. 1, so the results tended to lie on harmonics of the fundamental (orbital) period that is seen to be yr (Endo et al., 2022). Determining the true period based on harmonics introduces extra errors because of the long time-scales involved. As we wish to use this period for a spectroscopic orbit, we needed a different approach.
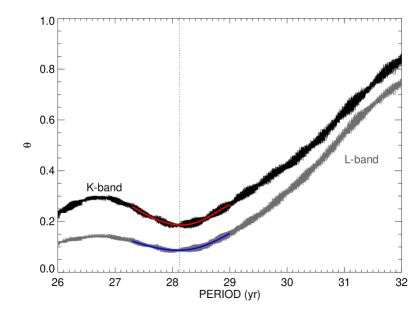
We then used the phase dispersion minimization routines described by Stellingwerf (1978) to determine the period independent of the light curve shape. This method calculates a dispersion statistic at each potential period, and a minimum in this quantity represents a candidate period. We show this in Fig. 2, where we see a minimum at presumed period at 28.12 years, as well as the harmonic at 2/3 the period (3/2 the frequency) of years. The error on this period comes from the statistical uncertainty in the pdm statistic. We calculated this statistic for the - and -band light curves. The shorter-wavelength bandpasses had a smaller variability amplitude, casting doubt on the minimum found, while the longer-wavelength -band has a sparser light curve for the calculation.
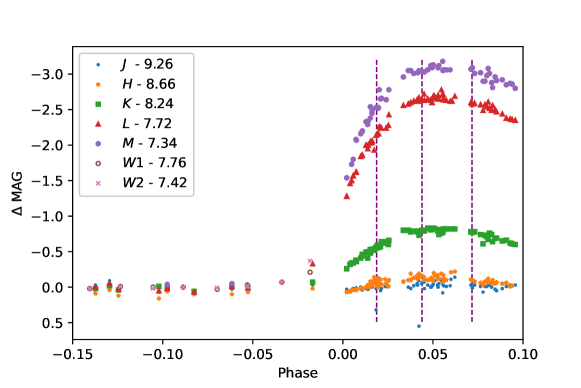
From the - and -band light curve analyses, we derive a period of 28.12 years by fitting the minima with Gaussian curves, overlaid as red and blue curves in Fig. 2. This period is consistent with other recent papers (Arora et al., 2021; Endo et al., 2022), and we show the phased light curves in Fig. 3. In the phased light curves, we assume that the outburst begins as the WISE flux began going into an excess, and that the plateau in the -band peak represents the end of new dust production. We then take the mid-point time between these two epochs to be the time of a periastron passage, assuming that the dust-creation event should be centered on the periastron passage. We checked this period with the Lafler-Kinman approach for sparse time-series (e.g., Saha & Vivas, 2017) and found the same result.
4 Orbital Elements
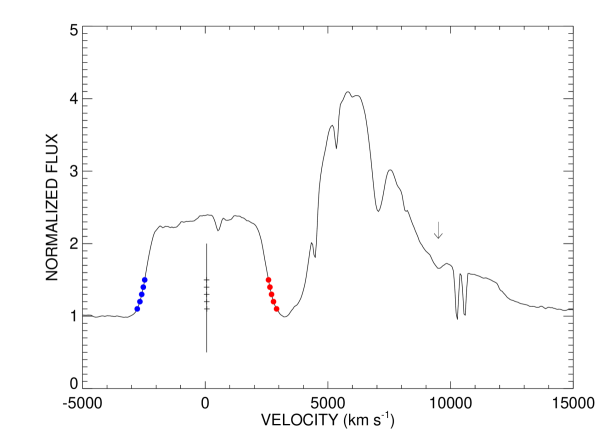
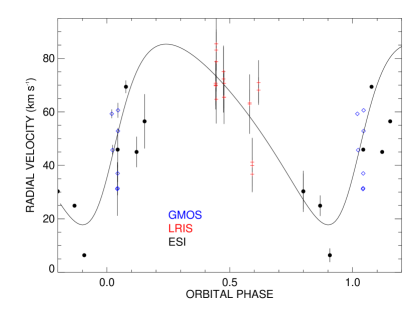
In order to measure the radial velocities of WR 125, we employed similar techniques as that done in the WR 140 system by Thomas et al. (2021). We examined the fairly isolated C III 5696 emission line to measure radial velocities of the WR star. We examined the normalization of each spectrum in the region surrounding the emission line and applied local corrections as necessary. Unlike WR 140, we did not see any strong evidence of excess emission in the C III line although Williams et al. (1992) observed some excess red emission in the He I 10830 line. We measured the line using bisectors at five points above the continuum level. A radial velocity measurement was taken to be the average of these five points, with a standard deviation of the individual points used as an error measurement, and are shown in Table 1 and illustrated in Fig. 4. For our data taken with LRIS, we often had several sub-exposures which we measured independently to verify consistency in our measurements.
| HJD | Radial Velocity | (O – C) | Instrument |
|---|---|---|---|
| -2,450,000 | (km s-1) | (km s-1) | |
| 2852.9574 | 70.09.1 | -3.5 | LRIS |
| 2852.9601 | 70.78.3 | -2.8 | LRIS |
| 2852.9628 | 69.76.8 | -3.7 | LRIS |
| 2875.9852 | 64.79.1 | -8.6 | LRIS |
| 2876.0080 | 85.410.2 | 12.1 | LRIS |
| 2876.0128 | 83.17.8 | 9.8 | LRIS |
| 2876.0208 | 78.811.4 | 5.5 | LRIS |
| 3179.0848 | 72.312.8 | 1.9 | LRIS |
| 3179.1020 | 75.18.7 | 4.7 | LRIS |
| 3202.0537 | 65.510.4 | -4.7 | LRIS |
| 3202.0582 | 65.54.2 | -4.7 | LRIS |
| 3202.0627 | 70.71.9 | 0.5 | LRIS |
| 4273.1227 | 62.910.8 | 4.7 | LRIS |
| 4273.1251 | 63.44.9 | 5.1 | LRIS |
| 4381.8594 | 36.76.3 | -20.2 | LRIS |
| 4381.8639 | 41.28.8 | -15.7 | LRIS |
| 4381.8683 | 40.09.8 | -17.0 | LRIS |
| 4646.1210 | 68.14.7 | 14.6 | LRIS |
| 4646.1247 | 71.08.1 | 17.4 | LRIS |
| 6516.9958 | 30.36.7 | 3.2 | ESI |
| 6517.0040 | 30.37.9 | 3.1 | ESI |
| 7219.0433 | 24.93.9 | 5.8 | ESI |
| 7626.8504 | 6.42.6 | -11.4 | ESI |
| 8777.7180 | 59.31.6 | 16.6 | GMOS |
| 8809.6989 | 45.71.9 | 1.9 | GMOS |
| 9010.1081 | 31.110.1 | -20.2 | GMOS |
| 9019.0753 | 31.52.6 | -20.2 | GMOS |
| 9023.0231 | 37.03.3 | -14.8 | GMOS |
| 9023.9995 | 45.96.5 | -5.9 | ESI |
| 9036.0122 | 52.81.1 | 0.6 | GMOS |
| 9038.0196 | 60.62.8 | 8.2 | GMOS |
| 9371.0764 | 69.42.4 | 5.7 | ESI |
| 9814.8366 | 45.05.7 | -30.0 | ESI |
| 10150.0050 | 56.510.2 | -24.0 | ESI |
We attempted to measure the O star’s absorption line velocities using the He I 5876 line, but found that this did not produce realistic measurements that would show an orbit with time. This line is seen in emission in late sub-type WC stars and it is possible that this occurs in the spectrum of WR 125, making interpretation difficult. Our spectra did not extend to the higher Balmer absorption lines attributed to the companion (Williams et al., 1994).
Given the sparse nature of the spectroscopic measurements, we found that fitting an orbit was not a straight-forward task. We utilized the orbit-fitting procedures used for the Velorum system (Richardson et al., 2017). The RV data span about 20 years so we did not search for a period in the RV data. Spectroscopy over at least another decade will be required to cover the dust-formation cycle and longer to establish a more definitive period. Meanwhile, therefore, by analogy with WR 140 and WR 137 whose dust-formation and spectroscopic periods are the same, we fixed the period of WR 125 to 28.12 years based on the infrared light curves (see previous section).
Similarly, to estimate the date of periastron passage, we look to the infrared light curve. It is evident that the dust condensation by WR 125 occurred over a relatively longer interval than that of WR 140 but in both cases the only way the wind-collision region could “know” the orbital phase is through the variation of the ambient pre-shock wind density and stellar radiation at the collision, which vary as the inverse square of the stellar separation. The conditions necessary for dust condensation must occur at critical stellar separations, and likely symmetrical in phase about periastron passage, as demonstrated in the case of WR 140 by Han et al. (2022). For the present we therefore assume that periastron passage occurs between the beginning and end of dust condensation. To that end, we used the first observation with NEOWISE-R as the system began to brighten to estimate the onset of dust production (Williams, 2019). We estimate that the dust production ends when the infrared light curve reaches a maximum in the near-infrared -band, after which dust being carried away by the stellar winds is no longer being replenished by the condensation of new dust. We then estimate that the midpoint of these two times was the periastron passage to fit an orbit. The result of this fit is shown in Fig. 5, with the orbital elements given in Table 2. The resulting orbit has a moderate eccentricity, but will need better spectroscopic coverage in the coming decades to be refined.
| Element | Value |
|---|---|
| (d) | 10,272aaFixed to value obtained from analysis of infrared photometry (§3). |
| (HJD - 2,400,000) | bbAssumed to be the midpoint of the infrared rise. |
| (deg) | |
| (km s-1) | |
| (km s-1) | |
| () | |
| () | |
| r.m.s. (km s-1) | 11.1 |
5 The mid-infrared spectrum as observed by SOFIA
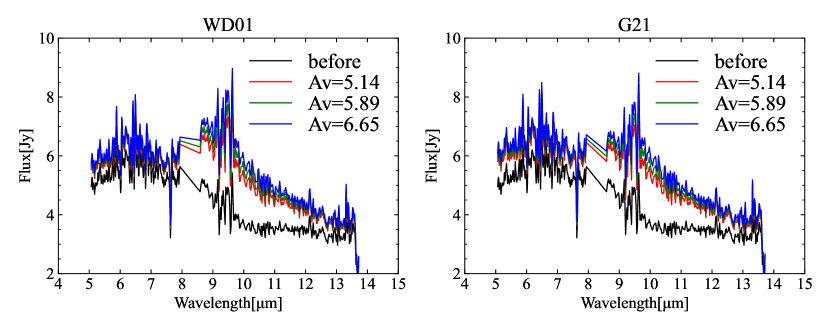
The spectrum of WR 125 observed by SOFIA is shown in Fig. 6. The three grism spectra are of moderate signal-to-noise. The raw flux shows a peak near 6–7 m, and the data taken from 17.6–27.7 m with the G227 grating are too noisy for a thorough analysis given the lower flux and sensitivity of the instrument at these wavelengths. Following the procedures used by Endo et al. (2022), we aimed to correct the fluxes for interstellar extinction using the extinction laws from Weingartner & Draine (2001) (WD01) and Gordon et al. (2021) (G21). Endo et al. (2022) noted that the value of was calculated to be from by Rate & Crowther (2020) from the relation (Turner, 1982). We show the extinction correction for as well as the values at the extrema of the value reported by Rate & Crowther (2020) in Fig. 6.
We also used the photometry obtained at SAI converted to flux111We used the tools at https://irsa.ipac.caltech.edu/data/SPITZER/docs/dataanalysistools/tools/pet/magtojy/. in our analysis of the SOFIA data. We began our analysis by subtracting the stellar contribution that was calculated by Endo et al. (2022). The stellar contribution was calculated as a power-law with two forms based on the extinction law adopted. The power-law fit held the form of
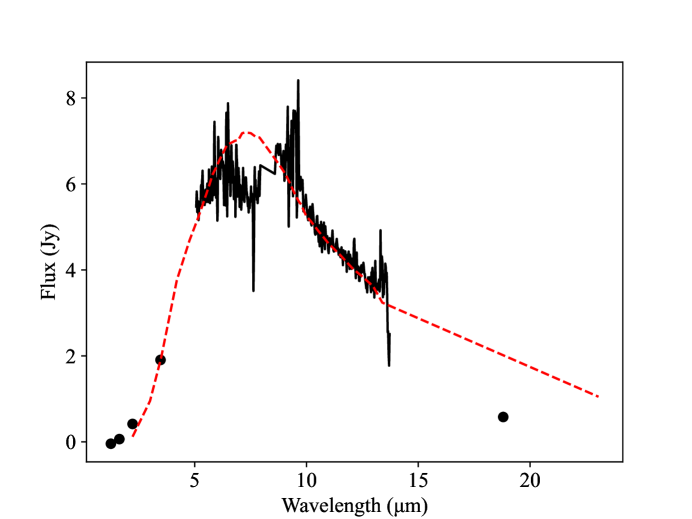
where the coefficients were derived from dust-free epochs of infrared photometry and correspond to for the WD01 extinction law and for the G21 extinction law. In both cases, the units of this relationship provide the flux in Jy and use a wavelength given in m and was fit with the infrared flux observed in the 1980s when no dust was seen in the SED. The -band light curve shows little or no variability, so this relationship will provide the normal -band flux. In both extinction situations, a blackbody fit provides a temperature for the dust of 400 K (Fig. 7) if we neglect the emissivity of the dust. This is cooler than the temperature derived by Endo et al. (2022), but also was from data taken two years later when the dust cloud should have expanded and cooled and is past the time of active dust formation as the light curves were dimming at the time of the SOFIA observations (see Fig. 3).
The SOFIA spectra were relatively short exposures and thus have limited signal-to-noise. However, there is a small rise at the long-wavelength end of the G063 spectrum and a general downward slope at the short-wavelength end of the G111 spectrum. We think that these spectral features are part of the 8 m feature reported by Endo et al. (2022). This feature is often associated with a feature near 6-6.5 m. We see a noisy feature that is reminiscent of the feature present in the dust of WR 137 that is discussed by Peatt et al. (2023). Unlike the SOFIA data for WR 137, we see a shorter wavelength of the feature indicating a higher hydrogen-content than that of WR 137. The WR wind lines observed in WR 137 early in its dust creation episode (Peatt et al., 2023) are not easily seen in the spectrum of WR 125 likely due to the larger dust contribution for WR 125.
6 Discussion
WR 125 is a member of the unusual class of dust-forming carbon-rich binaries. It has spectral properties similar to the nearby and well-studied prototype of these systems, WR 140. The O star in the WR 125 system is a later type and less luminous than in WR 140, but the spectrum does not show a disk-like geometry around the O star like in the WR 137 system (St-Louis et al., 2020). Given that the dense disk around the O star in WR 137 may help promote the dust production, WR 125 represents a longer period system with stellar parameters closer to that of WR 140.
Our derived orbit of WR 125 shows a moderate eccentricity compared to the extreme value for WR 140. WR 140 has an eccentricity of 0.89930.0013 (Thomas et al., 2021). In contrast, the unusual WR 137 system, while also possessing a WC7 primary star has a very low eccentricity of 0.178 according to the spectroscopic orbit of Lefèvre et al. (2005), although the decretion disk around the Oe star likely adds to the dust production (Peatt et al., 2023) and the narrow geometry of the dust plume (Lau et al., 2023). We also note that a new visual orbit of WR 137 (Richardson et al. in prep) reports a larger eccentricity of 0.3140.001 and casts additional doubts on the O star radial velocities of Lefèvre et al. (2005).
Recently, WCd binary systems have received much attention due to their photogenic appearance in imaging from the recent JWST observations first presented by Lau et al. (2022). The imaging-based geometries can be reconciled with models for dust production based on orbital elements and the balance of momenta from the stellar winds. With the orbital kinematics for the WR star derived for WR 125, future observations of the dust from JWST will be able to create models for the dust production with fewer free parameters.
With the long period for WR 125, we can also consider the types of observations that could better pin down the orbit and evolution of the system. Despite the yr period of WR 140, Thomas et al. (2021) presented a binary evolution model for the system that showed that the stars likely interacted to produce the modern-day WR star and stellar masses we observe. WR 125 has a much longer period and lower eccentricity, thus begging the question of its evolutionary status. If the stellar masses were similar to those of WR 140, then even with the larger distance to WR 125, the system would be resolvable with the CHARA Array, as Richardson et al. (2021) resolved the WN+O binary WR 133 with an apparent semi-major axis of less than one milliarcsecond. With a new higher-sensitivity beam combiner coming online (Lanthermann et al., 2022), the visual orbit of the fainter WR 125 may be possible to track in the coming decade.
Another context in which WR 125 resembled WR 140 was its non-thermal radio emission pointing to the presence of shock-accelerated electrons in its wind (Abbott et al., 1986). The fading of this (Williams et al., 1992), like that of WR 140 suggesting the burial of the non-thermal source in the wind (Williams et al., 1990) intensified the infrared monitoring of WR 125 leading to the discovery of the first dust-formation episode. While Midooka et al. (2019) presented a very limited X-ray data set, the similarities of WR 125 to WR 140 demands further analysis with the addition of more data. In particular, the X-ray light curve of WR 140 is explained through the radiative transfer based on hydrodynamical simulations based on the orbital geometry (Pollock et al., 2021). With additional data from X-ray satellites and the orbit we presented in Section 4, similar computations may allow for a complete understanding of the gas and its cooling and dust formation for WR 125. Every astrophysical laboratory in the population of dust-forming WC binaries allows us additional information into the physics of dust formation in the extreme environments surrounding the WCd binaries.
The infrared light curve shows a remarkable repeatability in its shape between the two observed outbursts, as seen in the phased light curves in Fig. 3. Our observations with SOFIA show a cooler dust cloud than seen earlier in the dust outburst with Subaru/COMICS (Endo et al., 2022). As our observations were taken after the near-infrared peak in the light curve and the observations of Endo et al. (2022) were taken prior to the peak, this is not surprising and supports a dust cloud that forms and then expands and cools as it moves into the interstellar medium.
The contrast of the dusty spectral features such as the 8 m and 6.2 m features compared to the continuum and even in comparison to the WR emission lines appears to be less than the earlier observations taken in 2019. This shows that the continuum emission processes are dominant by the time the dust begins to cool in these systems. Likely, the changes in the 6.2 m emission line seen in the early phases of the dust outburst of WR 137 (Peatt et al., 2023) when combined with the low contrast seen in these later phases of dust production for WR 125 give us a means to fully understand the chemistry of dust production in these binaries. Namely, we must be able to observe the spectral features at high signal-to-noise at several epochs early in the dust formation episodes in order to model the dust production and understand the chemistry of these systems. Given the potential importance of WC dust in our understanding of the modern-day and early-Universe dust budget (e.g. Marchenko & Moffat, 2017; Lau et al., 2020), such observations and the associated laboratory measurements are crucial to understand the relative importance of WC dust.
Lastly, we can use the SOFIA observations and contemporaneous infrared photometry to estimate the mass of the dust produced in this binary system. From the G21 analysis shown in Fig. 7, we first note a few parts of this analysis. The fluxes at the lowest and highest wavelengths are seen to lie above the blackbody fit to the spectrum shown that has a temperature of 400 K. We divided the residual spectra shown in Fig. 6 by the emissivity for amorphous carbon grains (Zubko et al., 1996, ACAR sample). Using all the IR data and the dust emissivity, we can best fit the distribution with a temperature of 500 K, which is consistent with the temperature fitted to the multi-wavelength IR photometry of Williams et al. (1994) in 1993, at a similar orbital phase to the SOFIA observations. The dust temperature is a reasonable fit over 2–20 m, but deviates towards the short and long wavelength regions of the range, indicating that the data are not well represented with a single dust temperature. As the dust has been moving away from the star for roughly three years since the beginning of the present dust-formation episode at this time and the stellar radiation heating it diluted, there will be a range of dust temperatures, with the oldest dust being coolest. Fitting multiple components to the flux distribution at this time is beyond the scope of this paper.
If we adopt an isothermal model for the dust with T = 500 K, a distance to the system of 5.88 kpc (Bailer-Jones et al., 2021), we get a dust mass of created, a bit higher than that inferred from the data in 1993 reported by Williams et al. (1994) but with a similar temperature. If the temperature is increased from 500 K to 550 K, then the long wavelength fluxes no longer fit the blackbody distribution, whereas if we decrease the temperature from 500 K to 450 K, the short wavelength fluxes are no longer fit, so we estimate an error of the temperature for an isothermal model to be K. With the 3-year dust formation prior to our observation, we can then estimate the amount of carbon available for dust formation. For this, we can consider the mass-loss parameters of Sander et al. (2012), where we find that and a carbon fraction of 0.4. We estimate that 10% of the WC wind enters the shock region based on an opening angle of 35–40∘ dependent on the wind parameters of the two stars. From these considerations, we would see that the available carbon that had gone into the shock by the time of our SOFIA observation is about , with about a quarter of this being condensed into dust. As a comparison, if the dust temperature was 400 K, the dust mass becomes , which is higher than the amount of available carbon, further pointing to a need for multiple temperatures in the dust formation region years after periastron. While this seems high at first glance as WR 140 produces about each periastron (Williams et al., 2009), WR 140’s dust production happens over a very small time window in comparison to that of WR 125. Furthermore, we note that planned observations in the coming years will solve this much better with high spatial resolution than with our spatially unresolved spectra presented here.
7 Conclusions
Our analysis of WR 125 has provided several key insights to the system. These include:
-
•
The infrared light curve has been fully consistent across two separate outbursts near the periastron passage of the system. The repeatability is reminiscent of the prototype of the dusty WC binaries: WR 140. A phase-dispersion minimization routine allowed us to measure the period of the binary to be 28.12 years.
-
•
From archival spectroscopy spanning 20 years, we have measured a first orbit of WR 125. Only the WR star had measurable motion with our data. The eccentricity of the binary is 0.290.12 based on an analysis with the periastron passage held constant between the rise of the NEOWISE-R mid-infrared flux and the peak of the band near-infrared flux. The O star kinematics was not able to be measured from our spectra, which did not cover the range of the higher Balmer absorption lines.
-
•
The infrared spectrum from SOFIA shows a weak signature of a 6.2 m UIR band, similar to that of WR 137. Unlike the recent analysis of WR 137, and similar to the results of Williams et al. (1994), no Wolf-Rayet emission lines are seen in the mid-infrared when the dust emission is near maximum for this system. Our analysis of the dust emission shows that it cooled from 800 K in 2019 to 580 K in 2021, likely consistent with the dust cloud expanding and cooling as it is radiatively driven away from the binary. Future studies detailing the expansion of the dust will allow this to be fully tested.
-
•
Our data support the idea of a non-isothermal dust around WR 125, although the best fit temperature seems to be near 580 K, resulting in a dust mass of from the recent periastron.
The current outburst of WR 125 highlights the importance of long-term spectroscopic monitoring of such systems. The next few years will be especially crucial for WR 125, including the radial velocity maximum for the WR star. Likely, the orbit will be crucial to modeling efforts for any dust images that are made with infrared imaging with either ground-based telescopes or JWST. Long-term monitoring of WCd stars with ground-based photometry is instrumental in determining orbital periods in studies like these, and with a large sample of such systems, we could create an accurate assessment of the amount of dust created in such systems, which could be of cosmological importance.
References
- Abbott et al. (1986) Abbott, D. C., Beiging, J. H., Churchwell, E., & Torres, A. V. 1986, ApJ, 303, 239, doi: 10.1086/164070
- Allen et al. (1972) Allen, D. A., Swings, J. P., & Harvey, P. M. 1972, A&A, 20, 333
- Arora et al. (2021) Arora, B., Pandey, J. C., De Becker, M., et al. 2021, AJ, 162, 257, doi: 10.3847/1538-3881/ac2506
- Bailer-Jones et al. (2021) Bailer-Jones, C. A. L., Rybizki, J., Fouesneau, M., Demleitner, M., & Andrae, R. 2021, AJ, 161, 147, doi: 10.3847/1538-3881/abd806
- Conti (1975) Conti, P. S. 1975, Memoirés of the Société Royale des Sciences de Liège, 9, 193
- Danks et al. (1983) Danks, A. C., Dennefeld, M., Wamsteker, W., & Shaver, P. A. 1983, A&A, 118, 301
- Eldridge (2009) Eldridge, J. J. 2009, MNRAS, 400, L20, doi: 10.1111/j.1745-3933.2009.00753.x
- Endo et al. (2022) Endo, I., Lau, R. M., Sakon, I., et al. 2022, ApJ, 930, 116, doi: 10.3847/1538-4357/ac63bd
- Fahed et al. (2011) Fahed, R., Moffat, A. F. J., Zorec, J., et al. 2011, MNRAS, 418, 2, doi: 10.1111/j.1365-2966.2011.19035.x
- Gehrz et al. (2021) Gehrz, R. D., Banerjee, D. P. K., Evans, A., et al. 2021, The Astronomer’s Telegram, 14794, 1
- Gordon et al. (2021) Gordon, K. D., Misselt, K. A., Bouwman, J., et al. 2021, ApJ, 916, 33, doi: 10.3847/1538-4357/ac00b7
- Han et al. (2022) Han, Y., Tuthill, P. G., Lau, R. M., & Soulain, A. 2022, Nature, 610, 269, doi: 10.1038/s41586-022-05155-5
- Herter et al. (2013) Herter, T. L., Vacca, W. D., Adams, J. D., et al. 2013, PASP, 125, 1393, doi: 10.1086/674144
- Herter et al. (2018) Herter, T. L., Adams, J. D., Gull, G. E., et al. 2018, Journal of Astronomical Instrumentation, 7, 1840005, doi: 10.1142/S2251171718400056
- Hook et al. (2004) Hook, I. M., Jørgensen, I., Allington-Smith, J. R., et al. 2004, PASP, 116, 425, doi: 10.1086/383624
- Iriarte & Chavira (1956) Iriarte, B., & Chavira, E. 1956, Boletin de los Observatorios Tonantzintla y Tacubaya, 2, 31
- Johnson et al. (1966) Johnson, H. L., Mitchell, R. I., Iriarte, B., & Wisniewski, W. Z. 1966, Communications of the Lunar and Planetary Laboratory, 4, 99
- Lanthermann et al. (2022) Lanthermann, C., ten Brummelaar, T., Tuthill, P., et al. 2022, in Society of Photo-Optical Instrumentation Engineers (SPIE) Conference Series, Vol. 12183, Optical and Infrared Interferometry and Imaging VIII, ed. A. Mérand, S. Sallum, & J. Sanchez-Bermudez, 121830N, doi: 10.1117/12.2628268
- Lau et al. (2020) Lau, R. M., Eldridge, J. J., Hankins, M. J., et al. 2020, ApJ, 898, 74, doi: 10.3847/1538-4357/ab9cb5
- Lau et al. (2021) Lau, R. M., Hankins, M. J., Kasliwal, M. M., et al. 2021, ApJ, 909, 113, doi: 10.3847/1538-4357/abd8cd
- Lau et al. (2022) Lau, R. M., Hankins, M. J., Han, Y., et al. 2022, Nature Astronomy, 6, 1308, doi: 10.1038/s41550-022-01812-x
- Lau et al. (2023) Lau, R. M., Hankins, M. J., Sanchez-Bermudez, J., et al. 2023, arXiv e-prints, arXiv:2311.15948, doi: 10.48550/arXiv.2311.15948
- Lefèvre et al. (2005) Lefèvre, L., Marchenko, S. V., Lépine, S., et al. 2005, MNRAS, 360, 141, doi: 10.1111/j.1365-2966.2005.09017.x
- Lenz & Breger (2005) Lenz, P., & Breger, M. 2005, Communications in Asteroseismology, 146, 53, doi: 10.1553/cia146s53
- Mainzer et al. (2014) Mainzer, A., Bauer, J., Cutri, R. M., et al. 2014, ApJ, 792, 30, doi: 10.1088/0004-637X/792/1/30
- Marchenko & Moffat (2007) Marchenko, S. V., & Moffat, A. F. J. 2007, in Astronomical Society of the Pacific Conference Series, Vol. 367, Massive Stars in Interactive Binaries, ed. N. St. -Louis & A. F. J. Moffat, 213, doi: 10.48550/arXiv.astro-ph/0610531
- Marchenko & Moffat (2017) Marchenko, S. V., & Moffat, A. F. J. 2017, MNRAS, 468, 2416, doi: 10.1093/mnras/stx563
- Marchenko et al. (2003) Marchenko, S. V., Moffat, A. F. J., Ballereau, D., et al. 2003, ApJ, 596, 1295, doi: 10.1086/378154
- Midooka et al. (2019) Midooka, T., Sugawara, Y., & Ebisawa, K. 2019, MNRAS, 484, 2229, doi: 10.1093/mnras/sty3488
- Monnier et al. (2011) Monnier, J. D., Zhao, M., Pedretti, E., et al. 2011, ApJ, 742, L1, doi: 10.1088/2041-8205/742/1/L1
- Oke et al. (1995) Oke, J. B., Cohen, J. G., Carr, M., et al. 1995, PASP, 107, 375, doi: 10.1086/133562
- Peatt et al. (2023) Peatt, M. J., Richardson, N. D., Williams, P. M., et al. 2023, arXiv e-prints, arXiv:2308.11798, doi: 10.48550/arXiv.2308.11798
- Pollock et al. (2021) Pollock, A. M. T., Corcoran, M. F., Stevens, I. R., et al. 2021, ApJ, 923, 191, doi: 10.3847/1538-4357/ac2430
- Rate & Crowther (2020) Rate, G., & Crowther, P. A. 2020, MNRAS, 493, 1512, doi: 10.1093/mnras/stz3614
- Richardson et al. (2017) Richardson, N. D., Russell, C. M. P., St-Jean, L., et al. 2017, MNRAS, 471, 2715, doi: 10.1093/mnras/stx1731
- Richardson et al. (2021) Richardson, N. D., Lee, L., Schaefer, G., et al. 2021, ApJ, 908, L3, doi: 10.3847/2041-8213/abd722
- Rockosi et al. (2010) Rockosi, C., Stover, R., Kibrick, R., et al. 2010, in Society of Photo-Optical Instrumentation Engineers (SPIE) Conference Series, Vol. 7735, Ground-based and Airborne Instrumentation for Astronomy III, ed. I. S. McLean, S. K. Ramsay, & H. Takami, 77350R, doi: 10.1117/12.856818
- Saha & Vivas (2017) Saha, A., & Vivas, A. K. 2017, AJ, 154, 231, doi: 10.3847/1538-3881/aa8fd3
- Sander et al. (2012) Sander, A., Hamann, W. R., & Todt, H. 2012, A&A, 540, A144, doi: 10.1051/0004-6361/201117830
- Sheinis et al. (2002) Sheinis, A. I., Bolte, M., Epps, H. W., et al. 2002, PASP, 114, 851, doi: 10.1086/341706
- Shenavrin et al. (2011) Shenavrin, V. I., Taranova, O. G., & Nadzhip, A. E. 2011, Astronomy Reports, 55, 31, doi: 10.1134/S1063772911010070
- Skrutskie et al. (2006) Skrutskie, M. F., Cutri, R. M., Stiening, R., et al. 2006, AJ, 131, 1163, doi: 10.1086/498708
- Smith & Owocki (2006) Smith, N., & Owocki, S. P. 2006, ApJ, 645, L45, doi: 10.1086/506523
- St-Louis et al. (2020) St-Louis, N., Piaulet, C., Richardson, N. D., et al. 2020, MNRAS, 497, 4448, doi: 10.1093/mnras/staa2214
- Stellingwerf (1978) Stellingwerf, R. F. 1978, ApJ, 224, 953, doi: 10.1086/156444
- Temi et al. (2018) Temi, P., Hoffman, D., Ennico, K., & Le, J. 2018, Journal of Astronomical Instrumentation, 7, 1840011, doi: 10.1142/S2251171718400111
- Thomas et al. (2021) Thomas, J. D., Richardson, N. D., Eldridge, J. J., et al. 2021, MNRAS, 504, 5221, doi: 10.1093/mnras/stab1181
- Turner (1982) Turner, D. G. 1982, in Wolf-Rayet Stars: Observations, Physics, Evolution, ed. C. W. H. De Loore & A. J. Willis, Vol. 99, 57–60
- Vanbeveren et al. (1998) Vanbeveren, D., De Donder, E., Van Bever, J., Van Rensbergen, W., & De Loore, C. 1998, New A, 3, 443, doi: 10.1016/S1384-1076(98)00020-7
- Weingartner & Draine (2001) Weingartner, J. C., & Draine, B. T. 2001, ApJ, 548, 296, doi: 10.1086/318651
- Williams (2019) Williams, P. M. 2019, MNRAS, 488, 1282, doi: 10.1093/mnras/stz1784
- Williams et al. (1978) Williams, P. M., Beattie, D. H., Lee, T. J., Stewart, J. M., & Antonopoulou, E. 1978, MNRAS, 185, 467, doi: 10.1093/mnras/185.3.467
- Williams et al. (1992) Williams, P. M., van der Hucht, K. A., Bouchet, P., et al. 1992, MNRAS, 258, 461, doi: 10.1093/mnras/258.3.461
- Williams et al. (1994) Williams, P. M., van der Hucht, K. A., Kidger, M. R., Geballe, T. R., & Bouchet, P. 1994, MNRAS, 266, 247, doi: 10.1093/mnras/266.1.247
- Williams et al. (1990) Williams, P. M., van der Hucht, K. A., Pollock, A. M. T., et al. 1990, MNRAS, 243, 662
- Williams et al. (1987) Williams, P. M., van der Hucht, K. A., & Thé, P. S. 1987, A&A, 182, 91
- Williams et al. (2009) Williams, P. M., Marchenko, S. V., Marston, A. P., et al. 2009, MNRAS, 395, 1749, doi: 10.1111/j.1365-2966.2009.14664.x
- Zubko et al. (1996) Zubko, V. G., Mennella, V., Colangeli, L., & Bussoletti, E. 1996, MNRAS, 282, 1321, doi: 10.1093/mnras/282.4.1321