On the selective formation of cubic tetrastack crystals from tetravalent patchy particles
Abstract
Achieving the formation of target open crystalline lattices from colloidal particles is of paramount importance for their potential application in photonics. Examples of such desired structures are the diamond, tetrastack, and pyrochlore lattices. Herein, we demonstrate that the self-assembly of tetravalent patchy particles results in the selective formation of the cubic tetrastack crystals, both in the bulk and in the systems subjected to external fields exerted by the solid substrate. It is demonstrated that the presence of external field allows for the formation of well-defined single crystals with a low density of defects. Moreover, depending on the strength of the applied external field, the mechanism of epitaxial growth changes. For weakly attractive external fields, the crystallization occurs in a similar manner as in the bulk, since the fluid does not wet the substrate. Nonetheless, the formed crystal is considerably better ordered than the crystals formed in the bulk, since the surface induces the ordering in the first layer. On the other hand, it is demonstrated that the formation of well ordered cubic tetrastack crystals is considerably enhanced by the increase of the external field strength and the formation of the thick crystalline film occurs via a series of layering transitions.
I Introduction
It is well known that the self-assembly of colloidal particles is primarily governed by their shape and surface properties. Isotropic spherical colloids usually crystallize into simple face-centered cubic (fcc) and hexagonal close-packed (hcp) crystals, depending on the system properties and thermodynamic conditionsCR0 . This behavior results from the similarity of such colloids to hard-sphere systemsCR1 . Since the spherical isotropic particles form only a very limited number of ordered structures, much of the recent interest focuses on anisotropic colloidal particles, which can be used as building blocks for new functional materials. The particles characterized by different shapes can now be obtained using many methodsA1 ; A2 ; A3 ; A4 ; A5 ; A8 , and are known to assemble into a variety of complex structuresA7 . However, there is a class of spherical colloidal particles with anisotropic interactions, which comprises the so-called patchy colloids, with chemically and/or physically modified surfacesA7 ; jan1 ; jan2 ; S2 ; S3 . Already the simplest patchy particles with only one attractive patch, known as the Janus particles, exhibit the surface chemical anisotropy, which can be tuned by the appropriate functionalizationjan2 ; jan3 . Both, the size and the chemical nature of attractive patch, influence self-assembly of Janus particles, and lead to the formation of various ordered structures, in two- and three-dimensional systemsjan3 ; size1 ; jan5 ; jan7 ; kagome . In the region of low and moderate densities, the formation of micelles, vesicles, and worm-like clusters have been observedord1 ; ord2 ; ord3 . It has also been shown that Janus particles form crystals of different structure and densityord3 .
The situation becomes more complex when the number of attractive patches is largerS3 ; S4 . For example, the dissipative particle dynamics simulation of quasi two-dimensional triblock nanoparticles, with two attractive patches located at the poles of each particle, have shown the formation of two different ordered structuresKag1 of different densities. In the ordered phase of lower density, the particles are arranged on the Kagomé lattice, while the high density phase shows the close-packed hexagonal ordering. In three-dimensional systems, the number of possible ordered structures formed by triblock particles is larger, and depends also on the size of attractive patches3d-tri-1 ; 3d-tri-2 ; 3d-tri-3 ; 3d-tri-4 . The size and shape of attractive patches determines the valence, and hence the structure of crystal lattices3d-tri-3 ; ph1 ; ph2 .
A particularly interesting class of ordered structures that can be obtained via self assembly of patchy colloids are the open lattice photonic band gap crystalsph1 ; ph2 ; ph3 . Such materials may find numerous applications in the devices allowing to control the propagation of lightlight . Among the most promising are the crystals of diamonddiam1 ; diam2 , tetrastack3d-tri-4 ; tetrastack1 ; A6 , and pyrochlorepyr1 ; pyr2 ; liu2023 structures. The basic problem with such open crystals is that their synthesis is often hampered by low free energy differences between different polymorphic forms. The open structures resulting from the self-assembly of patchy particles are stabilized by larger rotational and vibrational entropy, than in close-packed crystalsent1 ; ent2 . The synthesis of three-dimensional colloidal crystals with open lattices is considerably hampered since it usually leads to large numbers of stacking faults and grain boundaries. A possible way to force the formation of colloidal crystals with a desired lattice structure, and possibly low defect density, is the use of external fields or templates. Trau et al.tau developed an electrohydrodynamic method enabling the assembly of multilayer colloidal crystals on electrode surfaces. Another possibility is the use of patterned substrates as templates for the assembly of three-dimensional colloidal crystalstemp1 ; temp2 ; temp3 ; MC-temp . The main advantage of epitaxial assembly is the formation of well ordered crystals with very low defect densities. The problem with such approaches is, however, the necessity of using the templates being strictly commensurate with the assumed structure of colloidal crystals. Such methods have been primarily used to obtain open lattice colloidal crystals by sedimentation of binary mixtures of colloidal particles characterized by different sizes, and a subsequent removal of one of the components. It has recently been shown by our group LB1 that the presence of a uniform external field, exerted by the solid substrate, allows to obtain a cubic diamond in systems of tetrahedral patchy particles. A key element of the successful growth of cubic diamond crystals is the structure of the first adsorbed layer, being commensurate with the [110] face of the cubic diamond. It has also been demonstrated that the subsequent removal of the external field does not affect the generated structure paving the way for further post-synthetic treatments.
In this paper, we use molecular dynamics simulations to investigate the formation of other open lattice crystals by adsorption of patchy particles on a structureless attractive substrate. The only role of the substrate is to provide an external field leading to the adsorption of particles, but the emerging structure of adsorbed films is entirely determined by the assumed structure of patchy particles, and inter-particle interactions governing their self-assembly. It is well known that the interaction between colloidal particles is rather short-rangedGrzybowski , but the external fields which determine the formation of ordered structures are usually of longer range. In particular, it is the gravity that leads to self-assembly resulting from the sedimentation of colloidal particles immersed in suspensions.
In this work, it is shown that the self-assembly of tetravalent model patchy particles leads to the selective formation of cubic tetrastack (CT) structure in the bulk as well as in the external field. However, the formation of well-ordered crystals in the bulk is hampered by the presence of numerous defects and grain boundaries between nucleating crystals. On the other hand, when “the disordered fluid” of patchy particles is placed in contact with the solid substrate, it forms quite well-ordered crystals, via a sequence of layering transitions, which occur upon the decrease in temperature.
II Methods
II.1 Patchy particle model
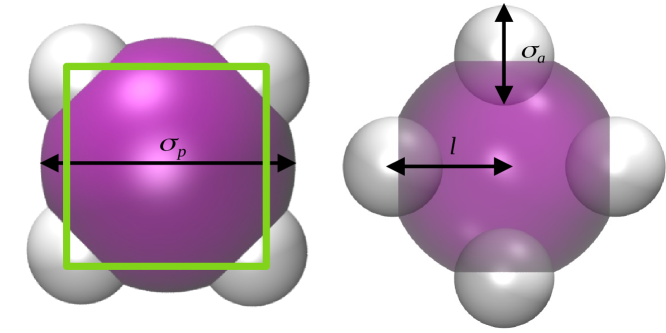
The patchy particles model used in our simulations is identical to that used in our previous papers LB1 with the only difference being the patch’s arrangement. Each particle is comprised of a spherical unit of a diameter on which surface four patches are displaced, each of a diameter that are embedded to the certain extent. The latter can be manipulated by the parameter . A schematic representation of model parameters is shown in Figure 1. The active sites are arranged on a square on the surface intersecting the central plane of the sphere. All the entities in the patchy particles interacted via truncated and shifted Lennard Jones (12,6) potential. and were defined to be units of length and energy, respectively. In the current case, we have chosen the set of parameters to be equal , and . Parameter ensures that every active site can form three bonds resulting in twelve neighbors in total.
The association energy was fixed to whereas . The range of the interactions was set to and the remaining were with (). Choosing this set of parameters ensures that the only attraction in the system is due to the association energy, while the remaining interactions are soft-repulsive.
To maintain the rigidity and the geometry of patchy particles we used harmonic spring potentials for bonds and bond angles. The corresponding constants were equal to and for bonds and bond angles, respectively, ensuring negligible fluctuations.
To study the surface-directed self-assembly of patchy particles, we introduced the structureless external wall modeled by the Lennard-Jones (9,3) potential, defined as follows:
| (1) |
where indicates the depth of potential well for interactions.
The potential acted solely on the core of the patchy particle which should result in the introduction of isotropy on how the patchy particles will be arranged with respect to the wall. The following results will be described in terms of the change in the ratio of attraction strengths defined as .
The table 1 gives a full overview of the system parameters.
| parameter | symbol | value |
|---|---|---|
| core diameter | ||
| active site diameter | ||
| embedding distance | ||
| association energy | ||
| remaining energies | ||
| association cutoff | ||
| remaining cutoffs | ||
| bond harmonic constant | ||
| bond angle harmonic constant | ||
| external field energy |
II.2 3D order parameter
To detect the formed three-dimensional tetrastack crystalline network, we employed a routine based on the calculation of Steinhardt order parameter steinhardt given by:
| (2) |
with
| (3) |
where are spherical harmonics. For a given sphere , we choose a set of its nearest neighbors, . We define that any two spherical particles are connected by a bond if they are neighbors, that is, if . Each vector is characterized by its angles in spherical coordinates and on the unit sphere, evaluated between the bond and an arbitrary but fixed reference frame. The set of all bond vectors is called the bond network.
The ideal tetrastack network is comprised of alternating hexagonal and Kagomé layers. In the crystal lattice, we identify two types of local environments where every particle has either 10 or 12 nearest neighbors (NN). We found that the set of and are the best for the discrimination. For ideal lattice for , Steinhardt parameters are equal to and and we allow for the error due to the fluctuations present in the simulations. On the other hand, for Steinhardt order parameter gives a few different values that are close to one another in the range of and . Based on the above values, molecules with exactly ten or twelve neighbors were included into crystalline environments or labeled as liquid-like if any of these conditions were not fulfilled.
II.3 2D order parameter
To identify two-dimensional ordering, including discrimination between the hexagonal and Kagomé structures which form alternating layers in three-dimensional tetrastack crystalline networks, we employed a parameter that has been proposed quite recently by H. Eslami et al. Kag1 ; Kag2 . It is defined as follows:
| (4) |
and
| (5) |
where
| (6) |
The hexagonal and Kagomé networks are identified in the order parameter space with the values of and , respectively. These values correspond to the perfect lattices and we allowed for uncertainty during the discrimination procedure to take into account fluctuations present in the simulations.
II.4 2D orientational profile
To get further insight into the tetrastack crystal structure, we examined how the patchy particles are arranged in the layers with respect to the surface. To do that, we calculate the cross product between the vectors pointing from the center of the patchy particle to the centers of the two neighboring active sites. This results in a new vector that is perpendicular to the plane formed by these two vectors (green square in Figure 1 a). Next, for each of the particles, we calculate the dot product between the plane and the reference z-axis (wall-direction) . The results are presented in the form of the distribution function of the angles and the particle’s z-coordinate where . Using this definition of the plane containing patches is parallel to the substrate surface when .
II.5 Simulation details
Molecular dynamics simulations were launched using LAMMPS simulation package LAMMPS . Trajectories were evolved using the velocity Verlet algorithm, with a timestep of . The temperature was controlled using the Nosé-Hoover chains thermostat nhchains with damping factor and the number of chains equal to 3. The systems comprised of or for systems under confinement to check for possible finite-size effects. The system size was equal to in directions for both system sizes, resulting in that the surface density corresponds to the formation of up to seven and fourteen close-packed monolayers for and patchy particles, respectively. In the slab geometry used here, the periodic boundary conditions were applied in the x- and y-directions, while the z-direction was bound by the Lennard-Jones (9,3) potential, and the reflecting wall at the bottom and the top sides, respectively. Additional simulations were carried out for the simulation boxes with the distance between the walls () equal to , , and , and with the numbers of particles equal to , , and , respectively. The bulk system was composed of patchy particles at distinct densities ranging from to . The motivation for performing simulations in the canonical ensemble rather than in other ensembles is as follows. We wanted to examine the behavior of patchy particles when the system has a constant density. This of course not necessarily correspond to the coexistence points in all cases, nonetheless it allows one for the assessment of the stability of the formed ordered phases under such off-coexistence conditions which also are of experimental interest. Each of the systems was gradually cooled down from disordered states starting at the temperatures that varied depending on the system’s density and surface potential with an increment in temperature equal to . Once the Steinhardt order parameter indicated the nucleation event, the increment was changed to . Simulations were launched for simulation steps at every thermodynamic state for the equilibration period. Further production runs were launched for at least timesteps. In order to ensure the results do not change from one replica to another, we performed three independent simulation runs for all the cases studied.
III Results and discussion
III.1 Phase behavior of the bulk system
Before we turn to the main subject of the study, i.e., to the assembly of model patchy particles subjected to the external field, it seems reasonable to begin with the discussion of the bulk behavior. To this end, we have performed extensive simulations over a wide range of temperatures, and at different densities. It should be emphasized that we have not attempted to evaluate the entire phase diagram, but rather to demonstrate its topology, and to determine the structure of different ordered phases. In particular, we have confined the calculations to the densities up to . At still higher densities, the simulations turned out to be very slowly converging, and the time needed to reach equilibrium states appeared prohibitively long.
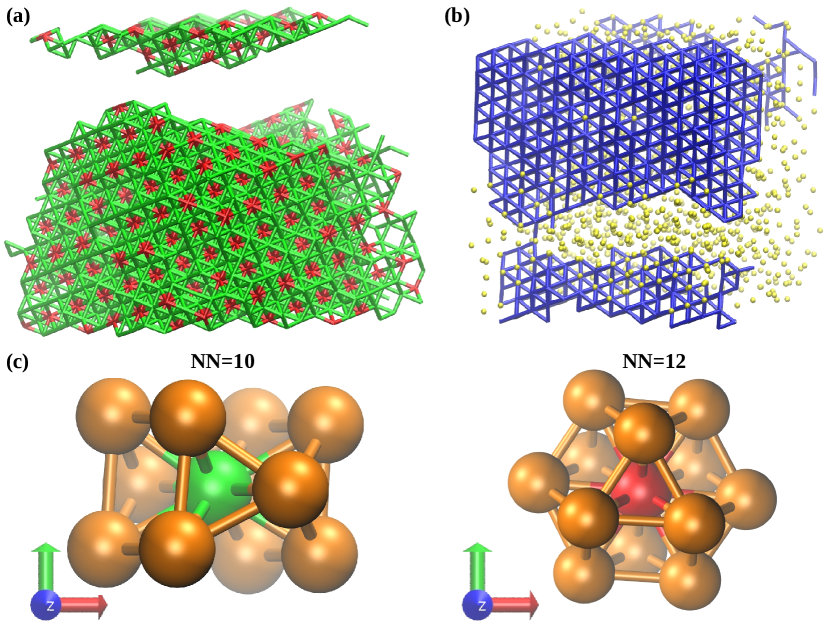
Figure 2 (a) shows the snapshot, being a representative example of configurations emerging from the simulations at low temperatures, below , and at the densities between and 1.2. This snapshot demonstrates the formation of a complex layered structure. On the other hand, at the temperatures above 0.92, the recorded configurations have shown the formation of large domains of crystalline phase coexisting with a disordered fluid (see Fig. 2 (b)).
The inspection of several configurations demonstrated that the low temperature ordered phase consists of alternate layers, in which the particles form the [111] face of fcc, and the Kagomé lattice, respectively. Although it is not seen in the snapshot given in Fig. 2 (a), the fcc layers are periodically shifted, since the particles in subsequent three layers (e.g., 1,3, and 5) occupy one of the three interpenetrating sublattices, A, B, and C. The same applies to the Kagomé layers, (e.g., 2, 4, and 6). Thus, the ordered low temperature structure is the cubic tetrastack (CT) polymorph. On the other hand, the high temperature ordered phase has been found to be the fcc crystal.
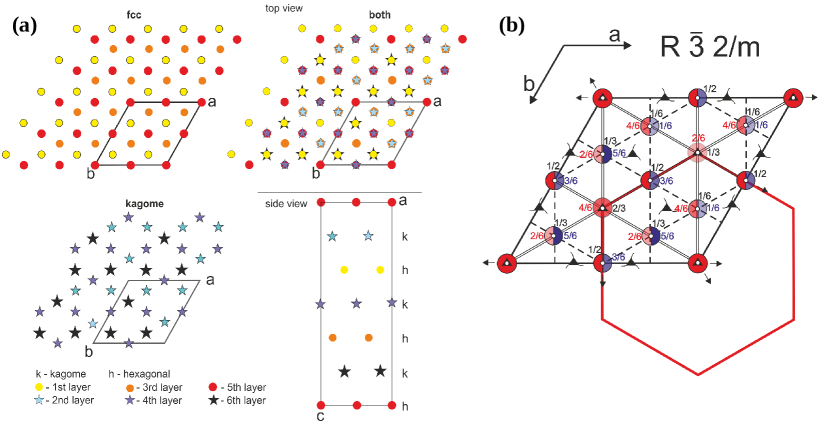
A detailed analysis of the CT phase has allowed us to construct its unit cell. The upper left panel of Fig. 3 (a) presents the lattice of the fcc structure with high symmetry space group F4m, seen from the [111] direction. The three-fold inversion axis can be directly noticed. Adding the Kagomé layers between the fcc layers (see the lower left panel of Fig. 3 (a)) lowers the system’s symmetry (see the right panels of Fig. 3 (a)). One should note the periodic shifts in particle’s positions in the subsequent layers of the fcc and Kagomé lattices. The new symmetry of the resulting CT structure is rhombohedral R 2/m. In this case, the three-fold inversion axis remains unchanged. Figure 3 (b) presents the unit cell projection with atoms’ positions and their heights (colored numbers), together with the symmetry elements related to this symmetry group. The black numbers are the height of the symmetry elements ( inversion centers). The red hexagon in Fig. 3 (b) represents the equivalent cell used to describe a rhombohedral system.
We have generated a perfect CT phase and found that the lattice unit cell, containing 21 particles, is characterized by the lattice vectors , and . The fractional positions of all atoms in the unit cell are summarized in Table 2.
| No. | |||
|---|---|---|---|
| 1 | 0.0 | 0.0 | 0.0 |
| 2 | 0.5 | 0.0 | 0.0 |
| 3 | 0.0 | 0.5 | 0.0 |
| 4 | 0.5 | 0.5 | 0.0 |
| 5 | 0.66667 | 0.83333 | 0.16667 |
| 6 | 0.16667 | 0.83333 | 0.16667 |
| 7 | 0.16667 | 0.33333 | 0.16667 |
| 8 | 0.33333 | 0.66667 | 0.33333 |
| 9 | 0.83333 | 0.66667 | 0.33333 |
| 10 | 0.33333 | 0.16667 | 0.33333 |
| 11 | 0.83333 | 0.16667 | 0.33333 |
| 12 | 0.0 | 0.5 | 0.5 |
| 13 | 0.5 | 0.5 | 0.5 |
| 14 | 0.5 | 0.0 | 0.5 |
| 15 | 0.66667 | 0.33333 | 0.66667 |
| 16 | 0.16667 | 0.33333 | 0.66667 |
| 17 | 0.66667 | 0.83333 | 0.66667 |
| 18 | 0.16667 | 0.83333 | 0.66667 |
| 19 | 0.3333 | 0.16667 | 0.83333 |
| 20 | 0.8333 | 0.16667 | 0.83333 |
| 21 | 0.3333 | 0.66667 | 0.83333 |
In order to determine the changes in the ordering of the bulk with temperature and density, we have considered the behavior of the Steinhardt order parameters and . For the ideal CT structure, these order parameters allow to discriminate the particles with 10 and 12 nearest neighbors, as discussed in Section II.2.
The calculations of temperature changes of and allowed to estimate the contributions of particles belonging to the ordered phases, measured by the ratio of particles classified as belonging to the crystalline phase to the total number of particles, . The results are given in Fig. 4 (a), and show that an increase in temperature leads to a gradual decrease of , up to the temperature, , at which drops to zero. This sudden disordering suggests the presence of first-order transition. Figure 4 (a) also shows that the transition temperature increases with . Besides, from the calculated order parameters, we have found that for , the disordering transition occurs between the CT ordered phase and the fluid, while at the density equal to 1.20, the CT phase is stable only at temperatures up to about 0.92. At higher temperatures, a vast majority of particles involved in the crystalline phase have been found to have 12 nearest neighbors and form the fcc crystal. The example of configuration recorded for , and at has already been shown in Figure 2 (b).
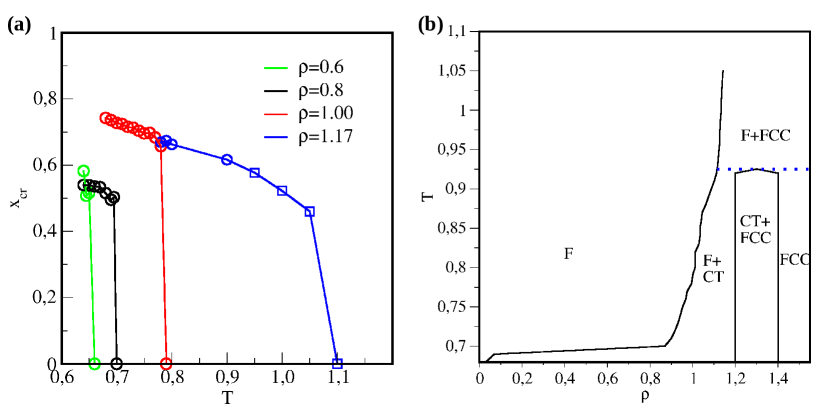
The results have allowed us to conclude that the bulk phase diagram looks like that shown in Fig. 4 (b), and its topology is qualitatively similar to that found by Romano et. al ph1 for tetrahedral patchy particles. Thus, the system does not exhibit the gas-liquid transition, but only the transition between the fluid and solid phases. Notice, however, that such an evaluated phase diagram is only schematical as we were mainly interested in the approximate estimation of its topology and the coexistence regions. Moreover, we cannot completely exclude the possibility of the existence of a metastable liquid phase. To unequivocally establish its presence would require rather tedious calculations and was beyond the scope of this article. At temperatures up to about 0.92, the fluid coexists with the CT ordered phase. It should be noted, however, that the solid is not a perfectly ordered CT crystal, but contains some small fraction (between 10 to 15%) of the fcc structure. At temperatures above 0.92, the solid phase exhibits the fcc structure. It should be emphasized that at the densities equal to 1.20 and 1.30, and at the temperatures below 0.92 we have observed the presence of coexisting CT and fcc structures. Therefore, it can be anticipated that at sufficiently high densities, the solid phase should be a pure fcc crystal. This expectation is supported by the high temperature behavior, which demonstrates that only the fcc structure coexists with the disordered liquid. Therefore, one expects that upon cooling the system at sufficiently high density should form a pure fcc crystal. It has to be emphasized, however, that the location of the line delimiting the region of densities over which the CT and fcc structures coexist, from the high density region in which only the fcc structure occurs, has not been estimated. Nonetheless, it is bound to appear at the density higher than 1.3.
III.2 Ordering in the external field
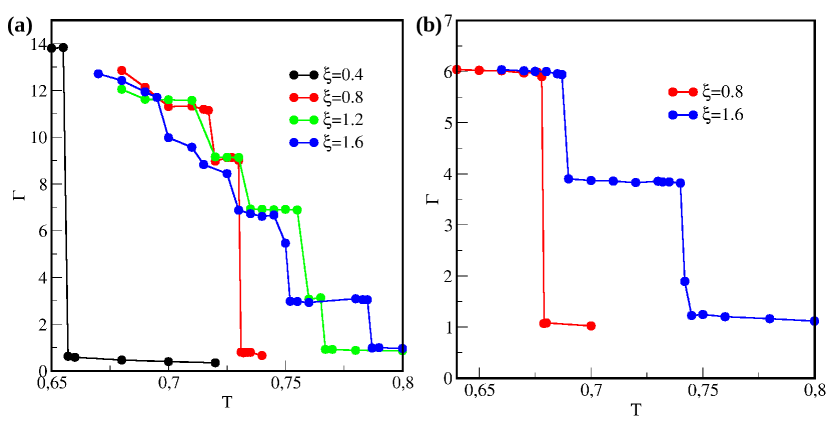
It is well known that the formation of adsorbed films is primarily determined by the relative strength of the particle-particle () and the particle-wall () interactionsAD1 . Here, we have studied self-assembly of patchy particles subjected to the external field of varying strength, measured by the parameter (cf. Section II.1). We have considered four different values of , 0.8. 1.2 and 1.6, and performed simulations at different temperatures, and for two different values of the total density equal to and 0.352.
In order to study the development of adsorbed films, the density profiles, , have been recorded, and used to calculate the surface excess densities, ,
| (7) |
In the above, is the surface area, , and is the bulk density. The bulk density has been calculated as
| (8) |
with . The selected value of is beyond the range of , over which the density profiles have shown the peaks associated with the formation of adsorbed layers. At the same time ensures that any undesired effects stemming from the presence of the reflecting wall are avoided.
The central results of our calculations are given in Figure 5, which presents the changes in the surface excess density with temperature, for different values of (cf. Section II.1), and for (part (a) of Fig. 5) and (part (b) of Fig. 5). In all cases, the surface excess density exhibits a series of jumps, which indicate the formation of a gradually increasing number of adsorbed layers in the film, when the temperature drops. The sequence of these layering transitions changes when the strength of surface potential increases, and depends also on the total density.

In the case of the weakest surface potential, with , we have performed the simulation for the bulk density , and found only one transition leading to the formation of a very thick film. Figure 6 (a) shows the density profiles recorded at the temperatures below () and above () the transition leading to the condensation of particles, and the formation of the thick film. It is evident that at only a fraction of the first layer is covered, while a vast majority of particles remains in the uniform bulk phase. On the other hand, at , the film consists of 18 layers, while the bulk density is very low. Thus, the transition may be treated as the bulk condensation, and such behavior is characteristic of the systems that do not exhibit wetting. It should be noted that the heights of subsequent peaks corresponding to odd layers, 1, 3, , are considerably higher than those corresponding to even layers, 2, 4, . and that the heights of all maxima gradually decrease with . Nonetheless, the integration of density profiles has shown that the ratio of densities in neighboring odd and even layers is equal to across the entire film. This suggests that the film ordered into the CT structure, in which the ratio of densities of the fcc and Kagomé layers is equal to . A gradual decay of subsequent maxima at the density profile demonstrates that the interface between the ordered film and the bulk dilute (gas) phase is rough, since the filling of higher layers is only partial (see the snapshot given in part b of Fig. 6).
In the case of the stronger surface potential, with , and , the first transition, at , leads to the formation of 10 filled layers (see the density profile given in Fig. 6 (c)), and is followed by the transition, at , leading to the mutual condensation of the next two layers. A further lowering of temperature, down to , causes a gradual increase in the film thickness, but the interface between the film and the bulk is not so rough as in the case of . This is illustrated by the snapshot given in Fig. 6 (d), and recorded for the system with , and at . The results given in Fig. 5 (a) clearly demonstrate that the mode of film development is strongly affected by the strength of the surface potential. For the still stronger surface fields, with and 1.6, the first layering transition involves a mutual condensation of only four layers, on top of already existing monolayer film.
In the system with the lower total density, equal to , and there is only one transition, which leads to the formation of 6 filled layers (see part b of Fig. 5). The film thickness is lower than in the case of , since the number of particles in the system allows for the formation of only 6 layers. However, the density profile recorded for the system with at demonstrates quite similar behavior to that found for thick films in the system with . In particular, the ratio of densities in the odd and even layers is practically the same as in the system with , and implies that the film structure is also the same.
It should be noted that in all systems with , quite dense, and disordered, monolayer films are formed at the temperatures above the first layering transition. However, the first layering transition induces ordering in the entire film, and, again, the odd layers assume the structure corresponding to the [111] face of fcc crystal, while the even layers are ordered into the Kagomé lattice. A gradual decrease of temperature leads to a series of layering transitions, involving a mutual condensation of an even number of layers. This behavior can be attributed to the growth of CT phase, which retains the highest stability when the numbers of layers with hexagonal and Kagomé orderings are the same. We recall that the first layer exhibits hexagonal ordering, hence the top layer is bound to order into the Kagomé lattice.
In order to confirm that thick films are ordered into the CT phase we have calculated the two-dimensional order parameters , and for subsequent layers, of thick films (cf. Section II.3). The regions of corresponding to each layer have been estimated from the density profiles, and these order parameters allowed us to estimate the contributions of particles involved in the Kagomé and hexagonal lattices. A representative example of the results is given in Table 3, which demonstrates that odd layers are well ordered into the hexagonal lattice, while even layers are ordered into the Kagomé lattice.
| layer () | % Kagomé | % hexagonal | ||
|---|---|---|---|---|
| 1 | 0.6 | 1.2 | 0.0 | 93.58 |
| 2 | 1.3 | 1.7 | 75.19 | 0.0 |
| 3 | 2.2 | 2.7 | 0.0 | 82.86 |
| 4 | 3.0 | 3.4 | 91.46 | 0.0 |
| 5 | 3.8 | 4.4 | 0.70 | 78.68 |
| 6 | 4.7 | 5.2 | 91.47 | 0.0 |
| 7 | 5.4 | 6.0 | 0.46 | 85.24 |
| 8 | 6.2 | 6.8 | 93.62 | 0.0 |
| 9 | 7.1 | 7.5 | 0.16 | 84.16 |
| 10 | 7.9 | 8.3 | 92.57 | 0.0 |
| 11 | 8.7 | 9.1 | 0.09 | 86.84 |
| 12 | 9.5 | 10.0 | 93.17 | 0.0 |
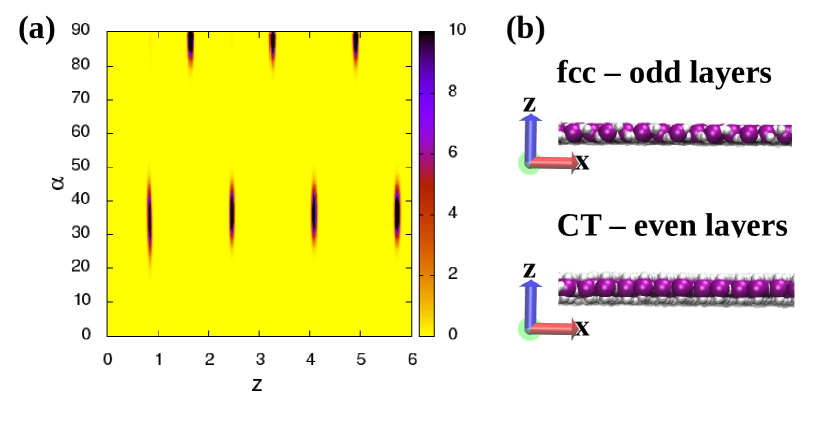
Our model assumes that all four attractive patches are arranged in a plane. The calculations of two-dimensional orientation profiles (cf. Section II.4) have revealed that in even layers, i.e., those forming the Kagomé lattice, the planes containing the patches are predominantly oriented perpendicular to the substrate surface, while in the case of hexagonally ordered odd layers, those planes are tilted with respect to the surface by the angle . This is quite well illustrated by the behavior of the distribution function , recorded for the system with and , at , and shown in Figure 7.
Although we have not attempted to calculate the distribution function in the bulk, nevertheless it is very likely that it behaves in the same way. It should be remembered that the evaluation of is done with respect to the plane dependent on the orientation of the crystal. In the bulk phase, the orientation of the crystal evolves during the run, hence the calculation of the distribution function would require a continuous adjustment of the crystal orientation relative to the chosen reference plane. Such calculations are possible, of course, but would need very time consuming calculations.
In order to study the stability of the developed films ordered into the CT phase, we have performed simulations by gradually increasing the temperature, and using the configurations corresponding to the films of different thicknesses. In Figure 8 (a), we present the results for the systems with and 1.6, and the bulk density equal to . In the case of , the only possible starting point is the film with the surface excess density equal to , appearing at (see the inset to Fig. 8 (a)), while in the system with , we have used configurations with different numbers of occupied layers (see the main part of Fig. 8 (a)).
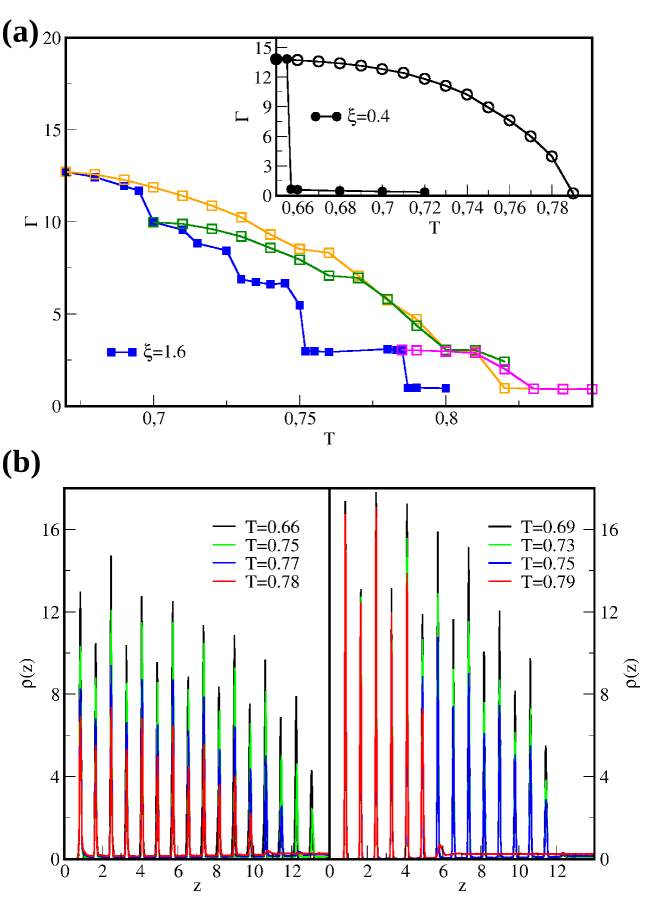
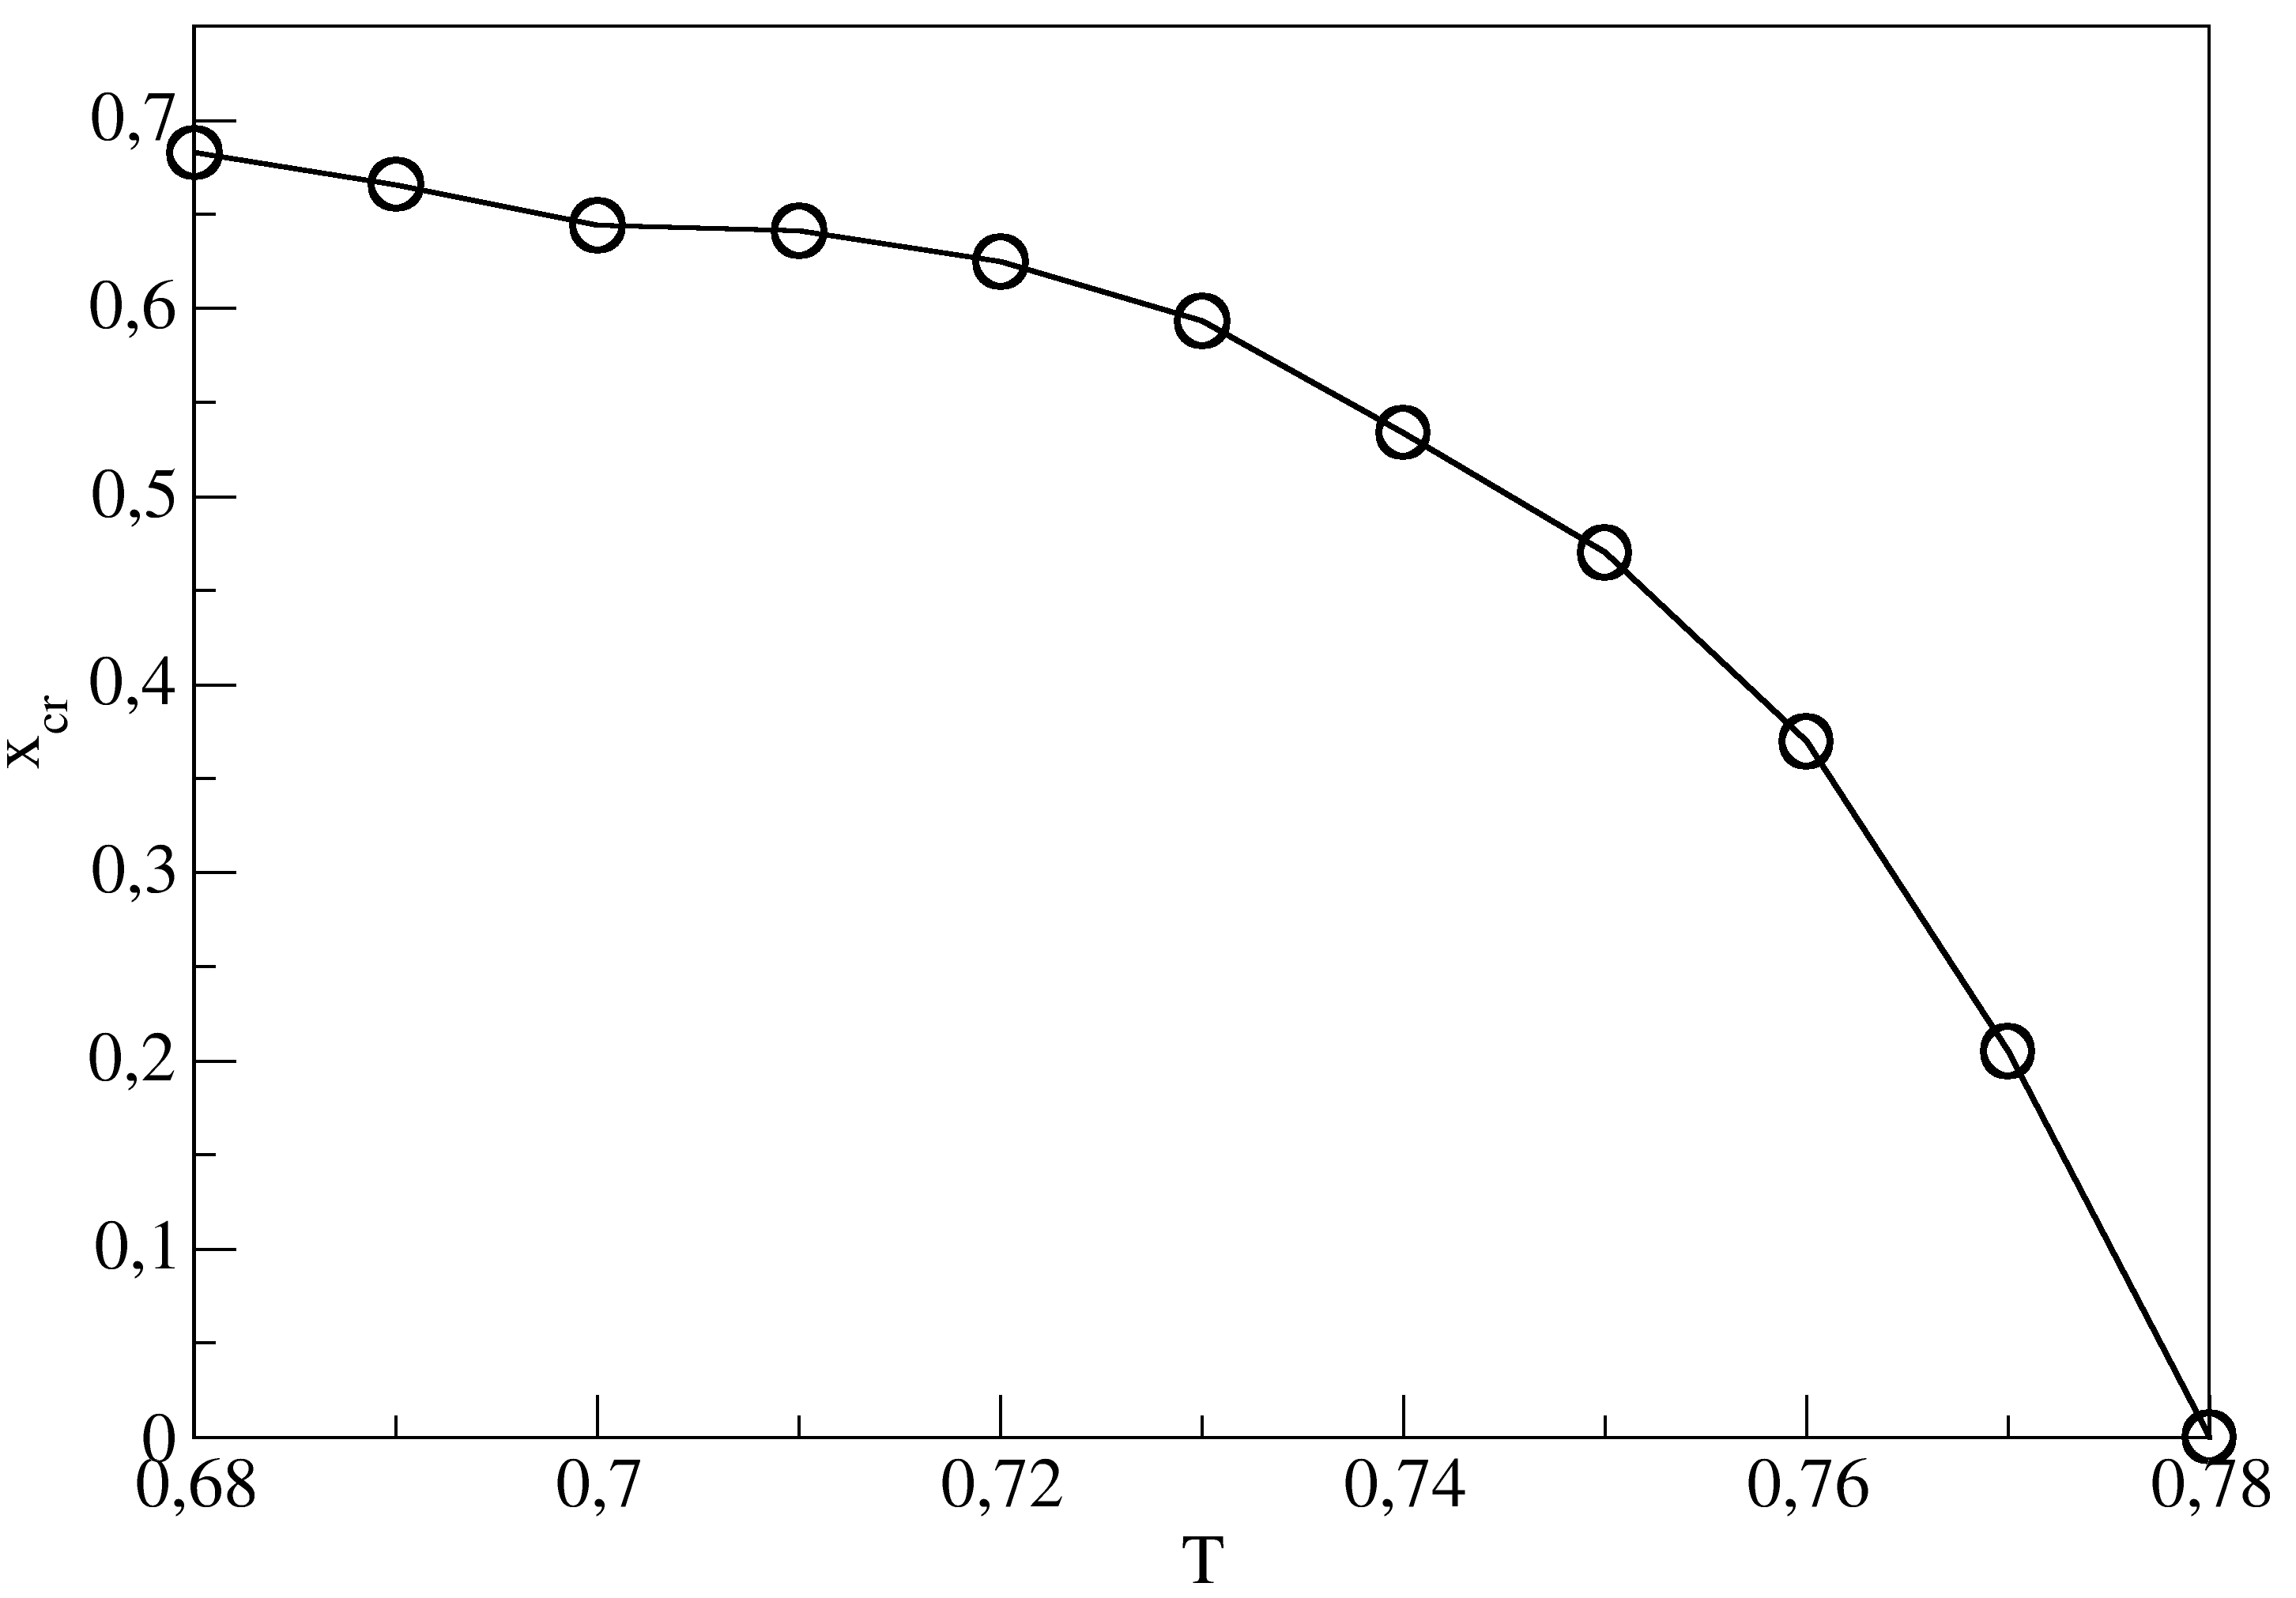
The results given in Fig. 8 (a) demonstrate that in both cases of and 1.6, the runs starting at high surface excess densities lead to a smooth decay when the temperature increases, and result in wide hysteresis loops. However, the mechanism of the film disordering depends on the external field strength. In the case of weak filed, with , the density profiles, shown in the left-hand panel of Fig. 8 b, demonstrate that upon the increase of temperature the densities of all layers gradually decrease, but even at the temperature of 0.77, there are 16 partially occupied layers. Only when the temperature becomes closer to the total disordering of the film, which occurs at , the film thickness starts to decay.
On the other hand, the density profiles obtained for the system with , given in the right-hand panel of Fig. 8 b, indicate that the densities of the layers close to the surface are only slightly affected by the increase of temperatures, and the disordering involves the top layers mostly, and leads to a gradual decrease of the film thickness. At the temperature of the film still consists of 14 layers, while at it has only 6 layers. A further increase of temperature to 0.8 leads to the disordering of two top layers, and the four-layer film remains stable up to the temperature of about 0.82.
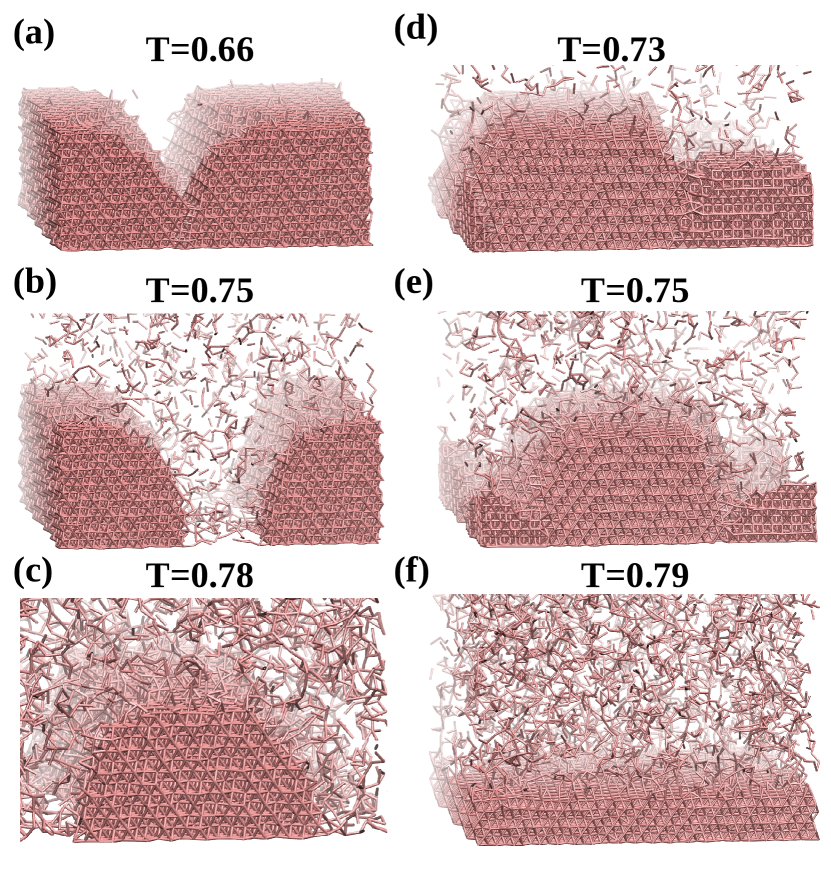
Figure 9 shows the examples of snapshots recorded at gradually increasing temperatures for the systems with (parts a-c) and (parts d-f), starting from and , respectively. In both systems, the disordering spreads at the interface of the crystal and fluid, but in different ways. In the case of a weak surface field, the roughness of that interface causes that the region of disordering is primarily determined by the roughness of the crystal surface and may go down to the substrate surface, while the partially filled and ordered layers retain high thickness. This causes a gradual decrease of all peaks of density profiles when temperature grows. On the other hand, a strong surface field pins the film to the substrate and causes that the first six layers are completely filled even at quite high temperatures. Thus, the disordering of the upper part of the film occurs in the same way as in the case of a weak surface field, and only the layers adjacent to the substrate surface exhibit higher stability.
Wide hysteresis loops between the runs corresponding to the decreasing and increasing temperature suggest that once formed multilayer ordered structure remains stable at quite high temperatures. Does it represent truly stable states or is it just a manifestation of metastability? A possible way to clarify this question would be the calculation of the free energy changes along the paths of decreasing and increasing temperature using the method of thermodynamic integrationph2 ; free2 . Such calculations are feasible but would require the knowledge about the free energies at the certain “reference” points, and much computational effort.
III.3 Removal of the external field potential
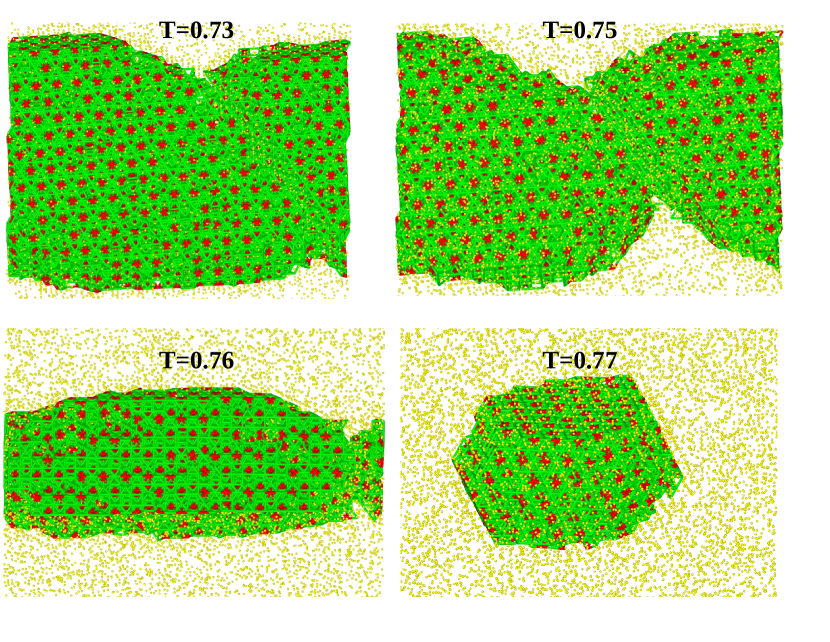
A rather convincing evidence of the intrinsic high stability of CT crystal is provided by the results obtained when the external field was switched-off. We have used the configuration obtained for the system with at , with the surface excess density , and calculated the changes of the fraction of particles involved into the ordered CT phase when the temperature increases. The results are given in Fig. 10, and demonstrate that the system undergoes a gradual disordering when the temperature increases up to . It has to emphasized that in the initial state, taken from simulations in the presence of external field, the system is not in the bulk solid-vapor coexistence. Therefore, a partial melting of the solid is bound to occur until the coexistence pressure of a vapor phase is reached. The same scenario will emerge upon the increase of temperature, until the entire crystal eventually melt in . Figure 11 presents the snapshots recorded at gradually increasing temperatures.
This finding provides a rather strong evidence that the ordered CT phase retains stability at a wide range of temperatures, and vanishes only when the temperature approaches about 0.78. Recall that the bulk system of the density disorder at considerably lower temperatures, below (cf. Fig. 4 (b)). However, as already stated, in order to unambiguously determine the stability of the CT phase, rigorous free energy calculations are required. Nevertheless, even if it were not thermodynamically stable the appearance of such a crystal can be observed in both simulations and experiments.
III.4 The effects due to the simulation box size in the z-direction
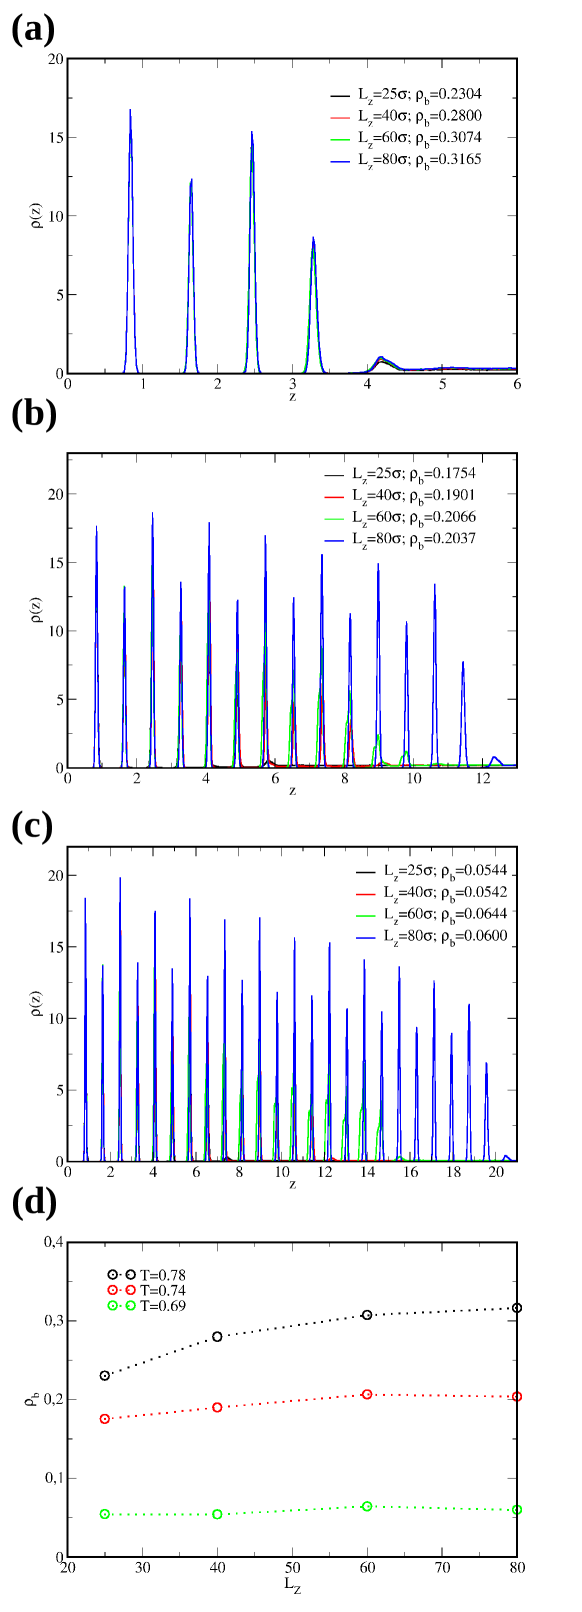
Since we have performed the simulations in the ensemble it is reasonable to verify the importance of the plausible effects stemming from the insufficiently large system size in the -direction. A comparison of the results obtained for the system with the total density equal to and different is shown in Figure 12. As the separation distance between the walls becomes larger, the developing crystalline layer can be thicker. This effect becomes more pronounced when the temperature becomes lower (cf. Figure 12 c). Nevertheless, it is evident that the growth of crystalline network still occurs in a layer-by-layer fashion. The number of growing layers is always even, which is consistent with the proposed mechanism of the crystallization of the cubic tetrastack phase.
One should also notice a slight increase of the bulk density, , when becomes larger, and it occurs at all temperatures considered, as shown in Figure 12 (d). However, the differences in gradually decrease as the size of the simulation box becomes larger, and are expected to vanish for sufficiently large . In fact, the results at and 0.74 demonstrate that for and 80 the bulk density is the same, within statistical error limits. We conjecture that the changes in with can be attributed to the finite size of the system and finite length of simulations in the ensemble. Together with the increase in , the number of particles in the system of the same total density is also larger, resulting in the necessity of sampling much larger phase space in order to obtain reliable results, and so the simulation time becomes prohibitively long.
The above described behavior is an artifact of simulations in the ensemble. Having the total number of molecules fixed, we have a limited reservoir of particles able to adsorb on the surface. Upon the increase of , while keeping the same total density, the number of molecules increase which allows for the formation of higher film, as shown in Figure 12. This could be potentially alleviated by perfoming the simulations in the grand canonical ensemble . However, we have already explained the motivation of chosing the canonical ensemble in Section II.5.
IV Final remarks
In the present work, we have shown that tetravalent particles with patches located at the corners of a square belonging to the plane passing through the particle center assembled into the cubic tetrastack crystals both in the bulk and in the presence of the external field. However, the external field is crucial as it facilitates the formation of well-defined clusters with significantly fewer defects compared to the bulk phase. As the strength of the external field increases, the epitaxial growth mechanism changes from a thin-thick film to a series of layering transitions as the adhesion increases, and has also an impact on whether the crystal will exhibit a rough or smooth interface with the coexisting fluid.
The selective formation of an open lattice such as cubic tetrastack is of paramount importance as this polymorph exhibits a complete photonic bandgap, making it potentially useful in terms of photonic crystal applications. Additionally, the crystalline structures remain stable when the external field is turned off and even upon heating, allowing one to test them for their photonic applications and also specific post-synthetic adjustments can be made.
Although a selective formation of cubic tetrastack crystals has been reported for several several systems involving star-polymers A6 or triblock particles with triangular patches 3d-tri-3 , the use of tetravalent particles with circular patches is arguably more feasible in terms of experimental realization. In particular, the latter is supported by the recent study where the formation of tetrastack lattice has been predicted to be formed by a four-component mixture of icosahedral and octahedral patchy particles liu2023 . The authors confirmed its emergence using patchy DNA origami and were able for the first-ever experimental formation of such an open lattice. Moreover, another experimental study demonstrated that random aggregates have been observed during the self-assembly of particles with triangular patches. The main difficulty with directing the formation of well ordered structures is connected with the lack of appropriate methods to obtain particles with triangular patches of appropriate size triangular-pine . Therefore, we believe that another approach, using a different geometry of patchy particles and most importantly in a one-component system, can be used in the near future for experimental preparation of tetrastack crystals.
Acknowledgments
This work was supported by the National Science Centre, Poland, under Grant No. 2021/41/N/ST4/00437, PRELUDIUM 20.
Data Availability Statement
The data that support the findings of this study are available from the corresponding author upon reasonable request.
References
- (1) I. Sanchez-Burgos, E. Sanz, C. Vega, and J. R. Espinosa, “Fcc vs. hcp competition in colloidal hard-sphere nucleation: on their relative stability, interfacial free energy and nucleation rate,” Phys. Chem. Chem. Phys., vol. 23, pp. 19611–19626, 2021.
- (2) A. Mori, “Computer simulations of crystal growth using a hard-sphere model,” Crystals, vol. 7, no. 4, 2017.
- (3) N. R. Jana, L. Gearheart, and C. J. Murphy, “Wet chemical synthesis of high aspect ratio cylindrical gold nanorods,” The Journal of Physical Chemistry B, vol. 105, no. 19, pp. 4065–4067, 2001.
- (4) Y. Sun and Y. Xia, “Shape-controlled synthesis of gold and silver nanoparticles,” Science, vol. 298, no. 5601, pp. 2176–2179, 2002.
- (5) R. Jin, Y. Cao, C. A. Mirkin, K. L. Kelly, G. C. Schatz, and J. G. Zheng, “Photoinduced conversion of silver nanospheres to nanoprisms,” Science, vol. 294, no. 5548, pp. 1901–1903, 2001.
- (6) J. P. Rolland, B. W. Maynor, L. E. Euliss, A. E. Exner, G. M. Denison, and J. M. DeSimone, “Direct fabrication and harvesting of monodisperse, shape-specific nanobiomaterials,” Journal of the American Chemical Society, vol. 127, no. 28, pp. 10096–10100, 2005. PMID: 16011375.
- (7) Y. Yin, Y. Lu, B. Gates, and Y. Xia, “Template-assisted self-assembly: A practical route to complex aggregates of monodispersed colloids with well-defined sizes, shapes, and structures,” Journal of the American Chemical Society, vol. 123, no. 36, pp. 8718–8729, 2001. PMID: 11535076.
- (8) Y.-S. Cho, G.-R. Yi, J.-M. Lim, S.-H. Kim, V. N. Manoharan, D. J. Pine, and S.-M. Yang, “Self-organization of bidisperse colloids in water droplets,” Journal of the American Chemical Society, vol. 127, no. 45, pp. 15968–15975, 2005. PMID: 16277541.
- (9) S. C. Glotzer and M. J. Solomon, “Anisotropy of building blocks and their assembly into complex structures,” Nature Materials, vol. 6, pp. 557–562, Aug 2007.
- (10) P.-G. de Gennes, “Soft matter (nobel lecture),” Angewandte Chemie International Edition in English, vol. 31, no. 7, pp. 842–845, 1992.
- (11) J. Zhang, B. A. Grzybowski, and S. Granick, “Janus particle synthesis, assembly, and application,” Langmuir, vol. 33, no. 28, pp. 6964–6977, 2017. PMID: 28678499.
- (12) Z. Zhang and S. C. Glotzer, “Self-assembly of patchy particles,” Nano Letters, vol. 4, no. 8, pp. 1407–1413, 2004. PMID: 29048902.
- (13) E. Bianchi, R. Blaak, and C. N. Likos, “Patchy colloids: state of the art and perspectives,” Phys. Chem. Chem. Phys., vol. 13, pp. 6397–6410, 2011.
- (14) Y. Iwashita and Y. Kimura, “Orientational order of one-patch colloidal particles in two dimensions,” Soft Matter, vol. 10, pp. 7170–7181, 2014.
- (15) H. Shin and K. S. Schweizer, “Theory of two-dimensional self-assembly of janus colloids: crystallization and orientational ordering,” Soft Matter, vol. 10, pp. 262–274, 2014.
- (16) S. Jiang, J. Yan, J. K. Whitmer, S. M. Anthony, E. Luijten, and S. Granick, “Orientationally glassy crystals of janus spheres,” Phys. Rev. Lett., vol. 112, p. 218301, May 2014.
- (17) A. G. Vanakaras, “Self-organization and pattern formation of janus particles in two dimensions by computer simulations,” Langmuir, vol. 22, no. 1, pp. 88–93, 2006. PMID: 16378405.
- (18) Q. Chen, S. C. Bae, and S. Granick, “Directed self-assembly of a colloidal kagome lattice,” Nature, vol. 469, pp. 381–384, Jan 2011.
- (19) F. Sciortino, A. Giacometti, and G. Pastore, “Phase diagram of janus particles,” Phys. Rev. Lett., vol. 103, p. 237801, Nov 2009.
- (20) Z. Preisler, T. Vissers, F. Smallenburg, G. Munaò, and F. Sciortino, “Phase diagram of one-patch colloids forming tubes and lamellae,” The Journal of Physical Chemistry B, vol. 117, no. 32, pp. 9540–9547, 2013. PMID: 23902159.
- (21) T. Vissers, Z. Preisler, F. Smallenburg, M. Dijkstra, and F. Sciortino, “Predicting crystals of Janus colloids,” The Journal of Chemical Physics, vol. 138, p. 164505, 04 2013.
- (22) F. Romano, E. Sanz, P. Tartaglia, and F. Sciortino, “Phase diagram of trivalent and pentavalent patchy particles,” Journal of Physics: Condensed Matter, vol. 24, p. 064113, jan 2012.
- (23) H. Eslami, K. Bahri, and F. Müller-Plathe, “Solid–liquid and solid–solid phase diagrams of self-assembled triblock janus nanoparticles from solution,” The Journal of Physical Chemistry C, vol. 122, no. 16, pp. 9235–9244, 2018.
- (24) Z.-W. Li, Y.-W. Sun, Y.-H. Wang, Y.-L. Zhu, Z.-Y. Lu, and Z.-Y. Sun, “Softness-enhanced self-assembly of pyrochlore- and perovskite-like colloidal photonic crystals from triblock janus particles,” The Journal of Physical Chemistry Letters, vol. 12, no. 30, pp. 7159–7165, 2021. PMID: 34297560.
- (25) Q. Chen, E. Diesel, J. K. Whitmer, S. C. Bae, E. Luijten, and S. Granick, “Triblock colloids for directed self-assembly,” Journal of the American Chemical Society, vol. 133, no. 20, pp. 7725–7727, 2011. PMID: 21513357.
- (26) F. Romano and F. Sciortino, “Patterning symmetry in the rational design of colloidal crystals,” Nature Communications, vol. 3, p. 975, Jul 2012.
- (27) A. B. Rao, J. Shaw, A. Neophytou, D. Morphew, F. Sciortino, R. L. Johnston, and D. Chakrabarti, “Leveraging hierarchical self-assembly pathways for realizing colloidal photonic crystals,” ACS Nano, vol. 14, no. 5, pp. 5348–5359, 2020. PMID: 32374160.
- (28) F. Romano, E. Sanz, and F. Sciortino, “Phase diagram of a tetrahedral patchy particle model for different interaction ranges,” The Journal of Chemical Physics, vol. 132, no. 18, p. 184501, 2010.
- (29) E. G. Noya, C. Vega, J. P. K. Doye, and A. A. Louis, “The stability of a crystal with diamond structure for patchy particles with tetrahedral symmetry,” The Journal of Chemical Physics, vol. 132, p. 234511, 06 2010.
- (30) Z. Zhang, A. S. Keys, T. Chen, and S. C. Glotzer, “Self-assembly of patchy particles into diamond structures through molecular mimicry,” Langmuir, vol. 21, no. 25, pp. 11547–11551, 2005. PMID: 16316077.
- (31) E. Yablonovitch, “Photonic band-gap structures,” J. Opt. Soc. Am. B, vol. 10, pp. 283–295, Feb 1993.
- (32) D. R. Nelson, “Toward a tetravalent chemistry of colloids,” Nano Letters, vol. 2, no. 10, pp. 1125–1129, 2002.
- (33) M. He, J. P. Gales, É. Ducrot, Z. Gong, G.-R. Yi, S. Sacanna, and D. J. Pine, “Colloidal diamond,” Nature, vol. 585, pp. 524–529, Sep 2020.
- (34) T. T. Ngo, C. M. Liddell, M. Ghebrebrhan, and J. D. Joannopoulos, “Tetrastack: Colloidal diamond-inspired structure with omnidirectional photonic band gap for low refractive index contrast,” Applied Physics Letters, vol. 88, no. 24, p. 241920, 2006.
- (35) N. A. Mahynski, L. Rovigatti, C. N. Likos, and A. Z. Panagiotopoulos, “Bottom-up colloidal crystal assembly with a twist,” ACS Nano, vol. 10, no. 5, pp. 5459–5467, 2016. PMID: 27124487.
- (36) H. Pattabhiraman, G. Avvisati, and M. Dijkstra, “Novel pyrochlorelike crystal with a photonic band gap self-assembled using colloids with a simple interaction potential,” Phys. Rev. Lett., vol. 119, p. 157401, Oct 2017.
- (37) Étienne Ducrot, J. Gales, G.-R. Yi, and D. J. Pine, “Pyrochlore lattice, self-assembly and photonic band gap optimizations,” Opt. Express, vol. 26, pp. 30052–30060, Nov 2018.
- (38) H. Liu, M. Matthies, J. Russo, L. Rovigatti, R. P. Narayanan, T. Diep, D. McKeen, O. Gang, N. Stephanopoulos, F. Sciortino, H. Yan, F. Romano, and P. Šulc, “Inverse design of a pyrochlore lattice of dna origami through model-driven experiments,” 2023.
- (39) F. Romano and F. Sciortino, “Two dimensional assembly of triblock janus particles into crystal phases in the two bond per patch limit,” Soft Matter, vol. 7, pp. 5799–5804, 2011.
- (40) X. Mao, Q. Chen, and S. Granick, “Entropy favours open colloidal lattices,” Nature Materials, vol. 12, pp. 217–222, Mar 2013.
- (41) M. Trau, D. A. Saville, and I. A. Aksay, “Field-induced layering of colloidal crystals,” Science, vol. 272, no. 5262, pp. 706–709, 1996.
- (42) A. D. Dinsmore, A. G. Yodh, and D. J. Pine, “Entropic control of particle motion using passive surface microstructures,” Nature, vol. 383, pp. 239–242, Sep 1996.
- (43) A. van Blaaderen, R. Ruel, and P. Wiltzius, “Template-directed colloidal crystallization,” Nature, vol. 385, pp. 321–324, Jan 1997.
- (44) W. Lee, A. Chan, M. A. Bevan, J. A. Lewis, and P. V. Braun, “Nanoparticle-mediated epitaxial assembly of colloidal crystals on patterned substrates,” Langmuir, vol. 20, no. 13, pp. 5262–5270, 2004. PMID: 15986661.
- (45) A.-P. Hynninen, J. H. J. Thijssen, E. C. M. Vermolen, M. Dijkstra, and A. van Blaaderen, “Self-assembly route for photonic crystals with a bandgap in the visible region,” Nature Materials, vol. 6, pp. 202–205, Mar 2007.
- (46) Ł. Baran, D. Tarasewicz, D. M. Kamiński, and W. Rżysko, “Pursuing colloidal diamonds,” Nanoscale, vol. 15, pp. 10623–10633, 2023.
- (47) K. J. M. Bishop, C. E. Wilmer, S. Soh, and B. A. Grzybowski, “Nanoscale forces and their uses in self-assembly,” Small, vol. 5, no. 14, pp. 1600–1630, 2009.
- (48) P. J. Steinhardt, D. R. Nelson, and M. Ronchetti, “Bond-orientational order in liquids and glasses,” Phys. Rev. B, vol. 28, pp. 784–805, Jul 1983.
- (49) H. Eslami, P. Sedaghat, and F. Müller-Plathe, “Local bond order parameters for accurate determination of crystal structures in two and three dimensions,” Phys. Chem. Chem. Phys., vol. 20, pp. 27059–27068, 2018.
- (50) A. P. Thompson, H. M. Aktulga, R. Berger, D. S. Bolintineanu, W. M. Brown, P. S. Crozier, P. J. in ’t Veld, A. Kohlmeyer, S. G. Moore, T. D. Nguyen, R. Shan, M. J. Stevens, J. Tranchida, C. Trott, and S. J. Plimpton, “LAMMPS - a flexible simulation tool for particle-based materials modeling at the atomic, meso, and continuum scales,” Comp. Phys. Comm., vol. 271, p. 108171, 2022.
- (51) G. J. Martyna, M. L. Klein, and M. Tuckerman, “Nosé–Hoover chains: The canonical ensemble via continuous dynamics,” The Journal of Chemical Physics, vol. 97, pp. 2635–2643, 08 1992.
- (52) R. Pandit, M. Schick, and M. Wortis, “Systematics of multilayer adsorption phenomena on attractive substrates,” Phys. Rev. B, vol. 26, pp. 5112–5140, Nov 1982.
- (53) C. Vega and E. G. Noya, “Revisiting the Frenkel-Ladd method to compute the free energy of solids: The Einstein molecule approach,” The Journal of Chemical Physics, vol. 127, p. 154113, 10 2007.
- (54) M. He, J. P. Gales, X. Shen, M. J. Kim, and D. J. Pine, “Colloidal particles with triangular patches,” Langmuir, vol. 37, no. 23, pp. 7246–7253, 2021. PMID: 34081481.