Factual Serialization Enhancement: A Key Innovation for Chest X-ray Report Generation
Abstract
The automation of writing imaging reports is a valuable tool for alleviating the workload of radiologists. Crucial steps in this process involve the cross-modal alignment between medical images and reports, as well as the retrieval of similar historical cases. However, the presence of presentation-style vocabulary (e.g., sentence structure and grammar) in reports poses challenges for cross-modal alignment. Additionally, existing methods for similar historical cases retrieval face suboptimal performance owing to the modal gap issue. In response, this paper introduces a novel method, named Factual Serialization Enhancement (FSE), for chest X-ray report generation. FSE begins with the structural entities approach to eliminate presentation-style vocabulary in reports, providing specific input for our model. Then, uni-modal features are learned through cross-modal alignment between images and factual serialization in reports. Subsequently, we present a novel approach to retrieve similar historical cases from the training set, leveraging aligned image features. These features implicitly preserve semantic similarity with their corresponding reference reports, enabling us to calculate similarity solely among aligned features. This effectively eliminates the modal gap issue for knowledge retrieval without the requirement for disease labels. Finally, the cross-modal fusion network is employed to query valuable information from these cases, enriching image features and aiding the text decoder in generating high-quality reports. Experiments on MIMIC-CXR and IU X-ray datasets from both specific and general scenarios demonstrate the superiority of FSE over state-of-the-art approaches in both natural language generation and clinical efficacy metrics. Ablation studies emphasize the beneficial role of factual serialization in cross-modal alignment and report generation modules. The code is available at: https://github.com/mk-runner/FSE.
keywords:
\KWDChest X-ray report generation, Factual serialization, Cross-modal alignment, Similar historical cases1 Introduction
Chest X-ray report generation (CXRG) aims to provide a comprehensive description of the morphological and positional features of essential organs and tissues in medical images using natural language. This endeavor is crucial in assisting physicians during disease screening, diagnosis, and clinical decision-making. Nevertheless, this task traditionally demands manual composition based on medical knowledge and clinical practical experiences, making it a highly specialized and time-consuming process [20]. Fortunately, the rapid evolution of artificial intelligence techniques, particularly deep learning [9, 11], has significantly propelled the advancement of CXRG.
The dominant framework for CXRG is the encoder-decoder architecture [7, 21, 29, 22]. In this setup, the encoder is responsible for extracting uni-modal representations, while the decoder generates reports based on these representations in an autoregressive manner. To enhance the cross-modal interaction, certain studies have devised cross-modal alignment schemes [28, 31, 24] and integrated strategies based on medical domain expert knowledge [12, 32, 10]. However, CXRG is still confronted with challenges. Firstly, achieving cross-modal alignment between medical images and reports is intricate. Chest X-ray images exhibit high similarities, with subtle differences in regions of interest. Reports are a mixture of factual words (e.g., entities and attributes extracted by RadGraph [14]) and presentation-style vocabulary (e.g., sentence structure and grammar). Most existing methods directly utilize reports and images for cross-modal alignment, neglecting the impact of presentation-style vocabulary in reports on this alignment. Secondly, knowledge retrieval approaches are suboptimal. Some scholars retrieve knowledge based on the similarity between medical images and reports without taking into account the modal gap issue. Thirdly, assessing coherence and integrality between generated and reference reports during the testing phase poses a challenge. In specific scenarios, such as emergency diagnoses, concise medical reports prove more effective. Many existing methods assess the model’s performance by truncating complete reference reports to a specific length of ground truth. In general scenarios, comprehensive and detailed reports are essential. However, the above scheme may result in incomplete key findings in the ground truth, posing challenges in comprehensively assessing coherence and integrality between generated and reference reports.
To tackle the challenge of cross-modal alignment between medical images and reports, recent studies [2, 3, 24, 34] have formulated strategies to boost the representation capacity of uni-modal features. Researchers have introduced global alignment methods [36, 39], local alignment techniques between medical images and sentences in reports [3, 2], and local alignment strategies between medical images and generated words [4]. Despite their success in improving uni-modal representations, these methods often overlook the impact of presentation-style vocabulary in reports on cross-modal alignment.
To integrate medical domain expert knowledge into CXRG, this process involves retrieving the top-k most similar samples from the training set based on information like image representations or disease labels, forming specific knowledge or similar historical cases. Some scholars [18, 36] identify the top-k similar reports as specific knowledge by directly measuring the similarity between image representations and report representations in a queue. However, this approach does not take into account the modal gap issue, leading to inaccuracies in specific knowledge retrieval. Additionally, certain investigations [19, 37] consider reports with similar disease labels as specific knowledge. Nevertheless, this method relies heavily on disease labels for each medical image, posing challenges for scalability to other datasets.
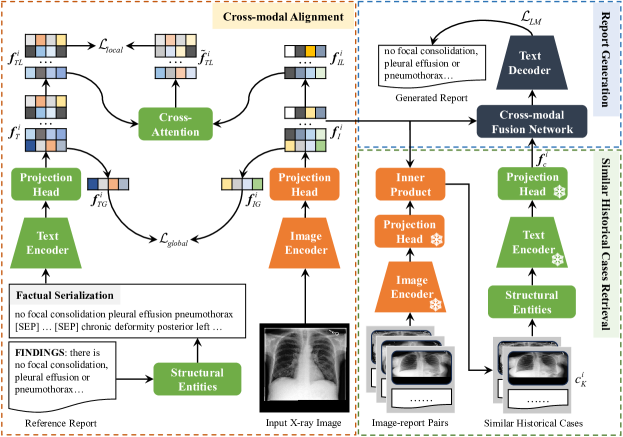
This paper introduces a novel method, Factual Serialization Enhancement (FSE), for chest X-ray report generation. FSE is a two-stage framework, including a cross-modal alignment module enhanced by factual serialization and a report generation module based on similar historical cases. In the first stage, FSE first devises the structural entities approach to eliminate presentation-style vocabulary in reports, offering specific input for our model. Subsequently, a cross-modal alignment module is introduced between medical images and factual serialization in reports, ensuring that the extracted image features implicitly maintain semantic similarity with their reference reports. In the second stage, we first retrieve similar historical cases for each sample from the training set based on aligned image features, without requiring disease labels, effectively addressing the modal gap issue. The cross-modal fusion network is then employed to query valuable information from these similar historical cases, enriching image features and assisting the text decoder in producing high-quality reports. The effectiveness of our proposed method is successfully demonstrated on the widely used benchmarks MIMIC-CXR and IU X-ray from both specific and general scenarios, outperforming multiple state-of-the-art methods. Our key contributions are summarized as follows:
-
1.
Devising the structural entities approach to extract factual serialization from reports, thereby mitigating the impact of presentation-style vocabulary in reports on cross-modal alignment and providing specific input for our model.
-
2.
Introducing a cross-modal alignment module enhanced by factual serialization to ensure extracted image features implicitly preserve semantic similarity with their corresponding reference reports.
-
3.
Presenting a novel method for retrieving similar historical cases, without the requirement for disease labels, effectively addressing the modal gap issue in knowledge retrieval.
-
4.
Evaluating the model’s performance under both concise and complete reference reports from the perspectives of specific and general scenarios.
2 Related Work
To address the aforementioned challenges, existing methods primarily utilize specialized cross-modal alignment schemes and retrieve high-quality similar historical cases. This section will introduce related work on cross-modal alignment with image-report pairs and the retrieval of similar historical cases for each medical image.
Cross-modal alignment with image-report pairs. It aims to enhance the uni-modal representations and improve inter-modal interaction. Early works concentrate primarily on tailored attention mechanisms, such as MDNet [43], TandemNet [41], and TandemNet2 [42]. Contrastive learning, demonstrated by CPC [23], CLIP [25], and ALBEF [17], is gradually being applied to medical tasks for cross-modal alignment. KAD [39] utilizes instance-wise cross-modal alignment between paired medical images and entities in reports. To capture fine-grained features, PTUnifier [2] performs token-wise cross-modal alignment between medical images and reports using the cross-attention mechanism. PRIOR [6] achieves instance-wise and token-wise cross-modal alignment between the images and sentence of reports, utilizing InfoNCE loss and cross-attention mechanism, respectively. MGCA [30] further introduces disease-level cross-modal alignment, leveraging the natural semantics of the same disease. These advancements offer a fresh perspective on cross-modal alignment, inspiring further exploration. Unfortunately, less attention has been given to understanding the impact of presentation-style vocabulary in reports on cross-modal alignment. To circumvent this, we devise the structural entities approach to extract factual serialization from reports, thereby mitigating the impact of presentation-style vocabulary in reports on cross-modal alignment.
Retrieving similar historical cases for each medical image. Similar historical cases refer to a collection of samples in the training set that closely resemble the current sample, and specific knowledge is the set of reports from these cases. Their primary purpose is to augment image features and improve the quality of generated reports. M2KT [36] introduces a learned knowledge base with a memory mechanism, enabling the automatic distillation and archival of medical insights from reports without manual labor. DCL [18] extends the preconstructed graph [40] by directly measuring the similarity between image and report representations in a queue to unveil specific knowledge. Similarly, GSKET [37] and MOTOR [19] treat reports with similar disease labels as specific knowledge, distinguishing them from DCL. These contributions represent significant advancements in the field of CXRG. Nevertheless, the retrieval of similar historical cases poses challenges, including the occurrence of a modal gap issue or the need for additional disease labels. On the contrary, we present a novel method for retrieving similar historical cases based on the aligned image features, without the requirement for disease labels, effectively addressing the modal gap issue in knowledge retrieval.
3 Methodology
In addressing the above concerns in automated imaging report generation, we propose a novel method, Factual Serialization Enhancement (FSE), for chest X-ray report generation. Fig. 1 illustrates the overview of our proposed FSE. The framework consists of a cross-modal alignment module enhanced by factual serialization and a report generation module based on similar historical cases. In this section, we will delve sequentially into the background of FSE, the cross-modal alignment module, and the report generation module.
3.1 Background
Problem formulation. Let and be the set of medical images and reports in the training set, respectively, where n is the number of samples, and denotes the ith image-report pairs in . is the collection of medical images in the test set, and m is the number of images. 111To prevent data leakage, similar historical cases for a sample in the training set exclude the sample itself. represents the set of K similar historical cases for each sample, where and . Here, denotes the set of the top K samples in the training set that are most similar to . In this work, our goal is to learn a model with parameters on and ultimately generate a report for a given medical image in the test set, conditioned on these similar historical cases .
Image encoder. Motivated by the architectural designs of R2Gen [5] and R2GenCMN [4], our framework uses ResNet101 [11] pre-trained on ImageNet as image encoder. The extraction of features from medical images involves utilizing the last convolutional layer of the CNN, followed by deriving global features through average pooling. These processes are formulated as:
| (1) |
| (2) |
where represents the number of patches in the image, and is the image encoder with parameters .
Text encoder. Before extracting features from factual serialization in reports, we first establish and train a word-level tokenizer based on the corpus in the training set. Subsequently, factual serialization, denoted as , is encoded using the tokenizer, and its features are extracted through a six-layer pre-trained SciBERT [1] model222https://huggingface.co/allenai/scibert_scivocab_uncased. More precisely, the last hidden state of SciBERT is regarded as the extracted text features, denoted as:
| (3) |
where indicates the number of tokens, and represents global features extracted by the text encoder with parameters .
Projection head. Projection heads, labeled as , , , and , are primarily responsible for mapping the global and local features extracted by the image encoder and text encoder to the same dimension d. The formulation of these projection heads is as follows:
| (4) |
where and . Likewise, we can obtain and matrices based on . Here, and are fully connected networks with one hidden layer, and similarly, and represent one-hidden convolutional networks.
Text decoder. We adopt the memory-driven Transformer designed by R2Gen [5] as the text decoder, which incorporates a relational memory to record key information throughout the generation process. The text decoder is trained from scratch, and reports are generated in an autoregressive manner.
3.2 Cross-modal Alignment Module Enhanced by Factual Serialization
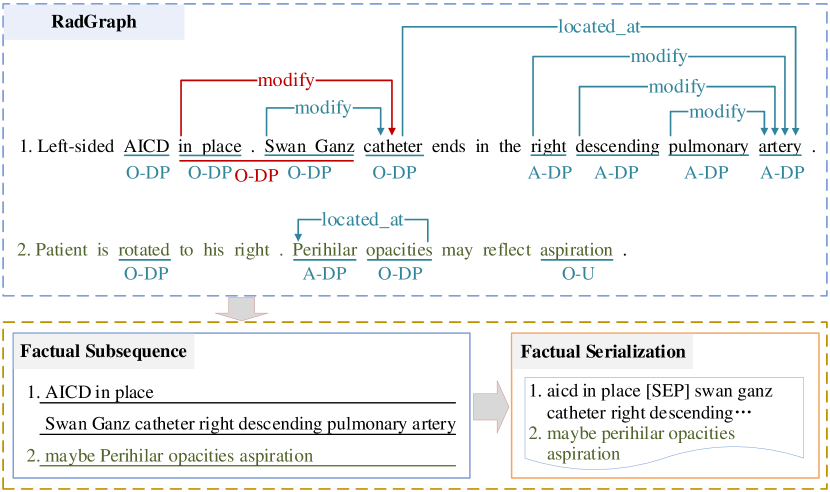
RadGraph. RadGraph [14] serves as a tool for extracting entities and relations from full-text radiology reports, as shown in Fig. 2. Entities defined by RadGraph fall into four categories based on entity type and uncertainty level: “A-DP”, “O-DP”, “O-U”, and “O-DA”. Here, “A” and “O” denote anatomy and observation entity types, respectively, while “DP”, “U”, and “DA” represent the uncertainty levels for the observation entity (i.e., “Definitely Present”, “Uncertain”, and “Definitely Absent”). Relationships between entities include “suggestive_of”, “located_at”, and “modify”. The utilization of RadGraph in extracting valuable information from reports has gained broad application in downstream tasks like chest X-ray report generation [18] and auto diagnosis [39]. However, entities extracted by RadGraph may include noise (e.g., “in place . Swan Ganz” in Fig. 2) and isolated entities, the latter indicating no connection to other entities (e.g., “aspiration” in Fig. 2). Therefore, directly using RadGraph results for cross-modal alignment [35, 39] or knowledge graph expansion [18] is a suboptimal scheme.
Structural entities approach for extracting factual serialization from reports. To address the above concerns, we present the structural entities approach to extract factual serialization from reports, thereby mitigating the impact of presentation-style vocabulary in reports on cross-modal alignment and providing the specific input for our model. We start with refining the entities extracted by RadGraph [14] to eliminate noise and redundancy. Specifically, we exclude entities that span two sentences (e.g., “in place . Swan Ganz”) and single-word entities lacking clinical significance in a sentence (e.g., “rotated”). In cases where a word in the same position is part of several entities, such as “1.9 1.0 cm” and “1.0 cm”, we retain only the longest entity, namely “1.9 1.0 cm”. Afterward, all remaining entities in the report are organized in their original order. The resulting sequence is then segmented into multiple factual subsequences, such as “AICD in place”, determined by the sentence-ending symbols in the report. Notably, if there is an “O-DA” (or “O-U”) entity in a factual subsequence, the keyword “no” (or “maybe”) will be added at the beginning of the subsequence. Finally, we employ the [SEP] token to connect these factual subsequences, creating factual serialization. This process is denoted as:
| (5) |
where represents the number of factual subsequences for the ith sample, and is its factual serialization. The structural entities approach maintains a certain level of readability in factual serialization and establishes connections between isolated entities and other entities. In addition, the representations of the serialization can be directly extracted by a text encoder.
Cross-modal alignment between medical images and factual serialization in reports. To enhance the uni-modal representations, we introduce a cross-modal alignment module enhanced by factual serialization. On one hand, to ensure consistency in representations of the same instance across different modalities, we define instance-wise cross-modal alignment between medical images and factual serialization in reports as follows:
| (6) | |||
where B and are batch size and the temperature parameter, respectively. and denote global features of medical images and factual serialization in the ith sample, and . This focuses on distinguishing high-level features. On the other hand, recognizing the significance of fine-grained features in medical image analysis, we introduce the token-wise cross-modal alignment. Firstly, we calculate the cross-modal attention representation between local text features and local image features . The calculation involves treating text tokens as queries, and image patches as keys and values to derive the cross-modal text embedding , denoted as:
| (7) | ||||
Due to the potential sharing of similar semantic information in reports from different samples, determining negative pairs becomes challenging. Therefore, within a sample, we designate tokens at the same position as positive pairs and those at different positions as negative pairs. The token-wise cross-modal alignment is formulated as:
| (8) | ||||
where is the temperature parameter. To summarize, the training objective for the cross-modal alignment module is:
| (9) |
3.3 Report Generation Module Based on Similar Historical Cases
A doctor formulates a particular treatment based on previous patients with similar clinical findings or symptoms. Consequently, we introduce the report generation module based on similar historical cases. In this section, we will describe similar historical cases retrieval and the report generation module.
Similar historical cases retrieval. After completing the cross-modal alignment module, we introduce a novel approach for retrieving similar historical cases for each sample from the training set without additional training. More precisely, image features are extracted using the image encoder initialized with the pre-trained model described in section 3.2. Since the extracted image features implicitly preserve semantic similarity with their reference reports, we leverage the dot product between them to retrieve similar historical cases for each sample from the training set. The approach not only obviates the requirement for additional disease labels (such as in GSKET [37] and MOTOR [19]) but also effectively addresses the modal gap problem in knowledge retrieval. To improve the retrieval efficiency, the Faiss tool [16] is employed to compute the dot product between image features.
| Method | NLG | CE | ||||||||||
| BS | BL1 | BL2 | BL3 | BL4 | MTR | R-L | RG | CX5 | CX14 | |||
| R2Gen (EMNLP’20) | 100♮ | 0.841 | 0.353 | 0.218 | 0.145 | 0.103 | 0.137 | 0.264 | 0.207 | 0.340 | 0.340 | |
| Cpl. | 0.841 | 0.350 | 0.209 | 0.137 | 0.097 | 0.135 | 0.266 | 0.211 | 0.339 | 0.338 | ||
| R2GenCMN (ACL’21) | 100♮ | 0.843 | 0.353 | 0.218 | 0.148 | 0.106 | 0.142 | 0.278 | 0.220 | 0.461 | 0.278 | |
| Cpl. | 0.844 | 0.328 | 0.198 | 0.130 | 0.090 | 0.133 | 0.268 | 0.223 | 0.464 | 0.393 | ||
|
80♮ | - | 0.363 | 0.228 | 0.156 | 0.115 | - | 0.284 | - | - | 0.371 | |
| CvT2DistillGPT2 (ARTMED’23) | 60♮ | 0.839 | 0.393 | 0.248 | 0.171 | 0.127 | 0.155 | 0.286 | 0.223 | 0.463 | 0.391 | |
| Cpl. | 0.842 | 0.323 | 0.204 | 0.140 | 0.102 | 0.138 | 0.277 | 0.237 | 0.483 | 0.434 | ||
| M2KT (MedIA’23) | 80♮ | 0.831 | 0.386 | 0.237 | 0.157 | 0.111 | 0.137 | 0.274 | 0.204 | 0.477 | 0.352 | |
| Cpl. | 0.833 | 0.351 | 0.204 | 0.128 | 0.085 | 0.133 | 0.244 | 0.210 | 0.483 | 0.413 | ||
|
90♮ | - | - | - | - | 0.109 | 0.150 | 0.284 | - | - | 0.373 | |
|
Cpl.♮ | - | 0.373 | 0.249 | 0.175 | 0.126 | 0.168 | 0.264 | - | 0.547 | 0.447 | |
|
-♮ | - | 0.386 | 0.250 | 0.169 | 0.124 | 0.152 | 0.291 | - | - | 0.311 | |
|
-♮ | - | - | - | - | 0.069 | - | 0.235 | - | 0.422 | 0.320 | |
|
-♮ | - | - | 0.162 | - | - | - | - | 0.228 | - | 0.394 | |
| FSE-1 (ours) | 60 | 0.841 | 0.381 | 0.232 | 0.156 | 0.113 | 0.158 | 0.279 | 0.225 | 0.499 | 0.453 | |
| 80 | 0.844 | 0.397 | 0.242 | 0.163 | 0.117 | 0.155 | 0.281 | 0.238 | 0.529 | 0.470 | ||
| 90 | 0.845 | 0.389 | 0.238 | 0.160 | 0.115 | 0.153 | 0.281 | 0.240 | 0.536 | 0.472 | ||
| 100 | 0.845 | 0.384 | 0.235 | 0.158 | 0.113 | 0.152 | 0.281 | 0.241 | 0.538 | 0.473 | ||
| Cpl. | 0.845 | 0.373 | 0.228 | 0.152 | 0.109 | 0.148 | 0.279 | 0.241 | 0.542 | 0.474 | ||
| FSE-5 (ours) | 60 | 0.840 | 0.378 | 0.230 | 0.154 | 0.111 | 0.157 | 0.278 | 0.219 | 0.519 | 0.462 | |
| 80 | 0.843 | 0.396 | 0.241 | 0.162 | 0.116 | 0.154 | 0.279 | 0.232 | 0.549 | 0.480 | ||
| 90 | 0.844 | 0.389 | 0.237 | 0.159 | 0.114 | 0.152 | 0.279 | 0.234 | 0.554 | 0.482 | ||
| 100 | 0.844 | 0.384 | 0.234 | 0.157 | 0.112 | 0.151 | 0.279 | 0.235 | 0.556 | 0.481 | ||
| Cpl. | 0.845 | 0.373 | 0.227 | 0.151 | 0.108 | 0.148 | 0.278 | 0.236 | 0.560 | 0.482 | ||
| Settings | Cross-modal Alignment | Report Generation | NLG | CE | ||||||
|---|---|---|---|---|---|---|---|---|---|---|
| PFRA | IWA | TWA | PFRC | FSHC | BS | BL2 | RG | CX5 | CX14 | |
| BASE | 0.841 | 0.209 | 0.211 | 0.339 | 0.338 | |||||
| (a) | Reports | Reports | CMF | 0.837 | 0.199 | 0.184 | 0.377 | 0.305 | ||
| (b) | Reports | FS | CMF | 0.838 | 0.198 | 0.182 | 0.342 | 0.292 | ||
| (c) | FS | FS | CMF | 0.842 | 0.199 | 0.207 | 0.453 | 0.379 | ||
| (d) | FS | FS | CMF | 0.836 | 0.187 | 0.185 | 0.347 | 0.294 | ||
| (e) | FS | 0.845 | 0.206 | 0.234 | 0.513 | 0.431 | ||||
| (f) | FS | FS | Concat. | 0.844 | 0.206 | 0.230 | 0.489 | 0.406 | ||
| (g) | FS | Reports | CMF | 0.843 | 0.216 | 0.233 | 0.512 | 0.432 | ||
| FSE-5 (Ours) | FS | FS | CMF | 0.845 | 0.227 | 0.236 | 0.560 | 0.482 | ||
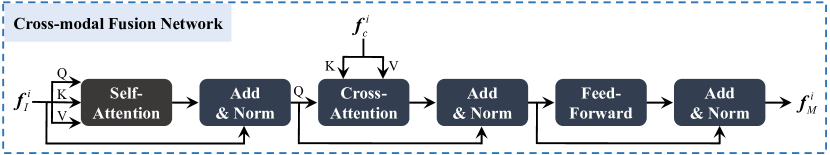
Report generation based on similar historical cases. After retrieving similar historical cases for each sample, the report generation module generates reports based on the given medical images and these cases. The image and text encoder are initialized using weights from the pre-trained model described in section 3.2, and the text encoder remains frozen during the training of the report generation module. For the set of K similar historical cases for the ith sample, denoted as , we exclusively utilize factual serialization in reports to enhance the representation capacity of image features. Specifically, their local text tokens are concatenated, and global tokens are fused using averaging operations. Next, these text tokens are fed into the projection head to obtain the representations of similar historical cases, labeled as . Subsequently, the cross-modal fusion network, with a Transformer Decoder layer [3, 2], is employed to integrate the representations of similar historical cases, as shown in Fig. 3. Each layer includes a self-attention sub-layer, cross-attention sub-layer, and feed-forward sub-layer. In the self-attention sub-layer, the image features simultaneously serve as queries, keys, and values, capturing internal relationships between image patches. This process is formulated as:
| (10) |
where , , and are learnable parameter matrices. A residual connection, followed by layer normalization, is applied to , and the result is expressed as , for simplicity. queries valuable information from the representations of similar historical cases through the cross-attention sub-layer, mathematically represented as:
| (11) |
where , , and represent learnable parameter matrices. Similarly, a residual connection, followed by layer normalization, is employed to . The result is then input into the feed-forward sub-layer, followed by a residual connection and layer normalization, to derive the multi-modal representations for medical images. Finally, the text decoder generates reports in an autoregressive manner, conditioned on the multi-modal representations for medical images. In summary, the parameters of the report generation module are optimized by minimizing the negative log-likelihood :
| (12) |
where M represents the maximum length of tokens generated by the text decoder.
4 Experiments
4.1 Datasets, Evaluation Metrics, and Experimental Settings
Datasets. We evaluate the effectiveness of our proposed FSE on the widely used benchmarks MIMIC-CXR [15] and IU X-ray [8]. Owing to the absence of an official data partition for the IU X-ray dataset, conducting a fair comparison is challenging, and detailed experimental results for this dataset are available in the supplementary materials. For MIMIC-CXR, we adhere to the official partitioning settings and follow previous works [5, 18, 37, 29] by considering the findings section of raw radiology reports as reference reports. To address issues like empty or clinically meaningless content in some reference reports, such as “Portable supine chest radiograph__at 23:16 is subnitted.”, we removed them using the extracted factual serialization. As a result, the training, validation, and test sets include 269,239 (150,957), 2,113 (1,182), and 3,852 (2,343) medical images (reports), respectively. All reproducibility methods utilize the same test set for fair comparison.
| Method | NLG | CE | |||||||||
|---|---|---|---|---|---|---|---|---|---|---|---|
| BS | BL1 | BL2 | BL3 | BL4 | MTR | R-L | RG | CX5 | CX14 | ||
| FSE-0 | 100 | 0.845 | 0.349 | 0.213 | 0.143 | 0.102 | 0.142 | 0.278 | 0.233 | 0.512 | 0.430 |
| Cpl. | 0.845 | 0.338 | 0.206 | 0.137 | 0.098 | 0.138 | 0.277 | 0.234 | 0.513 | 0.431 | |
| FSE-1 | 100 | 0.845 | 0.384 | 0.235 | 0.158 | 0.113 | 0.152 | 0.281 | 0.241 | 0.538 | 0.473 |
| Cpl. | 0.845 | 0.373 | 0.228 | 0.152 | 0.109 | 0.148 | 0.279 | 0.241 | 0.542 | 0.474 | |
| FSE-3 | 100 | 0.843 | 0.369 | 0.223 | 0.148 | 0.105 | 0.146 | 0.276 | 0.230 | 0.541 | 0.458 |
| Cpl. | 0.843 | 0.358 | 0.216 | 0.144 | 0.102 | 0.143 | 0.275 | 0.231 | 0.545 | 0.459 | |
| FSE-5 | 100 | 0.844 | 0.384 | 0.234 | 0.157 | 0.112 | 0.151 | 0.279 | 0.235 | 0.556 | 0.481 |
| Cpl. | 0.845 | 0.373 | 0.227 | 0.151 | 0.108 | 0.148 | 0.278 | 0.236 | 0.560 | 0.482 | |
| FSE-10 | 100 | 0.844 | 0.379 | 0.232 | 0.156 | 0.111 | 0.151 | 0.279 | 0.236 | 0.548 | 0.473 |
| Cpl. | 0.844 | 0.368 | 0.224 | 0.150 | 0.107 | 0.147 | 0.278 | 0.237 | 0.550 | 0.475 | |
| FSE-20 | 100 | 0.843 | 0.347 | 0.210 | 0.139 | 0.099 | 0.141 | 0.273 | 0.229 | 0.537 | 0.455 |
| Cpl. | 0.843 | 0.336 | 0.202 | 0.133 | 0.094 | 0.137 | 0.272 | 0.230 | 0.541 | 0.457 | |
Evaluation metrics. For a comprehensive evaluation, we use the conventional natural language generation (NLG) metrics and clinical efficacy (CE) metrics, measuring lexical similarity and clinical effectiveness between generated and reference reports. NLG metrics comprise BERTScore, BLEU, METEOR, and ROUGE_L. Note that BERTScore is pre-trained using “distilbert-base-uncased” [26]. CE metrics consist of F1,mic-14 CheXbert, F1,mic-5 CheXbert [27], and F1 RadGraph [7], where F1,mic-14 CheXbert is a micro-F1 score based on 14 different categories, including those associated with thoracic diseases and support devices labeled by CheXpert [13]. Compared to F1,mic-14 CheXbert, F1,mic-5 CheXbert focuses exclusively on the five categories of “Cardiomegaly”, “Edema”, “Consolidation”, “Atelectasis”, and “Pleural Effusion”. F1 RadGraph [38] measures the overlap of clinical entities and relationships extracted by RadGraph, with a partial reward level. Notably, higher values for each metric indicate better performance. Notably, F1,mic-14 CheXbert, F1,mic-5 CheXbert, and F1 RadGraph are calculated using f1chexbert333https://pypi.org/project/f1chexbert/ and radgraph444https://pypi.org/project/radgraph/, respectively.
Experimental settings. The image encoder, text encoder, and text decoder are described in section 3.1. The cross-modal fusion network is implemented as a Transformer Decoder layer. In the first stage (i.e., for the training of the cross-modal alignment module), we adopt the AdamW optimizer with an initial learning rate of 5e-5 for training 100 epochs. In the second stage (i.e., for the training of the report generation module), we utilize the RAdam optimizer with a learning rate of 5e-5 for training 50 epochs. The optimal model is selected based on the cumulative scores, considering F1 RadGraph, F1,mic-14 CheXbert, and BLEU4 on the validation set. Following this, the chosen model’s performance is evaluated on the test set, and the results are reported accordingly.
4.2 Main Results
We evaluate the performance of models using both conventional natural language generation (NLG) metrics and clinical efficacy (CE) metrics, comparing our proposed method FSE against seven state-of-the-art (SOTA) approaches: R2Gen [5], R2GenCMN [4], GSKET [37], CvT2DistillGPT2 [22], M2KT [36], DCL [18], and RGRG [29]. We evaluate report generation performance from the perspectives of specific and general scenarios. Specifically, in the testing phase, we preserve the generated reports unaltered and truncate reference reports to a specific length, denoted as , to establish ground truth. In the general scenario, equals the length of complete reference reports, represented as “Cpl.”; otherwise, it represents a specific scenario. We present comparison results in Table 1. For METransformer [33], OpenLLaMA-7B [20], and SA (Style-Aware Radiology Report Generation) [35], we acknowledge the absence of values, and their experimental results are provided for reference only.
As evident from Table 1, in specific scenarios (i.e., ), when is set to 60, our approach slightly lags behind CvTDistillGPT2 [22] in certain NLG metrics. However, notable improvements of 5.6% and 7.1% are observed for F1,mic-5 CheXbert (CX5) and F1,mic-14 CheXbert (CX14) in CE metrics. Increasing to 80 results in a 1.1% improvement in BLEU1 (BL1) metrics in FSE-1, reaching 0.397. For , FSE-1 achieves an F1 RadGraph (RG) score of 0.241, indicating a 2.1% improvement. Simultaneously, CX5 and CX14 of FSE-5 increase by 9.5% and 14.1%, respectively. In a general scenario (i.e., ), our method exhibits a slight inferiority to the previous SOTA methods in certain NLG metrics. However, in CE metrics, FSE-5 exhibits improvements of 1.3% and 3.5% for CX5 and CX14. These observations indicate that our method excels in the majority of NLG and CE metrics in specific scenarios compared to previous SOTA methods. In the general scenario, although our performance lags slightly behind the RGRG [29] in certain NLG metrics, there is a considerable improvement in CE metrics. These advancements affirm that our generated reports can cover rich factual information while maintaining a smooth narrative.
4.3 Ablation Study
Contribution of each component. In the general scenario, we conducted ablation studies on MIMIC-CXR to investigate the contribution of each component, as shown in Table 2. When the model requires injecting similar historical cases, the number is fixed at 5 for each sample(FSE-5). If the presentation form of reports used in the cross-modal alignment and report generation modules is the same, the text encoder is frozen during training. The experimental results reveal a positive effect of each component on performance. Specifically: 1) “BASE” surpasses (a) and (b), highlighting the challenge of cross-modal alignment between medical images and reports, possibly due to interference from the presentation-style vocabulary. 2) Compared to “BASE”, (e) exhibits a notable enhancement in CE metrics. This highlights the advantage of factual serialization in the cross-modal alignment module, improving the clinical effectiveness of generated reports. 3) (e) exceeds (c) and (d), suggesting that achieving alignment requires simultaneous instance-wise and token-wise cross-modal alignment between images and factual serialization in reports. 4) Compared to (g) and FSE-5, (f) shows slightly weaker performance in both NLG and CE metrics. This indicates that the cross-modal fusion network facilitates the retrieval of valuable information from corresponding similar historical cases, complementing image features and assisting the text decoder in producing high-quality reports. 5) FSE-5 outperforms (g), showing notable improvements in BLEU2 (BL2) and F1,mic-14 CheXbert (CX14) by 1.1% and 5%, respectively. Additionally, compared to (e), FSE-5 exhibits improvements of 2.1%, 4.7%, and 5.1% for BL2, CX5, and CX14, respectively. These results imply that incorporating similar historical cases into the text decoder effectively mitigates the impact of factual serialization on the smoothness of generated reports, emphasizing the advantageous role of factual serialization in the report generation module. 6) Under the same framework, FSE-5 and (a) differ solely in the presentation form of reports. Specifically, FSE-5 utilizes factual serialization of reports in cross-modal alignment and report generation modules, while (a) uses reports containing presentation-style vocabulary in these modules. However, FSE-5 demonstrates a notable enhancement in both NLG and CE metrics. This suggests that factual serialization enhances the clinical effectiveness and fluency of generated reports, emphasizing its outstanding advantages in cross-modal alignment and report generation modules.
Impact of the number of similar historical cases. To investigate the impact of varying quantities of similar historical cases, we vary the number within the range of and train FSE on MIMIC-CXR. Performance evaluation is conducted from both specific and general scenario perspectives, as shown in Table 3. Injecting the model with similar historical cases leads to a significant improvement in both NLG and CE metrics. In the specific scenario (i.e., ), FSE-1 shows relative increases of 3.5% and 4.3% compared to BLEU1 (BL1) and F1,mic-14 CheXbert (CX14) in FSE-0, respectively. Similar positive effects are observed in the general scenario, confirming the effectiveness of retrieving similar historical cases. This effectiveness is attributed to aligned image features implicitly preserving similar semantics with corresponding reference reports. FSE-1 excels in conventional NLG metrics and F1 RadGraph (RG) metric, while FSE-5 demonstrates the most balanced performance across NLG and CE metrics. In addition, a decline in model performance is observed when the number of cases exceeds 5. This decline may be ascribed to the increased model complexity and potential overfitting as more similar historical cases are injected.
4.4 Qualitative Analysis
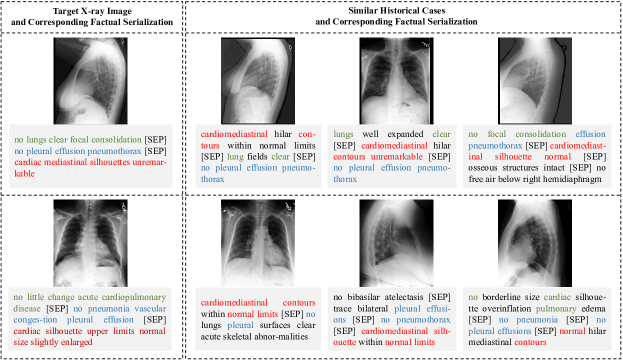
Visualization of similar historical cases. To verify the effectiveness of similar historical cases retrieval, we visualize the top-3 similar historical cases for two samples in the MIMIC-CXR test set, as shown in Fig. 4. Upon observation, the factual serialization in similar historical cases shares a certain similarity with the target X-ray images. This suggests that these cases contribute valuable information to image features through the cross-modal fusion network, thereby enriching image features and facilitating the text decoder in generating high-quality reports. As aligned image features implicitly preserve semantic similarity with their reference reports, our proposed method directly utilizes the similarity between aligned image features to retrieve similar historical cases. Thus, our method effectively eliminates the modal gap issue for knowledge retrieval, enabling the effective retrieval of historical similar cases.
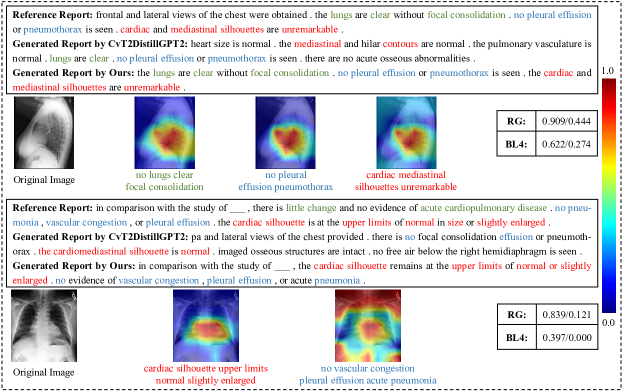
Qualitative results. Fig. 5 shows the generated reports and attention visualization in the MIMIC-CXR test set. By utilizing the multi-head attention in the first layer of the decoder, we visualize the attention of factual sequences in a report generated by our model. Examining both performance metrics and the number of matched colors in the generated reports reveals that our method significantly outperforms the basic approach, highlighting its superior performance in chest X-ray report generation. Moreover, our model demonstrates the ability to locate the position of factual sequences in the original image, indicating a certain level of interpretability.
5 Conclusion
This paper proposed Factual Serialization Enhancement (FSE), a novel method for chest X-ray report generation. Firstly, we presented the structural entities approach to extract factual serialization from reports, thereby alleviating the impact of presentation-style vocabulary on cross-modal alignment. Then, a cross-modal alignment module enhanced by factual serialization was presented to learn uni-modal representations. Subsequently, we introduced a new method to retrieve similar historical cases from the training set based on aligned image features. As the aligned image features implicitly maintain semantic similarity with their corresponding reference reports, this method calculated similarity solely among aligned features, effectively eliminating the modal gap issue for knowledge retrieval without necessitating disease labels. Finally, we employed the cross-modal fusion network to query valuable information from factual serialization in similar historical cases, enhancing the representation capacity of image features and assisting the text decoder in generating high-quality reports. Experimental results on MIMIC-CXR and IU X-ray, conducted in both specific and general scenarios, illustrated the superior performance of FSE over state-of-the-art (SOTA) approaches. Ablation studies further demonstrated the advantageous role of factual serialization in cross-modal alignment and report generation modules. Despite the impressive performance demonstrated, FSE is currently limited to processing a single image at a time through the image encoder, which will be explored in future work.
Declaration of Competing Interest
The authors declare that they have no known competing financial interests or personal relationships that could have appeared to influence the work reported in this paper.
Data Availability
Data can be found at PhysioNet through credentialed access.
Acknowledgments
The work was jointly supported by the National Key R&D Program of China [grant number 2022ZD0117103]; the National Natural Science Foundations of China [grant number 62272364]; the Teaching Reform Project of Shaanxi Higher Continuing Education [grant number 21XJZ004]; and the High-Performance Computing Platform of Xidian University.
References
- Beltagy et al. [2019] Beltagy, I., Lo, K., Cohan, A., 2019. Scibert: A pretrained language model for scientific text, in: EMNLP, Association for Computational Linguistics. pp. 3615–3620. URL: https://aclanthology.org/D19-1371, doi:10.18653/v1/D19-1371.
- Chen et al. [2023] Chen, Z., Diao, S., Wang, B., Li, G., Wan, X., 2023. Towards unifying medical vision-and-language pre-training via soft prompts, in: ICCV, IEEE. pp. 23346–23356. URL: https://doi.org/10.1109/ICCV51070.2023.02139, doi:10.1109/ICCV51070.2023.02139.
- Chen et al. [2022] Chen, Z., Li, G., Wan, X., 2022. Align, reason and learn: Enhancing medical vision-and-language pre-training with knowledge, in: ACMMM, Association for Computing Machinery. pp. 5152–5161. URL: https://doi.org/10.1145/3503161.3547948, doi:10.1145/3503161.3547948.
- Chen et al. [2021] Chen, Z., Shen, Y., Song, Y., Wan, X., 2021. Cross-modal memory networks for radiology report generation, in: ACL, Association for Computational Linguistics. pp. 5904–5914. URL: https://aclanthology.org/2021.acl-long.459, doi:10.18653/v1/2021.acl-long.459.
- Chen et al. [2020] Chen, Z., Song, Y., Chang, T.H., Wan, X., 2020. Generating radiology reports via memory-driven transformer, in: EMNLP, Association for Computational Linguistics. pp. 1439–1449. URL: https://aclanthology.org/2020.emnlp-main.112, doi:10.18653/v1/2020.emnlp-main.112.
- Cheng et al. [2023] Cheng, P., Lin, L., Lyu, J., Huang, Y., Luo, W., Tang, X., 2023. Prior: Prototype representation joint learning from medical images and reports, in: ICCV, pp. 21361–21371. doi:10.1109/ICCV51070.2023.01953.
- Delbrouck et al. [2022] Delbrouck, J.B., Chambon, P., Bluethgen, C., Tsai, E., Almusa, O., Langlotz, C., 2022. Improving the factual correctness of radiology report generation with semantic rewards, in: EMNLP, Association for Computational Linguistics. pp. 4348–4360. URL: https://aclanthology.org/2022.findings-emnlp.319, doi:10.18653/v1/2022.findings-emnlp.319.
- Demner-Fushman et al. [2016] Demner-Fushman, D., Kohli, M.D., Rosenman, M.B., Shooshan, S.E., Rodriguez, L., Antani, S., Thoma, G.R., McDonald, C.J., 2016. Preparing a collection of radiology examinations for distribution and retrieval. Journal of the American Medical Informatics Association 23, 304–310. doi:10.1093/jamia/ocv080.
- Devlin et al. [2019] Devlin, J., Chang, M.W., Lee, K., Toutanova, K., 2019. Bert: Pre-training of deep bidirectional transformers for language understanding, in: NAACL, Association for Computational Linguistics. pp. 4171–4186. URL: https://aclanthology.org/N19-1423, doi:10.18653/v1/N19-1423.
- Gao et al. [2024] Gao, D., Kong, M., Zhao, Y., Huang, J., Huang, Z., Kuang, K., Wu, F., Zhu, Q., 2024. Simulating doctors’ thinking logic for chest x-ray report generation via transformer-based semantic query learning. Medical Image Analysis 91, 102982. URL: https://www.sciencedirect.com/science/article/pii/S1361841523002426, doi:https://doi.org/10.1016/j.media.2023.102982.
- He et al. [2016] He, K., Zhang, X., Ren, S., Sun, J., 2016. Deep residual learning for image recognition, in: CVPR, pp. 770–778. URL: https://doi.org/10.1109/CVPR.2016.90, doi:10.1109/CVPR.2016.90.
- Huang et al. [2023] Huang, Z., Zhang, X., Zhang, S., 2023. Kiut: Knowledge-injected u-transformer for radiology report generation, in: CVPR, pp. 19809–19818. doi:10.1109/CVPR52729.2023.01897.
- Irvin et al. [2019] Irvin, J., Rajpurkar, P., Ko, M., Yu, Y., Ciurea-Ilcus, S., Chute, C., Marklund, H., Haghgoo, B., Ball, R., Shpanskaya, K., Seekins, J., Mong, D.A., Halabi, S.S., Sandberg, J.K., Jones, R., Larson, D.B., Langlotz, C.P., Patel, B.N., Lungren, M.P., Ng, A.Y., 2019. Chexpert: a large chest radiograph dataset with uncertainty labels and expert comparison, in: AAAI, AAAI Press. p. Article 73. URL: https://doi.org/10.1609/aaai.v33i01.3301590, doi:10.1609/aaai.v33i01.3301590.
- Jain et al. [2021] Jain, S., Agrawal, A., Saporta, A., Truong, S., Duong, D.N.D.N., Bui, T., Chambon, P., Zhang, Y., Lungren, M., Ng, A., Langlotz, C., Rajpurkar, P., Rajpurkar, P., 2021. Radgraph: Extracting clinical entities and relations from radiology reports, in: Vanschoren, J., Yeung, S. (Eds.), NeurIPS. URL: https://datasets-benchmarks-proceedings.neurips.cc/paper_files/paper/2021/file/c8ffe9a587b126f152ed3d89a146b445-Paper-round1.pdf.
- Johnson et al. [2019a] Johnson, A.E., Pollard, T.J., Greenbaum, N.R., Lungren, M.P., Deng, C.y., Peng, Y., Lu, Z., Mark, R.G., Berkowitz, S.J., Horng, S., 2019a. Mimic-cxr-jpg, a large publicly available database of labeled chest radiographs. arXiv preprint arXiv:1901.07042 .
- Johnson et al. [2019b] Johnson, J., Douze, M., Jégou, H., 2019b. Billion-scale similarity search with gpus. IEEE Transactions on Big Data 7, 535–547. doi:10.1109/TBDATA.2019.2921572.
- Li et al. [2021] Li, J., Selvaraju, R., Gotmare, A., Joty, S., Xiong, C., Hoi, S.C.H., 2021. Align before fuse: Vision and language representation learning with momentum distillation, in: Ranzato, M., Beygelzimer, A., Dauphin, Y., Liang, P., Vaughan, J.W. (Eds.), NeurIPS, Curran Associates, Inc.. pp. 9694–9705. URL: https://proceedings.neurips.cc/paper_files/paper/2021/file/505259756244493872b7709a8a01b536-Paper.pdf.
- Li et al. [2023] Li, M., Lin, B., Chen, Z., Lin, H., Liang, X., Chang, X., 2023. Dynamic graph enhanced contrastive learning for chest x-ray report generation, in: CVPR, pp. 3334–3343. doi:10.1109/CVPR52729.2023.00325.
- Lin et al. [2023] Lin, B., Chen, Z., Li, M., Lin, H., Xu, H., Zhu, Y., Liu, J.z., Cai, W., Yang, L., Zhao, S., Wu, C., Chen, L., Chang, X., Yang, Y., Xing, L., Liang, X., 2023. Towards medical artificial general intelligence via knowledge-enhanced multimodal pretraining. ArXiv abs/2304.14204.
- Lu et al. [2023] Lu, Y., Hong, S., Shah, Y., Xu, P., 2023. Effectively fine-tune to improve large multimodal models for radiology report generation, in: NeurIPSW. URL: https://openreview.net/forum?id=QAruOR4nUa.
- Najdenkoska et al. [2022] Najdenkoska, I., Zhen, X., Worring, M., Shao, L., 2022. Uncertainty-aware report generation for chest x-rays by variational topic inference. Medical Image Analysis 82, 102603. URL: https://www.sciencedirect.com/science/article/pii/S1361841522002341, doi:https://doi.org/10.1016/j.media.2022.102603.
- Nicolson et al. [2023] Nicolson, A., Dowling, J., Koopman, B., 2023. Improving chest x-ray report generation by leveraging warm starting. Artificial Intelligence in Medicine 144, 102633. URL: https://www.sciencedirect.com/science/article/pii/S0933365723001471, doi:https://doi.org/10.1016/j.artmed.2023.102633.
- Oord et al. [2018] Oord, A.v.d., Li, Y., Vinyals, O., 2018. Representation learning with contrastive predictive coding. ArXiv abs/1807.03748.
- Park et al. [2024] Park, S., Lee, E.S., Shin, K.S., Lee, J.E., Ye, J.C., 2024. Self-supervised multi-modal training from uncurated images and reports enables monitoring ai in radiology. Medical Image Analysis 91, 103021. URL: https://www.sciencedirect.com/science/article/pii/S1361841523002815, doi:https://doi.org/10.1016/j.media.2023.103021.
- Radford et al. [2021] Radford, A., Kim, J.W., Hallacy, C., Ramesh, A., Goh, G., Agarwal, S., Sastry, G., Askell, A., Mishkin, P., Clark, J., 2021. Learning transferable visual models from natural language supervision, in: ICML, PMLR. pp. 8748–8763. URL: http://proceedings.mlr.press/v139/radford21a.html.
- Sanh et al. [2019] Sanh, V., Debut, L., Chaumond, J., Wolf, T., 2019. Distilbert, a distilled version of bert: smaller, faster, cheaper and lighter. ArXiv abs/1910.01108.
- Smit et al. [2020] Smit, A., Jain, S., Rajpurkar, P., Pareek, A., Ng, A., Lungren, M., 2020. Combining automatic labelers and expert annotations for accurate radiology report labeling using BERT, in: Webber, B., Cohn, T., He, Y., Liu, Y. (Eds.), EMNLP, Association for Computational Linguistics. pp. 1500–1519. URL: https://aclanthology.org/2020.emnlp-main.117, doi:10.18653/v1/2020.emnlp-main.117.
- Song et al. [2022] Song, X., Zhang, X., Ji, J., Liu, Y., Wei, P., 2022. Cross-modal contrastive attention model for medical report generation, in: COLING, International Committee on Computational Linguistics. pp. 2388–2397. URL: https://aclanthology.org/2022.coling-1.210.
- Tanida et al. [2023] Tanida, T., Müller, P., Kaissis, G., Rueckert, D., 2023. Interactive and explainable region-guided radiology report generation, in: CVPR, pp. 7433–7442. doi:10.1109/CVPR52729.2023.00718.
- Wang et al. [2022a] Wang, F., Zhou, Y., Wang, S., Vardhanabhuti, V., Yu, L., 2022a. Multi-granularity cross-modal alignment for generalized medical visual representation learning, in: Koyejo, S., Mohamed, S., Agarwal, A., Belgrave, D., Cho, K., Oh, A. (Eds.), NeurIPS, pp. 33536–33549. URL: http://papers.nips.cc/paper_files/paper/2022/hash/d925bda407ada0df3190df323a212661-Abstract-Conference.html.
- Wang et al. [2022b] Wang, J., Bhalerao, A., He, Y., 2022b. Cross-modal prototype driven network for radiology report generation, in: Avidan, S., Brostow, G.J., Cissé, M., Farinella, G.M., Hassner, T. (Eds.), ECCV, Springer Nature Switzerland. pp. 563–579. URL: https://doi.org/10.1007/978-3-031-19833-5_33, doi:10.1007/978-3-031-19833-5\_33.
- Wang et al. [2023a] Wang, Y., Lin, Z., Dong, H., 2023a. Rethinking medical report generation: Disease revealing enhancement with knowledge graph, in: ICMLW. URL: https://openreview.net/forum?id=PkQjnInDkR.
- Wang et al. [2023b] Wang, Z., Liu, L., Wang, L., Zhou, L., 2023b. Metransformer: Radiology report generation by transformer with multiple learnable expert tokens, in: CVPR, pp. 11558–11567. doi:10.1109/CVPR52729.2023.01112.
- Wu et al. [2023] Wu, C., Zhang, X., Zhang, Y., Wang, Y., Xie, W., 2023. Medklip: Medical knowledge enhanced language-image pre-training. medRxiv URL: https://www.medrxiv.org/content/early/2023/01/11/2023.01.10.23284412, doi:10.1101/2023.01.10.23284412.
- Yan et al. [2023] Yan, B., Liu, R., Kuo, D.E., Adithan, S., Reis, E.P., Kwak, S., Venugopal, V.K., O’Connell, C., Saenz, A., Rajpurkar, P., Moor, M., 2023. Style-aware radiology report generation with radgraph and few-shot prompting, in: EMNLP, Association for Computational Linguistics, Singapore. pp. 14676–14688. URL: https://aclanthology.org/2023.findings-emnlp.977, doi:10.18653/v1/2023.findings-emnlp.977.
- Yang et al. [2023] Yang, S., Wu, X., Ge, S., Zheng, Z., Zhou, S.K., Xiao, L., 2023. Radiology report generation with a learned knowledge base and multi-modal alignment. Medical Image Analysis 86, 102798. URL: https://www.sciencedirect.com/science/article/pii/S1361841523000592, doi:https://doi.org/10.1016/j.media.2023.102798.
- Yang et al. [2022] Yang, S., Wu, X., Ge, S., Zhou, S.K., Xiao, L., 2022. Knowledge matters: Chest radiology report generation with general and specific knowledge. Medical Image Analysis 80, 102510. URL: https://www.sciencedirect.com/science/article/pii/S1361841522001578, doi:https://doi.org/10.1016/j.media.2022.102510.
- Yu et al. [2023] Yu, F., Endo, M., Krishnan, R., Pan, I., Tsai, A., Reis, E.P., Fonseca, E.K.U.N., Lee, H.M.H., Abad, Z.S.H., Ng, A.Y., Langlotz, C.P., Venugopal, V.K., Rajpurkar, P., 2023. Evaluating progress in automatic chest x-ray radiology report generation. Patterns 4, 100802. URL: https://doi.org/10.1016/j.patter.2023.100802, doi:10.1016/J.PATTER.2023.100802.
- Zhang et al. [2023] Zhang, X., Wu, C., Zhang, Y., Xie, W., Wang, Y., 2023. Knowledge-enhanced visual-language pre-training on chest radiology images. Nature Communications 14, 4542. URL: https://doi.org/10.1038/s41467-023-40260-7, doi:10.1038/s41467-023-40260-7.
- Zhang et al. [2020] Zhang, Y., Wang, X., Xu, Z., Yu, Q., Yuille, A.L., Xu, D., 2020. When radiology report generation meets knowledge graph, in: AAAI, AAAI Press. pp. 12910–12917. URL: https://doi.org/10.1609/aaai.v34i07.6989, doi:10.1609/AAAI.V34I07.6989.
- Zhang et al. [2017a] Zhang, Z., Chen, P., Sapkota, M., Yang, L., 2017a. Tandemnet: Distilling knowledge from medical images using diagnostic reports as optional semantic references, in: MICCAI, Springer-Verlag. p. 320–328. URL: https://doi.org/10.1007/978-3-319-66179-7_37, doi:10.1007/978-3-319-66179-7_37.
- Zhang et al. [2021] Zhang, Z., Chen, P., Shi, X., Yang, L., 2021. Text-guided neural network training for image recognition in natural scenes and medicine. IEEE Transactions on Pattern Analysis and Machine Intelligence 43, 1733–1745. doi:10.1109/TPAMI.2019.2955476.
- Zhang et al. [2017b] Zhang, Z., Xie, Y., Xing, F., McGough, M., Yang, L., 2017b. Mdnet: A semantically and visually interpretable medical image diagnosis network, in: CVPR, pp. 3549–3557. doi:10.1109/CVPR.2017.378.
Supplementary Material
Experiments on IU X-ray
Experimental Configurations. Owing to the absence of an official data partition for the IU X-ray dataset, conducting a fair comparison is challenging. Instead, the data partition of IU X-ray follows the scheme used in R2Gen [5] and R2GenCMN [4]. The training, validation, and test sets include 4,136 (2,068), 592 (296), and 1,180 (590) medical images (reports), respectively. Notably, F1,mic-14 CheXbert and F1,mic-5 CheXbert are calculated using f1chexbert. Given the limited data volume of IU X-ray, its report generation module is initialized with the pre-trained model on MIMIC-CXR described in section 3.3. We adopt the RAdam optimizer with a learning rate of 1e-4 for training 30 epochs.
Main Results. We evaluate the performance of models using both conventional natural language generation (NLG) metrics and clinical efficacy (CE) metrics. As RGRG [29] requires strong anatomical regions supervision, we compare our proposed method FSE against six state-of-the-art (SOTA) approaches: R2Gen [5], R2GenCMN [4], GSKET [37], CvT2DistillGPT2 [22], M2KT [36], and DCL [18]. Comparison results on IU X-ray are presented in Table A1. It is observed that when is set to 60 in the specific scenario, FSE-20 achieves a BLEU1 (BL1) of 0.504, showing improvements of 31.5% in F1, mic-5 CheXbert (CX5), and 6.4% in F1, mic-14 CheXbert (CX14) compared to optimal peer methods. In the general scenario (i.e., ), FSE-3 demonstrates improvements of 1.6% in BLEU2 (BL2), 0.7% in BLEU4 (BL4), 28.3% in CX5, and 6.4% in CX14, highlighting FSE’s excellence in NLG and CE metrics compared to previous state-of-the-art methods. While our performance slightly lags behind the R2GenCMN [4] in the F1 RadGraph (RG) metric, considerable improvements are observed in the CX5 and CX14 metrics. These advancements affirm that our generated reports can cover rich factual information while maintaining a smooth narrative. Notably, FSE-3 and FSE-20, in contrast to FSE-0, exhibit significant improvements in both NLG and CE metrics despite differing solely in terms of the number of similar historical cases. This emphasizes the advantageous role of similar historical cases in the report generation module. In addition, considering the limited data volume of the IU X-ray, injecting similar historical cases into the text decoder may provide additional information to compensate for the data scarcity. Thus, we can observe that FSE-20 demonstrates balanced performance in both NLG and CE metrics on the IU X-ray dataset.
| Method | NLG | CE | |||||||||
| BS | BL1 | BL2 | BL3 | BL4 | MTR | R-L | RG | CX5 | CX14 | ||
| R2Gen (EMNLP’20) | 60♮ | 0.866 | 0.470 | 0.304 | 0.219 | 0.165 | 0.187 | 0.371 | 0.351 | 0.000 | 0.533 |
| Cpl. | 0.864 | 0.465 | 0.302 | 0.216 | 0.162 | 0.201 | 0.364 | 0.349 | 0.000 | 0.531 | |
| R2GenCMN (ACL’21) | 60♮ | 0.868 | 0.475 | 0.309 | 0.222 | 0.170 | 0.191 | 0.375 | 0.384 | 0.052 | 0.543 |
| Cpl. | 0.867 | 0.471 | 0.306 | 0.219 | 0.166 | 0.206 | 0.373 | 0.382 | 0.052 | 0.537 | |
| GSKET (MedIA’22) | 60♮ | - | 0.496 | 0.327 | 0.238 | 0.178 | - | 0.381 | - | - | - |
| CvT2DistillGPT2 (ARTMED’23) | 60♮ | 0.868 | 0.473 | 0.304 | 0.224 | 0.175 | 0.200 | 0.376 | 0.351 | 0.005 | 0.543 |
| Cpl. | 0.866 | 0.334 | 0.203 | 0.140 | 0.098 | 0.161 | 0.269 | 0.350 | 0.005 | 0.430 | |
| M2KT (MedIA’23) | 60♮ | - | 0.497 | 0.319 | 0.230 | 0.174 | - | 0.399 | - | - | - |
| DCL (CVPR’23) | 90♮ | - | - | - | - | 0.163 | 0.193 | 0.383 | - | - | - |
| METransformer (CVPR’23) | -♮ | - | 0.483 | 0.322 | 0.228 | 0.172 | 0.192 | 0.380 | - | - | - |
| FSE-0 (ours) | 60 | 0.865 | 0.483 | 0.314 | 0.223 | 0.167 | 0.209 | 0.370 | 0.375 | 0.222 | 0.578 |
| 90 | 0.865 | 0.475 | 0.308 | 0.219 | 0.164 | 0.206 | 0.369 | 0.375 | 0.219 | 0.576 | |
| Cpl. | 0.863 | 0.466 | 0.303 | 0.215 | 0.161 | 0.202 | 0.366 | 0.372 | 0.218 | 0.575 | |
| FSE-3 (ours) | 60 | 0.869 | 0.495 | 0.322 | 0.231 | 0.173 | 0.218 | 0.378 | 0.375 | 0.340 | 0.604 |
| 90 | 0.869 | 0.498 | 0.324 | 0.232 | 0.174 | 0.216 | 0.378 | 0.375 | 0.337 | 0.602 | |
| Cpl. | 0.867 | 0.495 | 0.322 | 0.230 | 0.173 | 0.211 | 0.375 | 0.373 | 0.335 | 0.601 | |
| FSE-20 (ours) | 60 | 0.868 | 0.504 | 0.327 | 0.234 | 0.174 | 0.214 | 0.380 | 0.374 | 0.367 | 0.607 |
| 90 | 0.868 | 0.496 | 0.323 | 0.231 | 0.172 | 0.211 | 0.380 | 0.373 | 0.364 | 0.606 | |
| Cpl. | 0.867 | 0.487 | 0.317 | 0.227 | 0.168 | 0.206 | 0.377 | 0.371 | 0.362 | 0.604 | |