FunnelNet: An End-to-End Deep Learning Framework to Monitor Digital Heart Murmur in Real-Time
Abstract
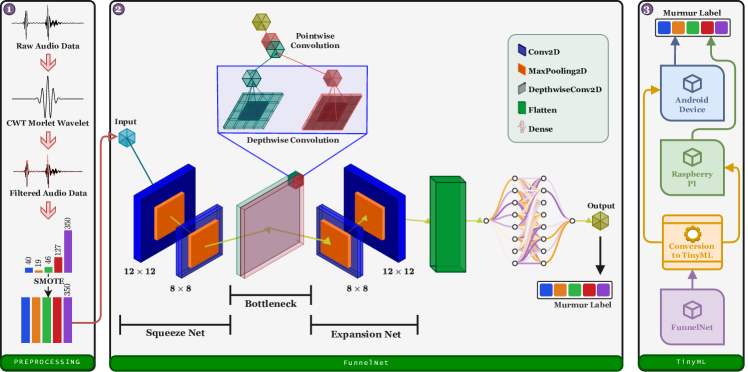
Objective: Heart murmurs are abnormal sounds caused by turbulent blood flow within the heart. Several diagnostic methods are available to detect heart murmurs and their severity, such as cardiac auscultation, echocardiography, phonocardiogram (PCG), etc. However, these methods have limitations, including extensive training and experience among healthcare providers, cost and accessibility of echocardiography, as well as noise interference and PCG data processing. This study aims to develop a novel end-to-end real-time heart murmur detection approach using traditional and depthwise separable convolutional networks. Methods: Continuous wavelet transform (CWT) was applied to extract meaningful features from the PCG data. The proposed network has three parts: the Squeeze net, the Bottleneck, and the Expansion net. The Squeeze net generates a compressed data representation, whereas the Bottleneck layer reduces computational complexity using a depthwise-separable convolutional network. The Expansion net is responsible for up-sampling the compressed data to a higher dimension, capturing tiny details of the representative data. Results: For evaluation, we used four publicly available datasets and achieved state-of-the-art performance in all datasets. Furthermore, we tested our proposed network on two resource-constrained devices: a Raspberry PI and an Android device, stripping it down into a tiny machine learning model (TinyML), achieving a maximum of 99.70%. Conclusion: The proposed model offers a deep learning framework for real-time accurate heart murmur detection within limited resources. Significance: It will significantly result in more accessible and practical medical services and reduced diagnosis time to assist medical professionals. The code is publicly available at TBA.
Index Terms:
heart murmur, wavelet transform, end-to-end model, tinyml.I Introduction
The cardiac cycle is the sequence of pressure changes within the heart, which leads to blood movement in different heart chambers and throughout the body [1]. Among other states, four leading states of interest are systole and diastole, S1 and S2 (Supplementary Figure 1). Here, systole is muscle contraction, diastole is the relaxation phase, and S1 and S2 are the first and second heart sounds. A heart murmur is an abnormal sound heard during the cardiac cycle, typically due to turbulent blood flow within the heart. Heart murmurs can be mild or severe, indicating underlying heart disease. Among several traditional techniques, cardiac auscultation, which involves listening to the heart with a stethoscope, is still a cost-effective screening method and provides valuable information about the mechanical activities of the heart [2]. However, auscultation is a difficult skill to master, which requires extensive training accompanied by continuous clinical experience [3]. Echocardiography is another diagnostic tool to visualize the heart structures and assess abnormalities associated with a murmur. It is particularly important for patients with systolic murmurs of unknown causes suspected of having significant heart disease [4]. It also takes considerable time to conduct diagnostic procedures and is not easily accessible [5]. Furthermore, traditional methods provide limited quantitative measurements of heart murmurs, which can lead to misdiagnosed cases. In general, reliance on manual auscultation can be time-consuming, which may not always be feasible in a busy clinical setting, highlighting the need for more efficient and standardized approaches to cardiac evaluation [6].
Computational methods, including machine learning algorithms, are becoming promising tools offering more consistent results, reducing the dependence on human interpretation. The limitations of conventional approaches for detecting heart murmurs can also be overcome by automated analysis of heart sound recordings utilizing deep learning frameworks, offering a more standardized and accessible means [7]. However, some of these approaches are resource-intensive and require special hardware requirements. Therefore, a lightweight machine learning algorithm would be a more efficient and practical solution. In particular, they can provide a scalable solution to assessing medical conditions in remote health monitoring applications by simplifying computational complexity while maintaining high performance.
The primary contributions of the paper are as follows:
-
•
We proposed an end-to-end approach to heart murmur detection using a convolutional neural network model.
-
•
Our approach achieved state-of-the-art sensitivity, specificity, and accuracy on several datasets.
-
•
We also demonstrated our model’s real-time detection capability using two resource-constrained devices.
-
•
The lightweight version of our model also outperforms similar-sized models.
II Related Work
II-A Heart Murmur Detection
The detection of heart murmurs using machine learning has gained significant attention in recent years due to its potential to improve the diagnosis of cardiovascular diseases. Researchers have explored different approaches to classify heart sounds and detect abnormalities accurately. [8] proposed a hybrid adaptive neuro-fuzzy inference system (ANFIS) and an artificial bee colony approach for classifying heartbeat sounds. This study used Mel frequency cepstral coefficients feature extraction methods to detect and classify abnormal heart sounds. However, ANFIS generates complex models and is computationally expensive even for simpler problems [9]. Similarly, [10] proposed a Recurrent Neural Network model for classifying heartbeat sound signals. In this paper, they used down-sampling techniques to extract discriminant features and reduced the dimension of the frame for lower computational power. However, they had to sacrifice the model performance, yielding a maximum accuracy of 80.8%. Moreover, [11] developed CardioXNet, a streamlined deep learning model for categorizing cardiovascular disorders using heart sound data. This study showed the importance of S1 and S2 sounds and irregular variants such as S3, S4, and murmurs in pathological inference. Although they achieved satisfactory results in accuracy compared to other state-of-the-art models, they still lack performance robustness and lower resource consumption. Furthermore, [12] proposed a 1-D Convolutional Neural Network (CNN) with low parameter consumption for heart sound classification, demonstrating the effectiveness of the memory-efficient models. Nevertheless, they lack automatic environmental noise suppression techniques, making them less reliable. [13] introduced a novel heart sound classification network based on convolution and transformer, while [14] automated the detection of heart valve diseases using a multiclass composite classifier with PCG signals. Furthermore, [15] analyzed the MelSpectrum and Log-MelSpectrum characteristics of heart sound signals, demonstrating the importance of feature selection in improving classification accuracy. In summary, researchers have used different machine learning models, including deep learning architectures, CNNs, and ensemble methods, to detect heart murmurs effectively. However, none of them could maintain good performance and low memory consumption, providing a real-time and robust solution. Table I represents an overview of the existing literature with their signal properties and methodologies.
| Reference | Dataset | Extracted Features | Segmentation | Filters |
|---|---|---|---|---|
| [16] | CinC | None | 2s | |
| [13] | CinC, PASCAL, [17] | None | 2.5s | |
| [18] | Proprietary | Log MFSC | Dynamic | None |
| [19] | CinC, PASCAL, [20] | MFCC | 2s | |
| [11] | CinC, [17] | None | 1.125s | None |
| [21] | CinC | None | 6s | |
| [22] | CinC | MFCC (CNN2D) | Not mentioned | |
| [23] | Proprietary | CWT | 1.6s | |
| [24] | CinC | DWT, Mel-scaled PSD and MFCC | Not mentioned | [LP] and [HP] |
| [14] | [17] | Chirplet transform (CT) | Not mentioned | |
| FunnelCNN (ours) | CinC, PASCAL, CirCor, Synthetic | Morlet-CWT | 5s |
II-B Tiny Machine Learning (TinyML)
TinyML is an emerging field that develops machine learning algorithms that can run on resource-constrained devices such as Internet of Things (IoT) units, edge devices, and embedded systems. In recent years, there has been a growing interest in applying TinyML technology in the healthcare sector, with applications ranging from ECG monitoring to posture detection to wearable healthcare [25, 26, 27]. [25] presents a study on TinyML-based classification in an embedded ECG monitoring system. Their work showcases the application of CNNs in efficiently processing ECG data. Furthermore, [26] introduces a posture guardian system that uses TinyML for smart muscle strain detection and correction. This application demonstrates how TinyML can assess and categorize real-time data, providing immediate feedback and corrective measures. Such innovations promise to improve patient outcomes and prevent musculoskeletal injuries through proactive monitoring and intervention. Furthermore, [28] advocates adopting TinyML in healthcare by proposing CNNs to estimate blood pressure on the real-time edge. Highlights the feasibility of using TinyML for critical healthcare tasks without compromising data privacy or security. In addition, [27] discusses the more comprehensive scope of machine learning applications in healthcare wearable devices, highlighting the importance of exploring TinyML-embedded solutions and optimization techniques in the IoT ecosystem. Regarding heart sound detection, lightweight end-to-end neural network models have been designed specifically for automatic heart sound classification, demonstrating the feasibility of using such models in edge devices [29]. Overall, applying TinyML in the medical domain represents a significant advance in healthcare technology, such as real-time monitoring, personalized care, and improved diagnostic accuracy.
III Methods
III-A Wavelet Transformation
III-A1 Morlet Wavelet
A wavelet is a mathematical function that provides a localized representation of signals in both time and frequency domains confined in a finite interval within a specific domain of interest (Supplementary Section 1.1). Among many other mother wavelets , the Morlet wavelet is a complex-valued function that exhibits a Gaussian envelope modulated by a sinusoidal oscillation, shown as follows:
| (1) |
Like the wavelet function, is a normalization factor that ensures that the energy distribution among the axes is conserved. In addition, we have two other main components in the wavelet function: a Gaussian window and a complex sine function where . Here, is the imaginary operator making the sine wave complex, is the frequency in Hertz, and is the time in seconds. The is the standard deviation that controls the width of the Gaussian envelope, and is the number of cycles [30]. The Morlet wavelet is an ideal mother wavelet for applications such as heart sound because it is well suited for the oscillatory components of such signals [31].
III-A2 Continuous Wavelet Transform
Continuous Wavelet Transform (CWT) [32] is a decomposition technique that works for stationary and non-stationary signals that can represent an analog signal based on two varying parameters: the time shift parameter and the scale parameter .
| (2) |
Compared to the conventional short-time Fourier transform, which uses the same window length, CWT uses short and long windows at high and low frequencies, respectively. This helps to obtain a better resolution from the CWT decomposition compared to the other [33]. In addition, the Morlet wavelet, in conjunction with CWT, provides the most accurate instantaneous frequencies for the time-frequency distribution signals compared to other mother wavelet-based CWT [33]. In heart sound applications, most frequencies range from 20–600 Hz [34], making CWT an effective tool for decomposing low-frequency signals like heart sound, offering a dynamic window length.
III-B Outlier Removal
In the audio dataset, particularly for heart sounds, most of the sample data of all classes belong to a particular frequency, and only a few have large spikes, usually unwanted noises. So, we provided a conditional equation to remove those spikes or outliers based on their distribution in the time domain.
Let be the sequence of audio data points represented by and be the mean of the sequence of audio data points.
Also, is the standard deviation of the audio data points:
| (3) | ||||
Here, is the conditional limit for the original data point , and is the multiplicative factor known as patience, which determines the strictness of the acceptance rate of the input amplitudes. In our experiment, we used as the patience value to determine an input as an outlier. If crosses the limit in amplitude compared to , then is cut to a maximum value of , producing the outlier-free signal as shown in (see Supplementary Figure 2 for details).
III-C Noise Removal
Although most spikes are omitted after removing the outliers, the remaining signals still have significant magnitudes. This might explain the increased computational power requirement, which is crucial in resource-constrained devices running on a limited energy source. As discussed earlier, heart sounds usually have a very low and specific frequency range; our paper selected a Butterworth band-pass filter to allow only those particular frequencies. Using a Butterworth filter in the signal-processing domain effectively isolates the relevant frequency components associated with the input signals while suppressing unwanted noise and artifacts. It balances filtering efficiency and frequency response characteristics well for isolating phase-sensitive signals from audio data.
A Butterworth band-pass filter is a signal-processing filter allowing certain ranges of frequencies while attenuating frequencies outside this range. The Butterworth filter is characterized by a maximally flat frequency response in the pass band and a gradual roll-off in the stop band. This filter is known to be advantageous for its simplicity, stability, and smooth frequency response. Although a higher-order filter does a better job of filtering the desired frequencies [35], a larger number could also be a reason for information loss [36], especially in the small frequency range. Therefore, in our paper, we have used a second-order Butterworth filter with a high cut of Hz and a low cut of Hz to capture all kinds of information from the signal. The transfer function of a second-order Butterworth band-pass filter can be expressed as [37]:
| (4) |
Here, is the gain, is the normalized cutoff frequency, is the damping ratio, and is the complex frequency variable.
As we can see from Supplementary Figure 3, most of their amplitude varied between before passing the signals through the Butterworth filter. As soon as it passed through the filter, most frequencies were reduced to a range of . In addition, it is noticeable from Supplementary Figure 4 that the data was scattered more sparsely before being filtered with a Butterworth filter. After applying the filter, most of the noise from the data was filtered out, and now they are located closer to each other.
III-D Data Oversampling
It is often found that the data are quite imbalanced and heavily biased towards a particular class in a dataset. This scenario usually overfits a network and carries weight toward a particular class, which is undesirable. Two main options to overcome this issue are to down-sample or over-sample our data. If the number of samples in the rest of the classes is negligible, the network will not have enough data to learn from if we down-sample the data. Hence, it is better to choose the oversampling technique to create synthetic data that mimics the original ones, creating an equal number of samples for each class. The Synthetic Minority Oversampling Technique (SMOTE) [38] is a popular method to address this problem for unbalanced datasets. This method produces synthetic instances for the underrepresented class to equalize the distribution of classes. SMOTE creates new synthetic instances by interpolating between existing minority-class instances. The algorithm selects a minority class instance and then finds its k nearest neighbors in the feature space depending on the oversampling requirement. A new instance is then generated by randomly selecting one of these neighbors and creating a synthetic example along the line connecting the selected neighbor and the original minority class instance. The class distributions of the four datasets are illustrated in Supplementary Figure 5.
III-E Model Architecture
Our proposed FunnelCNN network, as shown in Figure 1, was designed to prioritize lightweights while delivering competitive results compared to other state-of-the-art models. The name ‘FunnelCNN’ derives from its architectural shape, which resembles two funnels facing each other and connected. The network’s layers can be divided into conventional CNN, depthwise and pointwise convolutional layers, and fully connected (FC) layers. These can then be summarized into three parts: the Squeeze net, the Bottleneck, and the Expansion net. We got the motivation behind this configuration from the UNet [39] architecture, which is known for its superior performance in the case of medical imaging and other domains in general. However, we reduced the total number of layers and their order to maintain the lightweight. We replaced the bottleneck with layers of CNNs, depthwise and pointwise, motivated by the MobileNet architecture [40], which is known to be very fast and efficient in computational complexity.
III-E1 Squeeze Net
The squeeze phase of the network works like an encoder and consists of two CNN layers with filter sizes of 16 and 8, respectively. In both layers, a kernel size of is used. The activation function utilized in these layers is ‘tanh’ due to its output range, which suits our signal data containing values of the same range. This Squeeze net aims to extract the most relevant information while discarding redundant ones. It compresses the input into a latent space representation that contains the most critical features. This reduction in spatial dimensions helps capture high-level abstract representations of the input data.
III-E2 Bottleneck
Following the squeezing phase, we employ a depthwise separable CNN known for its computational efficiency compared to traditional approaches. This involves two main components: a depthwise convolution that uses filters with a depth of 1 for each input channel and a pointwise convolution with filters to consolidate information. Like the squeeze net, we have a kernel size of with an activation function of ‘tanh. Compared with conventional CNN, it significantly reduces parameter count, mitigating overfitting and resulting in smaller model sizes, which is desirable for TinyML models.
III-E3 Expansion Net
The subsequent expanding phase, which works like a decoder, mirrors the squeezing phase but in reverse order, utilizing conventional layers with the same filter and kernel sizes. As a decoder network, the expansion net aims to reconstruct the original input from the compressed representation generated by the encoder or the squeeze net. This way, it tries to recover the spatial details to produce meaningful outputs.
After each convolutional layer, including the depthwise separable convolution layer, we apply a maximum pooling layer with a pool size . This is succeeded by a Flatten layer to linearly represent the data, followed by an FC layer with a depth of 8 and using the ReLU activation function. Finally, we incorporate an FC layer with a depth corresponding to the total number of classes in the dataset. Depending on the dataset, the activation function of the last layer varies: Sigmoid is used when there are two classes, while Softmax is used for datasets with more than two classes. Finally, algorithm 1 explains the workflow of our proposed solution for the automated heart murmur prediction mechanism.
The original model was converted into a TensorFlow Lite model that further reduces the computational load to test the model on resource-constrained devices. During conversion, the sample data was cast to 32-bit floating point numbers. A representative dataset compatible with the Lite model was built using these samples with batch size 1. The model itself was built with the default post-training quantization option. To validate our network’s capability, we deployed our TFLite model on a Raspberry Pi 3B+ and Andriod OS 12 device powered by Exynos 9611 and evaluated its performance in real-time. We then randomly selected 50 samples from the sample data to assess their accuracy.
| Dataset | Reference | Classifier | Sensitivity (%) | Specificity (%) | Accuracy (%) |
| CinC | [16] | HSPFN | 94.41 | 96.98 | 95.50 |
| HSSFN | 93.56 | 97.63 | 95.00 | ||
| [13] | CTENN | 92.87 | 97.45 | 96.40 | |
| [11] | CardioXNet | 91.78 1.99 | – | 86.57 2.31 | |
| [21] | FFNN | 87 | 85 | 86 | |
| 1D-CNN | 58 | 93 | 75 | ||
| [22] | 1D-CNN | 87.57 | 85.84 | 87.23 | |
| 2DCNN | 86.08 | 91.55 | 87.18 | ||
| ECNN | 89.94 | 86.35 | 89.22 | ||
| [24] | DNN | 99.26 | 94.86 | 97.10 | |
| Ours | FunnelCNN | 99.55 | 98.91 | 98.20 | |
| CinC1 | [19] | ResNet | 92.32 | 95.47 | 94.43 |
| CirCor | [41] | 1DCNN | 88.02 | – | 87.66 |
| [42] | BEAT | 82.38 | – | 94.02 | |
| Ours | FunnelCNN | 98.90 | 99.08 | 96.51 | |
| Pascal | [13] | CTENN | 91.30 | 97.20 | 95.70 |
| Ours | FunnelCNN | 80.10 | 95.74 | 97.71 | |
| Pascal1 | [19] | ResNet | 92.32 | 95.47 | 94.43 |
| Synthetic | Ours | FunnelCNN | 95.21 | 96.77 | 99.70 |
-
1
These datasets imply that they have been merged with other dataset(s) and then fed into the model to train, validate, or test. Hence, the metrics result from combining the mentioned dataset with one or more other datasets.
IV Experiments
IV-A Dataset
IV-A1 PhysioNet/CinC Challenge 2016 Dataset
PhysioNet/CinC Challenge 2016 [43] is a very popular dataset of heart sound recordings. Data were collected from various clinical and nonclinical environments containing healthy and pathological patients. It includes 3126 recordings that last 5 to 120 seconds. We use this dataset to train, validate, and test a binary classifier with classes labeled ‘normal’ and ‘murmur. The ‘normal’ sounds were recorded from the healthy patients, and ‘murmur’ sounds were recorded from patients with a confirmed cardiac diagnosis who were primarily diagnosed with heart valve defects and coronary artery disease. The sample data were provided in the format .wav and resampled at 2000 kHz, containing data from the PCG lead. This dataset is particularly interesting, as it includes external noises, which pose a challenge to denoising it before drawing any conclusion on the class of the recordings. We have used this dataset as a benchmark for our classifier, and a significant amount of literature has already performed classification tasks on it, thus providing a reference to compare. For convenience, we refer to ‘CinC’ as the alias of this dataset throughout the paper.
IV-A2 CirCor DigiScope Phonocardiogram Dataset
CirCor DigiScope Phonocardiogram [2] is a large publicly accessible pediatric heart sound dataset with 5272 recordings. This dataset contains data from 1,568 patients that span an age range of 0 to 21 years. There are a total of 33.5 hours of recordings, where the duration of the individual recordings ranges from 4.8 to 80.4 seconds. The dataset contains three classes: ‘normal,’ ‘murmur,’ and ‘unknown.’ The ‘unknown’ class was unidentifiable by the annotator as they did not meet the required signal quality standards. Like the CinC dataset, this dataset also contains external noises posing similar challenges. We chose this dataset to check the architectural uniformity of our model. For convenience, we refer to ‘CirCor’ as the alias of this dataset throughout the paper.
IV-A3 Pascal Challenge Dataset
In the Pascal Challenge dataset [44], two main repositories provided the data used in this paper. Recordings from the general population collected using the iStethoscope Pro iPhone app are included in Dataset A. These recordings fall into four classes: ‘artifact,’ ‘extrahs’ (additional heart sound), ‘murmur,’ and ‘normal.’ Dataset A comprises the following recordings: 31 normal, 34 murmurs, 19 additional cardiac sounds, 40 artifacts, and 52 unlabeled test recordings. Moreover, Dataset B consists of recordings from a clinical trial carried out in hospitals with the DigiScope digital stethoscope. Three classes included in this dataset are: ‘extrasystole,’ ‘murmur,’ and ‘normal.’ 320 normal recordings, 95 murmur recordings, 46 extrasystole recordings, and 195 unlabeled test recordings are included in Dataset B. We will refer to ‘Pascal’ as the alias of this dataset throughout the paper.
IV-A4 Synthetic Heart Sound Dataset
Synthetic Heart Sound Dataset [45] is a synthetically generated dataset with clean heart sounds mixed with various noises and degradations. The dataset contains 3360 recordings with 1680 normal and 1680 murmur samples. Among 3360 recordings, half of them were real sounds, and half of them were synthetically generated. The abnormal heart sounds include common murmurs, and additional heart sounds. Noises and degradations include color, movement, internal, and ambient noises with different durations and SNR levels, with 21 types of noise. We will refer to this dataset as ‘Synthetic’ throughout the paper.
IV-B Results and Discussion
IV-B1 Performance Comparison with Conventional Models
We evaluated the performance of our model on four publicly available datasets mentioned in section IV-A. We used sensitivity, specificity, and accuracy as performance comparison metrics to compare with existing models. Using the 10-folds cross-validation (Supplementary Section 1.2) method, we trained and validated the audio data 10 times in a cyclic manner, and the results were calculated.
In the CinC dataset, our network achieved the highest sensitivity, specificity, and accuracy of 99.55%, 98.91%, and 98.20%, respectively, surpassing the accuracy of the closest competitor of 97.10% [24] by 1.1%. Moreover, the sensitivity and specificity improvements were also higher (0.29% [24] and 1.28% [16], respectively) compared to other models. For the CirCor dataset, we obtained a sensitivity of 98.90%, a specificity of 99.08%, and an accuracy of 96.51%. In contrast, [41] applied a 1D-CNN model to the CirCor datasets, achieving a maximum accuracy of 87.66% and a sensitivity score of 88.02%. In addition, [42] tested several architectures in which the BEATs model gained an excellent accuracy of 94.02% compared to their other tested models. However, compared to these studies, our proposed network achieved an improvement of 8.85% and 2.49% compared to [41] and [42], respectively. The Pascal dataset revealed a more low-performance scenario. Although our model achieved a remarkable accuracy of 97.71%, it achieved 80.10% sensitivity and 95.74% specificity. Hence, it failed to achieve maximum sensitivity and specificity compared to the best-performing models in these metrics. In contrast, our performance on the synthetic dataset was consistent in sensitivity, specificity, and accuracy of 95.21%, 96.77%, and 99.70%, respectively.
From Table II, it is evident that in all datasets, our model achieved maximum scores of 99.55%, 99.08%, and 99.70% in sensitivity, specificity, and accuracy, respectively. Notably, our model performed poorly on the Pascal dataset regarding sensitivity and specificity. Figure 2 depicts our model’s training and validation performance across the four datasets.

IV-B2 Real-time Inference on Edge Device
| Dataset | Ref | #Param | Mean Acc. (%) | Max Acc. (%) |
|---|---|---|---|---|
| CinC | Proposed work | 4145 | 87.72 | 93.58 |
| 5453 | 88.02 | 94.86 | ||
| [29] | 4290 | 87.15 |
To demonstrate the lightweight nature of our model, we tested it on two different platforms: a Raspberry Pi 3B+ and an Android device.
Table III compares two variants of our model with one of the lightest models from our findings. [29] constructed a predictor using only 4290 parameters with CNN layers. They achieved a mean accuracy of 85% and a maximum accuracy of 87.15% using frequency domain features extracted from the short-time Fourier transform. In our case, we built two variants of our model with 5453 and 4145 parameters. For the variant with 5453 parameters, we achieved a mean accuracy of 88.02% and a maximum accuracy of 94.86%. For the variant with 4145 parameters, we achieved a mean accuracy of 87.72% and a maximum accuracy of 93.58%. We achieved higher mean and maximum accuracies in both variants compared to one of the lightest models available.
| #Param | Dataset | Accuracy | TPIS111Time per inference step (ms) | Model Size | FLOPS222Floating point operations per second |
|---|---|---|---|---|---|
| 4145 | CinC | 93.21 | 81 | 13 kB | 8.6 M |
| CirCor | 94.50 | 78 | |||
| Pascal | 94.11 | 89 | |||
| Synthetic | 95.41 | 91 | |||
| 5453 | CinC | 94.40 | 99 | 14 kB | 11.4 M |
| CirCor | 93.87 | 79 | |||
| Pascal | 95.41 | 92 | |||
| Synthetic | 95.87 | 93 |
On the other hand, as evident from Table IV, in all cases, the model with 5453 parameters achieved better accuracy with fewer resources compared to the variant with 4145 parameters. However, the inference time and the number of FLOPS have been significantly reduced for the model with 4145 parameters, which signifies the practicality of smaller models. This also indicates that our proposed model can replace the traditional computer as an in-drop replacement.
V Conclusion
In conclusion, our research on ML-based heart murmur detection has demonstrated significant advances in the biomedical field. We applied the Morlet CWT wavelet on audio data and then passed the signal to a Butterworth filter to eliminate the noises. Our proposed FunnelNet utilized traditional and depthwise separable CNN, demonstrating state-of-the-art performances on several datasets. We also developed a lightweight, low-parameter model that surpasses the performance of traditional and TinyML models. Through rigorous testing, our model consistently achieved a maximum accuracy of 98.20% and 94.86% on the regular model and the TinyML version, respectively, showcasing its robustness and reliability across different platforms. In addition, the real-time evaluation of our model on an Android device yielded satisfactory results, indicating its potential for practical application in healthcare settings. However, despite achieving remarkable accuracy and outperforming almost every state-of-the-art model, we still believe there is room for improvement. Firstly, expanding the dataset used to train and test the model could enhance its generalization capabilities and robustness. Incorporating a more diverse range of heart murmur recordings from various sources and populations could help improve the model’s performance in real-world scenarios. Furthermore, exploring advanced signal-processing techniques beyond the Morlet CWT wavelet and Butterworth filter could potentially further enhance the model’s accuracy and efficiency.
References
- [1] Joshua D. Pollock and Amgad N. Makaryus “Physiology, Cardiac Cycle” In StatPearls Treasure Island (FL): StatPearls Publishing, 2024
- [2] Jorge Oliveira et al. “The CirCor DigiScope Dataset: From Murmur Detection to Murmur Classification” In IEEE Journal of Biomedical and Health Informatics 26.6, 2022, pp. 2524–2535 DOI: 10.1109/JBHI.2021.3137048
- [3] Gregory B. Lim “AI used to detect cardiac murmurs” In Nature Reviews Cardiology 18.7, 2021, pp. 460–460 DOI: 10.1038/s41569-021-00567-8
- [4] Christine H Attenhofer Jost et al. “Echocardiography in the evaluation of systolic murmurs of unknown cause” In The American Journal of Medicine 108.8, 2000, pp. 614–620 DOI: 10.1016/S0002-9343(00)00361-2
- [5] Jane Draper, Sheila Subbiah, Rikki Bailey and John B. Chambers “Murmur clinic: validation of a new model for detecting heart valve disease” In Heart 105.1, 2019, pp. 56–59 DOI: 10.1136/heartjnl-2018-313393
- [6] Matthew A. Reyna et al. “Heart murmur detection from phonocardiogram recordings: The George B. Moody PhysioNet Challenge 2022”, 2022 DOI: 10.1101/2022.08.11.22278688
- [7] John S. Chorba et al. “Deep Learning Algorithm for Automated Cardiac Murmur Detection via a Digital Stethoscope Platform” In Journal of the American Heart Association 10.9, 2021, pp. e019905 DOI: 10.1161/JAHA.120.019905
- [8] Pantea Keikhosrokiani et al. “Heartbeat sound classification using a hybrid adaptive neuro-fuzzy inferences system (ANFIS) and artificial bee colony” In DIGITAL HEALTH 9, 2023, pp. 205520762211507 DOI: 10.1177/20552076221150741
- [9] A. Senthilselvi, J. Duela, R. Prabavathi and Dioline Sara “Performance evaluation of adaptive neuro fuzzy system (ANFIS) over fuzzy inference system (FIS) with optimization algorithm in de-noising of images from salt and pepper noise” In Journal of Ambient Intelligence and Humanized Computing, 2021 DOI: 10.1007/s12652-021-03024-z
- [10] Ali Raza et al. “Heartbeat Sound Signal Classification Using Deep Learning” In Sensors 19.21, 2019, pp. 4819 DOI: 10.3390/s19214819
- [11] Samiul Based Shuvo et al. “CardioXNet: A Novel Lightweight Deep Learning Framework for Cardiovascular Disease Classification Using Heart Sound Recordings” In IEEE Access 9, 2021, pp. 36955–36967 DOI: 10.1109/ACCESS.2021.3063129
- [12] Bin Xiao et al. “Heart sounds classification using a novel 1-D convolutional neural network with extremely low parameter consumption” In Neurocomputing 392, 2020, pp. 153–159 DOI: 10.1016/j.neucom.2018.09.101
- [13] Jiawen Cheng and Kexue Sun “Heart Sound Classification Network Based on Convolution and Transformer” In Sensors 23.19, 2023, pp. 8168 DOI: 10.3390/s23198168
- [14] Samit Kumar Ghosh, R.. Ponnalagu, R.. Tripathy and U. Acharya “Automated detection of heart valve diseases using chirplet transform and multiclass composite classifier with PCG signals” In Computers in Biology and Medicine 118, 2020, pp. 103632 DOI: 10.1016/j.compbiomed.2020.103632
- [15] Wei Chen et al. “Classifying Heart-Sound Signals Based on CNN Trained on MelSpectrum and Log-MelSpectrum Features” In Bioengineering 10.6, 2023, pp. 645 DOI: 10.3390/bioengineering10060645
- [16] Suyi Li, Feng Li, Shijie Tang and Fan Luo “Heart Sounds Classification Based on Feature Fusion Using Lightweight Neural Networks” In IEEE Transactions on Instrumentation and Measurement 70, 2021, pp. 1–9 DOI: 10.1109/TIM.2021.3109389
- [17] Yaseen, Gui-Young Son and Soonil Kwon “Classification of Heart Sound Signal Using Multiple Features” In Applied Sciences 8.12, 2018, pp. 2344 DOI: 10.3390/app8122344
- [18] Haoran Kui et al. “Heart sound classification based on log Mel-frequency spectral coefficients features and convolutional neural networks” In Biomedical Signal Processing and Control 69, 2021, pp. 102893 DOI: 10.1016/j.bspc.2021.102893
- [19] Feng Li, Zheng Zhang, Lingling Wang and Wei Liu “Heart sound classification based on improved mel-frequency spectral coefficients and deep residual learning” In Frontiers in Physiology 13, 2022, pp. 1084420 DOI: 10.3389/fphys.2022.1084420
- [20] Jonathan Herzig, Amitai Bickel, Arie Eitan and Nathan Intrator “Monitoring Cardiac Stress Using Features Extracted From S1 Heart Sounds” In IEEE Transactions on Biomedical Engineering 62.4, 2015, pp. 1169–1178 DOI: 10.1109/TBME.2014.2377695
- [21] Palani Thanaraj Krishnan, Parvathavarthini Balasubramanian and Snekhalatha Umapathy “Automated heart sound classification system from unsegmented phonocardiogram (PCG) using deep neural network” In Physical and Engineering Sciences in Medicine 43.2, 2020, pp. 505–515 DOI: 10.1007/s13246-020-00851-w
- [22] Fuad Noman, Chee-Ming Ting, Sh-Hussain Salleh and Hernando Ombao “Short-segment Heart Sound Classification Using an Ensemble of Deep Convolutional Neural Networks” ISSN: 2379-190X In ICASSP 2019 - 2019 IEEE International Conference on Acoustics, Speech and Signal Processing (ICASSP), 2019, pp. 1318–1322 DOI: 10.1109/ICASSP.2019.8682668
- [23] Xiao Chen, Xingming Guo, Yineng Zheng and Chengcong Lv “Heart function grading evaluation based on heart sounds and convolutional neural networks” In Physical and Engineering Sciences in Medicine 46.1, 2023, pp. 279–288 DOI: 10.1007/s13246-023-01216-9
- [24] Tanzil Hoque Chowdhury, Khem Narayan Poudel and Yating Hu “Time-Frequency Analysis, Denoising, Compression, Segmentation, and Classification of PCG Signals” In IEEE Access 8, 2020, pp. 160882–160890 DOI: 10.1109/ACCESS.2020.3020806
- [25] Eunchan Kim et al. “TinyML-Based Classification in an ECG Monitoring Embedded System” In Computers, Materials & Continua 75.1, 2023, pp. 1751–1764 DOI: 10.32604/cmc.2023.031663
- [26] Dr. G. Sophia Reena “Posture Guardian With Smart Muscle Strain Detection And Correction Using TINYML” In Tuijin Jishu/Journal of Propulsion Technology 44.4, 2023, pp. 5187–5194 DOI: 10.52783/tjjpt.v44.i4.1873
- [27] Farida Sabry et al. “Machine Learning for Healthcare Wearable Devices: The Big Picture” In Journal of Healthcare Engineering 2022, 2022, pp. 1–25 DOI: 10.1155/2022/4653923
- [28] Bailian Sun, Safin Bayes, Abdelrhman Mohamed Abotaleb and Mohamed Hassan “The Case for tinyML in Healthcare: CNNs for Real-Time On-Edge Blood Pressure Estimation” In Proceedings of the 38th ACM/SIGAPP Symposium on Applied Computing Tallinn Estonia: ACM, 2023, pp. 629–638 DOI: 10.1145/3555776.3577747
- [29] Tao Li et al. “Lightweight End-to-End Neural Network Model for Automatic Heart Sound Classification” In Information 12.2, 2021, pp. 54 DOI: 10.3390/info12020054
- [30] Michael X Cohen “A better way to define and describe Morlet wavelets for time-frequency analysis” In NeuroImage 199, 2019, pp. 81–86 DOI: 10.1016/j.neuroimage.2019.05.048
- [31] Matthew S. Tiscareno and Matthew M. Hedman “A review of Morlet wavelet analysis of radial profiles of Saturn’s rings” In Philosophical Transactions of the Royal Society A: Mathematical, Physical and Engineering Sciences 376.2126, 2018, pp. 20180046 DOI: 10.1098/rsta.2018.0046
- [32] P. Goupillaud, A. Grossmann and J. Morlet “Cycle-octave and related transforms in seismic signal analysis” In Geoexploration 23.1, Seismic Signal Analysis and Discrimination III, 1984, pp. 85–102 DOI: 10.1016/0016-7142(84)90025-5
- [33] Amirtaha Taebi and Hansen Mansy “Time-Frequency Distribution of Seismocardiographic Signals: A Comparative Study” In Bioengineering 4.4, 2017, pp. 32 DOI: 10.3390/bioengineering4020032
- [34] Sicun Duan et al. “A Bionic MEMS Electronic Stethoscope With Double-Sided Diaphragm Packaging” In IEEE Access 9, 2021, pp. 27122–27129 DOI: 10.1109/ACCESS.2021.3058148
- [35] R Shelishiyah et al. “Signal Processing for Hybrid BCI Signals” In Journal of Physics: Conference Series 2318.1, 2022, pp. 012007 DOI: 10.1088/1742-6596/2318/1/012007
- [36] Xiaoyong Chen, Paloma R. Horche and Alfredo M. Minguez “Optical signal impairment study of cascaded optical filters in 40 Gbps DQPSK and 100 Gbps PM-DQPSK systems”, 2013, pp. 88550C DOI: 10.1117/12.2021521
- [37] Lars Wanhammar “Analog Filters Using MATLAB” Boston, MA: Springer US, 2009 DOI: 10.1007/978-0-387-92767-1
- [38] N.. Chawla, K.. Bowyer, L.. Hall and W.. Kegelmeyer “SMOTE: Synthetic Minority Over-sampling Technique”, 2011 DOI: 10.48550/ARXIV.1106.1813
- [39] Olaf Ronneberger, Philipp Fischer and Thomas Brox “U-Net: Convolutional Networks for Biomedical Image Segmentation”, 2015 DOI: 10.48550/ARXIV.1505.04597
- [40] Andrew G. Howard et al. “MobileNets: Efficient Convolutional Neural Networks for Mobile Vision Applications”, 2017 DOI: 10.48550/ARXIV.1704.04861
- [41] Ahmed Patwa, Muhammad Mahboob Ur Rahman and Tareq Y. Al-Naffouri “Heart Murmur and Abnormal PCG Detection via Wavelet Scattering Transform & a 1D-CNN”, 2023 DOI: 10.48550/ARXIV.2303.11423
- [42] Yuxin Duan et al. “A Comparative Study of Pre-trained Audio and Speech Models for Heart Sound Detection” In Man-Machine Speech Communication Singapore: Springer Nature, 2024, pp. 287–301 DOI: 10.1007/978-981-97-0601-3˙25
- [43] Chengyu Liu et al. “An open access database for the evaluation of heart sound algorithms” In Physiological Measurement 37.12, 2016, pp. 2181–2213 DOI: 10.1088/0967-3334/37/12/2181
- [44] Elsa F.. et al. “Classifying Heart Sounds - Approaches to the PASCAL Challenge:” In Proceedings of the International Conference on Health Informatics Barcelona, Spain: SciTePress - ScienceTechnology Publications, 2013, pp. 337–340 DOI: 10.5220/0004234403370340
- [45] Davoud Shariat Panah, Andrew Hines and Susan McKeever “Synthetic Heart Sound Dataset” Technological University Dublin, 2023 DOI: 10.21427/T9ZE-0C44