BARO: Robust Root Cause Analysis for Microservices via Multivariate Bayesian Online Change Point Detection
Abstract.
Detecting failures and identifying their root causes promptly and accurately is crucial for ensuring the availability of microservice systems. A typical failure troubleshooting pipeline for microservices consists of two phases: anomaly detection and root cause analysis. While various existing works on root cause analysis require accurate anomaly detection, there is no guarantee of accurate estimation with anomaly detection techniques. Inaccurate anomaly detection results can significantly affect the root cause localization results. To address this challenge, we propose BARO, an end-to-end approach that integrates anomaly detection and root cause analysis for effectively troubleshooting failures in microservice systems. BARO leverages the Multivariate Bayesian Online Change Point Detection technique to model the dependency within multivariate time-series metrics data, enabling it to detect anomalies more accurately. BARO also incorporates a novel nonparametric statistical hypothesis testing technique for robustly identifying root causes, which is less sensitive to the accuracy of anomaly detection compared to existing works. Our comprehensive experiments conducted on three popular benchmark microservice systems demonstrate that BARO consistently outperforms state-of-the-art approaches in both anomaly detection and root cause analysis.
1. Introduction
In recent years, microservice systems have gained significant popularity in the development of cloud-based applications, owing to their numerous advantages such as resource flexibility, a loosely coupled architecture, and lightweight deployment. However, failures are inevitable in microservice systems due to their inherent complexity. A failure in one service can propagate across the system, affecting many other services and resulting in the degradation of the system availability. This, in turn, leads to poor user experience and incurs huge economic losses. For instance, it has been reported that a one-hour downtime on Amazon.com could potentially cost up to 100 million USD (Chen et al., 2019a, 2020). Therefore, system operators must closely monitor the systems, checking key run-time information to promptly detect failures as soon as they occur, and then proceed to identify the failures’ root causes and troubleshoot them. However, in practice, the complexity of microservice systems and the large volume of monitoring data make these tasks especially challenging.
Metric-based anomaly detection and root cause analysis (RCA) for microservice systems have been extensively studied in recent years (Soldani and Brogi, 2022; Ikram et al., 2022; Li et al., 2022; Xin et al., 2023; Chen et al., 2022; Siffer et al., 2017; Wu et al., 2020b; Lin et al., 2018; Yu et al., 2021; Liu et al., 2021; Lee et al., 2023). Given a set of metrics data, anomaly detection techniques aim to detect whether there exist anomalies and consequently, failures within the microservice system (Chen et al., 2022; Lee et al., 2023). If a failure is detected, the RCA module is then triggered to locate the root cause of the failure (Lee et al., 2023; Ikram et al., 2022; Li et al., 2022). The RCA module aims to address two fundamental questions: (1) which services are the root causes, and (2) what specific issues are causing that failure (e.g. high CPU utilization, memory leak, or network congestion). Some RCA approaches use hypothesis testing or a statistical analysis method to analyze the time series metrics data to identify the candidate root causes for the detected anomalies (Shan et al., 2019; Li et al., 2022). Some RCA methods construct topology graphs using the information provided by the monitoring systems, such as the microservice status, the interaction between the services, and the interaction traces, to facilitate root cause analysis (Wu et al., 2020b; Liu et al., 2021). Multiple recent RCA methods (Xin et al., 2023; Ikram et al., 2022; Lin et al., 2018; Meng et al., 2020) use different causal discovery methods (Runge et al., 2019; Jaber et al., 2020; Spirtes et al., 1995) to derive the causal relationships among the services and metrics from the multivariate time series metrics data and employ graph centrality algorithms like random walk (Lin et al., 2018), PageRank (Xin et al., 2023; Wu et al., 2021) or Depth-First Search (DFS) (Chen et al., 2014) to infer the root causes.
Despite being closely related, existing RCA works typically either treat the anomaly detection tasks independently or rely on overly simplistic anomaly detection techniques (Lee et al., 2023; Soldani and Brogi, 2022; Li et al., 2022; Ikram et al., 2022). For example, MicroRCA (Wu et al., 2020b) and MicroDiag (Wu et al., 2021) employ the simple BIRCH clustering technique (Zhang et al., 1996) for detecting anomalies. MicroScope (Lin et al., 2018) and Ms-Rank (Ma et al., 2019) use a basic three-sigma rule of thumb as their anomaly detection method, known as N-Sigma. There are various commercial monitoring platforms, notable platforms including DataDog (dat, 2024b) and Dynatrace (dyn, 2024b), which rely on simplistic anomaly detection techniques (dyn, 2024c; dat, 2024c) for univariate time series data. Most RCA research works (Lin et al., 2018; Wang et al., 2018; Ma et al., 2019; Wu et al., 2020b; Ma et al., 2020; Wu et al., 2021; Li et al., 2022; Ikram et al., 2022; Xin et al., 2023) focus solely on identifying the root cause of the failure whilst assuming the existence of an anomaly detection module that can accurately detect failures and trigger the RCA module when failures are detected. Some of these works, such as CIRCA (Li et al., 2022) and RCD (Ikram et al., 2022), specifically require certain information from the anomaly detection module, in particular, the failure occurrence time. However, they assume this information is already known accurately. Thus, it remains unclear whether, when combined with existing anomaly detection methods that may provide imprecise information, these approaches are still effective in localizing the root cause.
In this work, we introduce BARO, an end-to-end approach for anomaly detection and root cause analysis for microservice systems based on metrics data, which are multivariate time series data. BARO includes a Multivariate Bayesian Online Change Point Detection module for detecting anomalies. It also includes a novel RobustScorer module, which is a nonparametric statistical hypothesis testing technique and less sensitive to the accuracy of the anomaly detection, for robustly identifying the root causes. BARO offers several advantages. Firstly, it follows an unsupervised learning approach, eliminating the need for labelled data and enabling direct application without the requirement of such labelled data. Secondly, it does not rely on operational knowledge (e.g., service call graphs) or causal graphs, making it suitable for large-scale evolving systems where acquiring such operational knowledge or causal graphs for numerous services is difficult (Ikram et al., 2022; Li et al., 2022; Wang et al., 2018). Finally, BARO is nonparametric, scale-equivalent, and rotation-invariant, making it applicable to a wide range of systems. We comprehensively evaluate BARO against various state-of-the-art approaches on three popular benchmark microservice systems. Our experimental results demonstrate that BARO consistently surpasses the state-of-the-art methods. Additionally, we analyze the sensitivity of the RCA methods against their parameters to show the robustness of our method.
In summary, our major contributions are as follows:
-
•
We propose a new end-to-end approach for anomaly detection and root cause analysis in microservice systems based on multivariate time series metrics data. In particular, we propose to use the Multivariate Bayesian Online Change Point Detection technique to detect anomalies, and a novel nonparametric statistical hypothesis testing technique for accurately identifying root causes of microservice systems’ failures.
-
•
We conduct extensive experiments on three popular benchmark microservice systems. Our experimental results demonstrate that BARO consistently outperforms state-of-the-art approaches in both anomaly detection and root cause analysis.
-
•
We perform a comprehensive sensitivity analysis, evaluating the performance of all the RCA methods w.r.t. their parameters. Our experimental results show that BARO is significantly more robust against important parameters, e.g., the anomaly detection time, compared to baseline methods.
2. Problem Statement and Background
2.1. Problem Statement
2.1.1. Key Terminology
Failures represent the actual inability of a service to execute its functions (Soldani and Brogi, 2022). Faults correspond to the root causes of such failures (e.g., CPU hog, memory leak, or network disconnection) (Soldani and Brogi, 2022; Avizienis et al., 2004). Anomalies are defined as observable symptoms of failures (Li et al., 2022; Soldani and Brogi, 2022). Root cause analysis (RCA) is the process of determining why a failure has occurred (Lee et al., 2023), i.e., finding the root cause of the failure. RCA involves a thorough examination of various monitoring data, i.e., including metrics data. Metrics are recorded by the monitoring system and contain various critical information within the microservice systems, such as workload, resource consumption, and response time (Xin et al., 2023). These metrics are typically represented as multivariate time series, with each time series corresponding to the data collected with a specific metric. In the context of metric-based RCA, root cause metrics are the metrics that are indicators of the root cause (Li et al., 2022; Chen et al., 2022; Ikram et al., 2022). The system operators can use these suggested root cause metrics to identify the true underlying root cause of the failures. The use of these terms aligns with existing RCA works (Chen et al., 2014, 2016, 2022; Ikram et al., 2022; Li et al., 2022; Liu et al., 2023; Meng et al., 2020; Xin et al., 2023).
2.1.2. Problem Formulation
Let us consider a microservice system consisting of services . At each time step , the monitoring system collects metrics from each service . Given a -length observation window with time-series metrics data , our goal is to develop a framework that solves two problems. The first problem is to predict the existence of anomalies (failures), represented as a binary indicator , which takes the value of when there is no anomaly and when there is an anomaly within the metrics dataset. The second problem is that, when returns , an RCA module is triggered to pinpoint the root causes of the failure using this dataset , i.e., the specific root cause services and the corresponding root cause metrics.
2.2. Multivariate Time Series Data in Microservice Systems
Metric-based anomaly detection and RCA are typically based on runtime information collected on the services within the microservice system. Such information includes metrics monitored on the microservices, such as workload, resource consumption, and response time. These metrics are typically represented as multivariate time series, with each time series corresponding to the data collected with a specific metric (Soldani and Brogi, 2022). Microservices also generate logs to provide more detailed and meaningful information about their state. Some previous studies (Wang et al., 2021a; Aggarwal et al., 2020, 2021) parse raw logs to extract log static structures (i.e., log templates (Le and Zhang, 2023)), and count the occurrences of these templates, which are subsequently transformed into time series data. These logs can also be a source of multivariate time series data, which can be used for analyze root cause. In this work, we, however, only focus on metrics as multivariate time series data, as with (Li et al., 2022; Ikram et al., 2022; Wu et al., 2020b, 2021; Thalheim et al., 2017; Meng et al., 2020; Wang et al., 2018; Liu et al., 2021).
2.3. Anomaly Detection
In microservice systems, once a failure occurs in a service, it is typically reflected in the metrics data of that particular service, resulting in an anomaly or a change in its data distribution. Furthermore, a failure in one service can propagate across the systems and impact other services, subsequently leading to changes to the metrics data of those services as well. To detect a failure in a microservice system, the goal is to detect any anomalies or changes in the given metrics dataset (Soldani and Brogi, 2022).
A wide range of anomaly detection methods exist for time series data (Blázquez-García et al., 2021). In this paper, since we target the problem of identifying root causes for microservice systems, we only focus on root cause localization-oriented anomaly detectors employed or discussed in existing metric-based RCA studies (Lee et al., 2023). N-Sigma (Lin et al., 2018) is used and discussed in MicroRank (Yu et al., 2021), CIRCA (Li et al., 2022), Eadro (Lee et al., 2023), and MicroScope (Lin et al., 2018). SPOT (Siffer et al., 2017) is mentioned and evaluated in CIRCA (Li et al., 2022) and Eadro (Lee et al., 2023). BIRCH (Zhang et al., 1996) is employed in MicroRCA (Wu et al., 2020b) and MicroDiag (Wu et al., 2021). Finally, Univariate Offline Bayesian Change Point Detection (Adams and MacKay, 2007) is used in CauseInfer (Chen et al., 2014, 2016). We describe these methods in the below.
N-Sigma
N-Sigma (i.e., the three-sigma rule of thumb) represents one of the simplest anomaly detection methods. It operates based on the assumption that the data points falling within three standard deviations of the mean of the data distribution are considered normal. Consequently, any data point that falls outside this range, i.e., , is deemed abnormal. For instance, MicroScope (Lin et al., 2018) computes the mean and standard deviation of the metrics data distribution using the most recent 10 minutes of data and then applies this method to detect anomalies.
SPOT
SPOT and dSPOT (Siffer et al., 2017) are founded based on the principles of Extreme Value Theory (Coles, 2001) to detect anomalies and have been employed in various RCA research works (Pan et al., 2021; Li et al., 2022; Lee et al., 2023; Meng et al., 2020). SPOT is designed to handle data with stationary distribution, while dSPOT is developed for streaming data susceptible to concept drift. It is worth noting that different studies have used different variants of SPOT; For instance, MicroCause (Meng et al., 2020) and DycauseRCA (Pan et al., 2021) made use of dSPOT, whereas CIRCA (Li et al., 2022) employed biSPOT. In this work, we will employ dSPOT, as in (Meng et al., 2020; Pan et al., 2021). Therefore, in the sequel, when referring to SPOT, we are specifically referring to dSPOT.
BIRCH
BIRCH (Balanced Iterative Reducing and Clustering using Hierarchies) (Zhang et al., 1996) is a well-regarded unsupervised clustering algorithm known for its efficiency in real-time data analysis and anomaly detection, particularly in large-scale datasets and time-series data. Its main idea is to generate a brief and informative summary about the original dataset, and then perform clustering on this summary. BIRCH considers a data point to be an anomaly when it is in a different cluster with other consecutive data points. MicroRCA (Wu et al., 2020b) and MicroDiag (Wu et al., 2021) have employed BIRCH for anomaly detection as a preliminary step before conducting root cause analysis.
Univariate Offline Bayesian Change Point Detection
Bayesian change point detection (Adams and MacKay, 2007) is a statistical method for identifying change points in time series data, i.e., timesteps where the data distribution experiences significant shifts. It relies on the principle of causal predictive filtering, aiming to generate an accurate distribution of future unseen data points based solely past observations. Through Bayesian statistics, it incorporates the prior information regarding the characteristics of the change points into the modelling process, making it to be both effective and efficient. In previous RCA research works, such as (Chen et al., 2014) and (Chen et al., 2016), univariate offline Bayesian change point detection was used to detect change points (anomalies) within the time series metrics data.
Besides the methods mentioned, commercial platforms like Datadog (dat, 2024b) and Dynatrace (dyn, 2024b) also provide anomaly detection techniques (dat, 2024c; dyn, 2024c) for univariate time series. These approaches either rely on users or historical data to obtain thresholds to detect anomalies. They are similar to the concept of N-Sigma, which uses expected values along with pre-defined tolerance thresholds.
2.4. Root Cause Analysis
Existing metric-based RCA algorithms can be classified into three main categories: statistical analysis, topology graph-based methods, and causal graph-based methods (Soldani and Brogi, 2022).
Statistical Analysis.
These approaches pinpoint failures’ root causes by identifying metrics that undergo significant changes during the anomalous period. -Diagnosis (Shan et al., 2019) uses the two-sample test algorithm and -statistics to measure the similarity among the metrics and rank the root cause based on the similarity scores. -Diagnosis is evaluated against three statistical analysis methods: Pearson distance, KNN (Friedman and Rafsky, 1983; Luo et al., 2014) and MST (Friedman and Rafsky, 1979). KNN (Friedman and Rafsky, 1983; Luo et al., 2014) uses nearest neighbours to model the distance between two time series, while MST (Friedman and Rafsky, 1979) uses a minimum spanning tree to represent the distance. In (Wang et al., 2020), a neural network is used to learn the normal behaviour and measure the similarity of monitoring data when the failure happens. They use mutual information to rank the root causes. N-Sigma (Lin et al., 2018; Li et al., 2022) is another statistical analysis technique that assesses the distance using z-score.
Topology Graph-based Analysis.
These approaches reconstruct a topology graph representing the microservice system using information from monitoring systems and operational knowledge. MicroRCA (Wu et al., 2020b) constructs a topology graph from monitoring data, extracts anomalous subgraphs, and uses the random walk algorithm to infer root causes. Similarly, (Wu et al., 2020a) constructs a topology graph and anomalous subgraphs, followed by a neural network-based method to infer the root cause. Sieve (Thalheim et al., 2017) uses a clustering technique to reduce the number of metrics on the constructed topology graph, then uses Granger Causality tests (Granger, 1980) to determine the possible root causes. Likewise, Brandon (Brandón et al., 2020) augments the provided topology graph with monitored metrics, conducts root cause searches through extracted subgraphs, and ranks root causes based on similarity scores. DLA (Samir and Pahl, 2019) transforms the provided topology graph and metric data into a hierarchical hidden Markov model and identifies root causes by computing the path with the highest anomalous probability. Meanwhile, CIRCA (Li et al., 2022) performs hypothesis testing on the structural graph to find the root causes. Commercial platforms such as Datadog (dat, 2024b) and Dynatrace (dyn, 2024b) construct a topology graph from distributed traces and perform Depth First Search (DFS) to find the root cause services (dat, 2024a; dyn, 2024a).
Causal Graph-based Analysis.
Many recent RCA techniques adopt the causal graph-based approach (Chen et al., 2014, 2016; Lin et al., 2018; Wang et al., 2018; Chen et al., 2019b; Ma et al., 2019; Meng et al., 2020; Ma et al., 2020; Wu et al., 2021; Ikram et al., 2022; Xin et al., 2023). The main idea is to construct a causal graph where vertices represent services or metrics of the microservices, and edges represent the cause-effect relationships between the services/metrics. These graphs are constructed using different causal discovery methods such as PC, FCI, LiNGAM, and GES (Spirtes et al., 1993, 1995; Chickering, 2002; Shimizu et al., 2006; Jaber et al., 2020). Assuming the root cause metric would affect other services’ metrics, graph centrality algorithms like Breath First Search (BFS), random walk, or PageRank are used to rank the root causes. In addition, correlation analysis can be conducted to measure the correlation among metrics (Wu et al., 2021), and the graph traversal process can consider these scores to identify the root cause. Recently, RCD (Ikram et al., 2022) employs a divide-and-conquer strategy to split the input metrics into smaller chunks and constructs a causal graph for each chunk. It then employs -PC (Jaber et al., 2020) to identify the root cause for each chunk, which is later combined to yield the final rootcause. CausalRCA (Xin et al., 2023) introduces the use of a gradient-based causal discovery method, namely DAG-GNN, to uncover causal relationships among metrics.
3. BARO: Proposed Root Cause Analysis Approach
In this section, we first introduce the basic assumptions underlying our approach (Section 3.1), then we present our proposed end-to-end approach for anomaly detection and root cause analysis, namely BARO (Sections 3.2, 3.3, 3.4). BARO incorporates a Multivariate BAyesian Online Change Point Detection technique to model the dependency and correlation structure of multivariate time series metrics data, enabling it to effectively detect anomalies and estimate the occurrence time of failures (Section 3.3). Then it uses a nonparametric hypothesis testing method, referred to as RObustScorer, to reliably identify and rank the potential root causes, which is less sensitive to the accuracy of the anomaly detection time (Section 3.4).
3.1. Basic Assumptions
3.1.1. Anomaly Metrics
As commonly recognized in previous works (Li et al., 2022; Yu et al., 2023; Liu et al., 2021), there are generally four types of metrics: Traffic (e.g., request count per minute), Saturation (e.g., CPU utilization, database records), Latency (e.g., average response time per minute), and Errors (e.g., the rate of failed requests). These four types are named after the four golden signals in site reliability engineering (goo, 2024). Following the practice in metric-based RCA studies (Yu et al., 2023; Xin et al., 2023; Lin et al., 2018; Li et al., 2022; Ikram et al., 2022), we assume that anomalies should be visible in the metrics, subsequently affecting Latency and/or Errors. With these assumptions, in varying conditions where there is a surge in Traffic or Saturation (e.g., in holiday periods) but without abnormal increases in Latency and Errors, our proposed method considers these situations as normal. Conversely, if a surge in Traffic or Saturation metrics causes abnormal increases in Latency or Errors, our method considers this an anomaly. Finally, for the RCA task, our method considers all the metrics to pursue the fine-grained output root cause ranking.
3.1.2. Failure Propagation Chain
In practice, when a service failure occurs, it generally results in an anomaly in the data associated with the metric corresponding to that failure (Li et al., 2022; Ikram et al., 2022). For example, network congestion in a service typically leads to an increase in its response time. Furthermore, since a failure can propagate across the services within the system, this initial anomaly will then trigger additional anomalies in the metrics data of other services at later time (Ikram et al., 2022; Xin et al., 2023; Lin et al., 2018; Li et al., 2022; Liu et al., 2021). Thus, when an anomaly is detected and the RCA module is activated, the anomalous period of runtime metrics data generally consists of multiple anomalies. In this work, based on this failure propagation chain, we assume the first anomaly corresponds to the time when the failure first occurs. Thus, in our proposed method, we use the first detected anomaly to approximate the failure occurrence time ( in Alg. 1) to separate the normal and abnormal metrics data. It is important to note that this assumption does not imply the first detected anomaly to be the root cause, and, it has been implicitly used in previous RCA works (Shan et al., 2019; Li et al., 2022; Ikram et al., 2022) for the same purpose as ours (i.e. to separate the abnormal and normal data). Our experimental results, along with those of previous studies, affirm the validity of this assumption.
3.2. Approach Overview
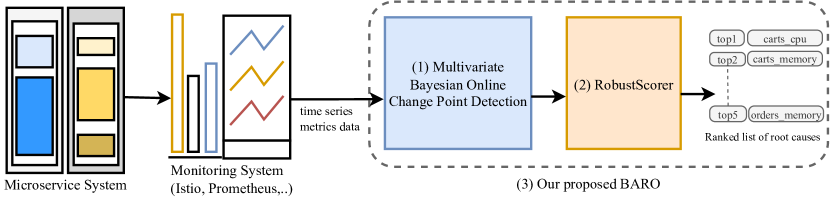
We illustrate BARO, our proposed end-to-end approach for anomaly detection and root cause analysis for microservice systems based on multivariate time series metrics data, in Fig. 1. BARO consists of two main components. The first component is a Multivariate Bayesian Online Change Point Detection (BOCPD) module to model the dependency and correlation structure of multivariate time-series metrics data so as to detect anomalies (failures). The second component is Robust Scorer, a nonparametric statistical hypothesis testing technique to identify the root cause associated with the failures. Thus, the outputs of BARO include: (1) a boolean indicating whether an anomaly is presented, (2) a ranked list of root cause metrics and their corresponding services, with the highest-ranked items having the highest probability of being the root cause of the failure, if an anomaly is detected. The pseudocode of BARO is described in Algorithm 1.
3.3. Multivariate Bayesian Online Change Point Detection
Anomaly detection in microservices involves identifying anomalies, i.e., observable symptoms of failures (Soldani and Brogi, 2022), while failures in microservices can be considered as interventions that change the monitoring data distribution (Ikram et al., 2022; Li et al., 2022). Therefore, to detect anomalies (failures) within microservices via time series metrics data, we formulate this problem as a change point detection problem whose goal is to identify whether the behavior of a time series changes significantly. We then propose to use Multivariate BOCPD, a combination of BOCPD (Adams and MacKay, 2007) and MultivariateCPD (Xuan and Murphy, 2007), to model the dependency and correlation among metrics to detect anomalies effectively. The motivation behind this design is twofold. First, we propose to use BOCPD (Adams and MacKay, 2007) as a base technique for detecting change points as it is a simple yet effective online detection technique and it requires no user-specified thresholds to identify change points for univariate time series. It has been shown to be among the best current change point detection methods in many real-world scenarios (van den Burg and Williams, 2020). Second, by combining BOCPD with MultivariateCPD (Xuan and Murphy, 2007), we can model the structure and dependency among the multivariate time series metrics data better. This is especially useful for detecting anomalies within microservices due to the failure propagation chain in microservices described in Section 3.1.2. Specifically, anomalies in microservices are generally propagated across the metrics data, causing correlated and dependent changes among different time series metrics. MultivariateCPD has been shown to be able to effectively detect change points when the changes occur in the correlation structure as in multivariate time series metrics data. In the following paragraphs, we describe in detail these two components of our proposed method.
The main idea of BOCPD is to model the run length, i.e. the number of consecutive data points in the same distribution, since the last change point, given the data observed so far. Specifically, the run length at time is defined as if there is a change point at time , and as otherwise. Given the time series metrics data , using the Bayes theorem, the posterior probability distribution of the run length can be computed as (Adams and MacKay, 2007),
| (1) |
where denotes the set of observed data points associated with the run . The formula in Eq. (1) is recursive, meaning that we can compute the posterior distribution of the run length based on the posterior distribution of , the conditional prior of run length and the distribution of the metrics data . As suggested in (Adams and MacKay, 2007), the marginal likelihood of the metrics data can be chosen as a distribution from the exponential family and the conditional prior of run length can be set based on a hazard function with discrete exponential (geometric) distribution. At each time step , the most probable run length is computed as the value with the highest probability . Finally, the change points are identified as the data points at the time steps whose run lengths decrease.
The main idea of MultivariateCPD, given the time series metrics data , is to model the metrics data at each data point using a multivariate model (Xuan and Murphy, 2007). A common choice is to use the multivariate Gaussian, i.e., , with is an inverse Wishart prior and is set to be which is the number time series within the metrics dataset and is set to be , is the identity matrix and is the mean of the empirical variance pooled across all the metrics data. With this formulation, let us denote , the marginal likelihood of the multivariate time series data can then be computed explicitly as (Xuan and Murphy, 2007),
| (2) | ||||
where denotes the multivariate gamma function. This formulation of the marginal likelihood can then incorporated into Eq. (1) to replace the univariate marginal likelihood. Other steps are kept the same in order to detect change points in the time series metrics data.
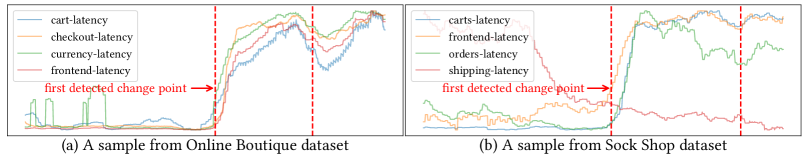
Fig. 2 presents two examples of using Multivariate BOCPD to detect change points within multivariate time series metrics data using two different datasets. It can be seen that Multivariate BOCPD can accurately detect change points (data points that separate the normal and abnormal data), and thus, detect the failures.
Finally, note that following the assumptions in Section 3.1, we use Latency and Errors to detect anomalies, and we only output the first detected change point as the detected anomaly.
3.4. RobustScorer: A Robust Nonparametric Hypothesis Testing Technique
To identify the root cause metrics, we aim to identify the metrics that exhibit significant changes in data distribution at the anomaly detection time (Shan et al., 2019; Liu et al., 2023; Li et al., 2022). To solve this problem, one approach is to conduct hypothesis testing and test whether the data distribution of the metrics data changes significantly after the anomaly detection time. This approach was employed in -Diagnosis (Shan et al., 2019; Liu et al., 2023) and NSigma (Li et al., 2022) and they have been shown to perform very well in various scenarios. Our key insight is that previous works might be extremely sensitive to the anomaly detection output (failure occurrence time ), i.e., inaccurate specification of the failure occurrence time might yield bad root cause analysis. Therefore, we propose RobustScorer to address this problem.
Specifically, for each metric in the metrics dataset , we conduct a hypothesis test based on the following null hypothesis (): is not a root cause metric for the failure. This null hypothesis means that, for after the anomaly detection time, with denoting the distribution of the metrics data during the normal period (when is before the anomaly detection time).
This approach generally requires the specification of the anomaly detection time. Inaccurate anomaly detection time therefore could impact the accuracy of these techniques significantly. In this section, we propose a novel nonparametric hypothesis testing technique that is robust and less sensitive to the accuracy of the anomaly detection time.
3.4.1. A Robust Nonparametric Hypothesis Test
RobustScorer follows a statistical approach to learn the expected distribution from the metrics data. For every time series in the metrics dataset , let us denote as the anomaly detection time, which is an estimation of the time when the anomaly occurs, RobustScorer is trained using the data collected prior to the anomaly, spanning from to , to learn the median () and interquartile range () of this data distribution. Subsequently, for each data point in the anomalous period (from to ), RobustScorer measures how significant it deviates from the expected central tendency. This deviation is denoted as and is computed as follows,
| (3) |
All the values of across all the metrics data during the anomalous period are then consolidated to yield , which is an indicator measuring the changes of each metric during the anomalous period,
| (4) |
A higher signifies a greater likelihood that serves as the root cause metric, thereby identifying as the root cause service. Finally, RobustScorer then generates a ranked list of root cause metrics based on the magnitudes of , arranged in descending order, with the highest ones corresponding to the most probable root cause metrics (fine-grained root causes). The coarse-grained ranked list of root cause services can be derived from the fine-grained ranking list by extracting the services corresponding to the metrics. Note that we do not use the p-value to reject/accept a possible root cause as in standard hypothesis testing. In our method, we use hypothesis testing to rank the potential root causes as it is normal for the system operators to focus on the top candidates.
Similar to (Li et al., 2022; Shan et al., 2019), our proposed RobustScorer is also distribution-free, scale-equivalent (i.e. metrics data in different scales do not affect the ranked list of root causes), and rotation-invariant (i.e. timestamp shifts do not affect the ranked list of root causes).
3.4.2. Why is RobustScorer Robust to Imprecise Anomaly Detection Time?
In contrast to previous works (Li et al., 2022; Shan et al., 2019; Ma et al., 2019), which compare normal and abnormal metrics data using the mean and standard deviation of the data distribution, we propose to use the median and interquartile range in our hypothesis testing module. The rationale is that mean and standard deviation are known to be sensitive to outliers, which could be introduced by inaccurate anomaly detection. On the other hand, the median and interquartile range are notably resilient to the impact of outliers (mod, 2023; rob, 2023).
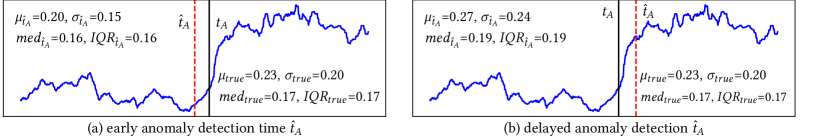
In Fig. 3, we illustrate the robustness to the anomaly detection time of RobustScorer corresponding to two scenarios: early anomaly detection (Fig. 3a) and delayed anomaly detection (Fig. 3b). An early anomaly detection reduces the number of data points used to compute the distribution of normal data in the hypothesis test. In the scenario of limited data, median and IQR are known to be more resilient than mean and standard deviation, making RobustScorer work well in this scenario. On the other hand, a delayed anomaly detection includes abnormal data (outliers) into the normal data period. Median and IQR are known to work well in the presence of outliers, making RobustScorer to also work well in this scenario. For instance, with RobustScorer, the computed median and IQR values of normal data distribution based on the anomaly detection time remain close to those computed based on the true anomaly occurrence time . In contrast, the computed mean and standard deviation based on the anomaly detection time are more different compared to those computed based on . In our experimental evaluation in Section 4, we demonstrate that RobustScorer outperforms existing RCA approaches in identifying the failure’s root cause and generally is more robust to the anomaly detection time than other baselines.
3.4.3. Handling of Correlated Failures
For correlated failures affecting multiple services simultaneously, RobustScorer ranks affected services/metrics as the top possible root causes. This allows quicker identification of actual root causes, instead of troubleshooting all possible root causes. For example, consider a firewall misconfiguration leading to correlated failures affecting services A and B simultaneously. Although the true root cause is the misconfiguration, RobustScorer ranks services A and B as the top probable root cause services since they are the immediate successors of the true root cause. The operator can check these services and analyze the true root cause promptly.
4. Evaluation
This section answers the following research questions:
-
•
RQ1: How effective is BARO in anomaly detection? To answer this RQ, we conduct an experiment to compare BARO with state-of-the-art anomaly detection approaches and evaluate their performance in detecting anomalies.
-
•
RQ2: How effective is BARO in root cause analysis? To answer this RQ, we compare BARO with state-of-the-art RCA methods and evaluate their performance in ranking both root cause services (coarse-grained) and root cause metrics (fine-grained) of the failures.
-
•
RQ3: How effective are the components of BARO? To answer this RQ, we evaluate the effectiveness of each main component of BARO: Multivariate BOCPD in detecting anomalies and RobustScorer in locating the failure’s root cause.
-
•
RQ4: How sensitive different RCA methods are w.r.t different parameters? To answer this RQ, we perform a sensitivity analysis to evaluate the peformance of all these methods with different values of the anomaly detection time and other methods hyperparameters.
4.1. Benchmark Microservice Systems & Data Collection
We deploy three well-known benchmark microservice systems, namely Online Boutique (ob, 2023), Sock Shop (soc, 2023), and Train Ticket (tt, 2023), on a Kubernetes cluster consisting of one master node and five worker nodes. Each node has 16 CPUs and 32GB RAM, resulting in a total of 80 CPUs and 160GB RAM across five workers. We sequentially deployed the three systems with their default replicas configuration, i.e., one instance per service, to inject faults and gather metrics data under the load of 100-200 concurrent users. Online Boutique is an e-commerce application with 12 services, allowing users to view items, add them to their cart and make purchases. Each service in the Online Boutique system requires between 0.2-0.5 CPU and 64-512MB RAM for normal functioning. Sock Shop is another e-commerce system focused on selling socks, comprising 11 services that communicate via HTTP requests. Each service in the Sock Shop system requires between 0.1-1 CPU and 300MB-2GB RAM for normal functioning. On the other hand, Train Ticket is one of the largest microservice benchmark systems emulating a train ticket booking platform featuring 64 services. Compared to Sock Shop and Online Boutique, Train Ticket has longer and more complex failure propagation paths. Each service in the Train Ticket system requires between 0.2-1 CPU and 200MB-1GB RAM for normal functioning. These benchmark microservice systems have been widely recognized and employed for evaluating the performance of RCA methods (Lin et al., 2018; Ikram et al., 2022; Wu et al., 2021; Xin et al., 2023; Wu, 2022; He et al., 2022; Li et al., 2021; Yu et al., 2021; Zhou et al., 2018; Wang et al., 2021b).
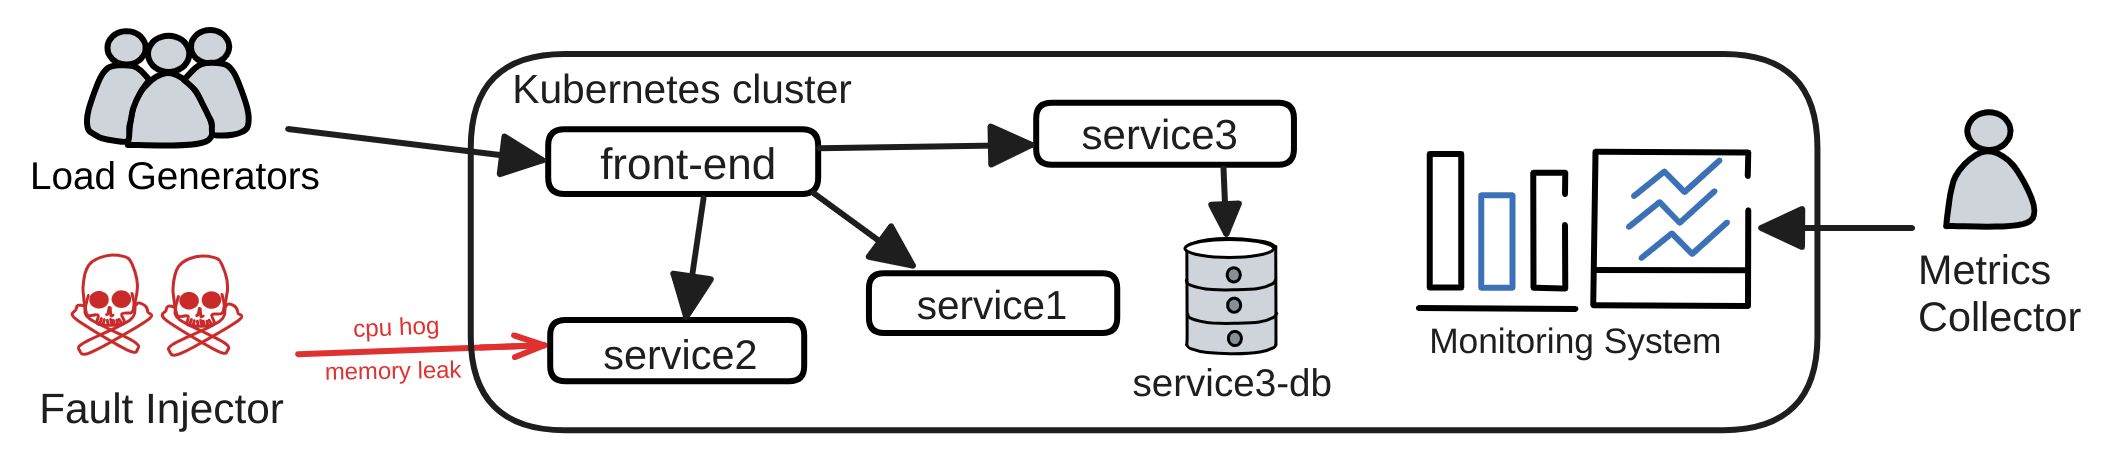
To gather the metrics data, we employ the Istio service mesh (ist, 2023) along with Prometheus (pro, 2023) and cAdvisor (cad, 2023) to monitor and collect resource-level and service-level metrics, as previously done in (Ikram et al., 2022; Xin et al., 2023; Wu et al., 2021). To generate traffic, we use the load generators supplied by these systems and tailor them to explore all services with the load of 40-50 requests per second. Fig. 4 illustrates our setup to collect the experimental data from the microservice systems.
We inject four common anomalies: CPU hog, memory leak, network delay, and packet loss into several key services within each benchmark microservice system. Initially, we operate the applications normally to gather metrics data under normal conditions. Then, we follow the existing practice (Ikram et al., 2022; Lee et al., 2023; Wu et al., 2021; Xin et al., 2023; Yu et al., 2021) to inject faults into the running services. We execute into the designated container using kubectl exec. For CPU hog and memory leak, we use stress-ng (str, 2024) to stress the container resource. For network delay and packet loss, we use tc (tc, 2024) to manipulate the traffic of the container. Specifically, we inject faults into five targeted services of Sock Shop (carts, catalogue, orders, payment, and user), five targeted services of Online Boutique (adservice, cartservice, checkoutservice, currencyservice, and productcatalogue), and five targeted services of Train Ticket (ts-auth-service, ts-order-service, ts-route-service, ts-train-service, ts-travel-service). We choose these services due to their critical nature, as issues with their performance can impact other services (Ikram et al., 2022; Xin et al., 2023; Lee et al., 2023). For each combination of fault type and targeted service, we repeat the operation (i.e. fault injection and metrics data collection) five times, resulting in 100 failure cases for each benchmark microservice system.
Furthermore, to ensure the independence of different injection experiments, we chose to restart the microservice systems after each experiment of injecting failures and collecting data, instead of waiting for a cooldown period, as described in previous studies (Wu et al., 2021; Yu et al., 2021; Xin et al., 2023). Upon visual inspections, we observed that the deviations between the fault injection time and the onset of failure symptoms in the metrics data are usually around 1-3 seconds. It is important to note that we simulate a workload of 100-200 concurrent users to interact with the systems intensively. Henceforth, the system is highly sensitive to the injected faults, and anomalies are reflected in the metrics shortly after the injection operation. Table 1 presents the statistics summarizing the collected data. To the best of our knowledge, we are the first to use all three popular benchmark microservice systems to evaluate the RCA methods.
| Name | #metrics | #svc | #t_svc | #fault | #cases |
|---|---|---|---|---|---|
| Online Boutique | 49 | 12 | 5 | 4 | 100 |
| Sock Shop | 46 | 11 | 5 | 4 | 100 |
| Train Ticket | 212 | 64 | 5 | 4 | 100 |
4.2. Evaluation Metrics
4.2.1. Anomaly Detection
Similar to previous works (Chen et al., 2014, 2016, 2022), we evaluate the anomaly detectors as binary classification models as the main goal is to detect whether there exist anomalies in the metrics data. We determine metrics data collected during a fault injection period as abnormal, while metrics data before that period is considered normal. Therefore, we use Precision, Recall, and F1 scores to evaluate the anomaly detectors. When an anomaly detection algorithm successfully detects an abnormal sample (i.e., a case with anomalies), it is counted as a True Positive (TP). Conversely, incorrectly classifying an abnormal sample as normal is considered False Negative (FN). Likewise, incorrectly classifying a normal sample as abnormal is considered False Positive (FP). The formulas for computing the metrics Precision, Recall, and F1-score are as follows:
| (5) |
4.2.2. Root Cause Analysis
Following existing works (Wang et al., 2018; Ma et al., 2019, 2020; Meng et al., 2020; Yu et al., 2021; Wu et al., 2020b, 2021; Ikram et al., 2022; Li et al., 2022; Xin et al., 2023), we use two standard metrics, namely and to assess the performance of the RCA methods. Herein, we set . Given a set of failure cases A, and are calculated as follows,
| (6) |
where denotes the th ranking result for the failure case by an RCA method, and is the true root cause set of case . represents the probability the top results given by a method include the real root causes. It ranges from to , with higher values indicating better performance. Meanwhile, measures the overall performance of RCA methods.
4.3. Experimental Setting
We conduct all the experiments on Linux servers equipped with 8 CPU and 16GB RAM. To avoid any randomness, when evaluating each method, for each failure case we repeat the experiment (detecting anomalies and identifying root causes) five times, then report the average results. Our framework is implemented using Python 3.10.
4.4. Baselines
Anomaly Detection Baselines.
We select the following four baselines to compare against our proposed method: N-Sigma (Lin et al., 2018; Li et al., 2022), BIRCH (Zhang et al., 1996; Wu et al., 2020b, 2021), SPOT (Siffer et al., 2017; Pan et al., 2021; Li et al., 2022; Lee et al., 2023; Meng et al., 2020), and Univariate Bayesian Change Point Detection (denoted as UniBCP) (Adams and MacKay, 2007; Chen et al., 2014, 2016). These methods are commonly used in existing RCA research for anomaly detection. Their source code has been made publicly available, with the exception of UniBCP, for which we leverage an available implementation (uni, 2023) for the evaluation. The detailed descriptions of these methods are in Section 2.3. For all methods, we use the hyperparameter settings as in previous works and in their public source code.
Root Cause Analysis Baselines.
We choose six representative baselines, including five state-of-the-art metric-based RCA methods: CausalRCA (Xin et al., 2023), RCD (Ikram et al., 2022), CIRCA (Li et al., 2022), -Diagnosis (Shan et al., 2019), and N-Sigma (Li et al., 2022), for performance comparison with our proposed method, BARO. Detailed information of these methods is as follows:
-
•
Dummy: Dummy randomly selects a metric as the root cause. We use this method to assess whether our BARO framework and the other baselines outperform random selection.
- •
-
•
-Diagnosis (Shan et al., 2019): -Diagnosis uses the two-sample test algorithm and -statistics to estimate the similarity between every pair of metrics and rank the root causes based on test scores.
-
•
RCD (Ikram et al., 2022): RCD employs a divide-and-conquer strategy to divide the input metrics into smaller chunks. It uses the -PC algorithm (Jaber et al., 2020) to construct a causal graph and identify root causes within each chunk. Subsequently, it combines these root causes and repeats this process until only one chunk remains.
-
•
CIRCA (Li et al., 2022): CIRCA creates a causal graph by using a provided call graph, which requires operational knowledge. Then, it performs regression-based hypothesis testing to find the root causes. Since the call graph is not available, thus following (Ikram et al., 2022; Liu et al., 2023), we use the PC algorithm to construct this graph for CIRCA.
- •
The source code of CausalRCA, RCD, CIRCA, and N-Sigma is publicly available. For CIRCA, since the required call graphs are unavailable, we use the PC algorithm to construct the causal graphs as done in (Ikram et al., 2022; Ma et al., 2019, 2020; Wang et al., 2018; Xin et al., 2023). For -Diagnosis, the original source code is unavailable thus we rely on the implementation of a related work (Liu et al., 2023). We use the same hyperparameter values as reported in their papers.
4.5. RQ1: Effectiveness in Anomaly Detection
In this RQ, we evaluate the performance of BARO and the baseline anomaly detectors across all three datasets. We use the metrics data collected before the failure as normal data, and during the failure as abnormal data. We report the average of Precision (Pre), Recall (Rec), and F1-score (F1) over all the cases. Table 2 presents the experimental results, with the best results highlighted in bold. We draw the following observations:
(1) BARO consistently outperforms all baseline methods in detecting anomalies by a large margin across all three benchmark microservice systems. It achieves the highest Precision, Recall, and F1-score on all the datasets. BARO’s performance can be attributed to the following factors: (1) BOCPD’s ability to detect distribution changes, suitable for identifying anomalies from the failure, acting as a soft intervention (Ikram et al., 2022; Li et al., 2022), (2) Multivariate BOCPD considers not only individual time series but also the dependencies among the time series, allowing it to detect correlation changes, and (3) it does not require any user-defined thresholds making it to be highly adaptive to different types of metrics data.
| Online Boutique | Sock Shop | Train Ticket | |||||||
|---|---|---|---|---|---|---|---|---|---|
| Method | Pre | Rec | F1 | Pre | Rec | F1 | Pre | Rec | F1 |
| N-Sigma | 0.54 | 1 | 0.7 | 0.56 | 1 | 0.72 | 0.5 | 1 | 0.67 |
| SPOT | 0.53 | 1 | 0.69 | 0.53 | 1 | 0.69 | 0.5 | 1 | 0.67 |
| BIRCH | 0.35 | 0.48 | 0.4 | 0.05 | 0.05 | 0.05 | 0.39 | 0.4 | 0.39 |
| UniBCP | 0.51 | 1 | 0.67 | 0.5 | 0.99 | 0.66 | 0.5 | 1 | 0.67 |
| BARO (Ours) | 0.69 | 1 | 0.82 | 0.6 | 1 | 0.75 | 0.68 | 1 | 0.81 |
(*) UniBCP denotes Univariate Offline Bayesian Change Point Detection.
(2) All baseline methods, except BIRCH, have very high recalls but low precisions across all the datasets. This indicates that they generally can detect anomalies, however, they also frequently misclassify normal time series as anomalous. The precision of these methods generally range from 0.05 to 0.68. Based on our observations, this is due to the complexity and dynamics of the benchmark microservice systems, which include many time series metrics with complicated patterns, leading to frequent misclassifications of anomalies by these baseline methods.
In summary, BARO stands out as the best-performing method, being effective in detecting anomalies. This anomaly detection capability plays a crucial role in the subsequent RCA task.
4.6. RQ2: Effectiveness in Root Cause Analysis
In this section, we evaluate the performance of BARO and the RCA baseline methods on all three datasets. First, we assess the ideal performance of the methods when the anomaly occurrence time is known accurately. Specifically, we use the fault injection time as a proxy for the true anomaly occurence time since we have observed that in our benchmark microservice systems, the anomaly occurence time closely aligns with the fault injection time. Then, we assess the performance of RCA methods when using the anomaly detection time provided by existing anomaly detectors described in Section 4.4. Note that Dummy and CausalRCA do not require the specification of the anomaly detection time. Tables 3 and 4 report the overall performance of all methods using the Avg@5 scores for coarse-grained root cause analysis (root cause services) and fine-grained root cause analysis (root cause metrics), respectively. We calculate the accuracy for each type of fault: CPU hog (CPU), memory leak (MEM), network delay (DELAY), and packet loss (LOSS), as well as their average (AVG) to report the overall performance across four fault types. In the tables, we denote the combination of an RCA method and an anomaly detector as RCA_method[Anomaly_Detector]. For instance, RCD[N-Sigma], RCD[BIRCH], RCD[SPOT], RCD[UniBCP], and RCD[BOCPD] represent the RCA pipelines that combine RCD with the anomaly detectors N-Sigma, BIRCH, SPOT, Univariate BCPD, and Multivariate BOCPD, respectively.
| Online Boutique | Sock Shop | Train Ticket | |||||||||||||
|---|---|---|---|---|---|---|---|---|---|---|---|---|---|---|---|
| Method | CPU | MEM | DELAY | LOSS | AVG | CPU | MEM | DELAY | LOSS | AVG | CPU | MEM | DELAY | LOSS | AVG |
| Dummy | 0.24 | 0.26 | 0.27 | 0.24 | 0.25 | 0.37 | 0.41 | 0.38 | 0.37 | 0.38 | 0.07 | 0.08 | 0.07 | 0.07 | 0.07 |
| CausalRCA | 0.85 | 0.91 | 0.86 | 0.58 | 0.8 | 0.49 | 0.82 | 0.61 | 0.47 | 0.6 | 0.53 | 0.3 | 0.17 | 0.11 | 0.28 |
| -Diagnosis [] | 0.1 | 0.13 | 0.12 | 0.12 | 0.12 | 0.47 | 0.3 | 0.42 | 0.49 | 0.42 | 0 | 0.02 | 0 | 0 | 0.01 |
| -Diagnosis [N-Sigma] | 0.19 | 0.16 | 0.23 | 0.22 | 0.2 | 0.49 | 0.39 | 0.46 | 0.5 | 0.46 | 0 | 0 | 0 | 0.02 | 0.01 |
| -Diagnosis [BIRCH] | 0.23 | 0.33 | 0.21 | 0.14 | 0.22 | - | 0 | - | 1 | 0.8 | 0.07 | 0 | 0 | 0 | 0.02 |
| -Diagnosis [SPOT] | 0.37 | 0.2 | 0.17 | 0.22 | 0.24 | 0.46 | 0.34 | 0.42 | 0.46 | 0.42 | 0 | 0.02 | 0 | 0 | 0.01 |
| -Diagnosis [UniBCP] | 0.28 | 0.09 | 0.4 | 0.2 | 0.24 | 0.2 | 0.19 | 0.25 | 0.2 | 0.21 | 0.05 | 0.10 | 0.08 | 0.04 | 0.07 |
| -Diagnosis [BOCPD] | 0.23 | 0.09 | 0.18 | 0.15 | 0.16 | 0.45 | 0.35 | 0.38 | 0.44 | 0.41 | 0 | 0 | 0 | 0.06 | 0.02 |
| RCD [] | 0.69 | 0.4 | 0.27 | 0.5 | 0.47 | 0.62 | 0.46 | 0.48 | 0.37 | 0.48 | 0.08 | 0.01 | 0.09 | 0.12 | 0.08 |
| RCD [N-Sigma] | 0.67 | 0.43 | 0.31 | 0.49 | 0.48 | 0.54 | 0.42 | 0.46 | 0.37 | 0.45 | 0.07 | 0 | 0.05 | 0.1 | 0.06 |
| RCD [BIRCH] | 0.69 | 0.37 | 0.28 | 0.50 | 0.46 | 0.57 | 0.42 | 0.49 | 0.37 | 0.46 | 0.06 | 0 | 0.03 | 0.11 | 0.05 |
| RCD [SPOT] | 0.7 | 0.42 | 0.3 | 0.48 | 0.48 | 0.58 | 0.43 | 0.46 | 0.34 | 0.45 | 0.08 | 0.01 | 0.07 | 0.09 | 0.06 |
| RCD [UniBCP] | 0.66 | 0.42 | 0.29 | 0.49 | 0.47 | 0.62 | 0.44 | 0.5 | 0.36 | 0.48 | 0.05 | 0.01 | 0.05 | 0.1 | 0.05 |
| RCD [BOCPD] | 0.7 | 0.4 | 0.3 | 0.52 | 0.48 | 0.6 | 0.47 | 0.48 | 0.36 | 0.48 | 0.06 | 0 | 0.04 | 0.09 | 0.05 |
| CIRCA [] | 0.9 | 0.74 | 0.9 | 0.55 | 0.77 | 0.97 | 0.98 | 0.98 | 0.88 | 0.95 | 0.66 | 0.93 | 0.64 | 0.57 | 0.7 |
| CIRCA [N-Sigma] | 0.78 | 0.59 | 0.79 | 0.48 | 0.66 | 0.86 | 0.7 | 0.87 | 0.7 | 0.78 | 0.65 | 0.88 | 0.58 | 0.57 | 0.67 |
| CIRCA [BIRCH] | 0.45 | 0.38 | 0.27 | 0.48 | 0.39 | - | 0.60 | - | 0.75 | 0.72 | 0.10 | 0 | 0.35 | 0.13 | 0.19 |
| CIRCA [SPOT] | 0.76 | 0.7 | 0.88 | 0.66 | 0.75 | 0.83 | 0.87 | 0.95 | 0.78 | 0.86 | 0.69 | 0.96 | 0.58 | 0.53 | 0.69 |
| CIRCA [UniBCP] | 0.16 | 0 | 0 | 0.35 | 0.13 | 0.23 | 0 | 0.2 | 0.36 | 0.2 | 0 | 0 | 0 | 0.33 | 0.08 |
| CIRCA [BOCPD] | 0.68 | 0.2 | 0.28 | 0.42 | 0.4 | 0.73 | 0.98 | 0.54 | 0.66 | 0.73 | 0.37 | 0.12 | 0.3 | 0.17 | 0.24 |
| N-Sigma [] | 0.9 | 0.93 | 0.94 | 0.66 | 0.86 | 0.98 | 0.98 | 0.98 | 0.9 | 0.96 | 0.81 | 0.96 | 0.61 | 0.7 | 0.77 |
| N-Sigma [N-Sigma] | 0.79 | 0.69 | 0.83 | 0.63 | 0.74 | 0.85 | 0.77 | 0.89 | 0.79 | 0.83 | 0.74 | 0.98 | 0.61 | 0.65 | 0.75 |
| N-Sigma [BIRCH] | 0.83 | 0.78 | 0.64 | 0.6 | 0.71 | - | 0 | - | 0.85 | 0.68 | 0.55 | 0.7 | 0.47 | 0.45 | 0.51 |
| N-Sigma [SPOT] | 0.79 | 0.79 | 0.93 | 0.65 | 0.79 | 0.87 | 0.91 | 0.99 | 0.82 | 0.9 | 0.75 | 0.98 | 0.61 | 0.64 | 0.75 |
| N-Sigma [UniBCP] | 0.75 | 0.69 | 0.91 | 0.76 | 0.78 | 0.86 | 0.79 | 0.69 | 0.81 | 0.79 | 0.38 | 0.71 | 0.38 | 0.62 | 0.52 |
| N-Sigma [BOCPD] | 0.74 | 0.32 | 0.52 | 0.58 | 0.54 | 0.8 | 0.98 | 0.63 | 0.62 | 0.76 | 0.51 | 0.16 | 0.29 | 0.22 | 0.3 |
| RobustScorer [] | 0.9 | 0.94 | 0.94 | 0.65 | 0.86 | 0.98 | 0.98 | 0.98 | 0.86 | 0.95 | 0.9 | 0.97 | 0.62 | 0.67 | 0.79 |
| RobustScorer [N-Sigma] | 0.9 | 0.96 | 0.88 | 0.58 | 0.83 | 0.96 | 0.98 | 0.98 | 0.9 | 0.96 | 0.82 | 0.98 | 0.62 | 0.64 | 0.77 |
| RobustScorer [BIRCH] | 0.92 | 0.93 | 0.81 | 0.51 | 0.79 | - | 1 | - | 0.85 | 0.88 | 0.76 | 0.55 | 0.57 | 0.71 | 0.65 |
| RobustScorer [SPOT] | 0.89 | 0.94 | 0.93 | 0.61 | 0.84 | 0.97 | 0.98 | 0.99 | 0.86 | 0.95 | 0.85 | 0.98 | 0.61 | 0.66 | 0.78 |
| RobustScorer [UniBCP] | 0.73 | 0.67 | 0.89 | 0.79 | 0.77 | 0.8 | 0.65 | 0.69 | 0.84 | 0.75 | 0.37 | 0.64 | 0.38 | 0.54 | 0.48 |
| BARO (Ours) | 0.91 | 0.96 | 0.95 | 0.62 | 0.86 | 0.97 | 0.98 | 0.98 | 0.87 | 0.95 | 0.9 | 0.98 | 0.64 | 0.7 | 0.81 |
(*) BIRCH has a poor recall, so RCA results with BIRCH are obtained from a limited number of failure cases where BIRCH detects anomalies. CIRCA results for TrainTicket are only obtained from 15/100 cases due to PC’s failed causal graph construction.
4.6.1. Coarse-grained Root Cause Analysis
From Table 3, we draw the following observations.
(1) BARO performs the best in identifying the coarse-grained root cause of the failure, consistently achieving top accuracy scores for all types of faults across all datasets. BARO achieves the highest Avg@5 in 10 out of 15 cases and outperforms other baselines by a large margin. For example, while CausalRCA achieves 0.8, 0.6, and 0.28, BARO achieves 0.86, 0.95, and 0.81 in the overall Avg@5 for all three microservice systems, respectively. This represents 7.5%, 58%, and 189% improvements compared to CausalRCA.
From the results, we can see that, when working with large-scale microservice systems, -Diagnosis, RCD, CausalRCA, and CIRCA encounter huge difficulties, whereas BARO yields much better results. BARO’s resistance to the imprecision of the anomaly detection time via the nonparametric RobustScorer hypothesis test demonstrates its applicability in practical scenarios, where the anomaly detection module may differ across real-world systems. Moreover, BARO leverages multivariate BOCPD to capture dependencies within multivariate metrics data, allowing for more precise localization of the anomaly occurrence time and thus improve the RCA performance.
(2) CausalRCA does not require separating the normal and abnormal metrics data. It uses all the provided metrics data to construct the causal graph and then uses PageRank to rank the root causes. The experimental results indicate that it performs well on the Online Boutique system. For instance, it achieves an Avg@5 of 0.85 for the CPU overload fault, 0.91 for the memory leak fault, and an overall Avg@5 of 0.8. Nevertheless, its performance declines on the other two systems. For example, it only achieves overall Avg@5 scores of 0.6 and 0.28 on the Sock Shop and Train Ticket systems, possibly due to the challenges posed by the complex structures of these systems. Overall, we can see that the performance of CausalRCA varies significantly across different systems.
(3) -Diagnosis, a widely-known baseline RCA method, does not perform greatly superior to random selection. For example, its overall Avg@5 scores range from 0.12 to 0.24, whereas random selection achieves 0.25 on the Online Boutique system. However, it outperforms Dummy by 20% in the Sock Shop system, with an overall Avg@5 score of 0.46 compared to Dummy’s 0.38.
(4) RCD outperforms random selection in small-scale systems such as Online Boutique and Sock Shop. For example, its overall Avg@5 scores range from 0.45 to 0.48 while Dummy’s scores range from 0.25 to 0.38. However, for the large-scale Train Ticket system, RCD’s performance drops remarkably. For instance, RCD’s Avg@5 scores range from 0.05 to 0.08, similar to Dummy’s. This observation suggests the need to include large-scale systems like Train Ticket in future work to benchmark newly proposed RCA methods.
(5) We observe that N-Sigma, a simple statistical analysis technique, performs better than CIRCA. Note that, in this work, as discussed, for CIRCA, we use the causal graphs constructed by the PC algorithm instead of the required call graphs as these graphs are not available for these systems, which could be a cause of this observation. Overall, N-Sigma outperforms both CIRCA and RCD in coarse-grained root cause localization.
In summary, BARO consistently outperforms other methods for all fault types and datasets by a large margin. When applied to a large-scale system like Train Ticket, baseline methods like -Diagnosis, RCD, CausalRCA, and CIRCA struggle, while BARO still delivers superior results.
| Online Boutique | Sock Shop | Train Ticket | |||||||||||||
| Method | CPU | MEM | DELAY | LOSS | AVG | CPU | MEM | DELAY | LOSS | AVG | CPU | MEM | DELAY | LOSS | AVG |
| Dummy | 0.08 | 0.06 | 0.07 | 0.06 | 0.07 | 0.1 | 0.07 | 0.07 | 0.06 | 0.08 | 0.02 | 0.02 | 0.02 | 0.01 | 0.02 |
| CausalRCA | 0.55 | 0.78 | 0.86 | 0.39 | 0.65 | 0.39 | 0.42 | 0.49 | 0.34 | 0.41 | 0.51 | 0.13 | 0.1 | 0.09 | 0.21 |
| -Diagnosis [] | 0.07 | 0.03 | 0.06 | 0.02 | 0.05 | 0 | 0 | 0 | 0 | 0 | 0 | 0 | 0 | 0 | 0 |
| -Diagnosis [N-Sigma] | 0 | 0.06 | 0.2 | 0.13 | 0.1 | 0.02 | 0 | 0 | 0 | 0.01 | 0 | 0 | 0 | 0 | 0 |
| -Diagnosis [BIRCH] | 0 | 0.07 | 0.21 | 0.14 | 0.11 | - | 0 | - | 0 | 0 | 0 | 0 | 0.2 | 0 | 0 |
| -Diagnosis [SPOT] | 0.06 | 0.02 | 0.14 | 0.06 | 0.07 | 0 | 0 | 0 | 0 | 0 | 0 | 0 | 0 | 0 | 0 |
| -Diagnosis [UniBCP] | 0 | 0 | 0.3 | 0.12 | 0.11 | 0 | 0 | 0.11 | 0.09 | 0.05 | 0.05 | 0 | 0.05 | 0 | 0.03 |
| -Diagnosis [BOCPD] | 0.02 | 0.04 | 0.1 | 0.12 | 0.07 | 0 | 0 | 0 | 0 | 0 | 0 | 0 | 0 | 0 | 0 |
| RCD [] | 0.16 | 0.26 | 0.22 | 0.18 | 0.21 | 0.02 | 0.17 | 0.1 | 0.07 | 0.09 | 0 | 0 | 0.06 | 0 | 0.02 |
| RCD [N-Sigma] | 0.16 | 0.29 | 0.23 | 0.15 | 0.21 | 0 | 0.16 | 0.09 | 0.07 | 0.08 | 0 | 0 | 0.03 | 0 | 0.01 |
| RCD [BIRCH] | 0.15 | 0.27 | 0.24 | 0.19 | 0.21 | 0.01 | 0.15 | 0.11 | 0.06 | 0.08 | 0 | 0 | 0.02 | 0 | 0 |
| RCD [SPOT] | 0.14 | 0.31 | 0.23 | 0.15 | 0.21 | 0.02 | 0.16 | 0.11 | 0.06 | 0.09 | 0 | 0 | 0.04 | 0 | 0.01 |
| RCD [UniBCP] | 0.16 | 0.31 | 0.22 | 0.14 | 0.21 | 0.01 | 0.16 | 0.09 | 0.07 | 0.08 | 0 | 0 | 0.04 | 0 | 0.01 |
| RCD [BOCPD] | 0.17 | 0.28 | 0.24 | 0.17 | 0.22 | 0.04 | 0.16 | 0.14 | 0.07 | 0.1 | 0 | 0 | 0.03 | 0 | 0.01 |
| CIRCA [] | 0.42 | 0.3 | 0.9 | 0.54 | 0.54 | 0.52 | 0.58 | 0.98 | 0.86 | 0.74 | 0.48 | 0.86 | 0.55 | 0.57 | 0.62 |
| CIRCA [N-Sigma] | 0.22 | 0.27 | 0.79 | 0.4 | 0.42 | 0.5 | 0.42 | 0.87 | 0.66 | 0.61 | 0.48 | 0.84 | 0.51 | 0.54 | 0.59 |
| CIRCA [BIRCH] | 0.17 | 0 | 0.29 | 0.38 | 0.23 | - | 0 | - | 0.75 | 0.60 | 0.10 | 0 | 0.31 | 0.13 | 0.18 |
| CIRCA [SPOT] | 0.34 | 0.18 | 0.88 | 0.6 | 0.5 | 0.5 | 0.46 | 0.94 | 0.74 | 0.66 | 0.5 | 0.88 | 0.5 | 0.5 | 0.6 |
| CIRCA [UniBCP] | 0 | 0 | 0 | 0.2 | 0.05 | 0.08 | 0 | 0 | 0.15 | 0.06 | 0 | 0 | 0 | 0.17 | 0.04 |
| CIRCA [BOCPD] | 0.29 | 0 | 0.18 | 0.35 | 0.21 | 0.42 | 0.49 | 0.34 | 0.47 | 0.43 | 0.3 | 0.12 | 0.18 | 0.09 | 0.17 |
| N-Sigma [] | 0.54 | 0.54 | 0.94 | 0.5 | 0.63 | 0.77 | 0.7 | 0.98 | 0.88 | 0.83 | 0.6 | 0.93 | 0.54 | 0.65 | 0.68 |
| N-Sigma [N-Sigma] | 0.38 | 0.33 | 0.83 | 0.48 | 0.51 | 0.66 | 0.46 | 0.87 | 0.66 | 0.66 | 0.55 | 0.94 | 0.55 | 0.59 | 0.66 |
| N-Sigma [BIRCH] | 0.38 | 0.33 | 0.63 | 0.46 | 0.45 | - | 0 | - | 0.85 | 0.68 | 0.33 | 0.65 | 0.39 | 0.33 | 0.38 |
| N-Sigma [SPOT] | 0.41 | 0.41 | 0.92 | 0.53 | 0.57 | 0.66 | 0.58 | 0.99 | 0.77 | 0.75 | 0.56 | 0.94 | 0.55 | 0.58 | 0.66 |
| N-Sigma [UniBCP] | 0.37 | 0.11 | 0.91 | 0.66 | 0.51 | 0.51 | 0.08 | 0.59 | 0.74 | 0.48 | 0.2 | 0.39 | 0.38 | 0.62 | 0.4 |
| N-Sigma [BOCPD] | 0.46 | 0.04 | 0.51 | 0.46 | 0.37 | 0.6 | 0.54 | 0.42 | 0.52 | 0.52 | 0.35 | 0.16 | 0.21 | 0.14 | 0.22 |
| RobustScorer [] | 0.51 | 0.48 | 0.94 | 0.49 | 0.61 | 0.81 | 0.68 | 0.98 | 0.79 | 0.82 | 0.54 | 0.9 | 0.57 | 0.6 | 0.65 |
| RobustScorer [N-Sigma] | 0.54 | 0.56 | 0.88 | 0.49 | 0.62 | 0.8 | 0.72 | 0.98 | 0.83 | 0.83 | 0.46 | 0.96 | 0.52 | 0.57 | 0.63 |
| RobustScorer [BIRCH] | 0.42 | 0.51 | 0.79 | 0.43 | 0.54 | - | 0.8 | - | 0.85 | 0.84 | 0.33 | 0.45 | 0.49 | 0.67 | 0.49 |
| RobustScorer [SPOT] | 0.54 | 0.51 | 0.93 | 0.47 | 0.61 | 0.81 | 0.78 | 0.99 | 0.78 | 0.84 | 0.5 | 0.93 | 0.52 | 0.58 | 0.63 |
| RobustScorer [UniBCP] | 0.27 | 0.04 | 0.89 | 0.61 | 0.45 | 0.46 | 0.08 | 0.59 | 0.73 | 0.47 | 0.13 | 0.31 | 0.38 | 0.54 | 0.34 |
| BARO (Ours) | 0.51 | 0.51 | 0.95 | 0.47 | 0.61 | 0.79 | 0.67 | 0.98 | 0.8 | 0.81 | 0.54 | 0.93 | 0.58 | 0.61 | 0.67 |
4.6.2. Fine-grained Root Cause Analysis
From Table 4, we can see that BARO consistently ranks among the top performers, with overall Avg@5 scores of 0.61, 0.81, and 0.67, while the top scores among all the methods are 0.65, 0.84, and 0.68 on Online Boutique, Sock Shop, and Train Ticket systems, respectively. Notably, BARO significantly outperforms RCD and CIRCA. When provided , RCD achieves overall Avg@5 of 0.21, 0.09, and 0.02, CIRCA reaches 0.54, 0.74, and 0.62, while BARO achieves 0.61, 0.81, and 0.67 on Online Boutique, Sock Shop, and Train Ticket, respectively. BARO improves baseline RCA methods’ performance from 8% to 800%. While BARO performs similarly to CausalRCA on Online Boutique, it outperforms CausalRCA significantly on the Sock Shop and Train Ticket systems, with improvements ranging from 97% to 219% in overall Avg@5 score, demonstrating its capability in working with complex systems. These consistent results establish BARO as a reliable method across different microservice systems, demonstrating BARO’s superior performance compared to recent RCA state-of-the-art approaches (Xin et al., 2023; Ikram et al., 2022; Li et al., 2022).
4.7. RQ3: Effectiveness of BARO’s Components.
In this section, we analyze the performance of major components of BARO to assess their contribution to the overall pipeline. The experimental results in Tables 3 and 4 also support this section. We derive the following observations based on the experimental results:
(1) Multivariate BOCPD presents superior performance among the anomaly detectors when integrated with RobustScorer. While different anomaly detectors can be combined with RobustScorer to provide good performance, Multivariate BOCPD stands out by consistently delivering the best results. Multivariate BOCPD enables BARO to achieve the top overall Avg@5 score (0.86 on Online Boutique, 0.95 on Sock Shop, and 0.81 in Train Ticket for coarse-grained RCA). Multivariate BOCPD is effective because it can detect distribution changes within multivariate time series, making it suitable for detecting anomalies for microservices. N-Sigma, a simple anomaly detector, can enhance the RCA performance but its best performance is still lower than BARO. For example, on Online Boutique, its best performance is 0.83 whilst BARO achieves 0.86. BIRCH has poor recalls (i.e. detects only 48/100 abnormal cases on Online Boutique), limiting its ability to support RCA. When it can detect anomalies, its performance is still much lower than other anomaly detection methods. SPOT’s performance is similar to N-Sigma, and is lower than BARO. Finally, Univariate BOCPD’s performance is among the worst when combined with any RCA methods.
(2) RobustScorer demonstrates superior robustness compared to other baselines when integrated with different anomaly detectors. When provided , all three methods (CIRCA, N-Sigma, and BARO) perform similarly across three benchmark systems. Specifically, on the Online Boutique, Sock Shop, and Train Ticket systems, CIRCA achieves scores of 0.77, 0.95, and 0.7, N-Sigma scores of 0.86, 0.96, and 0.77, and RobustScorer scores of 0.86, 0.95, and 0.79, respectively. However, when we employ different anomaly detection methods (i.e. N-Sigma, BIRCH, SPOT, Univariate BCP, and Multivariate BOCPD) to estimate the anomaly occurrence time, the RCA methods reveal varying degrees of sensitivity. For example, on the Online Boutique system, CIRCA exhibits a variation of 62%, N-Sigma shows a variation of 33%, and our RobustScorer displayed a variation of 25%. On Online Boutique, N-Sigma achieves Avg@5 scores of 0.74, 0.46, 0.79, whilst RobustScorer achieves scores of 0.83, 0.61, 0.84, representing improvements of 12%, 32%, and 6% compared to when using N-Sigma, BIRCH, and SPOT as anomaly detectors, respectively. Overall, our RobustScorer demonstrated less sensitivity. When combined with Multivariate BOCPD, RobustScorer achieves accuracy similar to those obtained with . This observation, once again, confirms the effectiveness of our method.
In summary, the two components of BARO significantly contribute to the approach’s effectiveness. They both play critical roles in our proposed root cause analysis pipeline.
4.8. RQ4: Sensitivity Analysis of RCA Methods
In this section, we conduct a sensitivity analysis to assess the performance of various RCA methods w.r.t. different critical parameters. We use the AC@1, AC@3, and Avg@5 scores to assess the performance of the methods. We explore two key aspects of this sensitivity analysis.
4.8.1. Sensitivity on the Anomaly Detection Time
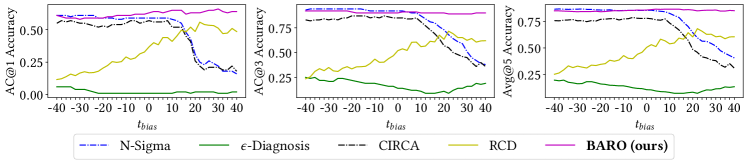
Let us denote as the fault injection time. Here, we aim to assess the performance of RCA methods when the anomaly detection time varies around this fault injection time. We formulate the anomaly detection time as where ranges from -40 to 40. We then evaluate the performance of the RCA methods with different anomaly detection time within this range. We run the experiments with the Online Boutique and Sock Shop datasets. The experimental results on the Online Boutique dataset are in Fig. 5 whilst the results on the Sock Shop dataset are in our supplementary material, Fig. S1 (bar, 2024c, b).
We observe that BARO and -Diagnosis exhibit significant resistance to variations in the specification of . In contrast, the performance of N-Sigma and CIRCA drops significantly when the anomaly is detected late. This issue might stem from the sensitivity of the mean and standard deviation to outliers, as discussed in Section 3.4.2. In particular, both N-Sigma and CIRCA use z-score, , which is computed based on the mean and standard deviation of the data distribution before the anomaly detection time. When the anomaly is detected late, a number of anomalous data points is included in the normal data period, and with the use of mean and standard deviation, this leads to improper root cause ranking (see Fig. 3). Finally, RCD also has high sensitivity to , highlighting a weakness of the combination of -PC and the divide-and-conquer strategy.
4.8.2. Hyperparameter Sensitivity
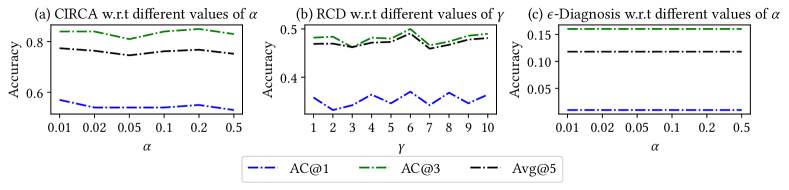
In this section, we aim to assess the sensitivity of different RCA methods to their parameters. RCD employs a divide-and-conquer strategy, requiring the specification of a chunk size parameter denoted as . We vary this parameter from 1 to 10 while the default value is 5. CIRCA uses PC to construct the causal graph, requiring a threshold for independence testing. We vary this parameter from 0.01 to 0.5 while the default value is 0.05. -Diagnosis also requires a threshold to drop the insignificant metrics. We range from 0.01 to 0.5 in this case. Note that CausalRCA’s parameters are already tuned (Xin et al., 2023), eliminating parameter sensitivities. Fig. 6 presents our experimental results on the Online Boutique dataset whilst the experimental results on the Sock Shop dataset are in the supplementary material, Fig. S2 (bar, 2024b, c).
Based on these results, it is evident that RCD, CIRCA, and -Diagnosis exhibit minimal sensitivity to their parameters. Consequently, we can have confidence in the reliability of the results obtained in our research questions. Notably, the performance of -Diagnosis is identical with different values of . This can be attributed to the fact that in -Diagnosis, the parameter primarily influences the trimming of lower-ranked root causes. Given our focus on the top-k results, the length of the list becomes less critical. Similarly, for CIRCA, the main component that serves root cause analysis is its statistical scorer; the significance level mainly affects the construction of the causal graph, which has minimal impact on the performance. For RCD, slight fluctuations in performance are observed with varying chunk size , but these variations are deemed insignificant.
4.9. Running Time & Instrumentation Cost
4.9.1. Running Time
On three datasets, BARO takes an average of 30 to 173 seconds to perform anomaly detection and root cause analysis. The highest recorded running time of BARO is 7 minutes in a case of the Train Ticket dataset. RobustScorer is very fast when it takes around 0.01 seconds to analyze the root cause, i.e., at least 3 to 1000 times faster than other methods like -Diagnosis, RCD, CIRCA, and CausalRCA. The detailed running time of our proposed method and different anomaly detection and root cause analysis modules are shown in Tables 6 and 6, respectively.
| Method | Online Boutique | Sock Shop | Train Ticket |
|---|---|---|---|
| N-Sigma | 0.16 | 0.11 | 0.53 |
| BIRCH | 0.05 | 0.04 | 0.11 |
| SPOT | 3.17 | 1.9 | 11.4 |
| UniBCD | 819.7 | 638.19 | 3292.48 |
| BARO (Ours) | 44.83 | 30 | 173.37 |
| Method | Online Boutique | Sock Shop | Train Ticket |
|---|---|---|---|
| CausalRCA | 299.18 | 287.18 | 2638.51 |
| -Diagnosis | 3.94 | 3.97 | 14.83 |
| RCD | 10.74 | 5.62 | 24.21 |
| CIRCA | 13.52 | 13.47 | 7564.88 |
| N-Sigma | 0.01 | 0.01 | 0.01 |
| BARO (Ours) | 0.01 | 0.01 | 0.01 |
4.9.2. Instrumentation Cost
BARO requires monitoring agents (e.g., Istio, cAdvisor, Prometheus) installed alongside application services to collect system-level (e.g., CPU/Mem/Disk usage) and application-level metrics (e.g., response time, request count per minute). These metrics are used for BARO to perform anomaly detection and root cause analysis. BARO requires Python and some standard packages (e.g. pandas, numpy). Further details are available in our artifacts (bar, 2024b, c).
5. Threats to validity
We assess potential threats to the validity of our work, considering the construct, internal, conclusion, and external factors as outlined in (Wohlin et al., 2012). The construct threat primarily concerns hyperparameters settings and evaluation metrics. To address this, we conduct a sensitivity analysis for all methods that require specific parameters and use established evaluation metrics. The internal threat concerns the framework implementation, where bugs may affects the results reliability. To mitigate, we use established Python packages, rigorous testing, and repeat the experiments multiple times. The conclusion threat is tied to the fault types as microservices can experience various faults (Mariani et al., 2018). We use four common faults to evaluate and demonstrate BARO’s superior performance. Furthermore, our framework relies on a set of assumptions discussed and validated in previous works on microservice systems, as described in Sec 3.1. If a system meets these assumptions, BARO could be applied. Expanding BARO to work with other types of systems, e.g., distributed database systems, could be a potential future work. The external threat is related to the deployment of microservice applications and data collection strategies. In this paper, we employ a single deployment setting for each microservice system and a single data collection strategy, which potentially limits the generality of our work. However, we deploy the benchmark systems on the real 5-node Kubernetes clusters and repeat the experiments multiple times to get comprehensive datasets. In addition, we use popular benchmark microservice applications, such as Online Boutique, Sock Shop, and Train Ticket, which are widely recognized in academia for testing microservices-related methods (Lin et al., 2018; Ikram et al., 2022; Wu et al., 2021; Xin et al., 2023; Wu, 2022; He et al., 2022; Li et al., 2021; Yu et al., 2021; Zhou et al., 2018; Wang et al., 2021b). Furthermore, we adopt Prometheus, an open-source tool for real-time monitoring, and collect service-level and resource-level metrics that present the status of a running microservice application. This choice helps mitigate this threat.
6. Conclusion
This paper proposes BARO, a novel end-to-end approach for anomaly detection and root cause analysis for microservice systems based on multivariate time series metrics data. BARO uses Multivariate Bayesian Online Change Point Detection for anomaly detection and introduces the RobustScorer, a nonparametric statistical hypothesis testing technique, for identifying root causes. Our experimental results on three benchmark systems demonstrate that BARO consistently outperforms the state-of-the-art methods in both anomaly detection and root cause analysis. Comprehensive sensitivity analysis highlights the robustness and broad applicability of our approach. Our research contributes a valuable tool for metric-based root cause analysis of microservice systems. In future work, we plan to enhance our framework by incorporating multimodal data (e.g., logs, traces).
7. Data Availability
We have open-sourced BARO, which can be accessed on GitHub at (bar, 2024b). Additionally, an immutable artifact for BARO is available on Zenodo (bar, 2024c), together with three experimental datasets (bar, 2024a).
Acknowledgements.
This research was supported by the Australian Research Council Discovery Project (DP220103044), AWS Cloud Credit for Research, and Google Travel Grant. We also thank anonymous reviewers for their insightful and constructive comments, which significantly improve this paper.References
- (1)
- uni (2023) 2023. Bayesian Change Point Detection. Retrieved May 14, 2024 from https://github.com/hildensia/bayesian_changepoint_detection
- cad (2023) 2023. Container Advisor - an open-source tool to monitor containers. Retrieved May 14, 2024 from https://github.com/google/cadvisor
- ist (2023) 2023. The Istio service mesh. Retrieved May 14, 2024 from https://istio.io/
- mod (2023) 2023. Modified z score. Retrieved May 14, 2024 from https://www.ibm.com/docs/en/cognos-analytics/11.1.0?topic=terms-modified-z-score
- ob (2023) 2023. Online Boutique is a cloud-first microservices demo application. Retrieved May 14, 2024 from https://github.com/GoogleCloudPlatform/microservices-demo
- pro (2023) 2023. An open-source monitoring and alerting toolkit. Retrieved May 14, 2024 from https://prometheus.io/
- soc (2023) 2023. Sock Shop - A Microservices Demo Application. Retrieved May 14, 2024 from https://microservices-demo.github.io/
- rob (2023) 2023. Statistical Procedures, Calculations and Formulae, APPENDIX D. Retrieved May 14, 2024 from https://www.apac-accreditation.org/app/uploads/2017/08/aplac_t017_appendix_d.pdf
- tt (2023) 2023. Train Ticket Benchmark System. Retrieved May 14, 2024 from https://github.com/FudanSELab/train-ticket
- dat (2024a) 2024a. Automated root cause analysis with Watchdog RCA. Retrieved May 14, 2024 from https://www.datadoghq.com/blog/datadog-watchdog-automated-root-cause-analysis/
- bar (2024a) 2024a. BARO Dataset Artifacts at Zenodo. Retrieved May 14, 2024 from https://zenodo.org/records/11046533
- bar (2024b) 2024b. BARO: Root Cause Analysis for Microservices. Retrieved May 14, 2024 from https://github.com/phamquiluan/baro
- bar (2024c) 2024c. BARO Software Artifacts at Zenodo. Retrieved May 14, 2024 from https://doi.org/10.5281/zenodo.11094092
- dat (2024b) 2024b. Datadog: Modern monitoring and security. Retrieved May 14, 2024 from https://www.datadoghq.com
- dyn (2024a) 2024a. Dynatrace: Root cause analysis with example. Retrieved May 14, 2024 from https://docs.dynatrace.com/docs/platform/davis-ai/problem-and-root-cause/root-cause-analysis#expand--details-and-example
- dyn (2024b) 2024b. Dynatrace: Unified observability and security. Retrieved May 14, 2024 from https://www.dynatrace.com
- goo (2024) 2024. Google - Site Reliability Engineering. Retrieved May 14, 2024 from https://sre.google/sre-book/monitoring-distributed-systems/
- dat (2024c) 2024c. Introducing anomaly detection in Datadog. Retrieved May 14, 2024 from https://www.datadoghq.com/blog/introducing-anomaly-detection-datadog/
- dyn (2024c) 2024c. Set up anomaly detection based on your business needs. Retrieved May 14, 2024 from https://www.dynatrace.com/news/blog/metric-events-set-up-anomaly-detection-based-on-your-business-needs/
- str (2024) 2024. Stress test for Computer system. Retrieved May 14, 2024 from https://wiki.ubuntu.com/Kernel/Reference/stress-ng
- tc (2024) 2024. Traffic Control. Retrieved May 14, 2024 from https://man7.org/linux/man-pages/man8/tc.8.html
- Adams and MacKay (2007) Ryan Prescott Adams and David JC MacKay. 2007. Bayesian online changepoint detection. arXiv preprint arXiv:0710.3742 (2007).
- Aggarwal et al. (2020) Pooja Aggarwal, Ajay Gupta, Prateeti Mohapatra, Seema Nagar, Atri Mandal, Qing Wang, and Amit Paradkar. 2020. Localization of operational faults in cloud applications by mining causal dependencies in logs using golden signals. In International Conference on Service-Oriented Computing. Springer, 137–149.
- Aggarwal et al. (2021) Pooja Aggarwal, Seema Nagar, Ajay Gupta, Larisa Shwartz, Prateeti Mohapatra, Qing Wang, Amit Paradkar, and Atri Mandal. 2021. Causal modeling based fault localization in cloud systems using golden signals. In 2021 IEEE 14th International Conference on Cloud Computing (CLOUD). IEEE, 124–135.
- Avizienis et al. (2004) Algirdas Avizienis, J-C Laprie, Brian Randell, and Carl Landwehr. 2004. Basic concepts and taxonomy of dependable and secure computing. IEEE transactions on dependable and secure computing 1, 1 (2004), 11–33.
- Blázquez-García et al. (2021) Ane Blázquez-García, Angel Conde, Usue Mori, and Jose A. Lozano. 2021. A Review on Outlier/Anomaly Detection in Time Series Data. Comput. Surveys 54, 3, Article 56 (2021).
- Brandón et al. (2020) Álvaro Brandón, Marc Solé, Alberto Huélamo, David Solans, María S Pérez, and Victor Muntés-Mulero. 2020. Graph-based root cause analysis for service-oriented and microservice architectures. Journal of Systems and Software 159 (2020), 110432.
- Chen et al. (2019a) Junjie Chen, Xiaoting He, Qingwei Lin, Yong Xu, Hongyu Zhang, Dan Hao, Feng Gao, Zhangwei Xu, Yingnong Dang, and Dongmei Zhang. 2019a. An Empirical Investigation of Incident Triage for Online Service Systems. In 2019 IEEE/ACM 41st International Conference on Software Engineering: Software Engineering in Practice (ICSE-SEIP). 111–120.
- Chen et al. (2016) Pengfei Chen, Yong Qi, and Di Hou. 2016. CauseInfer: Automated end-to-end performance diagnosis with hierarchical causality graph in cloud environment. IEEE transactions on services computing 12, 2 (2016), 214–230.
- Chen et al. (2014) Pengfei Chen, Yong Qi, Pengfei Zheng, and Di Hou. 2014. CauseInfer: Automatic and distributed performance diagnosis with hierarchical causality graph in large distributed systems. In IEEE Conference on Computer Communications (INFOCOM’14). 1887–1895.
- Chen et al. (2019b) Yujun Chen, Xian Yang, Qingwei Lin, Hongyu Zhang, Feng Gao, Zhangwei Xu, Yingnong Dang, Dongmei Zhang, Hang Dong, Yong Xu, Hao Li, and Yu Kang. 2019b. Outage Prediction and Diagnosis for Cloud Service Systems. In The World Wide Web Conference (San Francisco, CA, USA) (WWW ’19). Association for Computing Machinery, New York, NY, USA, 2659–2665.
- Chen et al. (2020) Zhuangbin Chen, Yu Kang, Liqun Li, Xu Zhang, Hongyu Zhang, Hui Xu, Yangfan Zhou, Li Yang, Jeffrey Sun, Zhangwei Xu, Yingnong Dang, Feng Gao, Pu Zhao, Bo Qiao, Qingwei Lin, Dongmei Zhang, and Michael R. Lyu. 2020. Towards Intelligent Incident Management: Why We Need It and How We Make It. In Proceedings of the 28th ACM Joint Meeting on European Software Engineering Conference and Symposium on the Foundations of Software Engineering (Virtual Event, USA) (ESEC/FSE 2020). 1487–1497.
- Chen et al. (2022) Zhuangbin Chen, Jinyang Liu, Yuxin Su, Hongyu Zhang, Xiao Ling, Yongqiang Yang, and Michael R Lyu. 2022. Adaptive performance anomaly detection for online service systems via pattern sketching. In Proceedings of the 44th International Conference on Software Engineering. 61–72.
- Chickering (2002) David Maxwell Chickering. 2002. Learning Equivalence Classes of Bayesian-Network Structures. Journal of Machine Learning Research 2 (2002), 445–498.
- Coles (2001) Stuart Coles. 2001. An introduction to statistical modeling of extreme values. Springer-Verlag, London.
- Friedman and Rafsky (1979) Jerome H Friedman and Lawrence C Rafsky. 1979. Multivariate generalizations of the Wald-Wolfowitz and Smirnov two-sample tests. The Annals of Statistics (1979), 697–717.
- Friedman and Rafsky (1983) Jerome H Friedman and Lawrence C Rafsky. 1983. Graph-theoretic measures of multivariate association and prediction. The Annals of Statistics (1983), 377–391.
- Granger (1980) C.W.J. Granger. 1980. Testing for causality: A personal viewpoint. Journal of Economic Dynamics and Control 2 (1980), 329–352.
- He et al. (2022) Zilong He, Pengfei Chen, Yu Luo, Qiuyu Yan, Hongyang Chen, Guangba Yu, and Fangyuan Li. 2022. Graph based Incident Extraction and Diagnosis in Large-Scale Online Systems. In Proceedings of the 37th IEEE/ACM International Conference on Automated Software Engineering (ASE’22). 1–13.
- Ikram et al. (2022) Azam Ikram, Sarthak Chakraborty, Subrata Mitra, Shiv Saini, Saurabh Bagchi, and Murat Kocaoglu. 2022. Root Cause Analysis of Failures in Microservices through Causal Discovery. In Advances in Neural Information Processing Systems (NeurIPS’22), Vol. 35. 31158–31170.
- Jaber et al. (2020) Amin Jaber, Murat Kocaoglu, Karthikeyan Shanmugam, and Elias Bareinboim. 2020. Causal Discovery from Soft Interventions with Unknown Targets: Characterization and Learning. In Advances in Neural Information Processing Systems (NeurIPS’20), Vol. 33. 9551–9561.
- Le and Zhang (2023) Van-Hoang Le and Hongyu Zhang. 2023. Log parsing with prompt-based few-shot learning. In 2023 IEEE/ACM 45th International Conference on Software Engineering (ICSE). IEEE, 2438–2449.
- Lee et al. (2023) Cheryl Lee, Tianyi Yang, Zhuangbin Chen, Yuxin Su, and Michael R Lyu. 2023. Eadro: An End-to-End Troubleshooting Framework for Microservices on Multi-source Data. arXiv preprint arXiv:2302.05092 (2023).
- Li et al. (2022) Mingjie Li, Zeyan Li, Kanglin Yin, Xiaohui Nie, Wenchi Zhang, Kaixin Sui, and Dan Pei. 2022. Causal Inference-Based Root Cause Analysis for Online Service Systems with Intervention Recognition. In Proceedings of the 28th ACM SIGKDD Conference on Knowledge Discovery and Data Mining (KDD’22). 3230–3240.
- Li et al. (2021) Zeyan Li, Junjie Chen, Rui Jiao, Nengwen Zhao, Zhijun Wang, Shuwei Zhang, Yanjun Wu, Long Jiang, Leiqin Yan, Zikai Wang, Zhekang Chen, Wenchi Zhang, Xiaohui Nie, Kaixin Sui, and Dan Pei. 2021. Practical Root Cause Localization for Microservice Systems via Trace Analysis. In 2021 IEEE/ACM 29th International Symposium on Quality of Service (IWQOS’21). 1–10.
- Lin et al. (2018) Jinjin Lin, Pengfei Chen, and Zibin Zheng. 2018. Microscope: Pinpoint Performance Issues with Causal Graphs in Micro-service Environments. In Service-Oriented Computing. 3–20.
- Liu et al. (2023) Chenghao Liu, Wenzhuo Yang, Himanshu Mittal, Manpreet Singh, Doyen Sahoo, and Steven CH Hoi. 2023. PyRCA: A Library for Metric-based Root Cause Analysis. arXiv preprint arXiv:2306.11417 (2023).
- Liu et al. (2021) Dewei Liu, Chuan He, Xin Peng, Fan Lin, Chenxi Zhang, Shengfang Gong, Ziang Li, Jiayu Ou, and Zheshun Wu. 2021. Microhecl: High-efficient root cause localization in large-scale microservice systems. In 2021 IEEE/ACM 43rd International Conference on Software Engineering: Software Engineering in Practice (ICSE-SEIP). IEEE, 338–347.
- Luo et al. (2014) Chen Luo, Jian-Guang Lou, Qingwei Lin, Qiang Fu, Rui Ding, Dongmei Zhang, and Zhe Wang. 2014. Correlating events with time series for incident diagnosis. In Proceedings of the 20th ACM SIGKDD international conference on Knowledge discovery and data mining. 1583–1592.
- Ma et al. (2019) Meng Ma, Weilan Lin, Disheng Pan, and Ping Wang. 2019. MS-Rank: Multi-Metric and Self-Adaptive Root Cause Diagnosis for Microservice Applications. In IEEE International Conference on Web Services (ICWS’19). 60–67.
- Ma et al. (2020) Meng Ma, Jingmin Xu, Yuan Wang, Pengfei Chen, Zonghua Zhang, and Ping Wang. 2020. AutoMAP: Diagnose Your Microservice-Based Web Applications Automatically. In Proceedings of The Web Conference (WWW’20). 246–258.
- Mariani et al. (2018) Leonardo Mariani, Cristina Monni, Mauro Pezzé, Oliviero Riganelli, and Rui Xin. 2018. Localizing faults in cloud systems. In 2018 IEEE 11th International Conference on Software Testing, Verification and Validation (ICST). IEEE, 262–273.
- Meng et al. (2020) Yuan Meng, Shenglin Zhang, Yongqian Sun, Ruru Zhang, Zhilong Hu, Yiyin Zhang, Chenyang Jia, Zhaogang Wang, and Dan Pei. 2020. Localizing Failure Root Causes in a Microservice through Causality Inference. In IEEE/ACM 28th International Symposium on Quality of Service (IWQoS’20). 1–10.
- Pan et al. (2021) Yicheng Pan, Meng Ma, Xinrui Jiang, and Ping Wang. 2021. Faster, deeper, easier: crowdsourcing diagnosis of microservice kernel failure from user space. In Proceedings of the 30th ACM SIGSOFT International Symposium on Software Testing and Analysis. 646–657.
- Runge et al. (2019) Jakob Runge, Peer Nowack, Marlene Kretschmer, Seth Flaxman, and Dino Sejdinovic. 2019. Detecting and quantifying causal associations in large nonlinear time series datasets. Science Advances 5, 11 (2019).
- Samir and Pahl (2019) Areeg Samir and Claus Pahl. 2019. Dla: Detecting and localizing anomalies in containerized microservice architectures using markov models. In 2019 7th International Conference on Future Internet of Things and Cloud (FiCloud). IEEE, 205–213.
- Shan et al. (2019) Huasong Shan, Yuan Chen, Haifeng Liu, Yunpeng Zhang, Xiao Xiao, Xiaofeng He, Min Li, and Wei Ding. 2019. -Diagnosis: Unsupervised and Real-Time Diagnosis of Small-Window Long-Tail Latency in Large-Scale Microservice Platforms. In The World Wide Web Conference (WWW’19). 3215–3222.
- Shimizu et al. (2006) Shohei Shimizu, Patrik O. Hoyer, Aapo Hyvarinen, and Antti Kerminen. 2006. A Linear Non-Gaussian Acyclic Model for Causal Discovery. Journal of Machine Learning Research 7, 72 (2006), 2003–2030.
- Siffer et al. (2017) Alban Siffer, Pierre-Alain Fouque, Alexandre Termier, and Christine Largouet. 2017. Anomaly detection in streams with extreme value theory. In Proceedings of the 23rd ACM SIGKDD international conference on knowledge discovery and data mining. 1067–1075.
- Soldani and Brogi (2022) Jacopo Soldani and Antonio Brogi. 2022. Anomaly Detection and Failure Root Cause Analysis in (Micro) Service-Based Cloud Applications: A Survey. Comput. Surveys 55, 3 (2022).
- Spirtes et al. (1993) P. Spirtes, C. Glymour, and R. Scheines. 1993. Causation, Prediction, and Search (1st ed.). MIT press.
- Spirtes et al. (1995) Peter Spirtes, Christopher Meek, and Thomas Richardson. 1995. Causal Inference in the Presence of Latent Variables and Selection Bias. In Proceedings of the Eleventh Conference on Uncertainty in Artificial Intelligence (UAI’95). 499–506.
- Thalheim et al. (2017) Jörg Thalheim, Antonio Rodrigues, Istemi Ekin Akkus, Pramod Bhatotia, Ruichuan Chen, Bimal Viswanath, Lei Jiao, and Christof Fetzer. 2017. Sieve: Actionable insights from monitored metrics in distributed systems. In Proceedings of the 18th ACM/IFIP/USENIX Middleware Conference (Middleware’17). 14–27.
- van den Burg and Williams (2020) Gerrit J. J. van den Burg and Christopher K. I. Williams. 2020. An Evaluation of Change Point Detection Algorithms. CoRR abs/2003.06222 (2020).
- Wang et al. (2020) Lingzhi Wang, Nengwen Zhao, Junjie Chen, Pinnong Li, Wenchi Zhang, and Kaixin Sui. 2020. Root-cause metric location for microservice systems via log anomaly detection. In 2020 IEEE international conference on web services (ICWS). IEEE, 142–150.
- Wang et al. (2018) Ping Wang, Jingmin Xu, Meng Ma, Weilan Lin, Disheng Pan, Yuan Wang, and Pengfei Chen. 2018. CloudRanger: Root Cause Identification for Cloud Native Systems. In 18th IEEE/ACM International Symposium on Cluster, Cloud and Grid Computing (CCGRID’18). 492–502.
- Wang et al. (2021a) Qing Wang, Larisa Shwartz, Genady Ya Grabarnik, Vijay Arya, and Karthikeyan Shanmugam. 2021a. Detecting causal structure on cloud application microservices using granger causality models. In 2021 IEEE 14th International Conference on Cloud Computing (CLOUD). IEEE, 558–565.
- Wang et al. (2021b) Qing Wang, Larisa Shwartz, Genady Ya. Grabarnik, Vijay Arya, and Karthikeyan Shanmugam. 2021b. Detecting Causal Structure on Cloud Application Microservices Using Granger Causality Models. In IEEE 14th International Conference on Cloud Computing (CLOUD’21). 558–565.
- Wohlin et al. (2012) Claes Wohlin, Per Runeson, Martin Höst, Magnus C Ohlsson, Björn Regnell, and Anders Wesslén. 2012. Experimentation in software engineering. Springer Science & Business Media.
- Wu (2022) Li Wu. 2022. Automatic performance diagnosis and recovery in cloud microservices. Technische Universitaet Berlin (Germany).
- Wu et al. (2020a) Li Wu, Jasmin Bogatinovski, Sasho Nedelkoski, Johan Tordsson, and Odej Kao. 2020a. Performance diagnosis in cloud microservices using deep learning. In International Conference on Service-Oriented Computing. Springer, 85–96.
- Wu et al. (2021) Li Wu, Johan Tordsson, Jasmin Bogatinovski, Erik Elmroth, and Odej Kao. 2021. Microdiag: Fine-grained performance diagnosis for microservice systems. In 2021 IEEE/ACM International Workshop on Cloud Intelligence (CloudIntelligence). IEEE, 31–36.
- Wu et al. (2020b) Li Wu, Johan Tordsson, Erik Elmroth, and Odej Kao. 2020b. Microrca: Root cause localization of performance issues in microservices. In NOMS 2020-2020 IEEE/IFIP Network Operations and Management Symposium. IEEE, 1–9.
- Xin et al. (2023) Ruyue Xin, Peng Chen, and Zhiming Zhao. 2023. CausalRCA: Causal inference based precise fine-grained root cause localization for microservice applications. Journal of Systems and Software 203 (2023), 111724.
- Xuan and Murphy (2007) Xiang Xuan and Kevin Murphy. 2007. Modeling changing dependency structure in multivariate time series. In Proceedings of the 24th international conference on Machine learning. 1055–1062.
- Yu et al. (2021) Guangba Yu, Pengfei Chen, Hongyang Chen, Zijie Guan, Zicheng Huang, Linxiao Jing, Tianjun Weng, Xinmeng Sun, and Xiaoyun Li. 2021. Microrank: End-to-end latency issue localization with extended spectrum analysis in microservice environments. In Proceedings of the Web Conference (WWW’21). 3087–3098.
- Yu et al. (2023) Qingyang Yu, Changhua Pei, Bowen Hao, Mingjie Li, Zeyan Li, Shenglin Zhang, Xianglin Lu, Rui Wang, Jiaqi Li, Zhenyu Wu, et al. 2023. CMDiagnostor: An Ambiguity-Aware Root Cause Localization Approach Based on Call Metric Data. In Proceedings of the ACM Web Conference 2023. 2937–2947.
- Yu et al. (2019) Yue Yu, Jie Chen, Tian Gao, and Mo Yu. 2019. DAG-GNN: DAG Structure Learning with Graph Neural Networks. In Proceedings of the 36th International Conference on Machine Learning (ICML’19), Vol. 97. 7154–7163.
- Zhang et al. (1996) Tian Zhang, Raghu Ramakrishnan, and Miron Livny. 1996. BIRCH: an efficient data clustering method for very large databases. ACM sigmod record 25, 2 (1996), 103–114.
- Zhou et al. (2018) Xiang Zhou, Xin Peng, Tao Xie, Jun Sun, Chao Ji, Wenhai Li, and Dan Ding. 2018. Fault analysis and debugging of microservice systems: Industrial survey, benchmark system, and empirical study. IEEE Transactions on Software Engineering 47, 2 (2018), 243–260.