Mixing of hot shocked plasma with cold gas in Nova YZ Ret 2020
Abstract
The origin of bright X-ray emission lines that appear late in a nova eruption remains largely a puzzle. We present two high-resolution X-ray grating spectra of the classical nova YZ Ret, observed 77 and 115 days post-eruption, using XMM-Newton and Chandra, respectively. Both spectra feature resolved emission lines blueshifted by km s-1 and broadened by km s-1. The two spectra are well described by a collisionally ionized plasma of eV that dimmed by a factor of between the two exposures. The spectra also show narrow radiative recombination continua (RRCs) of C+4, C+5, and N+5, indicating the interaction of the hot ionized plasma with cold electrons of eV. The high- Rydberg series of C+4 is anomalously bright, allowing us to measure the electron density through continuum lowering, which is in agreement with the He-like N+5 density diagnostic of cm-3. The high population of these high- levels constitutes the best evidence to date of charge exchange (CX) with neutral H in an astrophysical ionized plasma. The remarkable fact that the velocity and plasma temperature are the same after 38 days, despite the high density and decreasing flux is evidence for ongoing heating. We suggest the heating is due to a reverse shock in the nova ejecta, which forms a thin X-ray shell. The narrow RRCs and CX are attributed to direct mixing with cold gas, which overtakes the hot plasma either from the shock front, or through the contact discontinuity.
1 Introduction
Classical and recurrent novae are interacting binary systems hosting a white dwarf (WD). Their eruptions are attributed to a thermonuclear runaway (TNR) in the atmosphere of the WD, which has been accreting material from its binary companion. Models predict that TNR is followed by a radiation driven wind, which depletes the accreted envelope (Starrfield et al., 2012; Wolf et al., 2013), or by a wind originating in the common envelope, most likely because of double Roche-lobe filling (see Shen & Quataert, 2022).
Novae eruptions are luminous at all wavelengths, from -rays to radio. X-rays specifically provide an important window to understand their physics. Early in the nova eruption, the X-rays are attributed to powerful shocks in the outflow. Line-resolved X-ray grating spectra have been successfully described by collisional ionization steady-state models (see the discussions in Orio, 2012; Drake et al., 2016; Peretz et al., 2016; Orio et al., 2020; Chomiuk et al., 2021). However, transient states occur early in the eruption (Orio et al., 2023; Islam & Mukai, 2023). Nova shocks are powerful enough that they can produce -ray emission (Franckowiak et al., 2018), of either leptonic (e.g., inverse Compton off of accelerated electrons) or hadronic origin (proton interactions producing neutral pions that emit -rays as they decay).
After a few days to almost a year, most novae transition to the supersoft phase, where the X-ray luminosity can exceed 1038 erg s-1 (Eddington level for 1 M⊙), with all the flux emitted below 0.8 keV (see review by Orio, 2012). This happens because the WD atmosphere contracts at constant bolometric luminosity, so that the effective temperature keeps on increasing and the peak wavelength of the emission moves from the optical range, to the UV and extreme UV, and eventually to the soft X-rays within weeks. The source continues to be powered by shell burning. The central source appears as a thermal continuum X-ray supersoft source (SSS), with a peak temperature up to K, for a time lasting from days to a few years (Yaron et al., 2005). The more massive the WD, the shorter is the SSS phase (Yaron et al., 2005; Starrfield et al., 2012; Wolf et al., 2013).
The 2020 nova YZ Ret discussed in this paper appeared to follow the trend of brightening and softening, as expected in the emergence of the SSS, however the X-ray luminosity remained much below the level of other novae (e.g. Orio et al., 2022). When the high resolution X-ray observations were triggered, quite surprisingly only an emission line spectrum was observed, with no sign of the WD continuum (SSS) (Sokolovsky et al., 2022). The SSS could be obscured by an accretion disk, indicating a high inclination system (Ness et al., 2013). In this paper, we analyze and discuss the puzzling X-ray spectra of the nova, at X-ray maximum flux and during the decay phase.
1.1 Nova outburst of YZ Ret
Nova YZ Ret nova erupted in a known binary with a WD. For a summary of previous observations, see Sokolovsky et al. (2022). It was discovered in outburst at 5th magnitude on 2020 July 15, and the optical maximum was later discovered to have occurred on 2020 July 11 at 3.7 mag (Kaufman et al., 2020). Hence, YZ Ret became visible with the naked eye and the second-brightest nova in a decade. Optical spectroscopic follow-up confirmed it to be a nova (Aydi et al., 2020). Kaufman et al. (2020) described the spectrum after the onset of the eruption as that of a Fe II-type nova (according to the classification scheme of Williams, 1992), but Carr et al. (2020) reported a He/N-type on later days. There is now a common understanding that these are successive phases in the spectral evolution of novae (Aydi et al., 2023). From an overabundance of oxygen and prominent UV emission lines in the UV, Izzo et al. (2020) concluded that the nova erupted on an ONe WD. However, we find no oxygen in the X-ray spectrum.
An X-ray flash detected from YZ Ret immediately after the outburst was ascribed to the fireball phase, namely an early SSS phase of a few hours, when the nova is still undergoing the TNR (König et al., 2022). YZ Ret was detected in -rays (0.1-1 GeV) with Fermi-LAT, and in hard X-rays (3-79 keV) with NuSTAR, during its first two weeks. Sokolovsky et al. (2022) fitted the X-ray broad band spectra with unusual abundances from their model, namely a collisionally-ionized plasma either deficient in iron or overabundant in oxygen and nitrogen. They also showed the XMM-Newton high resolution grating spectrum, which is the focus of the present paper, but did not analyze it.
YZ Ret was classified as a VY Scl system (Sokolovsky et al., 2022, and references therein). VY Scl binaries were defined by Honeycutt & Kafka (2004) as cataclysmic variables undergoing fading of the optical light by 1.5 to 7 mag over less than 150 days, and these states recur over timescales from weeks to years. In the more common high state, VY Scl binaries have large optical and UV luminosity. This is interpreted as evidence that most of the time mass transfer onto the WD occurs at a rate M⊙ yr-1, necessary to sustain an accretion disc in a stable hot state in which dwarf novae outbursts are suppressed. The low states have been attributed to a sudden drop of from the secondary, or even to a total cessation of mass transfer (King & Cannizzo, 1998; Hessman, 2000), perhaps due to spots on the surface of the secondary covering the L1 point (Livio & Pringle, 1994) or non-equilibrium of the irradiated atmosphere of the donor (Wu et al., 1995). Monitoring the X-ray emission of a few of these peculiar binaries, Zemko et al. (2014) ruled out non-explosive thermonuclear burning.
The observations included in this article were triggered after Swift XRT monitoring showed the emergence of a soft and luminous object, with the aim of studying the WD emission in the SSS phase. It was soon realized from XMM-Newton (Sokolovsky et al., 2022) and NICER spectra (Orio et al., 2022) that the X-rays from YZ Ret cannot be attributed to the WD. Detecting such soft X-ray flux from Galactic novae is not often possible due to Galactic column densities of cm-2. However, YZ Ret is at a Galactic latitude of , with a low column density of only cm-2 (Kalberla et al., 2005). The distance to the nova is fairly well determined with GAIA, as kpc (Bailer-Jones et al., 2021), which allowed to estimate its X-ray luminosity at a few erg s-1. Indeed, this is an order of magnitude smaller than even the least luminous SSS-WD (generally, few 1036 erg s-1 to few 1038 erg s-1, Starrfield et al., 2012).
The two high resolution observations presented here confirm X-ray line emission with no photospheric SSS whatsoever. The SSS, thought to be the smoking gun of nuclear burning, has not been observed also in a few other novae and non-outbursting WD-SSS. Ness et al. (2013) explained the missing SSS with a non-disrupted (or quickly rebuilt) accretion disk in systems with high inclination. Notwithstanding, and as we show in the following sections, the spectra of YZ Ret are like no other, providing unprecedented insights into the atomic processes of shocked novae outflows. We describe the observations in Sec. 2, the spectral diagnostic methods in Sec. 3, and their rich application to the spectra in Sec. 4. In Sec. 5 we report global fits to the spectra. We discuss all of the results in Sec. 6 and list our conclusions in Sec. 7.
2 Observations
YZ Ret was monitored in outburst with the Swift X-ray Telescope (XRT, Burrows et al., 2005) over 155 days with a cadence that ranged from every 2 days to weekly monitoring. Two X-ray gratings observations of YZ Ret were triggered 77 and 115 days after the eruption; the first observation with the XMM-Newton Reflection Grating Spectrometers (RGS, den Herder et al., 2001), and the second one with the Chandra Low Energy Transmission Grating (LETG, Brinkman et al., 2000).
2.1 Swift XRT lightcurve
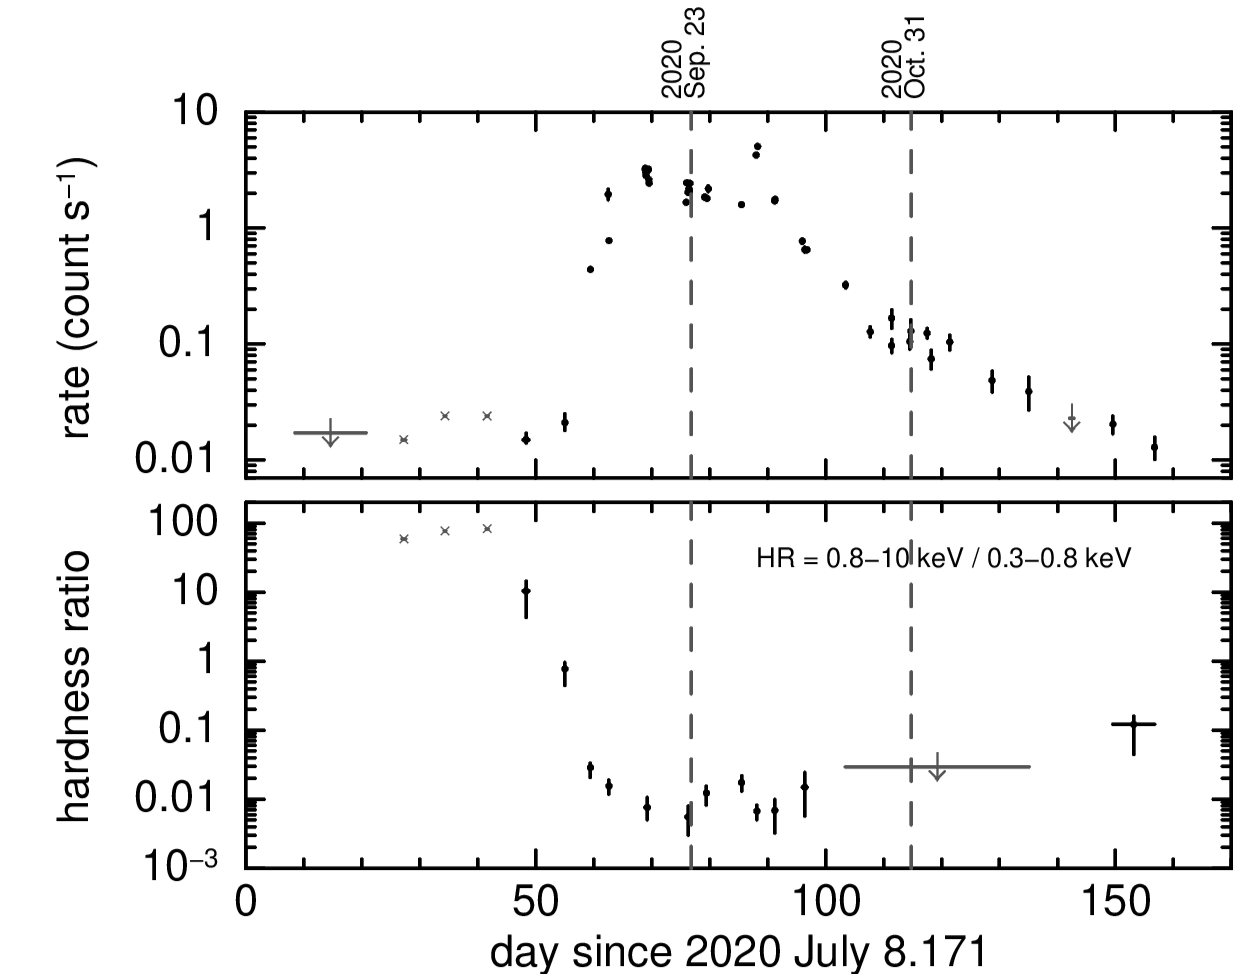
Fig. 1 shows the XRT lightcurve featuring a rapid increase in count rate and a rapid decrease in hardness after day 50. At about day 90 the count rate started decreasing monotonically until day 160 when monitoring stopped. The RGS observation at day 77 caught the nova close to its highest state, while the LETG observation was carried out when the XRT count rate was more than an order of magnitude lower. Both grating spectra show a rich emission-line spectrum with no obvious continuum.
2.2 XMM-Newton/RGS spectrum
Nova YZ Ret was observed with XMM-Newton 77 days after the initial eruption, between 2020-09-23 13:36 and 2020-09-23 21:22 UT (ObsID 0871010101; PI: K. Sokolovsky) for a total exposure time of 28 ks. The Swift XRT count rate during that week was around 2 cts s-1, already close to its maximum. We use both RGS1 and RGS2 first-order spectra in the wavelength range of 5–37 Å, corresponding to the 0.33–2.5 keV energy range. We extracted the spectra with the XMM-SAS (XMM Science Analysis System) version 19.1111https://xmm-tools.cosmos.esa.int/external/xmm_user_support/documentation/sas_usg/USG.pdf rgsproc task. Periods of high background were rejected. As explained in detail in Sokolovsky et al. (2022), we corrected the RGS spectra for pile up. Fig. 2 shows the spectra observed with RGS1 and RGS2.
2.3 Chandra/LETG spectrum
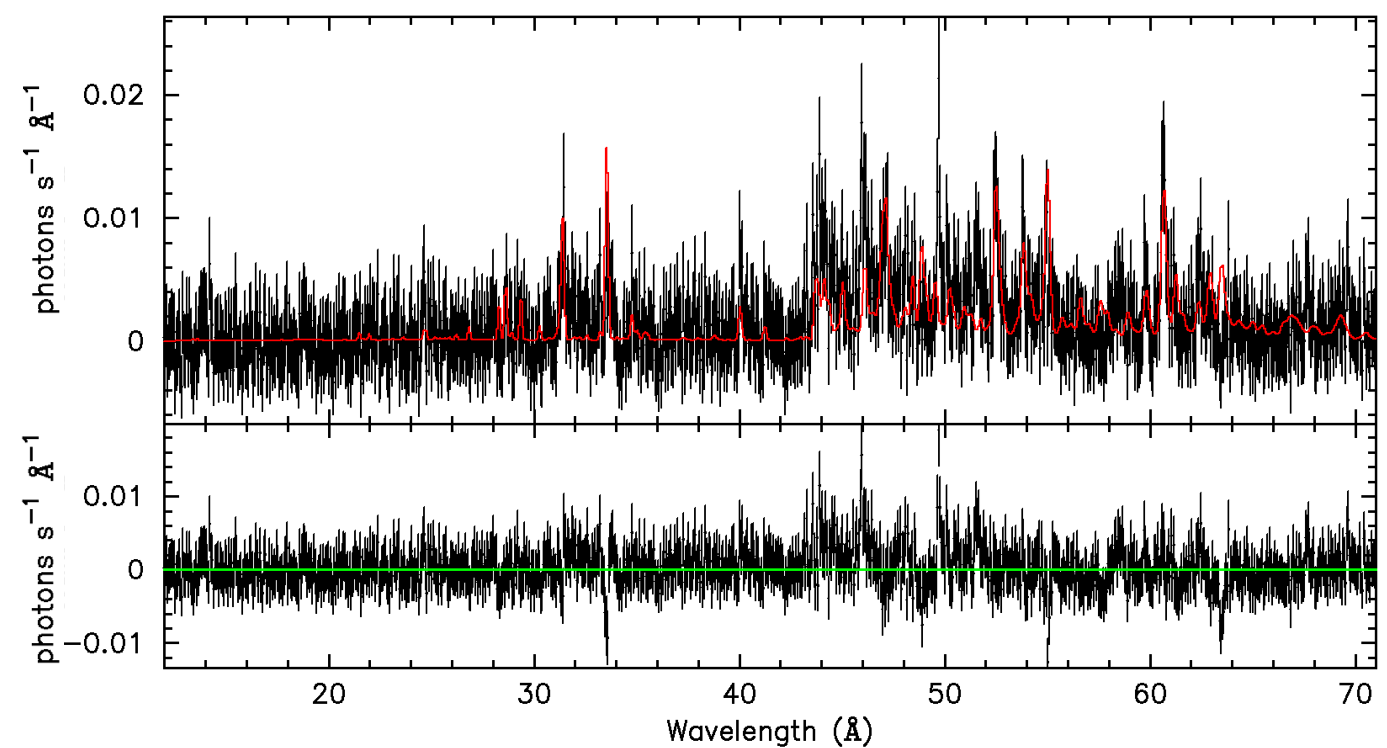
YZ Ret was observed with the Chandra LETG on 2020-10-31 for 31 ks. At the time of the YZ Ret eruption, the High Resolution Camera (HRC) aboard Chandra was not available in its HRC-S configuration, which is usually used with LETG (up to 175 Å). Instead, we used the HRC-I configuration to obtain a spectrum between 1.2 and 71 Å. The data were extracted with the Chandra CIAO data analysis package version 4.14.1 and the first-order grating redistribution matrix files and ancillary response files, using the CIAO task chandra repro, with version 4.8.5 of the calibration package CALDB. We summed the positive- and negative- first order spectra with the combine grating spectra CIAO task, to increase the signal-to-noise ratio (S/N). We did not correct for the higher spectral orders, which have a negligible contribution. YZ Ret is by far fainter during this epoch than during the XMM-Newton observation. Fig. 3 shows the LETG spectrum.

3 Diagnostic methods for high resolution spectra
In order to properly model the rich line resolved spectra, we employ a collisional-radiative (CR) model. Assuming the ions are collisionally-ionized, excited by electrons, and in steady-state, the model computes level populations, and predicts the emission spectral line intensities (in units of ph s-1cm-3) associated with each transition between bound levels and () at the source
| (1) |
where (cm-3) is the number density of ions in level and (s is the Einstein coefficient for spontaneous radiative decay. The level populations generally depend on electron density and temperature . At sufficiently high density, electron impact transitions between excited levels can change the relative populations ( in Eq. 1), hence the density sensitivity and diagnostics. The populations of all levels of a given ion are obtained by solving rate equations that include all of the processes that populate and depopulate each level (Mitrani & Behar, 2023). Here, we add ionization and recombination processes. The atomic structure and coefficients were computed using the relativistic Hebrew University Lawrence Livermore Atomic Code (HULLAC, Bar-Shalom et al., 2001).
3.1 Narrow Radiative Recombination Continua (RRCs)
3.1.1 Diagnostics
The free-bound transition of a plasma electron recombining with an ion emits a photon with an energy that equals the kinetic energy of the electron plus the ionization energy (of the recombined species). The emitted photons delineate the energy distribution of the electrons in the plasma, e.g., a Maxwell-Boltzmann (MB) distribution. Since the emitted photons have a sharp minimum energy of , the radiative recombination continuum (RRC) features a sharp edge at this energy, and usually a MB distribution thereafter:
| (2) |
where is a flux normalization factor.
In hot plasmas ( K), the RRC is significantly broadened by the temperature, and is hard to discriminate from other continuua, primarily bremsstrahlung. When the plasma is colder ( K), narrow RRCs can be discerned in the spectrum, and their width provides exquisite diagnostics. Narrow RRCs are routinely observed in photoionized plasmas (Liedahl & Paerels, 1996; Kinkhabwala et al., 2002), where the electrons remain cold despite the high-energy ionizing photons and the high ionization degree of the plasma. However, narrow RRCs were also observed in a few hot, shocked X-ray sources, where no photo-ionizing continuum was observed nor expected (Schild et al., 2004; Nordon et al., 2009; Yamaguchi et al., 2009). In nova V4743 Sgr, a bright C+4 RRC was observed during the obscuration of the SSS (Ness et al., 2003, Fig. 4 therein), but not identified.
3.1.2 High- Rydberg Series
When the RRC is sufficiently bright and narrow, and the resolution of the spectrometer sufficiently high, one can hope to resolve the Rydberg series of high- (principal quantum number) emission lines converging onto the RRC. We are aware of one such observation to date (Nordon et al., 2009), and the second one is the present RGS spectrum of YZ Ret. If observed, this line series enables an interesting density diagnostic. The branching ratio for radiative decay from high- levels, e.g., to the ground level (i.e., the observed X-ray line) is suppressed by collisional ionization, for which the rates increase with . Thus, at some value, ionization dominates over line emission and the series is truncated. This effect of continuum lowering is known since the early days of quantum mechanics (Dewey & Robertson, 1928; Inglis & Teller, 1939). Since collisional ionization rates () increase with and radiative decays () do not, the observed , or equivalently the effective widening of the RRC edge, is a sensitive diagnostic of :
| (3) |
High- levels are broadened by the Stark effect, which depends strongly on the plasma (ion) density. This makes the high order lines blend with the RRC above some that depends on ion density, assumed to be . Inglis & Teller (1939) give the following expression for the dependence of density on in the Stark effect:
| (4) |
where cm is the Bohr radius.
3.2 He-like lines
The most common density diagnostic X-ray lines are those of the so-called He-like triplets, whose relative intensities depend on the density and temperature of the plasma (Gabriel & Jordan, 1969). The three transitions from the 1s2s, 1s2p3/2, and 1s2p1/2 levels to the ground level 1s are referred to, respectively, as the forbidden (), intercombination (), and resonance () lines. The 1s2s level is a meta-stable level with a relatively long life time. Hence, the line ratio
| (5) |
is sensitive to in a defined range where collisional de-excitation rates are comparable to the (low) decay rate from that level. These density ranges in He-like ions increase with the atomic number, as increases with the nuclear charge (Gabriel & Jordan, 1969). Using the CR model we compute the expected ratios as a function of , and infer the density by comparing with the measured ratio.
3.3 Emission Measure
The emitted flux from an optically thin uniform plasma is proportional to the emission measure where (cm-3) is the hydrogen density, and (cm3) is the volume of the emitting plasma. An can be obtained directly from discrete features, in this case the RRC photon luminosity , where is the RR rate coefficient, and is the number density of the recombining ion . Since , the photon flux can be written as:
| (6) |
where is the ion fraction, is the elemental abundance, and is the distance to the source. In a hot collisionally-ionized plasma, where all photons are emitted following electron-ion collisions, the photon flux is exactly proportional to the . Thus, by measuring the flux, one obtains the . In the Xspec (Arnaud, 1996) model we use in Sec. 5 (bvapec, Smith et al., 2001), is parameterized by:
| (7) |
Once is known, and the density is measured, the reveals the emitting volume .
4 Analysis of XMM-Newton RGS spectrum
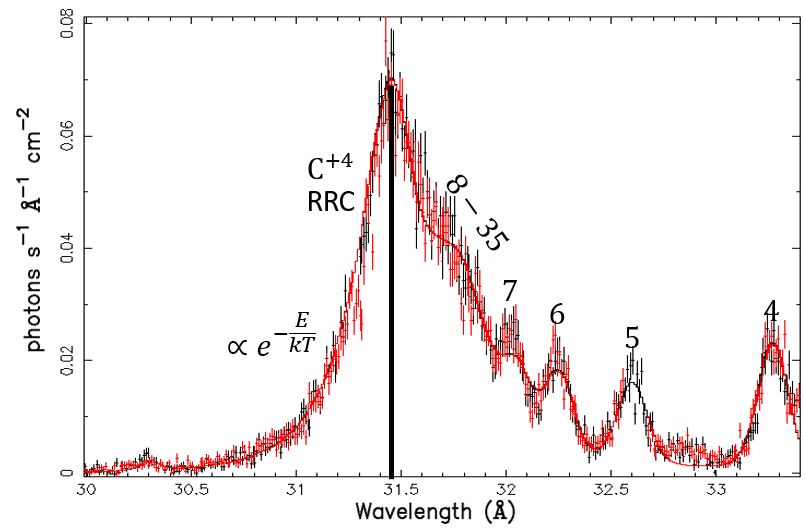
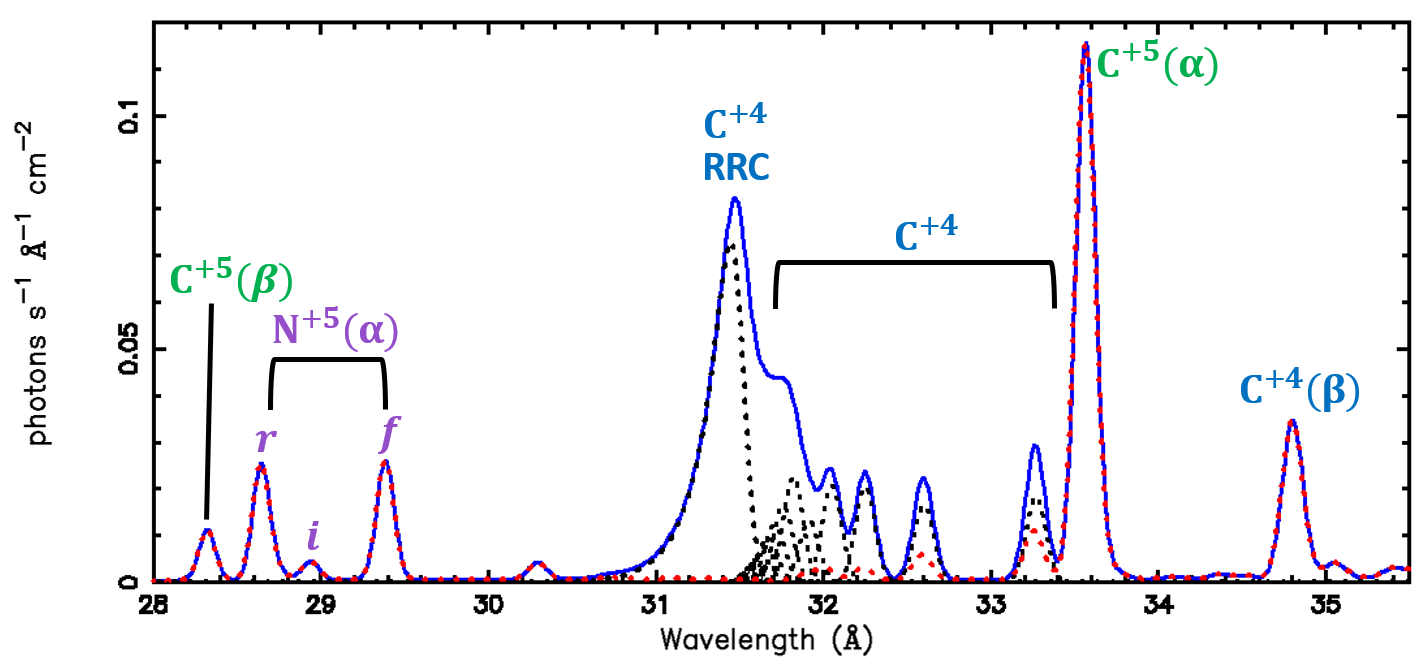
The RGS spectrum allows us to derive the temperatures, densities, and EM of the X-ray source at day 77. The Lyman, and He series of C+5 and C+4, as well as that of N+5, are clearly identified, all blueshifted from their laboratory wavelengths. The predominant feature in the spectrum is the narrow RRC of C+4 around 31.5 Å, which is broadened and asymmetric due to the electron temperature on the short-wavelength side, and the high- lines on its long-wavelength side. Similar but much fainter features are the narrow C+5 and N+5 RRCs observed around 25.2Å and 22.3Å, respectively. The He-like triplet of N+5 is observed around 29Å, and the He-like triplet of C+4 is at 40Å outside the RGS band.
4.1 C+4, C+5 and N+5 RRCs
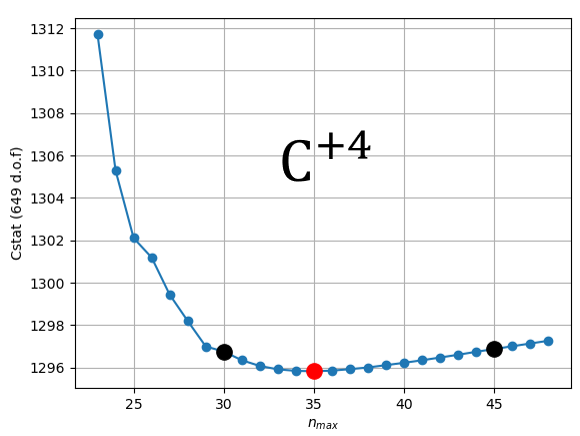
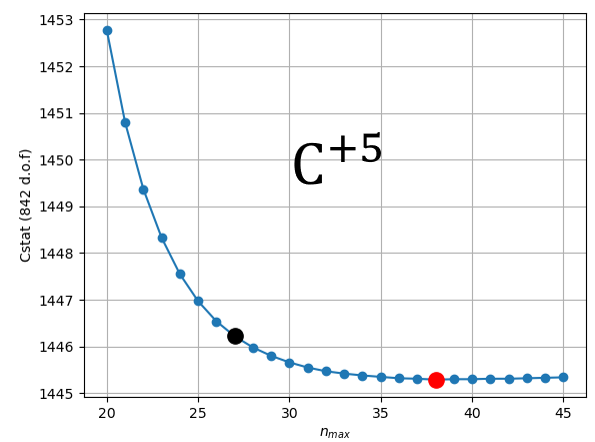
A zoom into the C+4 RRC region between 30-33.5 Å is shown in Fig. 4, with the bright RRC blueshifted by km s-1 and peaking at 31.45 Å. We modeled this region with an RRC (Eq. 2) and a series of gaussians representing the Rydberg series. The RRC model provides a temperature measurement of = eV. The series of unresolved C+4 lines are fixed to the theoretical wavelengths of the to transitions, and their Gaussian width to that of the global fit km s-1 (Sec. 5). Line intensities for are scaled as , to follow the hydrogenic scaling of the Einstein coefficients. This is a good approximation for high- levels, which are populated according to the Boltzmann distribution, and their close proximity implies comparable populations. The best fit to the spectrum is obtained when the highest level transition is . In Fig. 5 (left panel), we plot the Cstat () fitting parameter as a function of , which demonstrates that corresponds to . Performing the same fit with yields with 90% confidence.
In order to measure from , we need to scale and with (see Eq. 3). We extrapolated the HULLAC values for according to , (Lotz, 1968), which implies (c.f., Eq. 3):
| (8) |
The inferred from is cm-3. Such high densities occur either in the dense blobs of ejecta, or in the accretion disk. Similarly high density has been found in Chandra X-ray grating spectroscopy of nova V959 Mon (Peretz et al., 2016).
The same diagnostics were applied to the C+5 RRC, which is observed at 25.2Å. The short-wavelength exponential profile yields a temperature measurement of eV, consistent with the C+4 temperature. The long-wavelength side of the C+5 RRC was fitted with a high- levels series of Gaussians as the C+4 RRC yielding . Fig. 5 (right panel) shows that can only be constrained from below . Using Eq. 8 we infer a density of cm-3 (upper limit), with a best fit of cm-3.
The same procedure was applied to the N+5 RRC, which only provides an upper limit of eV. The low flux of the N+5 RRC does not allow fitting of the high- series and thus, no density diagnostic.
Interestingly, if we plug in the best constrained from C+4 into the Stark-broadening density diagnostic (Eq. 4), we obtain cm-3, which is within the uncertainties of the collisional continuum lowering estimate of Eq. 8. In summary, the RRCs of YZ Ret at day 77 indicate the presence of eV electrons with an electron density in the range of cm-3.
4.2 Charge Exchange
How exactly the high- levels get so highly populated in YZ Ret and their lines so intense is an intriguing question. In fact, to the best of our knowledge, such a spectrum of C+4 has never been observed, including not in the laboratory. The high intensity of high- lines is a smoking gun of charge exchange (CX). However, due to energy conservation, CX is highly selective in its population of excited levels. C+5 exchanging charge with a neutral H atom, both in the ground state, results primarily in C+4 ions in the levels, with levels being appreciably less populated (Nolte et al., 2012). High collision velocities could result in somewhat higher levels, but equal fluxes of lines and beyond as observed in Fig. 4 can not be explained by a high velocity alone. Conversely, CX with excited H atoms (or of excited C+5 in the initial state) requires much less energy to pull out the bound electron, and thus can end in higher- levels of C+4 (e.g., Janev & Winter, 1985). Since excited levels are close to each other, CX with H in (multiple) excited levels will populate a broader distribution of C+4 high- levels, as observed here.
We therefore suggest CX in YZ Ret is occurring with excited H. At the measured electron density in the ionized gas of cm-3, levels would be populated to 0.2% of the ground level. We have no measure of the neutral gas density, which could be denser than the ionized one. We conclude that the high- lines of C+4 in the RGS spectrum of YZ Ret feature the first unambiguous, and most conspicuous evidence for CX in an astrophysical plasma (at least aside from the solar wind). Moreover, CX is completely in line with the observation of highly charged ions mixing with cold gas, as evident also by the RRCs.
4.3 He-like N+5 lines
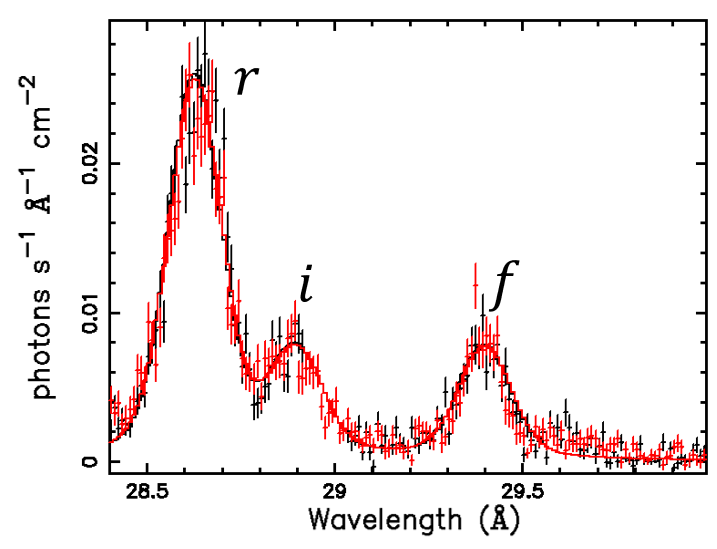
In this section, we perform a direct measurement of the N+5 He-like line intensities, in order to infer the density of the plasma by using Eq.5. Fig.6 shows the three observed spectral lines of He-like N+5, fitted with three Gaussians. The measured wavelength and flux of each line is presented in Table. 1, and the measured ratio is (Eq. 5). The average blueshift of the three lines is km/s, which is slightly higher than the global fit value in Sec. 5. The discrepancy can be due to an asymmetry of the line, and 1s satellite lines that blend with the N+5 lines, mostly the line, similar to the satellites of C+5 at 33.85Å (Sec.4.4).
We solve the rate equations (Sec. 3) to obtain the theoretical ratio at =2 eV (the cold recombining plasma component described in Sec. 4.1) and at 70 eV (the hot plasma component described in Sec. 5) to cover the expected temperature range. The computed ratio as a function of is presented in Fig. 7. The measured value of indicates cm-3, and cm-3 for 2 eV and 70 eV, respectively. If satellite lines indeed blend with the line, is likely higher and the density is slightly lower (Fig. 7). The density for 2 eV is consistent with the value we obtained from at the RRC cm-3, and a factor 3 higher than the 70 eV value. The above measurement does not include photo-excitation (PE) because there is no observed continuum in the YZ Ret spectra.
We check whether the gas may be photo-ionized and PE processes could dramatically change our density measurement. The unobserved ionizing source we hypothesize is a continuum black body with a temperature of =50 eV and a luminosity of erg s-1, high but typical for a SSS. In photo-ionization steady state, the PE flux and are related through the ionization parameter , where is the distance from the ionizing source to the emitting plasma. N+5 typically forms at erg s-1cm (Kallman et al., 2009). Adding PE processes slightly reduces the density by 20%; at eV, cm-3. erg s-1cm then implies cm. The outflow moving at 1500 km s-1 will reach a much larger distance at its observed age of 77 days. In addition, the second observation by Chandra shows the outflow at a similar ionization degree, which would be different if it moved away and was photo-ionized by the same SSS flux (see discussion in Sec. 6).

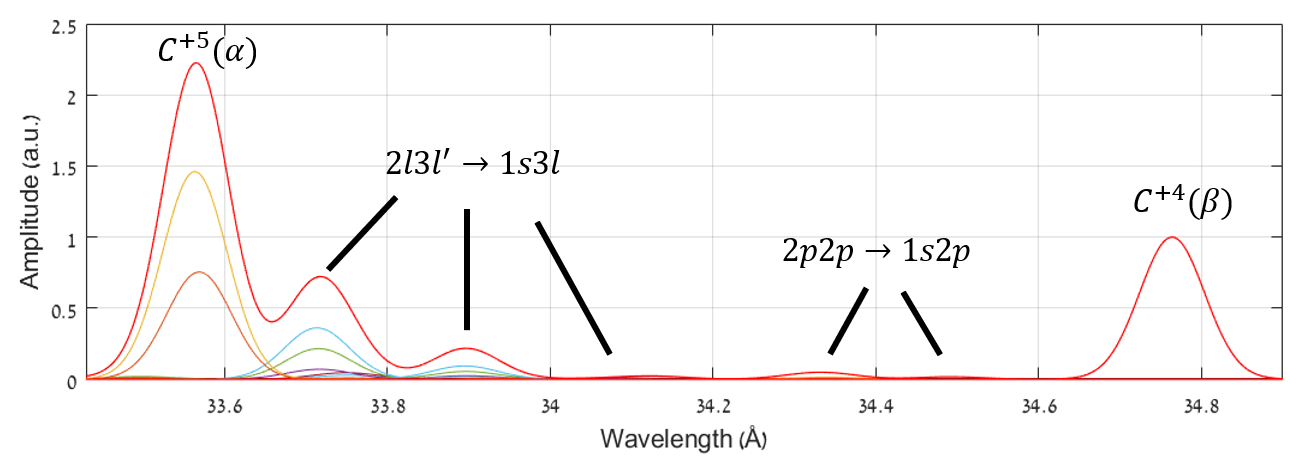
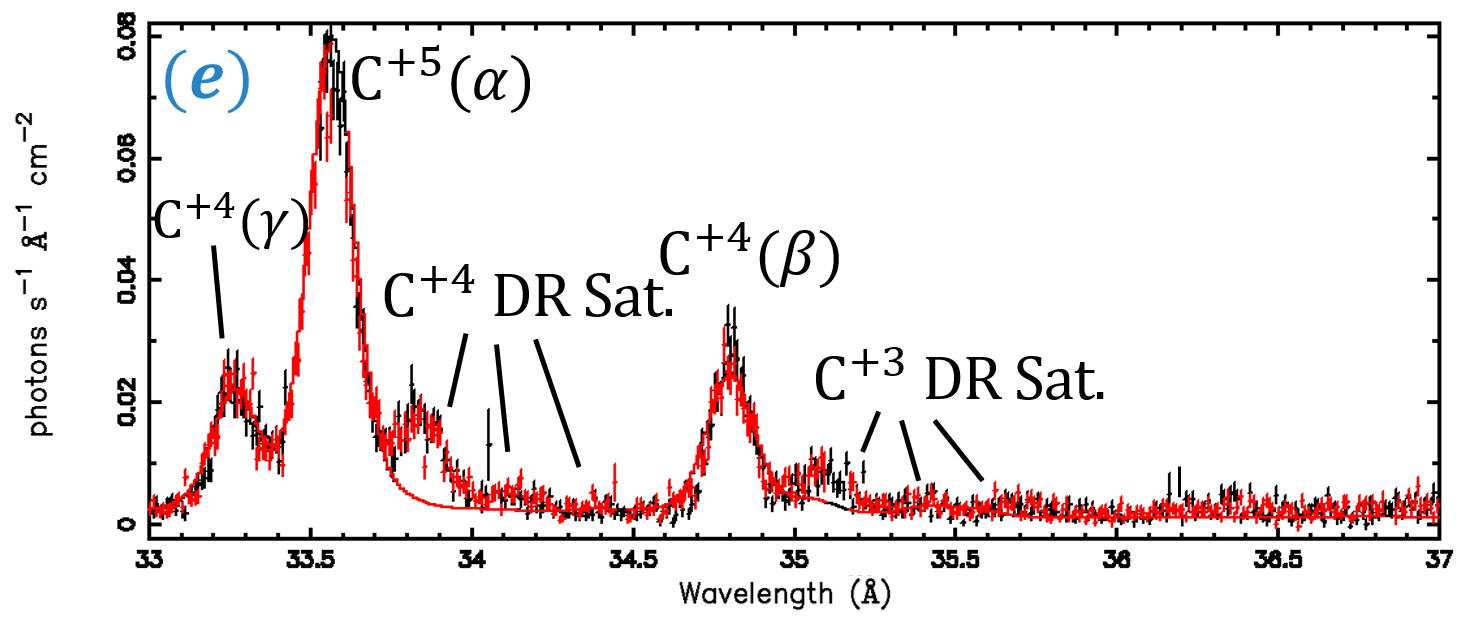
4.4 Dielectronic recombination satellites
Prominent dielectronic recombination (DR) satellite lines of C+4 between 33.8-34.4 Å, and of C+3 between 35-35.8 Å are observed in the RGS spectrum of YZ Ret (Fig.8, panel (e) of Fig. 11). These lines exist in the hot collisional component (bvapec), but are by far weaker than the observed intensities. The same DR satellites are seen in laboratory plasma, such as laser-produced plasma (Seely et al., 1981), where the electron density exceeds cm-3. In that case, one observes 1s-2p transitions produced by the 2p and 2p doubly excited levels decaying to 1s, at wavelengths above and below 34 Å, respectively (c.f. Fig.3 in Seely et al., 1981). In contrast, in the present YZ Ret spectrum, is much lower, and the lines are much brighter than the dim lines (Fig. 8). These DR satellites are all about 300 eV above the 1s continuum (see energy diagram in Fig. 9, left panel). Therefore, as the temperature approaches eV, which is sufficient for dielectronic capture, they should all be populated, and appear in the spectrum. The weakness of the 2l DR resonances above 34 Å in the YZ Ret spectrum compared to the bright 2l ones just below 34 Å beg for an explanation.
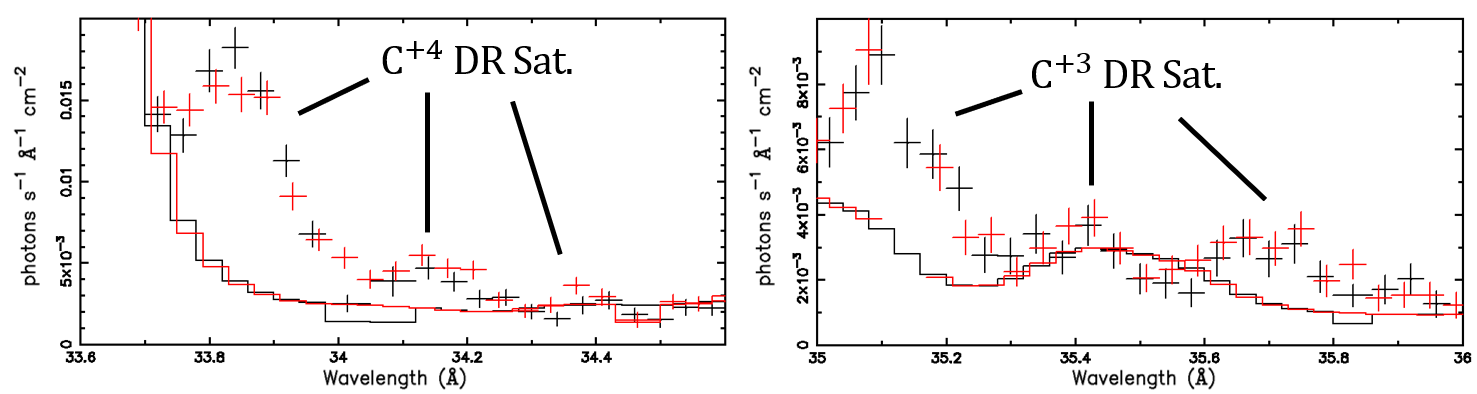
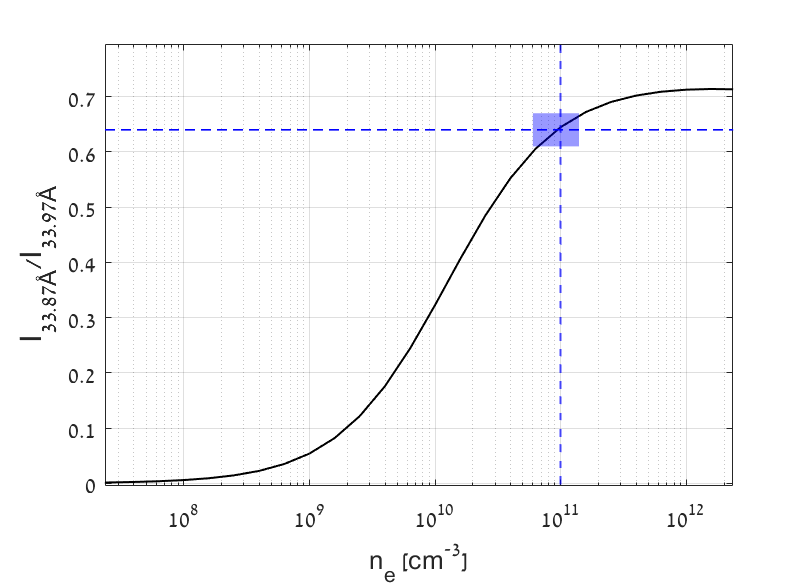
The peculiar satellites intensity ratios can be explained by a different mechanism than DR, which is selective PE photo-pumping from the 1s levels to the levels, by the intense C+4 RRC flux in the narrow band of 392-420 eV (29.5-31.6 Å, Fig. 11, panel (d)). This selective photo-pumping to explains why the lower levels are not populated (Fig. 9, left panel). For this mechanism to operate, the 1s levels need to be sufficiently populated, namely needs to be sufficiently high. At a density of cm-3, the 1s2s (J=1) excited level is populated to 0.2% of the ground level by CE processes, to be subsequently photo-excited to the doubly excited levels. The density dependence of the population of this level provides another diagnostic, pointing yet again to cm-3, see right panel of Fig. 9. The diagnostic was done with the line ratio of 33.87Å(satellite)/33.97(C), but it’s not exclusive to the C line. The ratio of the satellite line to C+5 Ly can also be used as a density diagnostic, because the density affects the population of the 1s2l (for C+4) and 2l (for C+5) in a similar way. The correct line ratios are obtained in our model for a density of cm-3, in agreement with the density measurements in Sections 4.1, 4.3.
The resulting synthetic spectrum of the eV CR model is shown in Fig. 10. The model includes the DR of C+5 via the doubly excited and configuration complexes, with an addition of photo-exciting flux, with the spectrum of the cold C+4 RRC between 392-420 eV. The spectrum in Fig. 10 was computed at cm-3, and matches the intensities of the satellite lines observed in YZ Ret.
The presence of a strong satellite line at 33.87 Å, along with the absence of strong matching satellite lines at 33.5 Å and 33.67 Å (rest frame) thus shows an interaction between the hot (70 eV) and cold (2 eV) components of the plasma. The RRC photon flux that is required for PE by the CR model in order to produce the correct intensities of the satellite lines is ph s-1 cm-2. From the distance to YZ Ret of cm away (Bailer-Jones et al., 2021), we know the RRC luminosity . If this was a point source, the distance from it at which ) is cm. This small distance is consistent with the physical picture of a thin shock-heated layer that is discussed in Sec. 6.2, where the ions mix with the cold electrons.

4.5 Volume and mass of the emitting plasma
In this section, we use the best-fitted fluxes of the (mixed) cold (RRCs) and hot (Sec. 5) plasmas listed in Table 2, to infer their volume from the density measurement (Eqs. 6, 7). In all the calculations, we use a distance to YZ Ret of cm (Bailer-Jones et al., 2021), a solar carbon abundance of (Wilms et al., 2000), and the density value we obtained in Sec. 4.3, cm-3.
For the cold plasma, we use the radiative recombination rate coefficients at 2 eV, cm-3 s-1 and cm-3 s-1 (computed by HULLAC) in Eq. 6 to obtain cm3 and cm3. If we assume the C+4 and C+5 RRCs are emitted from the same volume, then we can infer the ion fraction ratio , meaning the carbon in the plasma is dominated by the C+5 ion (), which is consistent with the ionization balance of a hot plasma at a temperature of eV. Finally, we obtain a volume of cm3.
The volume of the hot plasma (bvapec model) is obtained from Eq. 7, by assuming the standard density ratio for a fully ionized, solar abundance plasma. If the hydrogen abundance is different than solar, one needs to introduce a correction factor (Leahy et al., 2023). We obtain cm3, which is consistent with , again lending to the notion that the hot and cold plasmas are mixed. Given the volume and density, we can estimate the mass in the X-ray source as , where is the mean atomic mass in the plasma, being the proton mass. This estimate yields , which is fitting for such a low luminosity source. In Sec. 6 we show that the mass outflow rate is normal, but that the short cooling times leave only a small mass of hot gas at any given time.
5 Global fitting
5.1 XMM-Newton/RGS
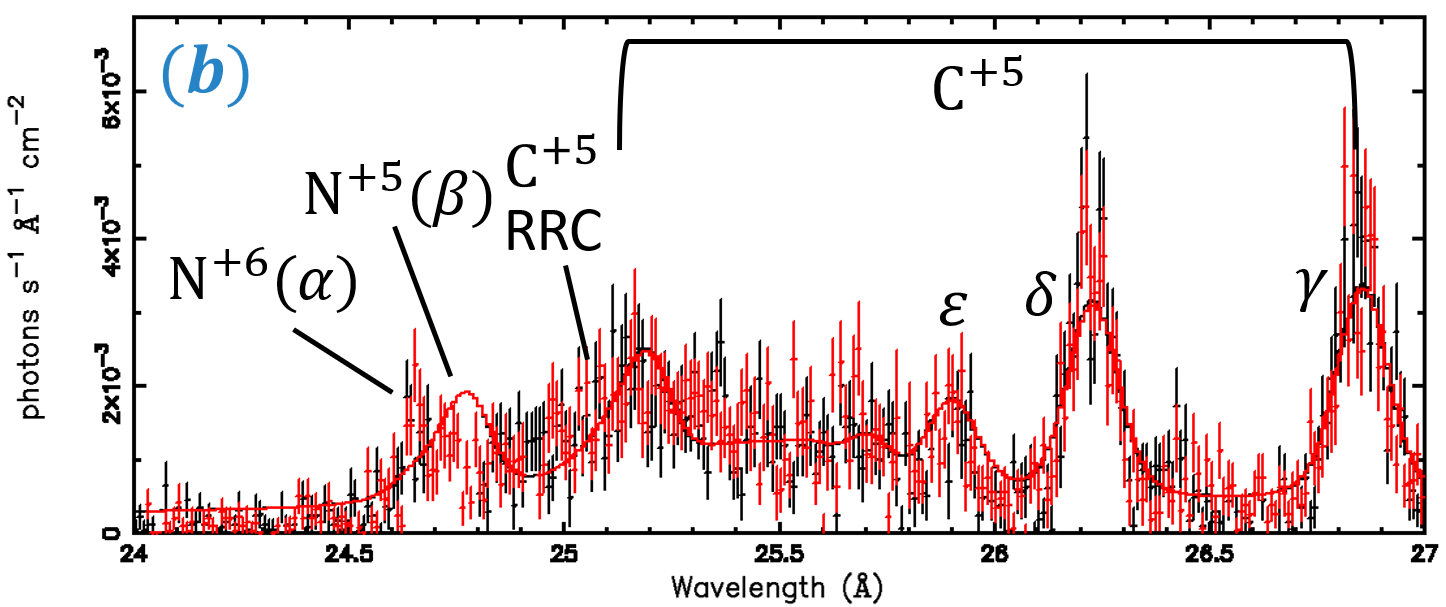
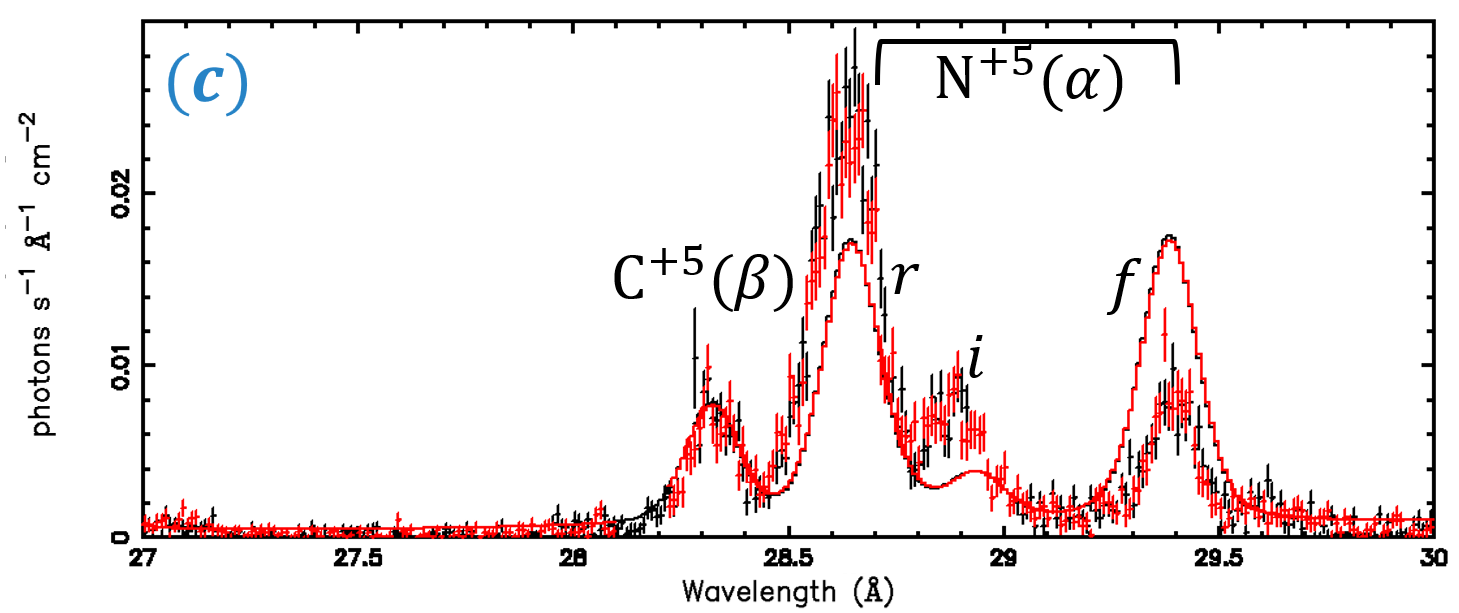
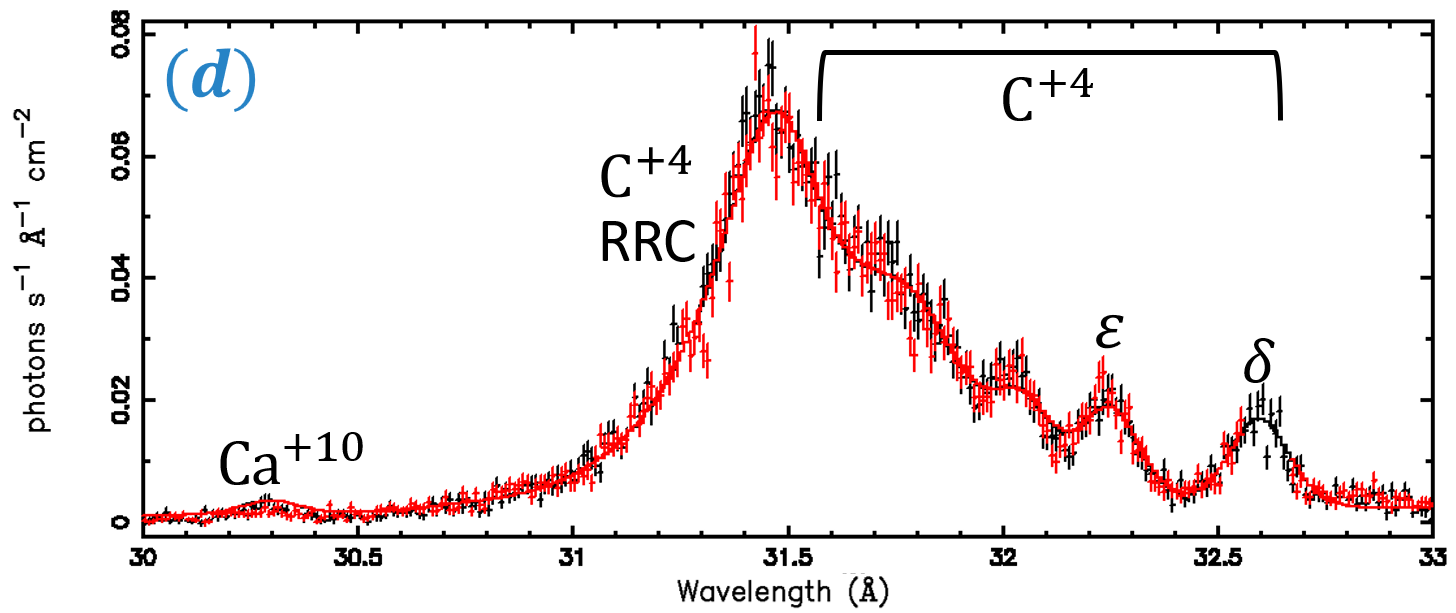
We zoom into the XMM-Newton RGS spectrum (Fig. 2) with five panels in Fig. 11. The best-fitted model (solid line in the figure) is a low-density, collisionally-ionized plasma model with varying abundances. The C abundance is set the unity. This is complemented by the RRCs and high- line series of Sec. 4.1. In Xspec (Arnaud, 1996), the bvapec component (Smith et al., 2001) represents an outflowing ( km s-1) collisionally ionized plasma at eV, with lines kinematically broadened by km/s. Three redge components represent the colder eV RRCs of C+4, C+5, and N+5. The series of agauss Gaussian lines represent the high- lines converging to the C+4 and C+5 RRCs (Sec.4.1). The model also includes a Galactic absorption tbabs component with cm-2 (Kalberla et al., 2005).
The hot plasma model (red dotted line in Fig. 12) tightly constrains the outflow velocity and plasma temperature, yields the abundances of N, Ca, and provides an upper limit for the O abundance (see Table 3). However, it cannot produce the RRCs, the high-order line series (black dotted lines in Fig. 12), or the DR satellite lines. More specifically, the observed intensities of the Lyman and Helium line series of C+5 and C+4 are by far stronger in the spectrum than their hot-plasma values, starting already from () and up to much higher and unresolved values. These series can be seen in panels (b) and (d) of Fig.11, where the hot plasma model has been appreciably enhanced with a series of Gaussians as in Sec. 4.1. The DR satellites of C+4 and C+3 are observed, respectively, between 33.8-34.4 Å and between 35-35.8 Å (panel (e) of Fig.11), and are also not nearly as strong in the model. These lines are calculated separately in Sec. 4.4 (Fig. 8). Finally, the relative intensities of the He N+5 lines observed between 28.6-29.4 Å (panel (c) of Fig.11) and of He at 24.76 Å (panel (b) of Fig.11) are inconsistent with the model intensities, due to its low density approximation (Sec.4.3).
5.2 Chandra/LETG
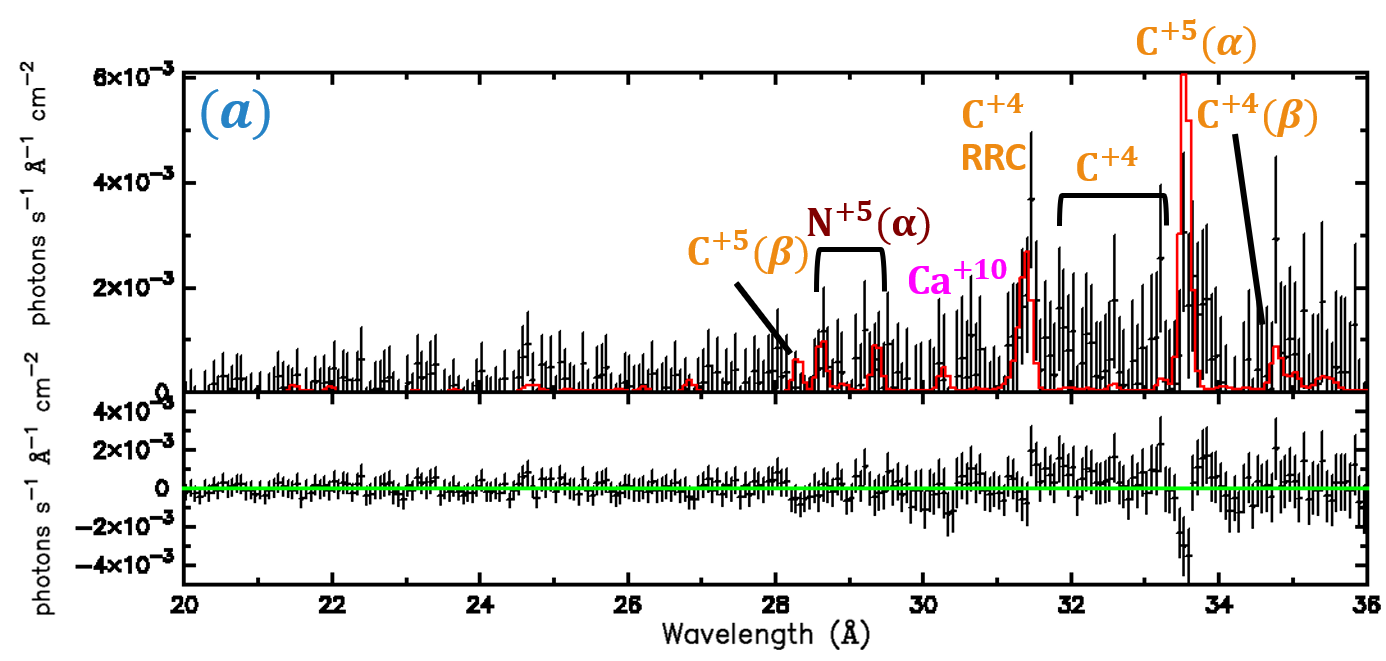
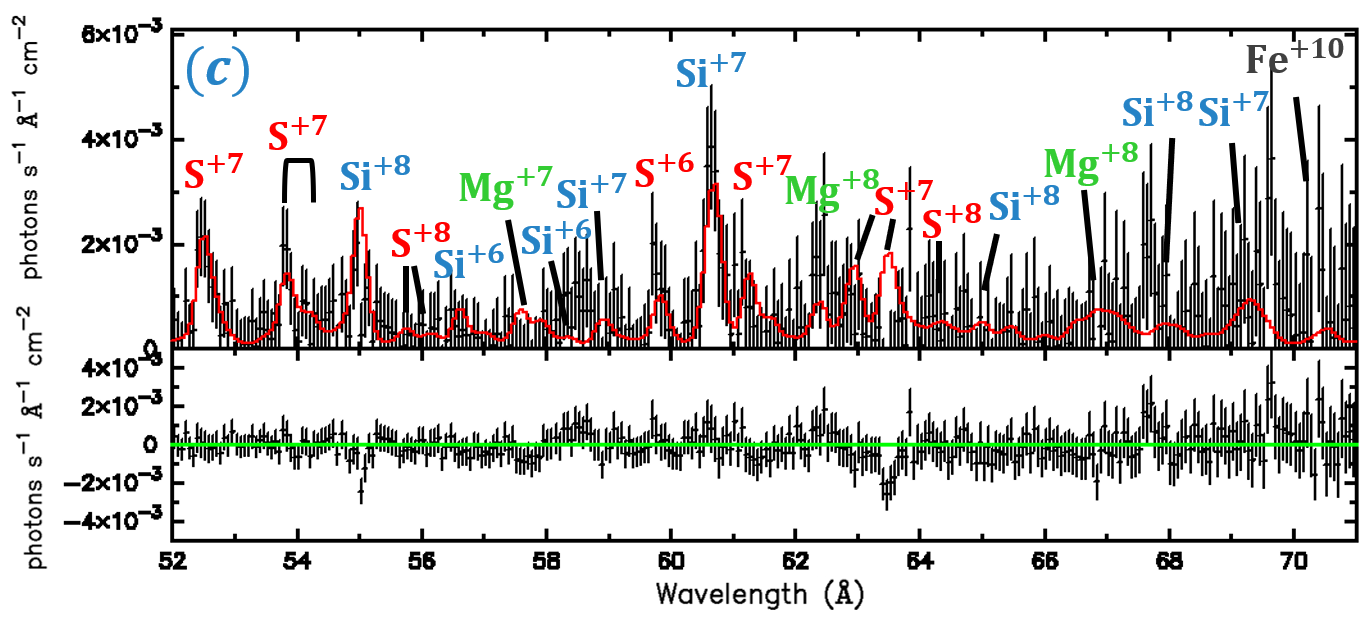
YZ Ret was observed with the Chandra LETG (Fig.13), 38 days after the RGS observation. The LETG extends the RGS waveband (up to 37Å) to 71Å, but the source at this stage was much fainter. We fitted the LETG spectrum with a similar model to that of the RGS. As in the RGS spectrum, the prominent features in the LETG spectrum are the C+4 RRC and the thermal line emission. The C+5 RRC and high- lines are present, but too faint to be fitted.
The bvapec component represents an outflowing ( km s-1) collisionally-ionized plasma at eV. The kinematic broadening can not be constrained and fixed to the RGS best-fit value km/s. The RRC of C+4 indicates a cold temperature of eV. The softer spectrum of LETG allows us to constrain the abundances of Mg, Si, S, Ar, and Fe that were not available with the RGS. The measured parameters from RGS and LETG fitted spectra are compared in Tables 2, 3.


| Observation | Component | Temperature [eV] | Velocity [km/s] | [km/s] | Flux [ ph s-1 cm-2] | Volume [ cm3] |
|---|---|---|---|---|---|---|
| XMM-Newton RGS | bvapec | |||||
| ” | ” | |||||
| ” | ” | - | ||||
| ” | ” | - | ||||
| Chandra LETG | bvapec | ” | ||||
| ” | ” | - |
Note. — () Measured in the range of 0.3-0.7 keV
| Element | XMM-Newton RGS | Chandra LETG | ||
|---|---|---|---|---|
| C | 1.00 | 1.00 | ||
| N | ||||
| O | ||||
| Mg | -(a) | |||
| Si | -(a) | |||
| S | -(a) | |||
| Ar | -(a) | |||
| Ca | ||||
| Fe | - |
Note. — () Set to the values obtained by the Chandra fitted spectrum.
6 Discussion
The key diagnostic is the high density cm-3, which implies extremely short time scales. For a C+5 recombination rate coefficient of cm3 s-1, the recombination (and ionization) time is s. For a solar abundance plasma at eV, the cooling function is erg cm3s-1 (Sutherland & Dopita, 1993), and thus the radiative cooling time is s. The fact that the X-ray source persists on much longer time scales implies continuous heating, which can be attributed to a reverse shock in the nova ejecta. Only the most recently shocked gas remains hot, resulting in a thin X-ray emitting shell, consistent with the theory of Hachisu & Kato (2023). The reverse shock velocity can remain constant for a long time as it moves through the ejecta (Hachisu & Kato, 2023), as also expected in supernova remnants (Micelotta et al., 2016, Fig. 4 therein).
If we ascribe a width cm to the shell during the RGS epoch, the thin shell geometry implies , where is the opening angle of the flow in sr. For cm3; cm2. From here, the mass outflow rate in the shell is . Plugging in all the above estimated parameters, we obtain yr-1. Since in this approximation, , as the outflow expands and the density decreases, increases. In Section 4.4, we estimated the length scale of mixing between the hot and cold gas to be even smaller than cm.
6.1 Shock heating and cooling
Direct evidence for the shocked plasma comes from the line widths. The measured km s-1 corresponds to a post-shock C ion () temperature of keV. The reason we do not observe such high electron temperatures and fully charged ions is a combination of the long electron-ion interaction times, and the efficient electron cooling. At cm-3, electrons would need s to reach the ion temperature (Fig. 4.5 in Vink, 2020), while their cooling times are tens of seconds.
Assuming 30 keV is the shock temperature , the relative velocity between the shock and the unshocked ejecta (neglecting radiation losses) is given by , or km s-1. The reverse shock is often much slower in the observed frame (Micelotta et al., 2016). Thus, is approximately the velocity of the unshocked ejecta. As expected, it is higher than 1500 km s-1, the velocity of the plasma after it is shocked. The high velocity of km s-1 suggests the ejecta escaped from close to the photosphere of the WD, yet is shocked further out.
6.2 Comparing the two epochs, evidence for a standing shock?
What can we learn from comparing the RGS (day 77) and LETG (day 115) spectra? Both are fitted well with a 70 eV plasma model (bvapec). The lines in both are blueshifted by km s-1, and broadened by km s-1. Both spectra feature narrow ( eV) RRCs representing a cold plasma component. However, the X-ray flux on day 115 is about 40 times lower (c.f. Fig. 1), which is approximately true separately for both the hot and recombining components. Table. 2 summarizes the important fitted parameters.
If the X-ray source is moving out at 1500 km s-1 over these 38 days, it traveled a distance of cm. Since the X-rays started to rise days earlier, by day 77 it could have already reached cm. Interestingly, Nova Delphini 2013 was also observed with gratings late (days 87 and 114 there), featuring blueshifted C and N lines, but in absorption with the SSS as a back-lighter (Milla & Paerels, 2023). The fast velocities at these late times led those authors as well to explain the absorption by a thin shell ejected early, but now cm away from the center. The X-ray source in YZ Ret seems to be in a similar situation, only the SSS is obscured.
Returning to the conical outflow geometry, and using a distance at the RGS epoch of cm, and cm3, we get cm. If cm, it implies a minuscule of sr, namely small and dense blobs of ejecta. If on the other hand cm (Sec. 4.4), then sr, or a few degrees. At the LETG epoch, the gas expanded by a factor of 3 to cm. Assuming remained the same, given similar cooling times, the corresponding volume on day 115 increased by a factor of 9, cm3. The day 115 LETG X-ray flux is a factor lower than on day 77. Thus, from Eq. 7, decreased by only a factor of 2, and so did the cooling time, justifying an approximately constant .
The continuous shock over 38 days in Sec. 6.2 suggests a large distance from the center, and poses a challenge with its extremely small opening angle . However, a reverse shock does not need to expand so fast, or at all. In a standing shock, the ejecta flows from the center at several 1000 km s-1, collides with the shock front, and exits the shock region at 1500 km s-1 (see Sec. 6.1 for the velocity and temperature estimates), while the shock location remains constant in the observer’s frame of reference. Since the cooling time is short, we observe fresh (recently) shocked ejecta at each time. The fact that the temperature and velocity broadening are similar after 38 days, attests to the constant relative velocities of the ejecta and the shock over this long time scale. In this scenario, the X-ray flux variability in Fig. 1 can be ascribed to the varying mass outflow rate of the nova. A factor of 40 fainter X-rays with LETG compared to the RGS, thus indicates a similar factor reduction in the density, from 1011 cm-3 to a few 109 cm-3. For a standing shock unfortunately, we have no distance diagnostics. In the thin shell geometry, a location closer to the center implies a larger opening angle, since the measured volume is . If, say, sr, with cm, it would imply a distance of cm, and higher for smaller .
6.3 The Cool Plasma Component
The outflow velocity and the volume estimates of the cold plasma (2 eV from the RRCs) are almost identical to that of the hot plasma, which suggests the two components are physically connected. This is not the first time narrow RRCs are observed in shocked X-ray sources. Schild et al. (2004) found C+4 and C+5 RRCs in the RGS spectrum of the colliding wind binary Vel, which indicate a temperature of 40kK (few eV) in a hot (keV) plasma. Nordon et al. (2009) analyzed the C+5 RRC in the LETG spectrum of the planetary nebula BD, and found a temperature of eV in a hot 160-260 eV plasma. These RRCs were unambiguously detected in high-resolution grating spectra. Fe+24 and Fe+25 RRCs were detected with the Suzaku CCDs in supernova remnants (Ozawa et al., 2009; Yamaguchi et al., 2009) at much higher temperatures of keV. All of these findings combined suggest that narrow RRCs are a common feature of shocked plasmas.
The physical origin of these RRCs and the source of cold electrons are debated. While adiabatic cooling and ionization freezing has been proposed (Schild et al., 2004; Yamaguchi et al., 2009), we suspect there is genuine mixing of cold electrons with the highly-charged ions. Mixing with cold gas can occur either at the reverse-shock front between shocked and unshocked wind, or at the contact discontinuity, at the interface between shocked ejecta and the dense, much cooler, shocked ISM gas. Computing the penetration depth of 2 eV electrons into the hot gas region, by taking the Larmor radius in a magnetic field, one gets cm, which is comparable to the hot thin shell size estimated in Sec. 4.4. Neutral atoms from the cold phase of course penetrate the hot gas smoothly, with no magnetic obstacle. These neutrals are discussed in Sec. 4.2. Another possible scenario is runaway radiative cooling. The cooling function of astrophysical plasmas peaks sharply at erg cm3s-1 between K (e.g., Sutherland & Dopita, 1993). This implies that gas cooling below eV would rapidly cool down to 1-2 eV. At the density of cm-3 this cooling time is s. This could explain why we observe narrow RRCs, namely no gas whatsoever at temperatures above 2 eV.
The X-ray source in YZ Ret is exceptional in its high density, small volume, and prominent RRCs. We suspect that under these conditions, the highly charged ions are completely immersed in the dense cold gas, the source of which could be one of the above. Another source of cold material could be an accretion disk. Ness et al. (2013) suggested that X-ray emission line spectra observed with no SSS after nova eruptions originate in high-inclination systems, where the SSS is obscured by optically thick material, formed in a disk around it. This disk can explain the lack of an observed SSS in YZ Ret, and provide a cold dense medium that the shocked gas runs into to produce the observed narrow RRCs and the CX. However, since the RRCs and high- lines are blueshifted, the wind would need to carry cool disk material with it without slowing down. The geometry and inclination of the system would need to be fine tuned to completely hide the WD, but allow us to still observe the approaching wind interacting with the edge of the disk.
7 Conclusions
We observed nova YZ Ret 2020 77 and 115 days after the eruption with XMM-Newton and Chandra gratings, respectively. The X-ray flux decreased by a factor of between epochs. Both X-ray spectra are characterized by emission lines with no sign of thermal emission from the SSS. In the following we summarize our conclusions from the analysis of the two spectra:
- 1.
- 2.
-
3.
The emission lines originate in collisionally ionized plasma of eV that was heated by the shock (Sec. 5), but may not have had time to reach its maximal temperature or ionization degree due to the rapid radiative cooling. The km s-1 broadened lines suggest the ions may still be hot at keV.
- 4.
-
5.
The DR satellite line observed at 33.87Å (rest frame) indicates a close interaction between the hot (70 eV) and cold (2 eV) components via photo-pumping. The high photon flux that is needed to produce the observed satellite line ratios implies the two are mixed (Sec. 4.4).
-
6.
The high- Rydberg series of C+4 suggests highly charged ions are undergoing CX with neutral atoms, furthering the evidence for mixing of shocked and cold gas in the nova.
The consistently high outflow velocity of km s-1 over 38 days would imply a source size of cm (Sections 4.5, 6.1), but an outflow with a disturbingly minuscule opening angle, consistent maybe with small dense blobs and a low volume filling factor. Conversely, invoking a standing reverse shock could imply a shorter distance, and thus alleviate the small opening angle problem.
S.M. and E.B. were supported in part by a Center of Excellence of the Israel Science Foundation (grant No. 1937/19). M.O. was supported by a Chandra-Smithsonian award for the Chandra/LETG observation. This paper employs a list of Chandra datasets, obtained by the Chandra X-ray Observatory, contained in the Chandra Data Collection (CDC) 233 https://doi.org/10.25574/cdc.233 (catalog doi:10.25574/cdc.233)
References
- Arnaud (1996) Arnaud, K. A. 1996, in Astronomical Society of the Pacific Conference Series, Vol. 101, Astronomical Data Analysis Software and Systems V, ed. G. H. Jacoby & J. Barnes, 17
- Aydi et al. (2020) Aydi, E., Buckley, D. A. H., Chomiuk, L., et al. 2020, The Astronomer’s Telegram, 13867, 1
- Aydi et al. (2023) Aydi, E., Chomiuk, L., Strader, J., et al. 2023, arXiv e-prints, arXiv:2309.07097, doi: 10.48550/arXiv.2309.07097
- Bailer-Jones et al. (2021) Bailer-Jones, C. A. L., Rybizki, J., Fouesneau, M., Demleitner, M., & Andrae, R. 2021, AJ, 161, 147, doi: 10.3847/1538-3881/abd806
- Bailer-Jones et al. (2021) Bailer-Jones, C. A. L., Rybizki, J., Fouesneau, M., Demleitner, M., & Andrae, R. 2021, The Astronomical Journal, 161, 147, doi: 10.3847/1538-3881/abd806
- Bar-Shalom et al. (2001) Bar-Shalom, A., Klapisch, M., & Oreg, J. 2001, J. Quant. Spec. Radiat. Transf., 71, 169, doi: 10.1016/S0022-4073(01)00066-8
- Brinkman et al. (2000) Brinkman, A. C., Gunsing, C. J. T., Kaastra, J. S., et al. 2000, ApJ, 530, L111, doi: 10.1086/312504
- Burrows et al. (2005) Burrows, D. N., Hill, J. E., Nousek, J. A., et al. 2005, Space Sci. Rev., 120, 165, doi: 10.1007/s11214-005-5097-2
- Cann & Thakkar (1992) Cann, N. M., & Thakkar, A. J. 1992, Phys. Rev. A, 46, 5397, doi: 10.1103/PhysRevA.46.5397
- Carr et al. (2020) Carr, A., Said, K., Davis, T. M., Lidman, C., & Tucker, B. E. 2020, The Astronomer’s Telegram, 13874, 1
- Chomiuk et al. (2021) Chomiuk, L., Metzger, B. D., & Shen, K. J. 2021, ARA&A, 59, 391, doi: 10.1146/annurev-astro-112420-114502
- den Herder et al. (2001) den Herder, J. W., Brinkman, A. C., Kahn, S. M., et al. 2001, A&A, 365, L7, doi: 10.1051/0004-6361:20000058
- Dewey & Robertson (1928) Dewey, J. M., & Robertson, H. P. 1928, Nature, 121, 709, doi: 10.1038/121709b0
- Drake (1969) Drake, G. W. F. 1969, ApJ, 158, 1199, doi: 10.1086/150279
- Drake (1971) Drake, G. W. F. 1971, Phys. Rev. A, 3, 908, doi: 10.1103/PhysRevA.3.908
- Drake et al. (2016) Drake, J. J., Delgado, L., Laming, J. M., et al. 2016, ApJ, 825, 95, doi: 10.3847/0004-637X/825/2/95
- Franckowiak et al. (2018) Franckowiak, A., Jean, P., Wood, M., Cheung, C. C., & Buson, S. 2018, A&A, 609, A120, doi: 10.1051/0004-6361/201731516
- Gabriel & Jordan (1969) Gabriel, A. H., & Jordan, C. 1969, Monthly Notices of the Royal Astronomical Society, 145, 241, doi: 10.1093/mnras/145.2.241
- Hachisu & Kato (2023) Hachisu, I., & Kato, M. 2023, ApJ, 953, 78, doi: 10.3847/1538-4357/acdfd3
- Hessman (2000) Hessman, F. V. 2000, New A Rev., 44, 155, doi: 10.1016/S1387-6473(00)00030-0
- Honeycutt & Kafka (2004) Honeycutt, R. K., & Kafka, S. 2004, AJ, 128, 1279, doi: 10.1086/422737
- Inglis & Teller (1939) Inglis, D. R., & Teller, E. 1939, ApJ, 90, 439, doi: 10.1086/144118
- Islam & Mukai (2023) Islam, N., & Mukai, K. 2023, in AAS/High Energy Astrophysics Division, Vol. 55, AAS/High Energy Astrophysics Division, 116.60
- Izzo et al. (2020) Izzo, L., Molaro, P., Aydi, E., et al. 2020, The Astronomer’s Telegram, 14048, 1
- Janev & Winter (1985) Janev, R., & Winter, H. 1985, Physics Reports, 117, 265, doi: https://doi.org/10.1016/0370-1573(85)90118-8
- Kalberla et al. (2005) Kalberla, P. M. W., Burton, W. B., Hartmann, D., et al. 2005, A&A, 440, 775, doi: 10.1051/0004-6361:20041864
- Kallman et al. (2009) Kallman, T. R., Bautista, M. A., Goriely, S., et al. 2009, ApJ, 701, 865, doi: 10.1088/0004-637X/701/2/865
- Kaufman et al. (2020) Kaufman, R., McNaught, R. H., Phillips, M. A., et al. 2020, Central Bureau Electronic Telegrams, 4812, 1
- King & Cannizzo (1998) King, A. R., & Cannizzo, J. K. 1998, ApJ, 499, 348, doi: 10.1086/305630
- Kinkhabwala et al. (2002) Kinkhabwala, A., Sako, M., Behar, E., et al. 2002, ApJ, 575, 732, doi: 10.1086/341482
- König et al. (2022) König, O., Wilms, J., Arcodia, R., et al. 2022, Nature, 605, 248, doi: 10.1038/s41586-022-04635-y
- Leahy et al. (2023) Leahy, D., Foster, A., & Seitenzahl, I. 2023, arXiv e-prints, arXiv:2311.11181, doi: 10.48550/arXiv.2311.11181
- Liedahl & Paerels (1996) Liedahl, D. A., & Paerels, F. 1996, ApJ, 468, L33, doi: 10.1086/310217
- Livio & Pringle (1994) Livio, M., & Pringle, J. E. 1994, ApJ, 427, 956, doi: 10.1086/174202
- Lotz (1968) Lotz, W. 1968, Zeitschrift fur Physik, 216, 241, doi: 10.1007/BF01392963
- Micelotta et al. (2016) Micelotta, E. R., Dwek, E., & Slavin, J. D. 2016, A&A, 590, A65, doi: 10.1051/0004-6361/201527350
- Milla & Paerels (2023) Milla, J., & Paerels, F. 2023, ApJ, 943, 31, doi: 10.3847/1538-4357/aca966
- Mitrani & Behar (2023) Mitrani, S., & Behar, E. 2023, ApJ, 957, 105, doi: 10.3847/1538-4357/acf562
- Ness et al. (2003) Ness, J. U., Starrfield, S., Burwitz, V., et al. 2003, ApJ, 594, L127, doi: 10.1086/378664
- Ness et al. (2013) Ness, J. U., Osborne, J. P., Henze, M., et al. 2013, A&A, 559, A50, doi: 10.1051/0004-6361/201322415
- Nolte et al. (2012) Nolte, J. L., Stancil, P. C., Liebermann, H. P., et al. 2012, Journal of Physics B Atomic Molecular Physics, 45, 245202, doi: 10.1088/0953-4075/45/24/245202
- Nordon et al. (2009) Nordon, R., Behar, E., Soker, N., Kastner, J. H., & Yu, Y. S. 2009, ApJ, 695, 834, doi: 10.1088/0004-637X/695/2/834
- Orio (2012) Orio, M. 2012, Bulletin of the Astronomical Society of India, 40, 333, doi: 10.48550/arXiv.1210.4331
- Orio et al. (2020) Orio, M., Drake, J. J., Ness, J. U., et al. 2020, ApJ, 895, 80, doi: 10.3847/1538-4357/ab8c4d
- Orio et al. (2022) Orio, M., Gendreau, K., Giese, M., et al. 2022, ApJ, 932, 45, doi: 10.3847/1538-4357/ac63be
- Orio et al. (2023) —. 2023, ApJ, 955, 37, doi: 10.3847/1538-4357/ace9bd
- Ozawa et al. (2009) Ozawa, M., Koyama, K., Yamaguchi, H., Masai, K., & Tamagawa, T. 2009, ApJ, 706, L71, doi: 10.1088/0004-637X/706/1/L71
- Peretz et al. (2016) Peretz, U., Orio, M., Behar, E., et al. 2016, ApJ, 829, 2, doi: 10.3847/0004-637X/829/1/2
- Schild et al. (2004) Schild, H., Güdel, M., Mewe, R., et al. 2004, A&A, 422, 177, doi: 10.1051/0004-6361:20047035
- Seely et al. (1981) Seely, J. F., Dixon, R. H., & Elton, R. C. 1981, Phys. Rev. A, 23, 1437, doi: 10.1103/PhysRevA.23.1437
- Shen & Quataert (2022) Shen, K. J., & Quataert, E. 2022, ApJ, 938, 31, doi: 10.3847/1538-4357/ac9136
- Smith et al. (2001) Smith, R. K., Brickhouse, N. S., Liedahl, D. A., & Raymond, J. C. 2001, ApJ, 556, L91, doi: 10.1086/322992
- Sokolovsky et al. (2022) Sokolovsky, K. V., Li, K.-L., Lopes de Oliveira, R., et al. 2022, MNRAS, 514, 2239, doi: 10.1093/mnras/stac1440
- Starrfield et al. (2012) Starrfield, S., Iliadis, C., Timmes, F. X., et al. 2012, Bulletin of the Astronomical Society of India, 40, 419, doi: 10.48550/arXiv.1210.6086
- Sutherland & Dopita (1993) Sutherland, R. S., & Dopita, M. A. 1993, ApJS, 88, 253, doi: 10.1086/191823
- Vink (2020) Vink, J. 2020, Shocks and Post-shock Plasma Processes (Cham: Springer International Publishing), 55–85, doi: 10.1007/978-3-030-55231-2_4
- Williams (1992) Williams, R. E. 1992, AJ, 104, 725, doi: 10.1086/116268
- Wilms et al. (2000) Wilms, J., Allen, A., & McCray, R. 2000, ApJ, 542, 914, doi: 10.1086/317016
- Wolf et al. (2013) Wolf, W. M., Bildsten, L., Brooks, J., & Paxton, B. 2013, ApJ, 777, 136, doi: 10.1088/0004-637X/777/2/136
- Wu et al. (1995) Wu, K., Wickramasinghe, D. T., & Warner, B. 1995, PASA, 12, 60, doi: 10.1017/S132335800002004X
- Yamaguchi et al. (2009) Yamaguchi, H., Ozawa, M., Koyama, K., et al. 2009, ApJ, 705, L6, doi: 10.1088/0004-637X/705/1/L6
- Yaron et al. (2005) Yaron, O., Prialnik, D., Shara, M. M., & Kovetz, A. 2005, ApJ, 623, 398, doi: 10.1086/428435
- Zemko et al. (2014) Zemko, P., Orio, M., Mukai, K., & Shugarov, S. 2014, MNRAS, 445, 869, doi: 10.1093/mnras/stu1783