The ratio of [Eu/] differentiates accreted/in-situ Milky Way stars across metallicities, as indicated by both field stars and globular clusters
Abstract
We combine stellar orbits with the abundances of the heavy, -process element europium and the light, -element, silicon to separate in-situ and accreted populations in the Milky Way across all metallicities. At high orbital energy, the accretion-dominated halo shows elevated values of [Eu/Si], while at lower energies, where many of the stars were born in-situ, the levels of [Eu/Si] are lower. These systematically different levels of [Eu/Si] in the MW and the accreted halo imply that the scatter in [Eu/] within a single galaxy is smaller than previously thought. At the lowest metallicities, we find that both accreted and in-situ populations trend down in [Eu/Si], consistent with enrichment via neutron star mergers. Through compiling a large dataset of abundances for 46 globular clusters (GCs), we show that differences in [Eu/Si] extend to populations of in-situ/accreted GCs. We interpret this consistency as evidence that in -process elements GCs trace the star formation history of their hosts, motivating their use as sub-Gyr timers of galactic evolution. Furthermore, fitting the trends in [Eu/Si] using a simple galactic chemical evolution model, we find that differences in [Eu/Si] between accreted and in-situ MW field stars cannot be explained through star formation efficiency alone. Finally, we show that the use of [Eu/Si] as a chemical tag between GCs and their host galaxies extends beyond the Local Group, to the halo of M31 - potentially offering the opportunity to do Galactic Archaeology in an external galaxy.
keywords:
techniques: spectroscopic – stars: abundances – globular clusters: general – Galaxy: formation1 Introduction
The chemical fingerprint of a galaxy originates from elements forged in four main nucleosynthesis channels (Burbidge et al., 1957). Very broadly, light, elements are created in massive stars and dispersed by core-collapse (CC) supernovae (SNe), heavy elements up to iron are synthesised in Type Ia SNe and approximately half of the elements heavier than iron are made via the slow neutron capture process (-process) in Asymptotic Giant Branch stars (Meyer, 1994; Busso et al., 1999; Käppeler et al., 2011; Karakas & Lattanzio, 2014). The dominant site of the fourth channel, the rapid neutron capture process (-process) responsible for the production of the other half of the elements heavier than iron, remains unconstrained (see e.g. Cowan et al., 1991; Thielemann et al., 2011; Côté et al., 2018; Kobayashi et al., 2020a).
Fortunately, Galactic Archaeology offers the chance to observationally constrain the yields of -process elements in different environments potentially revealing the nature of this elusive channel. To achieve this goal, the population of low-metallicity, low-mass stars in the Milky Way must be unscrambled into distinct, co-evolved populations. Today, in the era of Gaia (Lindegren et al., 2018, 2021) and large-scale spectroscopic surveys, chemo-dynamical data is routinely used to pick out signatures of individual accretion events in the Galactic halo (e.g. Belokurov et al., 2018; Myeong et al., 2018a; Helmi et al., 2018; Haywood et al., 2018; Koppelman et al., 2018; Myeong et al., 2019; Matsuno et al., 2019; Yuan et al., 2020; Monty et al., 2020; Forbes, 2020; Horta et al., 2021; Naidu et al., 2021; Feuillet et al., 2021; Malhan et al., 2022; Buder et al., 2022; Carrillo et al., 2022).
Despite the high quality of the available data, neither dynamics nor chemistry alone is capable of unmixing the halo; both are needed in tandem to identify individual components with sufficient purity. This becomes particularly important when selecting members from the last major merger whose stars often overlap with in-situ populations in both orbital and chemical dimensions (Jean-Baptiste et al., 2017; Pagnini et al., 2023). While the view and origin of the Galactic halo remains complex and the literature is yet to agree on the number, timing, and mass of proposed accretion events, there is a general consensus that the last significant merger in the Galaxy’s history was likely between the MW and the Gaia-Sausage/Enceladus (GSE) dwarf galaxy (dGal, for a different view see, Donlon et al., 2020, 2022; Donlon & Newberg, 2023).
Chemically, Nissen & Schuster (2010) presented one of the most striking lines of evidence for the existence of GSE (though it was not yet completely deciphered at the time) in the local view of the -metallicity plane. In their prolific study, stars assigned kinematically to the stellar halo are resolved into two distinct tracks, one with higher, and one with lower [/Fe] abundance ratio but overlapping broadly in [Fe/H]. It took the arrival of the Gaia data to reveal that the two halo sequences discovered by Nissen & Schuster (2010) also had different orbital and colour-magnitude properties (Haywood et al., 2018; Myeong et al., 2018b; Gaia Collaboration et al., 2018).
The distinct [/Fe]-abundance levels observed between GSE and the MW likely reflect differences in their star-formation histories. This interpretation stems from the assumption that elements enter the interstellar medium (ISM) very quickly via CCSNe, after which they are recycled to form new stars, while the progenitors of SNIa, the main contributors of iron, need non-negligible time to form and merge. Type Ia SN explosions are therefore delayed with respect to both the star formation and CCSNe. Exploiting this delay, the abundance ratio of to iron is used to indicate how fast the new stars are produced compared to the typical SN Ia delay time.
Simple assumptions about the recycling times for different element families can be combined with further approximations. Usually, consistency of the nucleosynthetic yield per explosion, the timing of mixing of the material injected into the ISM, as well as the gas circulation in and out of the galaxy, are all postulated to build powerful models of galactic chemical evolution (Weinberg et al., 2017; Andrews et al., 2017; Spitoni et al., 2017; Côté et al., 2017). Ultimately though, variations in abundance ratios generated by such models as a function of metallicity mostly reflect differences in otherwise constant element production yields modulated by galaxy’s SF activity (and/or the temperature of the ISM Schönrich & Weinberg, 2019)
Dynamically, GSE debris is associated with less bound energies, including some overlap with in-situ stars and has very little net spin, having lost most of its angular momentum in the interaction with the Galaxy (see e.g. Belokurov et al., 2018; Helmi et al., 2018; Naidu et al., 2021; Vasiliev et al., 2022). Many works have explored applying precise cuts in various parameter spaces to select pure samples of GSE and in-situ stars, relying primarily on the combination of the GSE’s high-energy, plunging, radial orbits and its lower abundance (Feuillet et al., 2021; Buder et al., 2022, e.g. ). In parallel to this pursuit, other studies have shown the risk (characterised as the contamination fraction) in adopting inconsistent selection criteria (Lane et al., 2022; Carrillo et al., 2023). Chemically, many efforts have been made to identify new ways in which GSE is unique relative to other MW stars at similar metallicities (Monty et al., 2020; Matsuno et al., 2019; Feuillet et al., 2021; Buder et al., 2022; Carrillo et al., 2022), with light elements like aluminium (Al) emerging as a promising descriminator.
Concurrent to the discovery of GSE and other halo substructures, many studies have sought to associate halo Galactic Globular Clusters (GCs) with progenitor galaxies, assigning populations of GCs to individual accretion events (e.g. Myeong et al., 2018c, 2019; Massari et al., 2019; Horta et al., 2020; Forbes, 2020; Callingham et al., 2022; Limberg et al., 2022; Monty et al., 2023b). These efforts have thus far relied primarily on GC dynamics and/or their age-metallicity properties (Massari et al., 2023), with limited success stemming from detailed GC chemistry. For example, a lack of clear differentiation in average light () element abundances has been reported by Horta et al. (2020), while other studies demonstrate that going beyond a single indicator, for example by adding [Al/Fe] information or heavy element abundances, may improve the quality of GC progenitor classification (Limberg et al., 2022; Monty et al., 2023b; Belokurov & Kravtsov, 2023b, a).
The main challenge associated with finding a chemical tag between GCs and their progenitors is the presence of anomalous chemical enrichment channels operating inside GCs (e.g. see recent reviews by: Bastian & Lardo, 2018; Gratton et al., 2019; Milone & Marino, 2022). One example of this is the MgAl chain occuring during hot bottom burning, where Mg can be converted into Al, thus blurring or even destroying patterns otherwise established in the field stars (Karakas et al., 2009). Furthermore, it remains unclear whether GCs should share both chemical and dynamical coherence with their dGal progenitors (e.g. they may be stripped earlier in the accretion process, while their hosts sink deeper into the MW potential, resulting in the two occuping different energies, Pagnini et al., 2023; Chen & Gnedin, 2024).
Recently, the -process element europium (Eu) has emerged as a potential chemical tag to resolve differences between in-situ/accreted populations and importantly, it appears to be unaffected strongly by the chemical processes internal to GCs (Roederer, 2011; McKenzie et al., 2022; Monty et al., 2023a; Kirby et al., 2023). In both GALAH survey data (Matsuno et al., 2021) and dedicated high resolution follow-up (Aguado et al., 2021), GSE stars have been found to contain an overabundance of Eu relative to inner halo MW stars of similar and higher metallicities. Because Eu is an almost pure -process element (Bisterzo et al., 2011), the evolution of Eu as a function of metallicity in a range of environments can shed light on the physics of the -process productionn and its deposition into the ISM.
Importantly, the two main -process production channels, CCSNe and neutron stars (NS) as well as black hole neutron star mergers (Lattimer & Schramm, 1974; Rosswog et al., 2014; Thielemann et al., 2017) have distinct delay times and ejecta energetics. NS merger delay times are not currently constrained and may be as large as 0.1-18 Gyr (Blanchard et al., 2017; Côté et al., 2018; Skúladóttir et al., 2019; Skúladóttir & Salvadori, 2020; Naidu et al., 2022; de los Reyes et al., 2022). Furthermore, predicted nucleosynthetic yields associated with the demographic of present-day binary neutron star systems in the MW may not be identical to the yields associated with populations which enriched at early times (Holmbeck & Andrews, 2024).
Studies extending -process abundance analysis to GCs, which have been dynamically associated with GSE, find similarly high values of Eu (Koch-Hansen et al., 2021; Monty et al., 2023b). As mentioned, the prospect of chemically linking GCs to their progenitors using Eu relies on the Eu-enhancement in GCs being “primordial”, and not the result of internal cluster evolution. This appears to be true in some clusters, where Eu-enhancement is independent of population within the cluster (where populations are defined through their light element anti-correlations, see Roederer, 2011).
For example, in -Centauri (-Cen), arguably the most complex ‘GC’, Johnson & Pilachowski (2010) find a plateau in [Eu/Fe] across all five populations (defined using their metallicity distribution functions.) Though this implies that self-enrichment of Eu in the cluster does occur, it goes with Fe-enrichment preserving the primoridal ratio found in the first generation of stars. In chemically complex GCs with much smaller Fe-spreads, a plateau in [Eu/Fe] is also found, e.g in M 22 (Marino et al., 2011; McKenzie et al., 2022) and NGC 362 (Monty et al., 2023a). Note however that recent studies of M 92 (Kirby et al., 2023) and NGC 7078 (Cabrera Garcia et al., 2024) show evidence of correlations between Na and Eu in the first generation of stars. In the case of these clusters, Eu-enhancement is not interpreted as being primordial but is instead thought to be concurrent with GC formation.
In this study, we explore the use of Eu, weighted by a light -element, as a chemical tag differentiating both in-situ and accreted field stars and globular clusters. Of the light -elements magnesium (Mg), silicon (Si) and calcium (Ca), we choose to neglect Mg in this study due to the observed inconsistencies in Mg abundances extracted from different lines in GCs. Mg abundances measured in the optical (using the strong MgB lines) are systematically higher than those made in the infrared ( higher on average across a metallicity range of , Belokurov & Kravtsov, 2023a). Several studies have noted these inconsistencies in GCs as well as field stars (e.g. in the GCs NGC 5024 and NGC 5466 and in accreted halo stars, Lamb et al., 2015; Carrillo et al., 2022). Of the remaining light elements, Si and Ca, we choose Si as our light element tracer over Ca because it is a purer -element (Kobayashi et al., 2020a), giving access to three nucleosynthetic channels (, Fe-peak and -process) across a broad range of metallicities. After establishing the significance of this tag, we explore whether it extends across metallicities and investigate its origin using simple galactic chemical evolution models. Finally, we explore whether the tag extends beyond the MW halo into Local Group dwarf galaxies and their GCs and beyond, to the halo of M 31.
In Sec. 2, we present the sample of field stars we use, drawing from the third data release of the GALactic Archaeology with Hermes (GALAH) survey (Buder et al., 2021) and data from the -Process Alliance (Sakari et al., 2018b; Ezzeddine et al., 2020). We also describe our compilation of literature GC abundances and new measurements in Sec. 2. In Sec. 3 we explore the origin of the difference in [Eu/Si] between accreted and in-situ populations using a new one-zone chemical evolution model. We then discuss successes and failures of our model to fit the data and speculate as to the origins of the model-data disagreements. In Sec. 4, we show that GCs trace the star formation histories of their hosts across metallicities, in the MW halo, Local Group dwarf galaxies and potentially in the halo of M 31. Finally, we summarise our conclusions in Sec. 5.
2 Chemical Abundance Data Set
In this section we discuss the field star data sets at high- and low-metallicity, including the selections we have made to acquire in-situ and accreted samples and discuss how the GC dataset was compiled. We present the abundance distributions for each sample in the corresponding section.
2.1 Field Star Compilation
2.1.1 GALAH Data
To explore global trends in [Eu/Si] throughout the Galaxy, we utilise the GALAH DR3 data set of MW field stars (Buder et al., 2021) above metallicities . We choose this cut-off as the number of benchmark stars used to verify [Fe/H] in GALAH DR3 drops-off significantly below . We follow the recommendations from GALAH regarding which flagged stars to remove111https://www.galah-survey.org/dr3/using_the_data/. The following cuts are applied to only retain stars with an uncertainty in [EuSi/Fe] less than 0.2 dex, where X denotes either Eu or Si. In total we retain stars from the original DR3 catalogue. It is important to note that non-local thermoydnamic equilibrium (NLTE) corrections have been applied to the published values of Si and Fe in GALAH DR3. NLTE corrections have not been applied to Eu.
-
1.
snr_c3_iraf
-
2.
flag_sp
-
3.
flag_fe_h
-
4.
e_fe_h
-
5.
flag_X_fe
-
6.
e_X_fe
The dynamical properties, energy () and -component of the angular momentum (), are taken from the GALAH_DR3_VAC_dynamics_v2 value added catalogue described in Buder et al. (2022). To calculate , and other orbital parameters, Buder et al. (2022) adopt the MW potential from McMillan (2017), assume a solar radius of 8.21 kpc and a circular velocity at the Sun of 233.1 km/s. They also orient the Sun 25 pc above the plane following Jurić et al. (2008) and adopt a total solar velocity of () = (11.1, 248.27, 7.25) km/s in keeping with Schönrich et al. (2010). Throughout this study, we adopt this same reference frame and choice of the MW potential to derive dynamical properties.
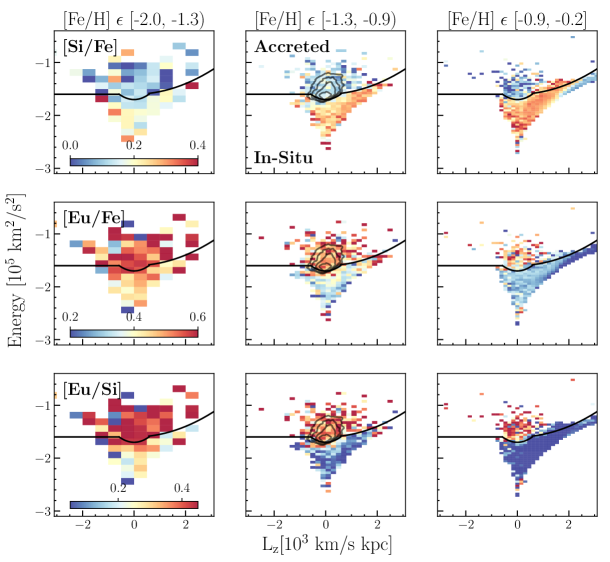
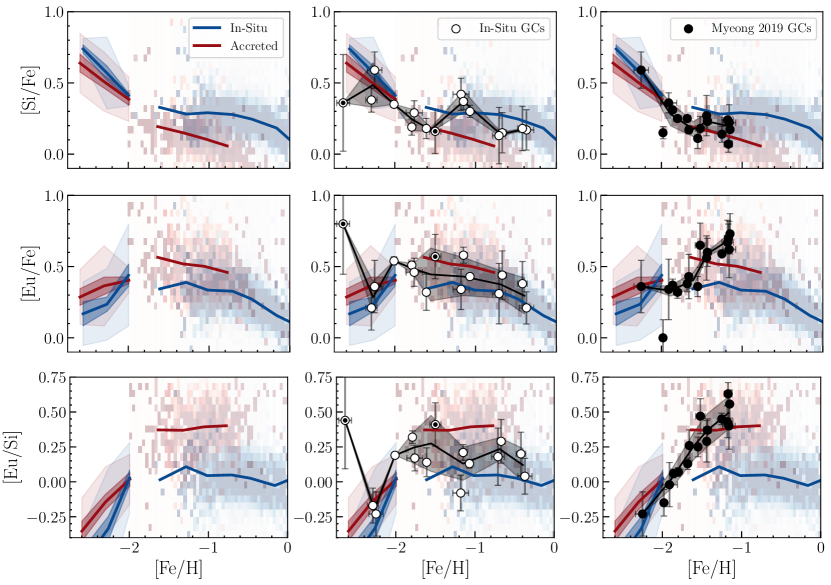
The [Si/Fe], [Eu/Fe] and [Eu/Si] distributions in the GALAH field star data set are presented in Fig. 1. The figure slices through - space in bins of metallicity to present the evolution of Si, Eu and [Eu/Si]. The bin intervals are chosen such that the central bin captures the peak of the metallicity distribution of GSE (Belokurov & Kravtsov, 2022). The size of the metallicity bin is listed at the top of the column in interval notation (where “(” denotes an open interval).
Two additional dynamical features are included in Fig. 1 which we will revisit later. The first is the proposed boundary in - between accreted and in-situ stars introduced by Belokurov & Kravtsov (2023b). This is marked with a thick black line and motivated in Belokurov & Kravtsov (2023b) by light element variations seen in APOGEE (Abdurro’uf et al., 2022) field stars. The second dynamical feature we include (in the middle column only where the bulk of GSE stars appear in GALAH) is a set of density contours which trace the extent of the region occupied by the debris associated the GSE merger (Belokurov et al., 2023). The exact energies for both dynamical features have been adjusted to accommodate our choice of potential. This was done by calculating the offset in energy between stars common to our study and that of Belokurov & Kravtsov (2023b).
Beginning in the highest metallicity interval (the right-most column in Fig. 1, a clear distinction is observed between the in-situ and accreted stars across both [Si/Fe] and [Eu/Fe]. The difference is likely driven by “high metallicity” stars from GSE (), which dominates the accreted halo at these metallicities and the thick and thin discs (note the large number of stars at positive , marking the prograde disc). Moving to intermediate metallicities (middle column), GSE more obviously dominates the halo, while the the in-situ component is now dominated by “Splash” stars (Belokurov et al., 2020) and the thick disc (some net rotation is still observed). Note again that the strong chemical differences persist between the two populations across all three element ratios.
Finally, in the lowest metallicity interval and left-most column, the range of Si and Eu abundances are similar across the in-situ/accreted boundary, but still display hints of possible distinction ( dex). This is likely because at low-metallicities, the signature of GSE becomes significantly weaker (exploring the low-metallicity tail of GSE), mixing with the signatures of smaller, earlier accretion events. In addition to this, the signature of the in-situ stars becomes less clear as we enter the population of “Aurora” stars with large chemical dispersion (Belokurov & Kravtsov, 2022). However, despite this, combining the information provided by both Eu and Si into the ratio of [Eu/Si] leads to a slight increase in the abundance differences between accreted and in-situ ( dex).
2.1.2 Low Metallicity Data Set
To explore the evolution of [Eu/Si] to metallicities below the range probed accurately by GALAH (), we require additional data of low-metallicity field stars. To this end, we combined measurements of Eu and Si from the first Northern data release of the -Process Alliance (RPA DR2, Sakari et al., 2018b) and the fourth data release (DR4, Ezzeddine et al., 2020). We limit ourselves to only considering RPA survey stars when compiling our low-metallicity data set to minimise the introduction of additional zero point offsets. Unfortunately additional RPA releases do not include Si (Hansen et al., 2018; Holmbeck et al., 2020). We do not consider offsets between the GALAH and RPA data sets, however we never combine the two data sets directly (e.g. only the high-metallicity data set is used in the determination of a best-fit galactic chemical evolution model in Sec. 3.2.)
We apply a somewhat stricter cut on the quality of abundances to clean the combined RPA sample as Si lines become weaker and more difficult to measure at low-metallicities. We only retain stars with an uncertainty in [Eu/Si] less than or equal to the average uncertainty in [Eu/Si] ( dex, where is the quadrature sum of the uncertainties in Eu and Si.) Finally, given the stochastic nature of enrichment at low-metallicities, we only select stars with to ensure Eu-enhancement traces the and not -process channel. The final cleaned RPA sample contains 103 stars.
The published NLTE-corrected values of metallicity and are adopted for the RPA sample. NLTE corrections to [Eu/H] and [Si/H] have not applied by the RPA. Given the linelist of the RPA (Ezzeddine et al., 2020), the NLTE corrections for Si are expected to be marginal ( dex at Amarsi et al., 2020). Unfortunately, this is not necessarily the case for Eu. The two strongest Eu lines available in the optical occur at 4129 Å and 6645Å. The bluer line is much more sensitive to NLTE corrections, with the average NLTE correction evolving nearly linearly from +0.1 dex at [Fe/H], to +0.4 dex at [Fe/H] for a red giant branch star (T K, )222Nicholas Storm, private communication and Guo et al. in prep.. The correction to the red line is less extreme, with corrections ranging from -0.05 dex at , down to 0.15 dex at .
Eu-abundances in the RPA sample are predominantly determined from the stronger blue line of Eu at 4129Å , while the GALAH abundances are determined primarily from the weaker Eu line at 6645Å . This difference necessary introduces some inconsistency. We discuss if this has any impact on our results in upcoming sections. Finally, to assign dynamical properties to the stars, we solve for the energies and -angular momenta under the same MW potential McMillan (2017) and LSR as was assumed for the GALAH dataset.
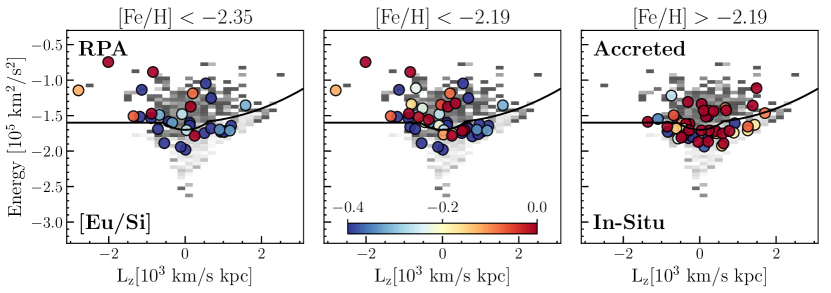
Fig. 2 shows the distribution of the cleaned, combined RPA star sample in - where each star is coloured by its corresponding the LTE [Eu/Si] abundance. The RPA data is plotted over-top of the intermediate metallicity GALAH sample, selected because it is better populated than the lowest metallicity bin. The combined sample is split into three metallicity bins to explore the evolution of [Eu/Si]. The central and right-most columns stars centred around the mean NLTE metallicity of the cleaned sample (). The left-most column shows stars with a metallicity lower than the average metallicity minus 0.5 standard deviations.
Three interesting observations emerge from Fig. 2. The first, is the overall tendency towards lower values of [Eu/Si] ( dex) with decreasing metallicity, common to both accreted and in-situ stars (note the range of the colourbar in Fig. 2). The second, is the appearance of a tentative split in the average [Eu/Si] value in the lowest metallicity bins across the accreted-in-situ boundary (labeled in the the third column of Fig. 2). On average, we find the accreted sample to be enhanced by dex in [Eu/Si] relative to the in-situ sample. This is larger than the average measurement error in [Eu/Si] (neglecting upper limits in Eu). We revisit the potential consequences of this potential split in accreted/in-situ populations in upcoming sections.
The third interesting feature, is that despite the overall enhancement seen in [Eu/Si] in accreted stars relative to in-situ stars, not all accreted RPA stars are enhanced in [Eu/Si] or [Eu/Fe] relative to their in-situ counterparts. This could be a reflection of the diversity in -process enhancement observed in ultra-faint dGals (UFDs) (e.g. as in the case of the UFDs Grus I and Triangulum II, in which neutron capture elements are not detected, Ji et al., 2019) and predicted through simulations of dGals (Kolborg et al., 2022). It could also be a reflection of the transition in the dominance of the accreted halo away from GSE, towards smaller accretion events at lower metallicities. The appearance of [Eu/Si] enhanced in-situ stars could also reflect this second point, that earlier and/or less-massive accretion events could sink below the accreted/in-situ boundary marked by GSE - contaminating our in-situ selection. However, note that at low-metallicities (the central and left-most columns) the most [Eu/Si]-enhanced in-situ stars sit the closest to the boundary.
2.2 Globular Cluster Compilation
2.2.1 Literature Data for 46 GCs
A selection of GC abundances of Eu and Si were compiled from the literature to sample both the accreted and in-situ populations defined in Belokurov & Kravtsov (2023a). We chose to prioritise GCs assigned to GSE in the literature, as GSE is likely the largest contributor of ex-situ GCs to the MW (especially at less-bound energies). Table 5 of Johnson et al. (2017b) was used as the starting point for the literature compilation. Emphasis was placed on building a compilation of studies with consistent wavelength coverage, instrumentation and spectroscopic analysis technique. As such, all the chemical abundances in the literature compilation are derived from optical data, in the wavelength range of Å stemming predominately from VLT/FLAMES (Pasquini et al., 2002), VLT/UVES (Dekker et al., 2000), Magellan/MIKE (Bernstein et al., 2003) or Keck/HIRES (Vogt et al., 1994). All abundance determinations were made under the assumption of Local Thermodynamic Equilibrium (LTE) and 30/46 studies explicitly state the use of MOOG (Sneden, 1973) to perform either equivalent width analysis or spectrum synthesis.
Two of the obvious inconsistencies in the compiled data set are the choice of Eu lines, and the solar scale. As discussed in Sec. 2.1.2, NLTE corrections to Eu vary significantly between the red, 6645Å and blue, 4129Å line. For simplicity and in-keeping with our field star compilation, we do not attempt to apply NLTE corrections to any of the literature data and therefore prioritise studies which use the red Eu line in their abundance determinations. Finally, although the studies have not been placed on the same solar scales, the photospheric abundances of Si, Ca and Eu only differ by , and respectively between the popular solar scales of Grevesse & Sauval (1998) and Asplund et al. (2009). The LTE photospheric abundance of Fe is unchanged across the two studies. Therefore, we do not consider inconsistent solar scales to introduce significant uncertainties.
Our compiled dataset is presented in Table 1. The adopted values of [Fe/H], [Si/Fe] and [Eu/Fe] and their respective uncertainties are listed alongside their designation of in-situ/accreted (from Belokurov & Kravtsov, 2023a) and abundance references. In the case of multiple abundance uncertainties listed in the studies, we adopt the largest value listed (often the internal GC dispersion in each element). If more than one population of stars is present in the GC, we adopt the mean abundance for the most metal-poor population. If a metallicity spread is not obvious, we adopt the Mg-rich population. Both choices reflect a desire to sample the first generation of stars in the cluster.
Measurements for NGC 2808 and NGC 1904 made in this study are included in Table 1 and discussed in Appendix A. Note that this compilation was made prior to the publication of the study of -process abundances in GCs made by Schiappacasse-Ulloa et al. (2024). We find good agreement with the Eu abundances published in their study for GCs in common, including between the two GCs analysed in this study, NGC 1904 and NGC 2808. We find good agreement within 0.06 dex in [Eu/Fe] for NGC 1904 between our two studies and acceptable agreement in NGC 2808 (0.10 dex difference).
| GC | [Fe/H] | [Si/Fe] | [Eu/Fe] | In-Situ/Acc. | Study | Comment | |||
|---|---|---|---|---|---|---|---|---|---|
| (1/0) | |||||||||
| Arp 2 | -1.77 | 0.04 | 0.29 | 0.08 | 0.45 | 0.22 | 0 | Mottini & Wallerstein (2008) | … |
| NGC 104 | -0.67 | 0.05 | 0.30 | 0.10 | … | … | 1 | Carretta et al. (2004) | Si abundance only |
| NGC 104 | … | … | … | … | 0.14 | 0.03 | … | James et al. (2004) | Eu abundance only |
| NGC 1261 | -1.25 | 0.02 | 0.29 | 0.04 | 0.59 | 0.01 | 0 | Koch-Hansen et al. (2021) | |
| NGC 1851 | -1.18 | 0.07 | 0.39 | 0.03 | 0.67 | 0.11 | 0 | Carretta et al. (2011) | |
| NGC 1904 | -1.66 | 0.04 | 0.32 | 0.02 | 0.43 | 0.11 | 0 | This study | |
| NGC 2298 | -1.91 | 0.10 | 0.51 | 0.05 | 0.34 | 0.15 | 0 | McWilliam et al. (1992) | |
| NGC 2419a | -2.15 | 0.11 | 0.45 | 0.13 | 0.19 | 0.18 | 0 | Cohen & Kirby (2012) | Mg-rich population |
| NGC 2808 | -1.15 | 0.03 | 0.32 | 0.01 | 0.73 | 0.11 | 0 | This study | |
| NGC 288 | -1.39 | 0.04 | 0.43 | 0.09 | 0.52 | 0.11 | 0/1 | Shetrone & Keane (2000) | |
| NGC 3201 | -1.42 | 0.14 | 0.42 | 0.14 | 0.29 | 0.20 | 0 | Gonzalez & Wallerstein (1998) | |
| NGC 362 | -1.17 | 0.05 | 0.22 | 0.04 | 0.70 | 0.07 | 0 | Carretta et al. (2013) | |
| NGC 4147 | -1.86 | 0.01 | 0.46 | 0.01 | 0.37 | 0.03 | 0 | Villanova et al. (2016) | |
| NGC 4590 | -2.42 | 0.14 | 0.21 | 0.24 | 0.23 | 0.14 | 0 | Schaeuble et al. (2015) | |
| NGC 4833 | -2.25 | 0.09 | 0.74 | 0.09 | 0.36 | 0.13 | 1 | Roederer & Thompson (2015) | |
| NGC 5024 | -2.16 | 0.01 | 0.34 | 0.17 | 0.74 | 0.17 | 0 | Lamb et al. (2015) | |
| NGC 5139 | -1.77 | 0.11 | 0.29 | 0.16 | 0.23 | 0.22 | 0 | Johnson & Pilachowski (2010) | Most metal-poor group |
| NGC 5272 | -1.39 | 0.08 | 0.27 | 0.06 | 0.50 | 0.04 | 0 | Cohen & Meléndez (2005) | |
| NGC 5286 | -1.80 | 0.05 | 0.40 | 0.01 | 0.32 | 0.03 | 0/1 | Marino et al. (2015) | |
| NGC 5694 | -1.98 | 0.03 | 0.30 | 0.03 | 0.00 | … | 0 | Mucciarelli et al. (2013) | Eu upper limit |
| NGC 5904 | -1.21 | … | 0.31 | 0.07 | 0.43 | 0.11 | 0 | Ivans et al. (2001a) | |
| NGC 6093 | -1.79 | 0.02 | 0.34 | 0.04 | 0.51 | 0.02 | 1 | Carretta et al. (2015) | |
| NGC 6121 | -1.18 | … | 0.57 | 0.08 | 0.34 | 0.10 | 1 | Ivans et al. (2001b) | |
| NGC 6205 | -1.50 | 0.07 | 0.31 | 0.11 | 0.57 | 0.11 | 1 | Cohen & Meléndez (2005) | |
| NGC 6266 | -1.15 | 0.05 | 0.52 | 0.04 | 0.58 | 0.04 | 1 | Yong et al. (2014a) | |
| NGC 6273 | -1.77 | 0.08 | 0.35 | 0.10 | 0.39 | 0.15 | 1 | Johnson et al. (2017a) | |
| NGC 6341 | -2.52 | 0.06 | 0.58 | 0.08 | 0.44 | 0.14 | 0 | Kirby et al. (2023) | |
| NGC 6362 | -1.07 | 0.01 | 0.45 | 0.03 | 0.43 | 0.01 | 1 | Massari et al. (2017) | |
| NGC 6388 | -0.37 | 0.09 | 0.32 | 0.10 | 0.21 | 0.08 | 1/0 | Carretta et al. (2007a) | |
| NGC 6441 | -0.42 | 0.06 | 0.33 | 0.11 | 0.38 | 0.11 | 1 | Carretta et al. (2007a) | |
| NGC 6584 | -1.52 | 0.06 | 0.33 | 0.06 | 0.65 | 0.11 | 0/1 | O’Malley & Chaboyer (2018) | |
| NGC 6656 | -1.76 | 0.10 | 0.44 | 0.06 | 0.46 | 0.07 | 1 | Marino et al. (2011) | |
| NGC 6715 | -1.55 | 0.03 | 0.11 | 0.07 | 0.38 | 0.17 | 0 | Brown et al. (1999) | |
| NGC 6752 | -1.61 | 0.03 | 0.33 | 0.05 | 0.32 | 0.09 | 1 | Yong et al. (2005) | |
| NGC 6809 | -2.01 | 0.02 | 0.50 | 0.01 | 0.54 | 0.02 | 1 | Rain et al. (2019) | |
| NGC 6838 | -0.71 | 0.08 | 0.28 | 0.14 | 0.31 | 0.15 | 1 | Ramírez & Cohen (2002) | |
| NGC 6864 | -1.16 | 0.08 | 0.37 | 0.09 | 0.62 | 0.14 | 0 | Kacharov et al. (2013) | |
| NGC 6934 | -1.43 | 0.05 | 0.38 | 0.04 | 0.60 | 0.07 | 0 | Marino et al. (2021) | |
| NGC 7006 | -1.55 | 0.03 | 0.26 | 0.05 | 0.36 | 0.05 | 0 | Kraft et al. (1998) | |
| NGC 7078 | -2.64 | 0.08 | 0.51 | 0.24 | 0.80 | 0.25 | 1/0 | Sobeck et al. (2011) | Large dispersion in [Eu/Fe] noted |
| NGC 7078 | … | … | … | … | … | … | … | … | in Cabrera Garcia et al. (2024) |
| NGC 7089 | -1.68 | 0.04 | 0.40 | 0.01 | 0.38 | 0.04 | 0 | Yong et al. (2014b) | Metal-poor group (“-only”) |
| NGC 7099 | -2.29 | 0.07 | 0.53 | 0.06 | 0.21 | 0.11 | 1 | O’Malley & Chaboyer (2018) | |
| Pal 14 | -1.44 | 0.03 | 0.42 | 0.10 | 0.56 | 0.11 | 0 | Çalışkan et al. (2012) | |
| Pal 3 | -1.58 | 0.03 | 0.49 | 0.05 | 0.73 | 0.07 | 0 | Koch et al. (2009) | |
| Pal 5 | -1.56 | 0.20 | 0.53 | 0.25 | 0.55 | 0.06 | 0 | Koch & Côté (2017) | |
| Terzan 7 | -0.61 | 0.04 | 0.00 | 0.01 | 0.53 | 0.05 | 0 | Tautvaišienė et al. (2004) |
2.2.2 Archival Data for NGC 1904, NGC 2808 and NGC 1851
While compiling the literature data set discussed in the previous section, we were unable at the time to find Eu abundance derivations for two potential GSE-GCs identified by both Myeong et al. (2018c, 2019) and Massari et al. (2019), NGC 1904 and NGC 2808. To include these GCs in our compilation, we recovered high resolution archival VLT/UVES (Dekker et al., 2000) spectra for stars in each cluster and measured Eu, Si and Ca in both. The IDs of the stars are given in Table 3, following the convention of Carretta et al. (2009b). The archival observations were previously used in the studies of Carretta et al. (2009b) to extract light element abundances in a large number of MW GCs.
The spectra (for both the red and blue arms) were retrieved from the ESO Science Archive Facility. Four stars from each cluster with the highest average signal-to-noise ratios (SNR) were selected from each cluster. Prior to analysing the spectra, they were trimmed to remove discontinuities at the ends, continuum-fit with a low-order cubic spline using the continuum task in IRAF333IRAF is distributed by the National Optical Astronomy Observatory, which is operated by the Association of Universities for Research in Astronomy (AURA) under cooperative agreement with the National Science Foundation and normalized prior to measuring the chemical abundances. The spectra were also radial velocity corrected using the dopcor task in IRAF and the radial velocities published in (Carretta et al., 2009b) prior to performing abundance analysis.
To extract chemical abundances, we performed standard 1D LTE equivalent width analysis and spectrum synthesis. Given the large catalogue of consistent GC abundances provided by Carretta et al. (2004, 2007b, 2009a, 2009b, 2013) in their series of prolific studies, and given that these catalogues dominate our literature sample, we examined the consistency of our chemical abundance analysis relative to the findings of Carretta et al. (2011) and Carretta et al. (2009b). Furthermore, we performed the same analysis on the GC NGC 1851 for which Carretta et al. (2011) also measure Eu, to examine the abundance consistency across elements.
A description of the chemical abundance methodology and results of the consistency study are described in Appendix A. In general, we find good agreement between our study and that of Carretta et al. (2009b, 2011) across Si and Eu. In the case of Si, 9/12 stars display consistent (within measurement uncertainties) abundances across the three studies. In the case of our calibration cluster, NGC 1851, the values of Eu differ by on average of only 0.09 dex between our study and that of Carretta et al. (2011).
2.2.3 GCs enhanced in [Eu/Si] are also accreted
Previously studies of the chemodynamics of low-metallicity field stars have revealed extreme -process enhancement in a large number of accreted stars (Sakari et al., 2018a; Roederer et al., 2018; Gudin et al., 2021; Shank et al., 2023; Zhang et al., 2024). Clustering of -process enhanced stars purely in the halo purely in dynamics (- and eccentricity, Gudin et al., 2021) has revealed groups with consistent chemistry (small spreads in metallicity dex, Roederer et al., 2018) - suggesting a common origin. While some of these groups are associated with known GCs, others are not, pointing to the possibility for the existence of a number of disrupted low-mass dGals in the MW halo (akin to the extremely -process enhanced dGal, Reticulum II and explicitly seen in the -process rich dGal stream, Indus, Ji et al., 2016; Hansen et al., 2021). While these studies have demonstrated a chemical distinctness in -process elements in accreted field stars, systematic differences between populations of in-situ and accreted GCs in -process abundances has not been explored before.
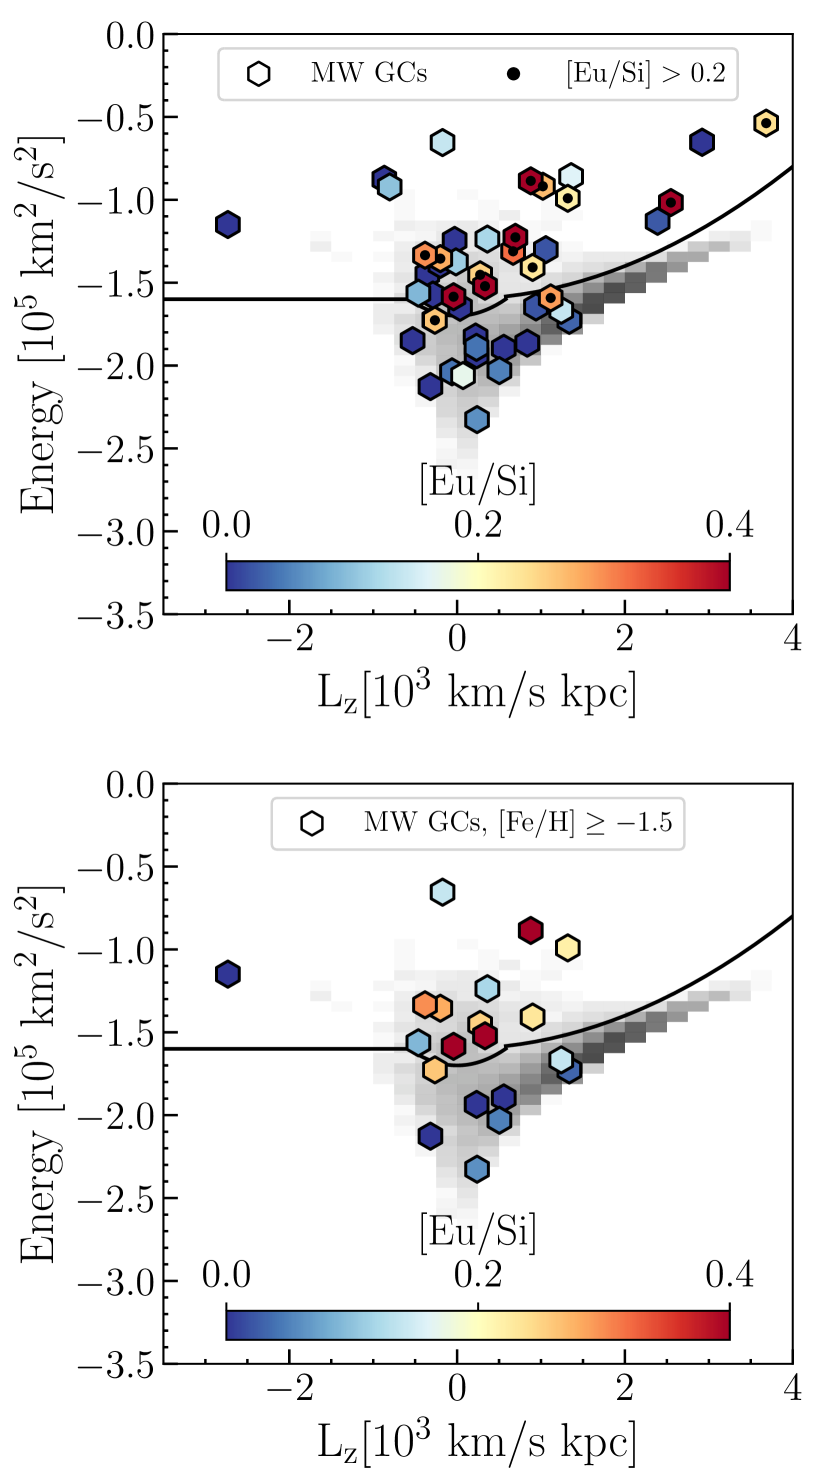
To investigate if a difference exists, we plot the GCs in our sample in Fig. 3, again in E-Lz space on top a 2D histogram showing the density of the entire GALAH sample. In the top panel we plot the entire sample of 46 GCs across metallicities, colouring each by the average [Eu/Si] abundance. GCs which exhibit an abundance of 0.2 dex or greater in [Eu/Si] are over-plotted using nested black dots. The dynamical separation between [Eu/Si]-normal and [Eu/Si]-enhanced GCs is striking. The the majority of the [Eu/Si]-enhanced GCs are accreted and show a slight bias to being prograde. Furthermore, note that a large number of [Eu/Si]-enhanced GCs occupy the region of E-Lz space associated with the GSE merger. This is highlighted more clearly in the bottom panel of Fig. 3, showing only the GCs with .
3 Origin of the [Eu/Si] Excess in the Accreted Halo
From Fig. 1, we have shown that the accreted halo appears significantly enhanced in [Eu/Si] relative to the remainder of the MW, arguably across all metallicities, but most obviously at intermediate metallicities. This is a known result (Matsuno et al., 2021; Aguado et al., 2021) that we have presented in a different space through combining - and abundances. When moving to the low-metallicity RPA sample, we find tentative evidence that the enhancement in [Eu/Si] found in accreted stars extends to NLTE metallicities as low as (LTE metallicities of ). To our knowledge, this is the first time this signature has been seen. Finally, we have shown that the most [Eu/Si]-enhanced GCs only belong to the population of accreted clusters. In the upcoming section, we seek a potential explanation for this apparent enhancement in accreted stars using a galactic chemical evolution model. We discuss the strengths and weaknesses of our simplified model, speculating as to the cause of any disagreements and the potential temporal power encoded in the abundances of GCs.
3.1 Selecting In-Situ and Accreted Field Stars
To consider the evolution of accreted and in-situ field stars across metallicity, we split our GALAH and RPA field stars into accreted and in-situ populations. The mean values of these two groups will then be used to constrain our GCE models. Beginning with the GALAH data, we select accreted stars by sampling the centroid of the GSE contours in - space presented in the middle column of Fig 1. We do this by drawing a circle radius radius 0.2 in , and selecting stars in the metallicity range . From this sample, further chemical cuts are made such that bonafide GSE stars must follow (Belokurov & Kravtsov, 2023b, a). Our final GSE GALAH sample contains stars.
To select in-situ stars in our GALAH sample, we again select stars in -, but draw from deeper in the MW potential. We select stars within a circle radius 0.2 in , centred at [0, -2.25] and require only that . The in-situ GALAH sample selected contains stars. To extend to lower metallicities, we also classify the RPA sample into accreted and in-situ. To do this, we simply divide the sample into “accreted” and “in-situ” using the boundary marked in Fig 2 and described in Belokurov & Kravtsov (2023b). Stars above the boundary are deemed accreted, and stars below, in-situ. We note that the sample of in-situ RPA stars is likely contaminated by the most-bound accreted stars (likely accreted at very early times). However, until a more complete low-metallicity sample of in-situ halo stars exists, we are forced to adopt this simple cut.
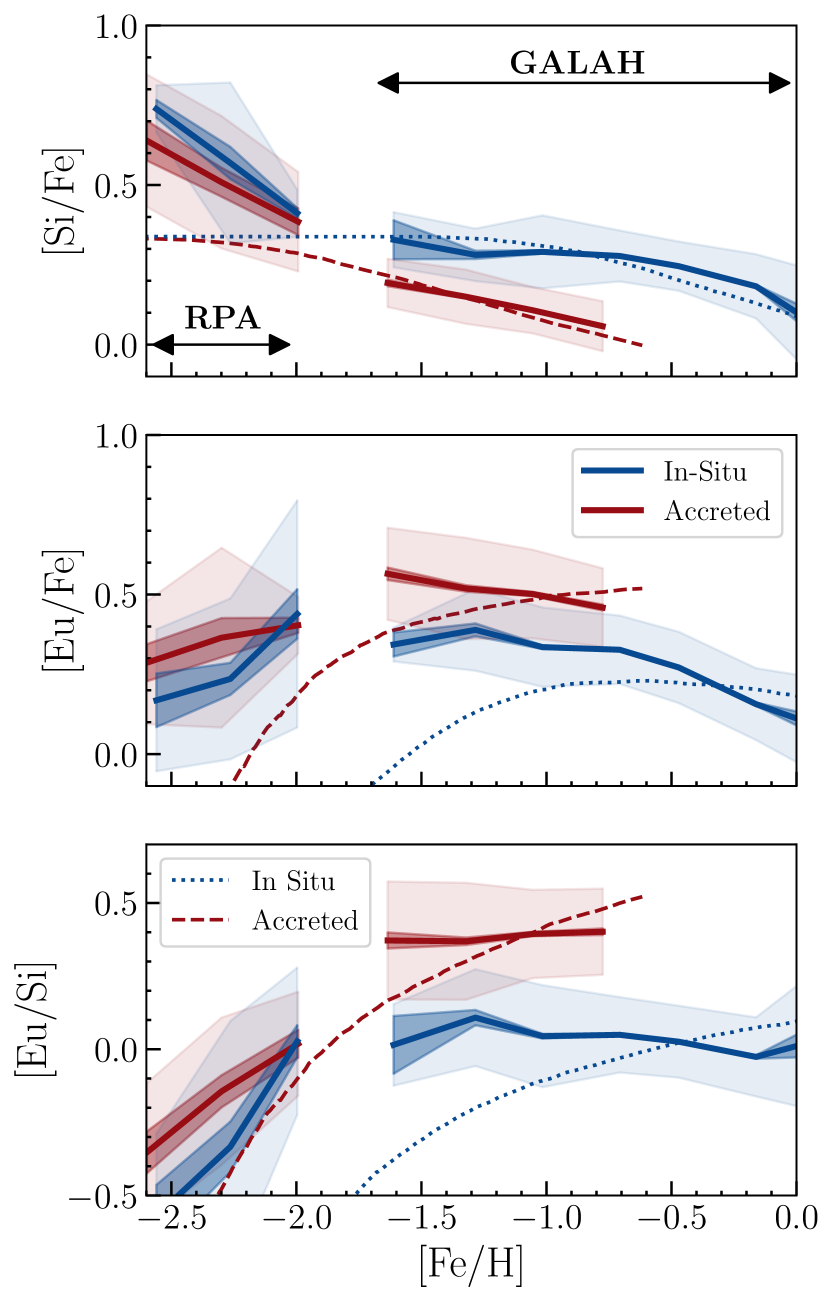
We present our sample of accreted and in-situ field stars in Fig. 4 in red and blue respectively. This colour convention is maintained throughout. We plot the binned mean in Fig. 4, using bins of size 0.3 dex for the GALAH samples and 0.4 dex for the RPA samples. The standard deviation of each sample is shown as the large shaded region, while the median absolute deviation weighted by the number of stars per bin is shown as the smaller, darker shaded region. The GALAH samples maintain separation across the three element ratios ([Si/Fe], [Eu/Fe] and [Eu/Si]). Note that at metallicities lower than [Fe/H] dex in the in-situ selection, we are likely selecting “Aurora” stars, which is speculated to be the primordial component of the MW (Belokurov & Kravtsov, 2022; Myeong et al., 2022). The sustained difference between Aurora and GSE in [Eu/Si] supports different star formation histories for the two ancient galaxies. The low-metallicity combined RPA sample also shows a seperation between in-situ/accreted across the three element ratios. The separation of the two in [Eu/Si] as hinted at in Fig. 2 appears once more. We note the combination of Si and Eu creates a larger dynamical range over which the two samples separate - highlighting its diagnostic power.
3.2 Galactic Chemical Evolution Models
To interpret the presented data samples, we construct simple analytic chemical evolution models as discussed by Weinberg et al. (2017) and Sanders et al. (2021, Sanders, in prep.). For this modelling, we assume that (i) the star formation history (SFH) is linear-exponential (), (ii) the star formation efficiency (SFE) is constant , (iii) the mass-loading factor is constant leading to constant depletion time, , (iv) the stellar products enter a single cold interstellar medium (ISM) phase after some delay time distribution depending on the specific channel and (v) the stellar yields from each channel are metallicity independent. We consider three stellar yield channels: (i) core collapse supernovae (CC) that return Mg, Si and Fe to the ISM instantly, (ii) type Ia supernovae (Ia) that return Si and Fe to the ISM after a delay-time distribution for and (iii) NS mergers that return Eu to the ISM after a delay-time distribution for . These delay-time distributions are handled in an approximate analytic way using a sum of three exponential functions (each of which is analytically tractable, Weinberg et al., 2017). The production of element from each stellar yield channel is parametrized by , the mass of the element returned after an infinite time per unit mass of stars formed. We work with these quantities on the ‘solar scale’ (as reported in the data) i.e. normalized by the mass fraction of element in the Sun as reported in Asplund et al. (2009).
| Parameter | Mean | S.D. |
|---|---|---|
We jointly model both the accreted and in-situ GALAH datasets. For each dataset, we bin the stars into equally-populated bins in and compute median abundances for the th bin and corresponding uncertainties as (approximately one standard deviation) where is the median absolute deviation. For each set of chemical evolution model parameters, we compute the evolution of abundance as and calculate the product of individual datum likelihoods
| (1) |
where product is over abundances. are introduced to account for additional scatter and we set . Each datum has an unknown time that we marginalize over. Note we do not weight the data by the star formation history to mitigate the impact of selection effects (and our binning) on the modelling.
The models are implemented in the probabilistic programming language, Stan (Stan Development Team, 2024). We fit for a set of system-dependent parameters for the th system, , and the ‘universal’ stellar yields from each channel, , which are system-independent. We use the priors listed in Table 2. Note that is chosen as the parametrization of the star formation efficiency because it is this quantity that governs the metallicity scale of the models and without prior information, element production and star formation efficiency are degenerate. The prior on has been chosen using core-collapse supernova yields tables (Woosley & Weaver, 1995; Chieffi & Limongi, 2004; Kobayashi et al., 2006; Pignatari et al., 2016; Ritter et al., 2018) and reasonable initial mass functions (e.g. Kroupa, 2001; Chabrier, 2003), to find combined with the star formation efficiency measurement of from Leroy et al. (2008) (which we convert to the solar abundance scale using the solar mass fraction ). We place a prior on the relative iron production from Type Ia and CC SNe using the number of Type Ia produced per unit stellar mass formed of M from Maoz & Mannucci (2012) and an approximate M⊙ of iron produced per Type Ia. We further place a prior on to encourage the models to reproduce reasonable early plateaus in .
3
3.3 Star Formation efficiency alone cannot explain the difference between GSE and the MW
The GCE models described in the previous section are presented in Fig. 4 across the three element ratios. Recall that the models were only fit to the in-situ and accreted GALAH field star data (above ) in [Si/Fe], [Mg/Fe] and [Eu/Fe]. The best-fit accreted GCE model is marked with dashed blue line in all panels, while the best-fit in-situ model is marked with a red dotted line.
While the models do a great job at replicating the two populations in [Si/Fe] at high metallicities (), neither model does a good job of fitting its respective component at low-metallicities. This is perhaps most perplexing in the ratio of [Si/Fe], where the RPA data for both components is significantly higher than predictions. Examining the [Mg/Fe] abundance ratios presented in fig. 10 of Sakari et al. (2018b), the [Si/Fe] and [Mg/Fe] abundances seem to be generally consistent. However, at , the mean [Mg/Fe] abundance is dex, 0.25 dex lower than the average value of [Si/Fe]. Regardless of the fit to the low-metallicity [Si/Fe] values, the high metallicity end shows a good fit - helping to pin down the star formation efficiencies of the two systems by way of the -knee.
Moving to [Eu/Fe] and [Eu/Si], the most revealing feature of the models is not their inability to fit the individual populations, but rather their inability to replicate the trends seen in both. That is, the metallicity scale predicted by the models and governed by the SFE determined in the fit to [Si/Fe], predicts the appearance of a peak in [Eu/Fe] at higher metallicities than what is seen in the data. This is the case for both populations. Furthermore, while the models predict a continued climb in the ratio of [Eu/Si], both data sets display a plateau across metallicities from .
Considering both the successes and failures of our models across the two populations, we interpret, i) the high-quality fit to [Si/Fe] informing us that SFE alone cannot explain the differences between the two populations, as the metallicity scale set by this SFE fails to predict the evolution of [Eu/FeSi] and, ii) the appearance of the different plateaus in the two populations is the result of the two galaxies reaching different equilibrium levels of [Eu/Si]. Finally, we interpret the upwards trend of [Eu/Si] at low-metallicities as support for NS mergers dominating -process enhancement at early times.
In both the studies of Matsuno et al. (2021) and Naidu et al. (2021), the evolution of [Eu/Mg] is compared across MW stars with different origins. In Matsuno et al. (2021), GSE stars are compared against in-situ MW stars, while Naidu et al. (2021) compare GSE stars to stars from the proposed Kraken merger, theorised to have taken place early on in the MW’s history (Kruijssen et al., 2020). Regardless of the true nature of the non-GSE component, given the selection space of the in-situ and Kraken stars in both Matsuno et al. (2021) and Naidu et al. (2021), overlap in samples is likely. While both studies attribute the difference between populations to the different star formation histories, their explanations differ slightly. Matsuno et al. (2021) argue a more efficient and extended star formation history is needed to explain the low [Eu/Mg] values in the MW at higher metallicities, while Naidu et al. (2021) argue a shorter star formation duration explains the lower value in Kraken (which was truncated before achieving the value seen in GSE).
While the explanation of Naidu et al. (2021) seems plausible if both selections originate in dGals, it is incompatible with the explanation of Matsuno et al. (2021) and with data found in other dGals at similar metallicities. (e.g. in the LMC where dex at despite large differences in the predicted SFH and SFE between the LMC and GSE Van der Swaelmen et al., 2013; Reggiani et al., 2021). If we accept the explanation of Matsuno et al. (2021), that star formation efficiency alone explains the offset (merely a shift in the x-axis due to the MW producing stars to higher metallicities), we would expect the in-situ MW stars to trend up, increasing in [Eu/Si] at higher metallicities. In fact, this is the trend predicted by our simple GCE models. In an upcoming paper (Sanders et al., in prep), we investigate whether multi-zone ISM models can reproduce the flat trends observed in the data.
3.4 Implications of the potential continuation of differences between in-situ and accreted stars below
To explore the robustness of a potential continuation in the difference of [Eu/Si] between accreted and in-situ samples at low-metallicities, we perform a A Kolmogorov-Smirnov (KS) test using Scipy stats.ks_2samp on the two populations in the combined RPA sample. The test returns a global p-value of 0.07 when considering the distributions of [Eu/Si], or a confident rejection of the hypothesis that the two are drawn from the same distribution. If we perform a sliding window KS-test as described in Davies et al. (2024) using a window size of 0.4 dex, we find -values less than or equal to 0.05 ( confidence) for the two populations below . Finally, if we cull the RPA sample to keep only giant stars with and to apply the linear NLTE correction to Eu mentioned in Sec. 2.1.2, and perform the same test, we find a global p-value of 0.04, or confidence that two samples did not originate in the same distribution.
This is in contrast to what has been seen in the literature before, both through simulations and observations. In Skúladóttir & Salvadori (2020), a flat trend in [Eu/Mg] is observed across metallicities in MW field stars. At metallicities of , Skúladóttir & Salvadori (2020) adopt the abundances of Roederer et al. (2014) which, like the RPA data, sit both above and below the accreted-in-insitu boundary in - (when placed in our same potential). Examining the [Eu/Mg] distribution of the two populations in Roederer et al. (2014) (limited by the small number of stars with well-measured [Mg/Fe] and Gaia data, ) we again find that the accreted sample is enhanced in [Eu/Mg]. Performing the same KS-Test (as-in the RPA sample) we find a p-value of ( confidence that the two samples are not drawn from the same distribution.)
Across the metallicity interval where Skúladóttir & Salvadori (2020) utilise the Roederer et al. (2014) data, the in-situ sample has an average value of , in contrast to the accreted sample at . This is in agreement with our finding, that the ratio of [Eu/] in the in-situ population decreases at higher metallicities more rapidly than the accreted population. In summary, if the two populations are not resolved, this would lead to the interpretation that the MW (in-situ) population maintains a flat mean abundance in [Eu/Mg] () with large scatter.
Some analytical galactic chemical evolution models have assessed their validity in reproducing the MW by capturing the apparently flat trend of [Eu/] or [Eu/Fe] with time. The model of Kobayashi et al. (2020b), a one-zone model with outflows and many production sites, predicts the flat trend of [Eu/Fe] and [Eu/O] at low-metallicities (Kobayashi et al., 2023). When comparing the model to observational datasets of halo stars, the flat trend fits the data well because of the apparently large dispersion at low-metallicities.
In addition to using the flat trend to constrain the global SFH of the MW, the analytical model of Kobayashi et al. (2023) also uses the apparent trend to determine the rate of magneto-rotational SNe in their models. Even if we apply the linear NLTE correction discussed in Sec. 2.1.2 associated with the blue line of Eu, we find that the ratio of [Eu/Si] continues to decrease in both populations at low-metallicities. While magneto-rotational SNe enrich in both and -process producing the flat trend in [Eu/], our result implies that a more pure -process channel like NS mergers better predicts the evolving trend seen in [Eu/Si].
The origin of the large scatter in [Eu/Fe] and [Eu/] at low-metallicities in the MW has recently been probed using cosmological simulations (Haynes & Kobayashi, 2019; van de Voort et al., 2020; Hirai et al., 2022). In van de Voort et al. (2020), they introduce -process elements into 16 MW-like galaxies from the AURIGA simulation suite (Grand et al., 2017). They do this by implementing the -process elements as “passive tracers”, meaning that they are released into the interstellar medium (ISM) without impacting the dynamical evolution of the galaxy. They implement two sites, rare core collapse SNe and neutron star mergers stochastically, fixing the yields from each across all metallicities.
To assess the agreement between their model and observations of MW stars, van de Voort et al. (2020) look at the evolution of the mean abundance of [Eu/Fe] for both disc and halo stars (at ) in their simulations. To compare to observations they use low-metallicities stars from the SAGA database (Suda et al., 2008), undoubtedly composed of both in-situ and accreted stars. However, van de Voort et al. (2020) know the origin of their MW stars exactly, finding only 8% of the total stars in their selection to have an ex-situ origin. This number increases substantially at low-metallicities, with 78% of the stars below having formed ex-situ - the metallicity at which the dispersion in [Eu/Fe] increases. Resolving abundance differences in low-metallicity observational datasets between accreted/in-situ stars would make it possible to exploit knowledge of the origin and thus, the star formation history of the progenitors provided by simulations.
Ultimately, van de Voort et al. (2020) are unable to determine whether their fiducial NS merger model, which predicts a rise in [Eu/Fe] with metallicity at early times, and their rare CCSNe model, which predicts a flat value of [Eu/Fe] across metallicities, better reflects the observations. This is also the case in Haynes & Kobayashi (2019). While the presence of large dispersion in [Eu/Fe] and [Eu/] at low-metallicities can be reproduced in hydrodynamical simulations, decoupling the physical source of the dispersion (site and efficiency of -process production) from the accretion history of the galaxy may not be possible without knowing the origin of the stars (and the unique star formation histories of their progenitors). That is, without knowing the fractional contribution of the in-situ and accreted components in observational data, it is likely impossible to disentangle the physical source of the dispersion from the selection function of the study.
Recently, Ou et al. (2024) also observe a downwards trend in [Eu/Mg] in GSE stars at low-metallicities, however they have relatively few (eleven) stars in their study below (it is unclear whether this is an LTE or NLTE metallicity). Below they find a large dispersion in [Eu/Mg], which they interpret as being due to delayed -process enrichment with plausible delay times ranging from 10 - 500 Myr. While we likely need more bonafide in-situ stars at low-metallicities to explore the significance of the difference between populations, we are confident in the general downwards trend we also find in both populations at low-metallicities. As discussed in the next section, accreted GCs in our dataset, specifically those identified by Myeong et al. (2019) as belonging to GSE, trace the same trend seen in the field stars - namely a downwards trends with decreasing metallicities, seen in both [Eu/Si] and [Eu/Fe]. Furthermore, the GCs provide tight abundance constraints in both [Eu/] and [Fe/H]. Finally, the agreement seen in the GCs is not the result of Eu, nor Si, in isolation, but the evolution of both. We discuss possible extensions of this discovery in the next section.
3.5 Possible Constraints from Globular Clusters
In Fig. 5, we again plot the accreted and in-situ field star populations, but this time present the GALAH sample as a column-normalised “cloud”, binned first in metallicity and then column-normalised. In addition to the field star populations, we include, in the middle panel, all the GCs in our sample which have been classified as in-situ by Belokurov & Kravtsov (2023a) (after removing NGC 5139 and NGC 6273 which they note are likely mis-classified) and in the final panel, GCs which were flagged as being associated with GSE by Myeong et al. (2019). \textcolorpurple
To bring our GC abundances onto the same scale as GALAH, we compared the [Si/Fe] and [Eu/Fe] abundances for clusters in common between our study and GALAH DR3 (NGC 288, NGC 362, NGC 1851 and NGC 5139). Note that we choose not to adopt GALAH abundances for any of the GCs in our sample as they are known to exhibit unphysical chemical trends with stellar parameters. This will be addressed in future abundance releases of GCs from GALAH. We calculated the offsets using only RGB stars in the GALAH GC sample in an effort to match our high resolution compilation methodology as closely as possible. On average we found an offset of dex in [Si/Fe] between our GC compilation and that of GALAH and and offset of in [Eu/Fe]. As such, the GCs were shifted downwards by 0.15 dex in [Si/Fe] and upwards by 0.05 dex in [Eu/Fe] (resulting in an upwards shift of 0.20 dex in [Eu/Si]) in Fig. 5.
Beginning first with the final (right-most) column, of Fig. 5 we show the intersection of our GC data set with the population of GSE GCs published in Myeong et al. (2019). The same KS-test of the means applied to the in-situ GCs was also applied to the GSE GCs. The test, strongly rejects the hypothesis that the accreted GCs and in-situ distributions are drawn from the same distribution (), while the accreted GCs/accreted field star KS-test cannot reject that the two were drawn from the same distribution (). We find the agreement between the GSE GCs and the accreted field star population across metallicities, in all three panels, remarkable for two reasons.
The first reason is how tight the sequence of GCs is across the three ratios. We speculate that this may be the clearest rise in [Eu/] seen in any dataset to-date, potentially providing the strongest support for the importance of NS mergers at early times. As discussed in the previous section, the prediction of large dispersion in [Eu/Fe] (and by extension [Eu/Si]) at low-metallicities by hydrodynamic simulations is not seen in the population of GSE GCs. In this way, the elemental abundances of GCs could be used to place constraints on the chemical history of the progenitor down to low metallicities with higher precision that is currently achieved in field stars. We revisit the validity of this statement in the next section.
The second reason we find the agreement between GSE field stars and GCs to be remarkable, is the possibility of adding an additional dimension through the relatively precise GC ages. At low-metallicities sub-Gyr age precision from isochronal ages are possible for GCs (Ying et al., 2023). In contrast, while astroseismic ages of individual field stars stars below may be possible (as demonstrated in Alencastro Puls et al., 2022), uncertainties increase drastically beyond five Gyr (from Gyr at 9 Gyr, to Gyr at 13 Gyr). Label-transfer methods for field stars trained on high quality astroseismic ages also show large discrepancies for stars older than 10 Gyr (ages are underpredicted by Gyr on average Mackereth et al., 2019).
In the case of datasets like VandenBerg et al. (2013) or Marín-Franch et al. (2009), large numbers of GC ages () derived using a consistent methodology (choice of isochrone) can provided ages down to metallicities of with a precision perhaps unachievable in field stars. In this way, the GCs can provide precise timestamps for the GCE model, mapping between metallicity and time. In the case of the GSE GCs, cross-matching the GSE-tagged GCs in our sample using the list of Myeong et al. (2019) with ages from VandenBerg et al. (2013) results in the ratio of [Eu/Si] increasing from 0 to dex over a period of one Gyr. The entire sequence from dex to dex spans 1.75 Gyr, placing constraints on the star formation efficiency and history of the GSE progenitor.
Moving to the in-situ GCs (shown in the middle panel of Fig. 5), we can see that at metallicities above [Fe/H], the in-situ group follows the in-situ field stars nicely in [Si/Fe]. In [Eu/Fe], the high-metallicity in-situ GCs display increased dispersion, spanning both in-situ and accreted. In [Eu/Si] however, the high-metallicity GCs show show better agreement with the in-situ field stars on average, aided by the distinguishing power of [Si/Fe].
A KS-test comparing the binned mean values of the in-situ GCs across metallicities with the binned mean of the in-situ RPA + GALAH sample cannot reject the hypothesis that the they were drawn from the same distribution (, strongly supporting the Null hypothesis). This is not the case of the in-situ GC/accreted RPA + GALAH sample comparison which rejects the same hypothesis with 95% certainty ().
At low-metallicities (), the agreement between in-situ field stars and GCs breaks down. Of the GCs in this region, NGC 6205 (=-1.50) has the second highest value of [Eu/Si] ( dex) and is the closest GC the accreted/in-situ boundary in E-Lz. For this reason we suggest it may be mis-classified and have marked it with a black dot inside the white marker in all panels.
The other outlier in [Eu/Si] among the in-situ GCs, is the lowest metallicity GC, NGC 7078. We have also marked this cluster with a black dot in the middle panel of Fig. 5. This enhancement in [Eu/Si] in NGC 7078 is at a level unseen among accreted field stars at the same metallicity. This is driven by a large, but uncertain Eu-enhancement (). Recently, Cabrera Garcia et al. (2024) confirmed a large spread in [Eu/Fe] () in the cluster using measurements of 62 stars (significantly more than the study of Sobeck et al., 2011). Note that Cabrera Garcia et al. (2024) do not report a value [Si/Fe] for the cluster, hence why we have adopted [Eu/Si] from Sobeck et al. (2011).
Cabrera Garcia et al. (2024) report a similar mean value of [Eu/Fe] to Sobeck et al. (2011) () but note that this is the average of two distinct populations of Eu-stars (also observed in Worley et al., 2013). They detect a possible correlation between Na and Eu, contrary to what Roederer (2011) found. However, they hypothesise that this is the result of -process enrichment during the formation of the first generation of stars - maintaining a connection between the host environment. The large overall Eu-enhancement of the cluster, the speculate, is likely linked to the proximity of the -process enrichment event.
4 Globular Clusters Trace the Chemical Histories of their Hosts
In this section, we continue to explore the agreement between field star abundances in dGals and their clusters, across metallicities. Motivated by the results in Sec. 3.5, we focus on other dGal systems, specifically the Large M. Cloud444We acknowledge that the continued use of the name Magellan is both potentially traumatic for Indigenous peoples and factually incorrect, as he did not discover the clouds. We advocate for the adoption of a new naming scheme and abbreviate the name only for the remainder of this paper. (LMC) and Sagittarius (Sgr) dGal and their clusters. We focus on these two galaxies because they i) have large systems of GCs with high quality measurements, and ii) have published field star [Eu/Si] abundances across a large range of metallicites. Pushing beyond the MW, and thanks to the groundbreaking technique of extracting high-precision abundances from integrated light spectroscopy (Sakari et al., 2015), we explore the [Eu/Si] abundances in GCs around M 31 and discuss the potential of classifying extra-galactic GCs as in-situ and accreted.
4.1 In Local Group dGals
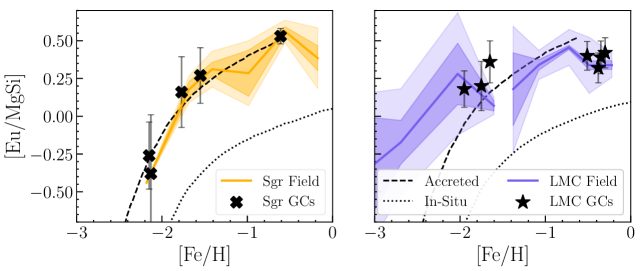
Fig. 6 presents data for field stars and clusters in Sgr and the LMC, showcasing the remarkable agreement between the evolution of [Eu/Si] as a function of metallicity across both field stars and clusters in the two systems. Sgr is shown in the left panel, where the mean abundance (and dispersion) of [Eu/Mg] is plotted using field stars from the study of Reichert et al. (2020) in yellow. Sgr GCs identified (or confirmed) by Vasiliev et al. (2021) are included using the black crosses taking their [Eu/Si] abundances from our literature compilation.
The right panel shows the mean values (and dispersion) of [Eu/Si] in LMC field stars from Pompéia et al. (2008), Van der Swaelmen et al. (2013), Reggiani et al. (2021) and Oh et al. (2023) in purple, with LMC GCs from the studies of Mucciarelli et al. (2008) and Mucciarelli et al. (2010) over-plotted with star symbols. Abundances from Mucciarelli et al. (2008) and Mucciarelli et al. (2010), are derived from between five to eleven stars in each GC. Note that the extremely low-metallicity data from Oh et al. (2023) includes upper limits for five of the seven stars in their study.
To provide further support for the idea that GCs trace the star formation history of their hosts, we include predictions from the GCE models introduced in the previous section. The dGal GCE model tailored to GSE is plotted using the dashed line, while the MW model is plotted with a dotted line in both panels. The agreement between our GCE model tailored to GSE and the Sgr stars (both field and GCs) is striking. In their study of star formation histories in dGals, Hasselquist et al. (2021) derive a star formation efficiency in GSE that is five times higher than the efficiency in Sgr. Therefore, we interpret the fit to the Sgr data as further evidence that SFE alone cannot explain the appearance of elevated [Eu/Si] in dGals at late times.
4.2 Beyond the MW, in M31
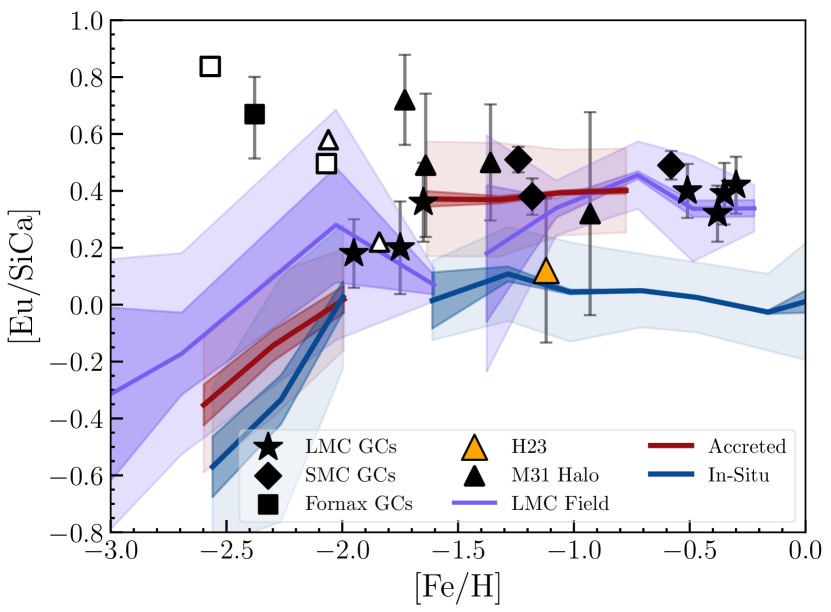
We now expand our exploration of [Eu/Si] beyond the MW into the system of GCs around M 31. We also include data for GCs in the Small M. Cloud (SMC) and Fornax in this discussion as they provide further support for the appearance of elevated [Eu/Si] abundances in GCs surrounding dGals. We do not consider field star abundances in this section as the metallicity coverage of the data is sparse at low-metallicities in Fornax and the SMC. Eu measurements have not been made for field stars in M 31, though we note that -element abundances have been made in resolved field stars in M 31 (Escala et al., 2019).
Data for SMC GCs comes from the recent study of Mucciarelli et al. (2023), for the GCs NGC 121, NGC 339 and NGC 419 using measurements of between five to eight stars in each. Data for the Fornax GCs, 1, 2 and 3 is taken from the study of Letarte et al. (2006) averaging measurements for two to three stars in each. Because Letarte et al. (2006) did not meausure Si in their study, we adopt Ca as our -tracer to include the Fornax GCs. We justify this choice by noting that the published Ca abundances of GCs in our compilation are on average only 0.1 dex lower than Si.
Data for GCs in the halo of M 31 comes from the integrated light study of Sakari et al. (2015), who examined GCs associated with substructure around the galaxy. These measurements include data for the GCs, PA 17, H 23, H 10, PA 53, PA 56 and PA 06, three of which have only upper limits of Eu. Note that the naming conventions for these GCs follows that of Sakari et al. (2015) which in-turn adopts the conventions of Huxor et al. (2008) and Huxor et al. (2014). For the studies which explicitly include their line lists (Letarte et al., 2006; Sakari et al., 2015), the 6645Å line of Eu is used to determine Eu-abundances, which is consistent with our study. Upper limits for all studies are denoted using empty symbols, while measurements are filled (and have corresponding uncertainties).
The distribution of the extra-galactic GCs in [Eu/Si] vs. [Fe/H]-space is shown in Fig. 7, alongside the mean LMC field star and GALAH in-situ sample abundances. The first thing of note is the continued appearance of an elevated ratio of [Eu/Si] in the GCs associated with both dGals and the halo of M 31 relative to the MW in-situ field star sample, with the exception of the M 31 GC, H 23. This enhancement mirrors what is seen in the population of GCs associated with GSE (e.g. see the lower right panel in Fig. 5). The Fornax GCs appear super enhanced in [Eu/Si(Ca)] at very low metallicities, which is driven in the case of Fornax 3 (the only GC with a true measurement, rather than an upper limit, denoted by open symbols in Fig. 7), by truly enhanced Eu ( dex).
An explanation for the single outlying GC mentioned previously, H 23, is an interesting and potentially powerful one. When considering the projected distance of the GCs around M 31, H 23 lies the closest to the main body of M 31. H 23 is also the second most metal-rich GC () in the M 31 sample and was found by Sakari et al. (2015) to have chemistry consistent with both MW field stars and MW GCs at the same metallicity. Finally, Sakari et al. (2015) also note that despite initial evidence that H 23 could be associated with Stream D in M 31 from the study of Mackey et al. (2010), that follow-up radial velocity measurements from Veljanoski et al. (2014) likely rule this out.
Given that the chemo-dynamical evidence surrounding H 23 suggests that it may not be associated with substructure, it could be that its association with the GCE track of a larger galaxy suggests an in-situ origin. If this is the case, and the trend of an overabundance of [Eu/Si] in other dGal GCs is to be believed, the ratio of [Eu/Si] in GCs surrounding other galaxies could be used to discern which originated around dGals and were then later accreted. In the era of extremely large telescopes, with the ability to resolve large numbers of stars in GCs around other galaxies, this could be a means of exploring the accretion history of those galaxies (e.g. using ANDES on the Extrelemy Large Telescope, Roederer et al., 2023).
5 Conclusions
In this study we explored the use of the -process element, europium (Eu) as a chemical differentiator between populations of in-situ and accreted field stars and their globular clusters (GCs). By combining information from light () and heavy (-process) elements, we find the ratio of [Eu/Si] resolves the different star formation histories of both in-situ and accreted field stars and GCs across a large range in metallicities (), with more [Eu/Si] measurements needed at the lowest-metallicities to confirm this.
The main results of this study are summarised in the following:
-
•
We demonstrate the existence of a significant change in the overall abundance ratio of [Eu/Si] across the dynamical boundary in E-Lz separating in-situ from accreted stars (as defined previously by, Myeong et al., 2018b; Belokurov & Kravtsov, 2023b). Stars with energies higher than approximately Solar (accreted) exhibit an elevated value of [Eu/Si], largely driven by [Eu/Fe], while those below this energy level (in-situ) have lower [Eu/Si]. At high metallicities, these differences persist through two distinct plateaus across metallicity in the two populations.
-
•
We provide evidence that these global [Eu/Si] trends may persist down to low metallicities (). While the average levels of [Eu/Si] decrease with decreasing [Fe/H] across both samples, in-situ stars with lower total energies have systematically lower [Eu/Si] relative to accreted stars above the dynamical boundary. This implies that the [Eu/] scatter within a single galaxy is lower than previously estimated.
-
•
We suggest that the difference between the two sequences is not caused by differences in star formation efficiency (SFE) as previously suggested (Matsuno et al., 2021; Naidu et al., 2021). This is supported by the failure of SFEs derived from high-quality fits to the -[Fe/H] plane to fit either [Eu/Fe] or [Eu/Si]. Follow-up multi-zone GCE models will explore whether a multi-phase ISM is needed to explain the differences.
-
•
Because of this difference, we suggest galactic chemical evolution models and hydrodynamic simulations consider the origin (accreted/in-situ) of stars in when comparing to observational data sets. To differentiate the two populations, the simple dynamical cut in - introduced in Belokurov & Kravtsov (2023b) could be applied.
-
•
From a literature compilation of 46 globular clusters (GCs), we find that accreted GCs trace the [Eu/Si] abundance evolution of accreted field stars across metallicities remarkably well. These results support the primordial origin of Eu in some GCs, as suggested by previous works (Roederer, 2011; Koch-Hansen et al., 2021; Monty et al., 2023a; Kirby et al., 2023).
-
•
Using ages from VandenBerg et al. (2013) for the population of GSE GCs taken from Myeong et al. (2019), an enrichment of 0.75 dex in [Eu/Si] (from -0.25 to 0.5 dex) occurs in GSE over the time span of 1.75 Gyr, presenting the opportunity for sub-Gyr timing resolution when building host galaxy star formation histories.
-
•
In both accreted and in-situ field stars and more significantly in GCs, we find a downwards trend in [Eu/Si] at low-metallicities. This trend persists after applying NLTE corrections to Eu. We suggest that this preferentially supports enhancement by neutron star mergers over magneto-rotational supernovae (which produce a flat trend in [Eu/Si]).
-
•
We suggest that [Eu/Si] could be used as a chemical tag beyond the MW, based on evidence that GCs trace field star [Eu/Si] abundances in Local Group dwarf galaxies (dGals). We show this is also true in the halo of M 31, where the GC H 23 displays an in-situ-like [Eu/Si] abundance ratio which supports its lack of association with substructure.
Acknowledgements
SM wishes to thank Erika Holmbeck for her incredibly helpful comments that greatly improved the paper. SM also wishes to thank Kim Venn, Keith Hawkins, Tadafumi Matsuno and Zhen Yuan for helpful conversations on abundances in metal-poor stars and the organisers of the 2023 MIAPbP meeting “Stellar Astrophysics in the Era of Gaia, Spectroscopic, and Astroseismic Surveys”, Maria Bergemann, Daniel Huber, Saskia Hekker, Amanda Karakas and Rolf-Peter Kudritzki for supporting an incredibly enriching and collaborative environment where this work began. JLS acknowledges support from the Royal Society (URF\R1\191555). T.T.H acknowledges support from the Swedish Research Council (VR 2021-05556). AAA acknowledges support from the Herchel Smith Fellowship at the University of Cambridge and a Fitzwilliam College research fellowship supported by the Isaac Newton Trust. Based on observations made with ESO Telescopes at the La Silla Paranal Observatory under programme IDs 072.D-507 and 073.D-0211. This work relies heavily on the Astropy (Astropy Collaboration et al., 2013, 2018), SciPy (Virtanen et al., 2020), NumPy (Harris et al., 2020) and Matplotlib (Hunter, 2007) libraries and Jupyter notebooks (Kluyver et al., 2016). This work makes use of data from the GALAH survey, observed using the Anglo-Australian Telescope on the unceded territory of the Gamilaraay people. We acknowledge the traditional custodians of the land and pay our respects to elders past and present.
Data Availability
This study makes use of existing literature data as shown in Table 1 and public data releases. Equivalent widths for the two GCs analysed in this study are available upon request.
References
- Abdurro’uf et al. (2022) Abdurro’uf et al., 2022, ApJS, 259, 35
- Aguado et al. (2021) Aguado D. S., et al., 2021, ApJ, 908, L8
- Alencastro Puls et al. (2022) Alencastro Puls A., Casagrande L., Monty S., Yong D., Liu F., Stello D., Aguirre Børsen-Koch V., Freeman K. C., 2022, MNRAS, 510, 1733
- Amarsi et al. (2020) Amarsi A. M., et al., 2020, A&A, 642, A62
- Andrews et al. (2017) Andrews B. H., Weinberg D. H., Schönrich R., Johnson J. A., 2017, ApJ, 835, 224
- Asplund et al. (2009) Asplund M., Grevesse N., Sauval A. J., Scott P., 2009, ARA&A, 47, 481
- Astropy Collaboration et al. (2013) Astropy Collaboration et al., 2013, A&A, 558, A33
- Astropy Collaboration et al. (2018) Astropy Collaboration et al., 2018, AJ, 156, 123
- Bastian & Lardo (2018) Bastian N., Lardo C., 2018, ARA&A, 56, 83
- Belokurov & Kravtsov (2022) Belokurov V., Kravtsov A., 2022, MNRAS, 514, 689
- Belokurov & Kravtsov (2023a) Belokurov V., Kravtsov A., 2023a, arXiv e-prints, p. arXiv:2309.15902
- Belokurov & Kravtsov (2023b) Belokurov V., Kravtsov A., 2023b, MNRAS, 525, 4456
- Belokurov et al. (2018) Belokurov V., Erkal D., Evans N. W., Koposov S. E., Deason A. J., 2018, MNRAS, 478, 611
- Belokurov et al. (2020) Belokurov V., Sanders J. L., Fattahi A., Smith M. C., Deason A. J., Evans N. W., Grand R. J. J., 2020, MNRAS, 494, 3880
- Belokurov et al. (2023) Belokurov V., Vasiliev E., Deason A. J., Koposov S. E., Fattahi A., Dillamore A. M., Davies E. Y., Grand R. J. J., 2023, MNRAS, 518, 6200
- Bernstein et al. (2003) Bernstein R., Shectman S. A., Gunnels S. M., Mochnacki S., Athey A. E., 2003, in Iye M., Moorwood A. F. M., eds, Society of Photo-Optical Instrumentation Engineers (SPIE) Conference Series Vol. 4841, Instrument Design and Performance for Optical/Infrared Ground-based Telescopes. pp 1694–1704, doi:10.1117/12.461502
- Bisterzo et al. (2011) Bisterzo S., Gallino R., Straniero O., Cristallo S., Käppeler F., 2011, MNRAS, 418, 284
- Blanchard et al. (2017) Blanchard P. K., et al., 2017, ApJ, 848, L22
- Brown et al. (1999) Brown J. A., Wallerstein G., Gonzalez G., 1999, AJ, 118, 1245
- Buder et al. (2021) Buder S., et al., 2021, MNRAS, 506, 150
- Buder et al. (2022) Buder S., et al., 2022, MNRAS, 510, 2407
- Burbidge et al. (1957) Burbidge E. M., Burbidge G. R., Fowler W. A., Hoyle F., 1957, Reviews of Modern Physics, 29, 547
- Busso et al. (1999) Busso M., Gallino R., Wasserburg G. J., 1999, ARA&A, 37, 239
- Cabrera Garcia et al. (2024) Cabrera Garcia J., et al., 2024, arXiv e-prints, p. arXiv:2403.00063
- Callingham et al. (2022) Callingham T. M., Cautun M., Deason A. J., Frenk C. S., Grand R. J. J., Marinacci F., 2022, MNRAS, 513, 4107
- Carney et al. (2008) Carney B. W., Gray D. F., Yong D., Latham D. W., Manset N., Zelman R., Laird J. B., 2008, AJ, 135, 892
- Carretta et al. (2004) Carretta E., Gratton R. G., Bragaglia A., Bonifacio P., Pasquini L., 2004, A&A, 416, 925
- Carretta et al. (2007a) Carretta E., et al., 2007a, A&A, 464, 967
- Carretta et al. (2007b) Carretta E., et al., 2007b, A&A, 464, 967
- Carretta et al. (2009a) Carretta E., et al., 2009a, A&A, 505, 117
- Carretta et al. (2009b) Carretta E., Bragaglia A., Gratton R., Lucatello S., 2009b, A&A, 505, 139
- Carretta et al. (2011) Carretta E., Lucatello S., Gratton R. G., Bragaglia A., D’Orazi V., 2011, A&A, 533, A69
- Carretta et al. (2013) Carretta E., et al., 2013, A&A, 557, A138
- Carretta et al. (2015) Carretta E., et al., 2015, A&A, 578, A116
- Carrillo et al. (2022) Carrillo A., Hawkins K., Jofré P., de Brito Silva D., Das P., Lucey M., 2022, MNRAS, 513, 1557
- Carrillo et al. (2023) Carrillo A., Deason A. J., Fattahi A., Callingham T. M., Grand R. J. J., 2023, MNRAS,
- Chabrier (2003) Chabrier G., 2003, PASP, 115, 763
- Chen & Gnedin (2024) Chen Y., Gnedin O. Y., 2024, MNRAS, 527, 3692
- Chieffi & Limongi (2004) Chieffi A., Limongi M., 2004, ApJ, 608, 405
- Cohen & Kirby (2012) Cohen J. G., Kirby E. N., 2012, ApJ, 760, 86
- Cohen & Meléndez (2005) Cohen J. G., Meléndez J., 2005, AJ, 129, 303
- Côté et al. (2017) Côté B., O’Shea B. W., Ritter C., Herwig F., Venn K. A., 2017, ApJ, 835, 128
- Côté et al. (2018) Côté B., et al., 2018, ApJ, 855, 99
- Cowan et al. (1991) Cowan J. J., Thielemann F.-K., Truran J. W., 1991, Phys. Rep., 208, 267
- Davies et al. (2024) Davies E. Y., Monty S., Belokurov V., Dillamore A. M., 2024, MNRAS, 529, 772
- Dekker et al. (2000) Dekker H., D’Odorico S., Kaufer A., Delabre B., Kotzlowski H., 2000, in Iye M., Moorwood A. F., eds, Society of Photo-Optical Instrumentation Engineers (SPIE) Conference Series Vol. 4008, Optical and IR Telescope Instrumentation and Detectors. pp 534–545, doi:10.1117/12.395512
- Donlon & Newberg (2023) Donlon T., Newberg H. J., 2023, ApJ, 944, 169
- Donlon et al. (2020) Donlon Thomas I., Newberg H. J., Sanderson R., Widrow L. M., 2020, ApJ, 902, 119
- Donlon et al. (2022) Donlon Thomas I., Newberg H. J., Kim B., Lépine S., 2022, ApJ, 932, L16
- Escala et al. (2019) Escala I., Kirby E. N., Gilbert K. M., Cunningham E. C., Wojno J., 2019, ApJ, 878, 42
- Ezzeddine et al. (2020) Ezzeddine R., et al., 2020, ApJ, 898, 150
- Feuillet et al. (2021) Feuillet D. K., Sahlholdt C. L., Feltzing S., Casagrande L., 2021, MNRAS, 508, 1489
- Forbes (2020) Forbes D. A., 2020, MNRAS, 493, 847
- Gaia Collaboration et al. (2018) Gaia Collaboration et al., 2018, A&A, 616, A10
- Gonzalez & Wallerstein (1998) Gonzalez G., Wallerstein G., 1998, AJ, 116, 765
- Grand et al. (2017) Grand R. J. J., et al., 2017, MNRAS, 467, 179
- Gratton et al. (2019) Gratton R., Bragaglia A., Carretta E., D’Orazi V., Lucatello S., Sollima A., 2019, A&ARv, 27, 8
- Gray & Toner (1986) Gray D. F., Toner C. G., 1986, ApJ, 310, 277
- Grevesse & Sauval (1998) Grevesse N., Sauval A. J., 1998, Space Sci. Rev., 85, 161
- Gudin et al. (2021) Gudin D., et al., 2021, ApJ, 908, 79
- Gustafsson et al. (2008) Gustafsson B., Edvardsson B., Eriksson K., Jørgensen U. G., Nordlund Å., Plez B., 2008, A&A, 486, 951
- Hansen et al. (2018) Hansen T. T., et al., 2018, ApJ, 858, 92
- Hansen et al. (2021) Hansen T. T., et al., 2021, ApJ, 915, 103
- Harris et al. (2020) Harris C. R., et al., 2020, Nature, 585, 357
- Hasselquist et al. (2021) Hasselquist S., et al., 2021, ApJ, 923, 172
- Haynes & Kobayashi (2019) Haynes C. J., Kobayashi C., 2019, MNRAS, 483, 5123
- Haywood et al. (2018) Haywood M., Di Matteo P., Lehnert M. D., Snaith O., Khoperskov S., Gómez A., 2018, ApJ, 863, 113
- Helmi et al. (2018) Helmi A., Babusiaux C., Koppelman H. H., Massari D., Veljanoski J., Brown A. G. A., 2018, Nature, 563, 85
- Hirai et al. (2022) Hirai Y., Beers T. C., Chiba M., Aoki W., Shank D., Saitoh T. R., Okamoto T., Makino J., 2022, MNRAS, 517, 4856
- Holmbeck & Andrews (2024) Holmbeck E. M., Andrews J. J., 2024, ApJ, 963, 110
- Holmbeck et al. (2020) Holmbeck E. M., et al., 2020, ApJS, 249, 30
- Horta et al. (2020) Horta D., et al., 2020, MNRAS, 493, 3363
- Horta et al. (2021) Horta D., et al., 2021, MNRAS, 500, 5462
- Hunter (2007) Hunter J. D., 2007, Computing in Science & Engineering, 9, 90
- Huxor et al. (2008) Huxor A. P., Tanvir N. R., Ferguson A. M. N., Irwin M. J., Ibata R., Bridges T., Lewis G. F., 2008, MNRAS, 385, 1989
- Huxor et al. (2014) Huxor A. P., et al., 2014, MNRAS, 442, 2165
- Ivans et al. (2001a) Ivans I. I., Kraft R. P., Sneden C., Smith G. H., Rich R. M., Shetrone M., 2001a, AJ, 122, 1438
- Ivans et al. (2001b) Ivans I. I., Kraft R. P., Sneden C., Smith G. H., Rich R. M., Shetrone M., 2001b, AJ, 122, 1438
- James et al. (2004) James G., François P., Bonifacio P., Carretta E., Gratton R. G., Spite F., 2004, A&A, 427, 825
- Jean-Baptiste et al. (2017) Jean-Baptiste I., Di Matteo P., Haywood M., Gómez A., Montuori M., Combes F., Semelin B., 2017, A&A, 604, A106
- Ji et al. (2016) Ji A. P., Frebel A., Simon J. D., Chiti A., 2016, ApJ, 830, 93
- Ji et al. (2019) Ji A. P., Simon J. D., Frebel A., Venn K. A., Hansen T. T., 2019, ApJ, 870, 83
- Johnson & Pilachowski (2010) Johnson C. I., Pilachowski C. A., 2010, ApJ, 722, 1373
- Johnson et al. (2017a) Johnson C. I., Caldwell N., Rich R. M., Mateo M., John I. Bailey I., Clarkson W. I., Olszewski E. W., Walker M. G., 2017a, AJ, 836, 168
- Johnson et al. (2017b) Johnson C. I., Caldwell N., Rich R. M., Mateo M., Bailey John I. I., Olszewski E. W., Walker M. G., 2017b, ApJ, 842, 24
- Jurić et al. (2008) Jurić M., et al., 2008, ApJ, 673, 864
- Kacharov et al. (2013) Kacharov N., Koch A., McWilliam A., 2013, A&A, 554, A81
- Käppeler et al. (2011) Käppeler F., Gallino R., Bisterzo S., Aoki W., 2011, Reviews of Modern Physics, 83, 157
- Karakas & Lattanzio (2014) Karakas A. I., Lattanzio J. C., 2014, Publ. Astron. Soc. Australia, 31, e030
- Karakas et al. (2009) Karakas A. I., van Raai M. A., Lugaro M., Sterling N. C., Dinerstein H. L., 2009, ApJ, 690, 1130
- Kirby et al. (2023) Kirby E. N., Ji A. P., Kovalev M., 2023, arXiv e-prints, p. arXiv:2308.10980
- Kluyver et al. (2016) Kluyver T., et al., 2016, in Loizides F., Schmidt B., eds, Positioning and Power in Academic Publishing: Players, Agents and Agendas. pp 87 – 90
- Kobayashi et al. (2006) Kobayashi C., Umeda H., Nomoto K., Tominaga N., Ohkubo T., 2006, ApJ, 653, 1145
- Kobayashi et al. (2020a) Kobayashi C., Karakas A. I., Lugaro M., 2020a, ApJ, 900, 179
- Kobayashi et al. (2020b) Kobayashi C., Karakas A. I., Lugaro M., 2020b, ApJ, 900, 179
- Kobayashi et al. (2023) Kobayashi C., et al., 2023, ApJ, 943, L12
- Koch & Côté (2017) Koch A., Côté P., 2017, A&A, 601, A41
- Koch-Hansen et al. (2021) Koch-Hansen A. J., Hansen C. J., McWilliam A., 2021, A&A, 653, A2
- Koch et al. (2009) Koch A., Côté P., McWilliam A., 2009, A&A, 506, 729
- Kolborg et al. (2022) Kolborg A. N., Martizzi D., Ramirez-Ruiz E., Pfister H., Sakari C., Wechsler R. H., Soares-Furtado M., 2022, ApJ, 936, L26
- Koppelman et al. (2018) Koppelman H., Helmi A., Veljanoski J., 2018, ApJ, 860, L11
- Kraft et al. (1998) Kraft R. P., Sneden C., Smith G. H., Shetrone M. D., Fulbright J., 1998, AJ, 115, 1500
- Kroupa (2001) Kroupa P., 2001, MNRAS, 322, 231
- Kruijssen et al. (2020) Kruijssen J. M. D., et al., 2020, MNRAS, 498, 2472
- Lamb et al. (2015) Lamb M. P., Venn K. A., Shetrone M. D., Sakari C. M., Pritzl B. J., 2015, MNRAS, 448, 42
- Lane et al. (2022) Lane J. M. M., Bovy J., Mackereth J. T., 2022, MNRAS, 510, 5119
- Lattimer & Schramm (1974) Lattimer J. M., Schramm D. N., 1974, ApJ, 192, L145
- Lawler et al. (2001) Lawler J. E., Wickliffe M. E., den Hartog E. A., Sneden C., 2001, ApJ, 563, 1075
- Leroy et al. (2008) Leroy A. K., Walter F., Brinks E., Bigiel F., de Blok W. J. G., Madore B., Thornley M. D., 2008, AJ, 136, 2782
- Letarte et al. (2006) Letarte B., Hill V., Jablonka P., Tolstoy E., François P., Meylan G., 2006, A&A, 453, 547
- Limberg et al. (2022) Limberg G., Souza S. O., Pérez-Villegas A., Rossi S., Perottoni H. D., Santucci R. M., 2022, ApJ, 935, 109
- Lindegren et al. (2018) Lindegren L., et al., 2018, A&A, 616, A2
- Lindegren et al. (2021) Lindegren L., et al., 2021, A&A, 649, A4
- Mackereth et al. (2019) Mackereth J. T., et al., 2019, MNRAS, 489, 176
- Mackey et al. (2010) Mackey A. D., et al., 2010, ApJ, 717, L11
- Malhan et al. (2022) Malhan K., et al., 2022, ApJ, 926, 107
- Maoz & Mannucci (2012) Maoz D., Mannucci F., 2012, Publ. Astron. Soc. Australia, 29, 447
- Marín-Franch et al. (2009) Marín-Franch A., et al., 2009, ApJ, 694, 1498
- Marino et al. (2011) Marino A. F., et al., 2011, A&A, 532, A8
- Marino et al. (2015) Marino A. F., et al., 2015, MNRAS, 450, 815
- Marino et al. (2021) Marino A. F., et al., 2021, ApJ, 923, 22
- Massari et al. (2017) Massari D., et al., 2017, MNRAS, 468, 1249
- Massari et al. (2019) Massari D., Koppelman H. H., Helmi A., 2019, A&A, 630, L4
- Massari et al. (2023) Massari D., et al., 2023, A&A, 680, A20
- Matsuno et al. (2019) Matsuno T., Aoki W., Suda T., 2019, ApJ, 874, L35
- Matsuno et al. (2021) Matsuno T., Hirai Y., Tarumi Y., Hotokezaka K., Tanaka M., Helmi A., 2021, A&A, 650, A110
- McKenzie et al. (2022) McKenzie M., et al., 2022, MNRAS, 516, 3515
- McMillan (2017) McMillan P. J., 2017, MNRAS, 465, 76
- McWilliam et al. (1992) McWilliam A., Geisler D., Rich R. M., 1992, PASP, 104, 1193
- Meyer (1994) Meyer B. S., 1994, ARA&A, 32, 153
- Milone & Marino (2022) Milone A. P., Marino A. F., 2022, Universe, 8, 359
- Monty et al. (2020) Monty S., Venn K. A., Lane J. M. M., Lokhorst D., Yong D., 2020, MNRAS, 497, 1236
- Monty et al. (2023a) Monty S., Yong D., Marino A. F., Karakas A. I., McKenzie M., Grundahl F., Mura-Guzmán A., 2023a, MNRAS, 518, 965
- Monty et al. (2023b) Monty S., et al., 2023b, MNRAS, 522, 4404
- Mottini & Wallerstein (2008) Mottini M., Wallerstein G., 2008, AJ, 136, 731
- Mucciarelli & Bonifacio (2020) Mucciarelli A., Bonifacio P., 2020, A&A, 640, A87
- Mucciarelli et al. (2008) Mucciarelli A., Carretta E., Origlia L., Ferraro F. R., 2008, AJ, 136, 375
- Mucciarelli et al. (2010) Mucciarelli A., Origlia L., Ferraro F. R., 2010, ApJ, 717, 277
- Mucciarelli et al. (2013) Mucciarelli A., Bellazzini M., Catelan M., Dalessandro E., Amigo P., Correnti M., Cortés C., D’Orazi V., 2013, MNRAS, 435, 3667
- Mucciarelli et al. (2023) Mucciarelli A., Minelli A., Lardo C., Massari D., Bellazzini M., Romano D., Origlia L., Ferraro F. R., 2023, A&A, 677, A61
- Myeong et al. (2018a) Myeong G. C., Evans N. W., Belokurov V., Amorisco N. C., Koposov S. E., 2018a, MNRAS, 475, 1537
- Myeong et al. (2018b) Myeong G. C., Evans N. W., Belokurov V., Sanders J. L., Koposov S. E., 2018b, ApJ, 856, L26
- Myeong et al. (2018c) Myeong G. C., Evans N. W., Belokurov V., Sanders J. L., Koposov S. E., 2018c, ApJ, 863, L28
- Myeong et al. (2019) Myeong G. C., Vasiliev E., Iorio G., Evans N. W., Belokurov V., 2019, MNRAS, 488, 1235
- Myeong et al. (2022) Myeong G. C., Belokurov V., Aguado D. S., Evans N. W., Caldwell N., Bradley J., 2022, ApJ, 938, 21
- Naidu et al. (2021) Naidu R. P., et al., 2021, ApJ, 923, 92
- Naidu et al. (2022) Naidu R. P., et al., 2022, ApJ, 926, L36
- Nissen & Schuster (2010) Nissen P. E., Schuster W. J., 2010, A&A, 511, L10
- O’Malley & Chaboyer (2018) O’Malley E. M., Chaboyer B., 2018, ApJ, 856, 130
- Oh et al. (2023) Oh W. S., Nordlander T., Da Costa G. S., Bessell M. S., Mackey A. D., 2023, arXiv e-prints, p. arXiv:2312.12793
- Ou et al. (2024) Ou X., Ji A. P., Frebel A., Naidu R. P., Limberg G., 2024, arXiv e-prints, p. arXiv:2404.10067
- Pagnini et al. (2023) Pagnini G., Di Matteo P., Khoperskov S., Mastrobuono-Battisti A., Haywood M., Renaud F., Combes F., 2023, A&A, 673, A86
- Pasquini et al. (2002) Pasquini L., et al., 2002, The Messenger, 110, 1
- Pignatari et al. (2016) Pignatari M., et al., 2016, ApJS, 225, 24
- Placco et al. (2021) Placco V. M., Sneden C., Roederer I. U., Lawler J. E., Den Hartog E. A., Hejazi N., Maas Z., Bernath P., 2021, Research Notes of the American Astronomical Society, 5, 92
- Pompéia et al. (2008) Pompéia L., et al., 2008, A&A, 480, 379
- Rain et al. (2019) Rain M. J., Villanova S., Munõz C., Valenzuela-Calderon C., 2019, MNRAS, 483, 1674
- Ramírez & Cohen (2002) Ramírez S. V., Cohen J. G., 2002, AJ, 123, 3277
- Ramírez et al. (2014) Ramírez I., et al., 2014, A&A, 572, A48
- Reggiani et al. (2021) Reggiani H., Schlaufman K. C., Casey A. R., Simon J. D., Ji A. P., 2021, AJ, 162, 229
- Reichert et al. (2020) Reichert M., Hansen C. J., Hanke M., Skúladóttir Á., Arcones A., Grebel E. K., 2020, A&A, 641, A127
- Ritter et al. (2018) Ritter C., Herwig F., Jones S., Pignatari M., Fryer C., Hirschi R., 2018, MNRAS, 480, 538
- Roederer (2011) Roederer I. U., 2011, ApJ, 732, L17
- Roederer & Thompson (2015) Roederer I. U., Thompson I. B., 2015, MNRAS, 449, 3889
- Roederer et al. (2014) Roederer I. U., Preston G. W., Thompson I. B., Shectman S. A., Sneden C., Burley G. S., Kelson D. D., 2014, AJ, 147, 136
- Roederer et al. (2018) Roederer I. U., Hattori K., Valluri M., 2018, AJ, 156, 179
- Roederer et al. (2023) Roederer I. U., et al., 2023, arXiv e-prints, p. arXiv:2311.16320
- Rosswog et al. (2014) Rosswog S., Korobkin O., Arcones A., Thielemann F. K., Piran T., 2014, MNRAS, 439, 744
- Sakari et al. (2015) Sakari C. M., Venn K. A., Mackey D., Shetrone M. D., Dotter A., Ferguson A. M. N., Huxor A., 2015, MNRAS, 448, 1314
- Sakari et al. (2018a) Sakari C. M., et al., 2018a, ApJ, 854, L20
- Sakari et al. (2018b) Sakari C. M., et al., 2018b, ApJ, 868, 110
- Sanders et al. (2021) Sanders J. L., Belokurov V., Man K. T. F., 2021, MNRAS, 506, 4321
- Schaeuble et al. (2015) Schaeuble M., Preston G., Sneden C., Thompson I. B., Shectman S. A., Burley G. S., 2015, AJ, 149, 204
- Schiappacasse-Ulloa et al. (2024) Schiappacasse-Ulloa J., Lucatello S., Cescutti G., Carretta E., 2024, arXiv e-prints, p. arXiv:2402.06490
- Schönrich & Weinberg (2019) Schönrich R. A., Weinberg D. H., 2019, MNRAS, 487, 580
- Schönrich et al. (2010) Schönrich R., Binney J., Dehnen W., 2010, MNRAS, 403, 1829
- Shank et al. (2023) Shank D., et al., 2023, ApJ, 943, 23
- Shetrone & Keane (2000) Shetrone M. D., Keane M. J., 2000, AJ, 119, 840
- Skúladóttir & Salvadori (2020) Skúladóttir Á., Salvadori S., 2020, A&A, 634, L2
- Skúladóttir et al. (2019) Skúladóttir Á., Hansen C. J., Salvadori S., Choplin A., 2019, A&A, 631, A171
- Sneden (1973) Sneden C., 1973, ApJ, 184, 839
- Sneden et al. (2008) Sneden C., Cowan J. J., Gallino R., 2008, ARA&A, 46, 241
- Sobeck et al. (2011) Sobeck J. S., et al., 2011, AJ, 141, 175
- Spitoni et al. (2017) Spitoni E., Vincenzo F., Matteucci F., 2017, A&A, 599, A6
- Stan Development Team (2024) Stan Development Team 2024, https://mc-stan.org
- Stetson & Pancino (2008) Stetson P. B., Pancino E., 2008, PASP, 120, 1332
- Suda et al. (2008) Suda T., et al., 2008, PASJ, 60, 1159
- Tautvaišienė et al. (2004) Tautvaišienė G., Wallerstein G., Geisler D., Gonzalez G., Charbonnel C., 2004, AJ, 127, 373
- Thielemann et al. (2011) Thielemann F. K., et al., 2011, Progress in Particle and Nuclear Physics, 66, 346
- Thielemann et al. (2017) Thielemann F. K., Eichler M., Panov I. V., Wehmeyer B., 2017, Annual Review of Nuclear and Particle Science, 67, 253
- Van der Swaelmen et al. (2013) Van der Swaelmen M., Hill V., Primas F., Cole A. A., 2013, A&A, 560, A44
- VandenBerg et al. (2013) VandenBerg D. A., Brogaard K., Leaman R., Casagrande L., 2013, ApJ, 775, 134
- Vasiliev et al. (2021) Vasiliev E., Belokurov V., Erkal D., 2021, MNRAS, 501, 2279
- Vasiliev et al. (2022) Vasiliev E., Belokurov V., Evans N. W., 2022, ApJ, 926, 203
- Veljanoski et al. (2014) Veljanoski J., et al., 2014, MNRAS, 442, 2929
- Villanova et al. (2016) Villanova S., Monaco L., Moni Bidin C., Assmann P., 2016, MNRAS, 460, 2351
- Virtanen et al. (2020) Virtanen P., et al., 2020, Nature Methods, 17, 261
- Vogt et al. (1994) Vogt S. S., et al., 1994, in Crawford D. L., Craine E. R., eds, Society of Photo-Optical Instrumentation Engineers (SPIE) Conference Series Vol. 2198, Instrumentation in Astronomy VIII. p. 362, doi:10.1117/12.176725
- Weinberg et al. (2017) Weinberg D. H., Andrews B. H., Freudenburg J., 2017, ApJ, 837, 183
- Woosley & Weaver (1995) Woosley S. E., Weaver T. A., 1995, ApJS, 101, 181
- Worley et al. (2013) Worley C. C., Hill V., Sobeck J., Carretta E., 2013, A&A, 553, A47
- Ying et al. (2023) Ying J. M., Chaboyer B., Boudreaux E. M., Slaughter C., Boylan-Kolchin M., Weisz D., 2023, AJ, 166, 18
- Yong et al. (2005) Yong D., Grundahl F., Nissen P. E., Jensen H. R., Lambert D. L., 2005, A&A, 438, 875
- Yong et al. (2014a) Yong D., et al., 2014a, MNRAS, 439, 2638
- Yong et al. (2014b) Yong D., et al., 2014b, MNRAS, 441, 3396
- Yuan et al. (2020) Yuan Z., et al., 2020, ApJ, 891, 39
- Zhang et al. (2024) Zhang R., et al., 2024, arXiv e-prints, p. arXiv:2405.02978
- Çalışkan et al. (2012) Çalışkan Ş., Christlieb N., Grebel E. K., 2012, A&A, 537, A83
- de los Reyes et al. (2022) de los Reyes M. A. C., Kirby E. N., Ji A. P., Nuñez E. H., 2022, ApJ, 925, 66
- van de Voort et al. (2020) van de Voort F., Pakmor R., Grand R. J. J., Springel V., Gómez F. A., Marinacci F., 2020, MNRAS, 494, 4867
Appendix A Abundance Analysis of NGC 1851, NGC 1904 and NGC 2808
As these clusters have been studied extensively in the literature, we did not re-derive the abundances for the full extent of elements measurable in the UVES spectra. Instead, we only re-measured the abundance of Mg, Si and Ca in the clusters and the abundance of Eu. To do this, we measured equivalent widths and performed a classical spectroscopic analysis, assuming 1D Local Thermodynamic Equilibrium (LTE) utilising plane parallel atmospheres. As these techniques have been described extensively in the literature (including in, Monty et al., 2023a), we avoid re-hashing the process step-wise here and instead provide a brief description of the process.
Briefly, equivalent widths were measured for the 5528Å and 5711Å Mg i lines line using both IRAF’s splot task and the automated line measurement software DAOSpec (Stetson & Pancino, 2008). Measurements between DAOSpec and splot were found to be extremely consistent in the region of mÅ, so EWs were determined for Si and Ca using DAOSpec alone. In total, nine lines of Si and 22 lines of Ca were selected (from the linelist of, Monty et al., 2023a) to determine the abundances of these two elements. All line measurements were culled to remove outliers prior to abundance determination.
The 6645Å line of Eu ii was synthesised to determine the abundance of Eu in all program stars. Hyperfine structure corrections were adopted from Lawler et al. (2001), using the linemake program Placco et al. (2021). Isotopic splitting across the two isotopes, 63.1151 and 63.1153, was also considered, adopting a fractional contribution of 53% and 47% respectively (Sneden et al., 2008). A macroturbulent velocity of 7 km/s was included for all of the stars, reflecting an average estimate of macroturbulence in evolved giants (Gray & Toner, 1986; Carney et al., 2008). Finally, the synthetic spectra were smoothed to reflect the average spectral resolution of the observations () using a Gaussian function, full width at half maximum equal to 6645Å/50,000 = 0.13Å.
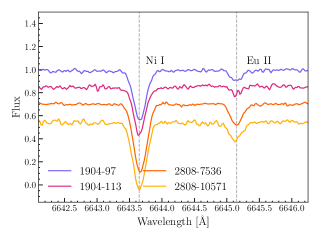
Examples of the Eu ii line for the highest and lowest SNR stars in each cluster are shown in Fig. 8. The average of the two set of independent measurements were then adopted for further analysis. To determine the spectroscopic stellar parameters for the stars (effective temperature: , log surface gravity: log , metallicity: [Fe/H] and microturbulence: ), Fe i and Fe ii lines from the linelist of Monty et al. (2023a) were measured using DAOSpec. The Fe i/Fe ii linelist was cleaned to remove obvious ( outliers) prior to determination of the stellar parameters.
In the case of NGC 2808, the spectroscopic stellar parameters (SPs) were determined using the classical technique of minimising abundance trends with excitation potential and reduced equivalent width and balancing of the Fe ionisation states. All SP determinations and abundance measurements were performed using the python-based tool q2 (Ramírez et al., 2014) to communicate to the radiative transfer code MOOG (Sneden, 1973). MARCS model atmospheres (Gustafsson et al., 2008) were adopted throughout. The final spectroscopic SPs and literature photometric SPs are listed in Table 3 alongside those published in Carretta et al. (2009b) (in the case of NGC 2808 and NGC 1904) and Carretta et al. (2011) (in the case of NGC 1851). The uncertainties we quote on the stellar parameters are not absolute and instead reflect the precision of the minimisation of abundance trends and FeI vs FeII abundance differences (standard 1D spectroscopic determination of SPs).
Given the metallicity of NGC 2808, and the agreement between the spectroscopic and photometric SPs and their respective abundances, we adopt the abundances determined using the spectroscopic parameters for the remainder of this study. In the case of the lower-metallicity GC NGC 1904 ( Carretta et al., 2009b), we adopted the photometric SPs published in Carretta et al. (2009b) to avoid issues associated with spectroscopically determined SPs at low-metallicities (Mucciarelli & Bonifacio, 2020).
When adopting the photometric SPs for the stars in NGC 1904, the resultant Mg-abundances were significantly lower than those published in Carretta et al. (2009b). In the most extreme case, the Mg abundances differed by dex. This is likely because the broad Mg lines are very sensitive to the choice effective temperature. Both the Eu and Si abundances were observed to change by no more than dex (on the order the measurement uncertainty). This is likely because the Eu lines are significantly weaker than the Mg lines, making them less sensitive to the choice of SPs. When using the optimal spectroscopic SPs derived for NGC 1904 (using the classical spectroscopic optimisation technique), the Mg abundances were brought into much better agreement, differing by no more than dex. Ultimately, because of the disagreement in Mg abundances observed when adopting spectroscopic or photometric SPs, and the concerns discussed in Sec. 2.2.1, we focus on the recovery and verification of Si abundances between our study and that of Carretta et al. (2009b) and adopt Si as our -element tracer moving forward.
The abundance determinations for Mg, Si, Ca and Eu are shown in Table 4 and compared (in the case of Mg and Si) to those determined by Carretta et al. (2009b) and Carretta et al. (2011). The abundances are solar-scaled using the Solar abundances of Asplund et al. (2009). Note that Carretta et al. (2009b) do not adopt the same solar scale, as they perform differential line-by-line abundance determination relative to the Sun. However, we do not expect the offsets to be larger than the abundance uncertainties. In general, we find good agreement with Carretta et al. (2009b, 2011) in Mg and Si, with 9/12 stars displaying consistent (within measurement uncertainties) across the three studies. In the case of our calibration cluster, NGC 1851, the values of Eu are remarkably consistent (with the exception of NGC 1851-26271, for which Carretta et al. (2011) find a higher Eu abundance). The values of [Mg/Fe] are the most disparate across studies, in addition to having the largest uncertainties. We take this as evidence to support our choice of an alternative -element tracer. The cluster averages are derived by combining the second to last column as a weighted average, the cluster standard deviation is also quoted.
| Spectro. | Photo. | |||||||
| Star | log | [Fe/H] | log | [Fe/H] | ||||
| … | [K] | [dex] | [dex] | [cm/s2] | [K] | [dex] | [dex] | [cm/s2] |
| NGC1904-97 | 4378 | 1.23 | -1.62 | 1.49 | ||||
| NGC1904-98 | 4386 | 1.25 | -1.57 | 1.92 | ||||
| NGC1904-149 | 4512 | 1.51 | -1.62 | 1.77 | ||||
| NGC1904-113 | 4430 | 1.34 | -1.54 | 1.66 | ||||
| NGC2808-7536 | 4311 | 1.19 | -0.98 | 1.69 | ||||
| NGC2808-38660 | 4322 | 1.22 | -1.21 | 1.62 | ||||
| NGC2808-8603 | 4343 | 1.24 | -1.18 | 1.66 | ||||
| NGC2808-10571 | 4315 | 1.21 | -1.21 | 1.66 | ||||
| NGC1851-26271 | 3910 | 0.54 | -1.24 | 2.13 | ||||
| NGC1851-28520 | 4141 | 1.01 | -1.27 | 1.83 | ||||
| NGC1851-32903 | 4040 | 0.80 | -1.06 | 1.66 | ||||
| NGC1851-39801 | 3979 | 0.68 | -1.19 | 1.83 |
| Star | [Mg/Fe] | [Mg/Fe] | [Si/Fe] | [Si/Fe] | [Ca/Fe] | [Eu/Fe] | [Eu/Fe] |
|---|---|---|---|---|---|---|---|
| NGC1904-97 | 0.00 (0.05) | -0.03 (0.09) | … | ||||
| NGC1904-98 | 0.02 (0.13) | -0.07 (0.06) | … | ||||
| NGC1904-149 | 0.20 (0.13) | 0.00 (0.06) | … | ||||
| NGC1904-113 | 0.08 (0.05) | 0.00 (0.07) | … | ||||
| NGC2808-7536 | 0.04 (0.05) | -0.08 (0.06) | … | ||||
| NGC2808-38660 | 0.17 (0.12) | -0.09 (0.08) | … | ||||
| NGC2808-8603 | 0.04 (0.23) | -0.03 (0.12) | … | ||||
| NGC2808-10571 | 0.15 (0.19) | -0.02 (0.09) | … | ||||
| NGC1851-26271 | 0.16 (0.21) | 0.09 (0.06) | 0.14 (0.03) | ||||
| NGC1851-28520 | 0.14 (0.19) | 0.10 (0.12) | 0.06 (0.03) | ||||
| NGC1851-32903 | 0.04 (0.19) | 0.09 (0.11) | 0.10 (0) | ||||
| NGC1851-39801 | 0.15 (0.04) | 0.07 (0.12) | -0.06 (0) |