RoboCAP: Robotic Classification and Precision Pouring of Diverse Liquids and Granular Media with Capacitive Sensing
Abstract
Liquids and granular media are pervasive throughout human environments, yet remain particularly challenging for robots to sense and manipulate precisely. In this work, we present a systematic approach at integrating capacitive sensing within robotic end effectors to enable robust sensing and precise manipulation of liquids and granular media. We introduce the parallel-jaw RoboCAP Gripper with embedded capacitive sensing arrays that enable a robot to directly sense the materials and dynamics of liquids inside of diverse containers, including some visually opaque. When coupled with model-based control, we demonstrate that the proposed system enables a robotic manipulator to achieve state-of-the-art precision pouring accuracy for a range of substances with varying dynamics properties. Code, designs, and build details are available on the project website111https://sites.google.com/view/capsense/home.
I Introduction
Identifying and manipulating liquid and granular media, generally held in containers, are fundamental capabilities for robots in a variety of settings, including laboratories, factories, and households. A variety of techniques, including visual, haptic, audio, and spectroscopic methods, have been proposed for substance classification and manipulation tasks. However, for classification, these methods are respectively challenged by opaque containers or visually indistinguishable substances (e.g. water and vinegar) [8, 24], require contact/movement of the containers before classification [8, 24, 19, 12, 22], or provide limited feedback for control [9]. Most prior work on liquid manipulation relies on visual sensing [23, 4] and require transparent containers and that colored substances [20]. Furthermore, most methods are only evaluated on a single liquid, generally water [23], and are not demonstrated for granular media or diverse liquids.
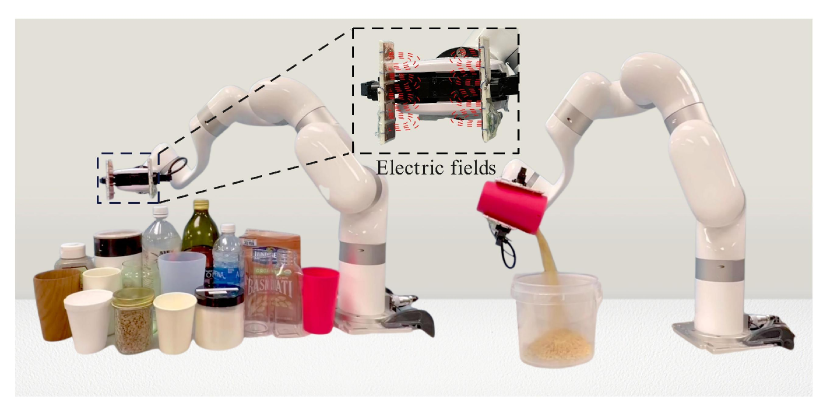
In this work, we show how capacitive sensing enables both the classification and manipulation of a variety of liquid and granular media, seen in Fig. 1, in a way that is agnostic to the optical properties of both the container and its substances. We develop a set of capacitive sensing arrays, each with 5 electrodes, that can be mounted to the parallel jaws of a the RoboCAP Gripper. In the case of sensing containers and the substances within them, the capacitance measured by each electrode is directly impacted by the container and the internal substance. Opening and closing the RoboCAP Gripper around different substance-container combinations produces unique variations in capacitance readings. Using this principle, we show how containers and their substances can be classified with a data-driven approach.
The proposed sensing arrays can also capture changes in capacitance due to the motion of liquid or granular media inside of a container, allowing a robot to estimate the dynamics of the substances during robotic pouring. For a set of liquid and granular substances, we learn a model that maps changes in capacitance to the quantity poured out of a container, measured by weight in grams, at a specific time , as well as a model that predicts the quantity that will continue to pour from the container due to inertia after the robot halts its pouring action. With both models, we devise a controller that is capable of pouring out precise quantities of a given substrate from a container and demonstrate that our controller is more precise than a current baseline from literature.
Through this work, we make the following contributions:
-
•
We design a robotic end effector for liquid and granular media identification and precision pouring with an array of 5 capacitive sensing electrodes integrated on each fingertip.
-
•
We demonstrate that capacitive sensing integrated at a robot’s end effector allows a robot to accurately infer the materials of household containers, as well as infer the internal liquid or granular media inside of visually opaque containers.
-
•
We introduce a model-based controller that enables precision pouring of substances from containers, which we evaluate on a set of five liquid and granular substrates. We further show that the proposed control model can accurately reason over the amount of liquid or granular media poured from a container.
II Related Work
II-A Substance and Container Classification
Tactile sensors have commonly been used with physics-based models to classify fluids within a known container [19, 12, 22]. Audio signals (measured either as contact vibrations or air pressure vibrations) have been used to classify substances inside of containers, as well as to estimate the amount of substance within a container [5, 3, 13]. More recently, Hanson et al. [9] demonstrated the use of visible and near-infrared (VNIR) spectroscopy embedded within a robot’s end effector to classify the material of a container (e.g. foam, plastic, paper) as well as the internal liquid or granular media substances (e.g. water, milk, salt). Our proposed capacitive sensing method complements prior literature as another modality that is similarly capable of sensing and classifying the materials of both a container and internal substance. However, in addition to classification, we demonstrate how coupling capacitive sensing with model-based learning enables a robot to sense the dynamics of liquids and granular media, which is crucial for performing precision pouring and manipulation of these deformable materials.
Multimodal strategies have also been deployed to classify substances within a container. Notable examples include robotic manipulators equipped with vision and tactile sensing [8, 24] or vision and audio sensors [18, 27, 26] to infer substance types and fill levels of liquids inside a container. Notably, classification performance improves substantially for multimodal strategies over individual modalities of vision, haptics, or audio [26, 16]. Each of these individual modalities often only conveys limited information and typically faces several edge cases when deployed, such as visual occlusions, background noise, or external forces, which all impact signal quality. Capacitive sensing’s electric fields are generally agnostic to visual occlusions, background audio, and applied forces, allowing it to overcome many edge cases observed with other sensing modalities. Furthermore, in contrast to prior work, capacitive sensing as a standalone modality achieves competitive material classification performance while simultaneously providing rich sensing of liquid dynamics.
II-B Precision Pouring
Visual methods are most prevalent in the literature for autonomous pouring systems, having been demonstrated for filling a vessel to a target fill height [4, 20] or for pouring out a specific quantity from a container [23, 6, 28]. Since occlusions can significantly limit visual approaches, works leveraging audio sensing [3, 16] and haptic sensing [22, 21, 19] have also been proposed. However, these techniques can be susceptible to external signal noise. To overcome the limitations of any individual sensor, multi-modal approaches have gained interest, fusing audition and haptics [17], audition and vision [25], vision and weight measurements [14], or even audition, haptics, and vision [15]. By contrast, capacitive sensing, as an independent modality, has the ability to sense liquid dynamics through containers, allowing us to pour precise quantities of both liquid and granular substances, as measured by weight, without interference from external noise or forces.
Each of these perception strategies has been paired with a variety of control approaches including PID control [4, 23], bang-bang control [20], model-based control [3], reinforcement learning [1], and imitation learning [21, 28, 15]. In this work, we propose a model-based controller and compare its performance to an imitation learning baseline for pouring using capacitive sensing.
III Sensor Design
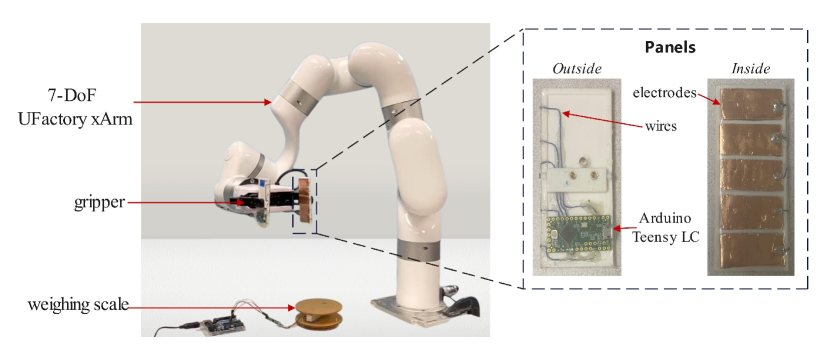
As shown in Fig. 2, we designed a multi-electrode capacitive sensing system integrated within the parallel-jaw gripper of a UFactory xArm7 robotic manipulator. Capacitance is the capability of a material to hold electric charge. Our RoboCAP system measures the self-capacitance of the container and substance directly in the vicinity of each electrode. Each electrode and the container/substance combination can be modeled as the two plates of a parallel-plate capacitor, with air acting as the dielectric material. For each electrode, the capacitance reading is affected by a multitude of factors, primarily the distance between the electrode and the container, the material and thickness of the container, and the substance and its spatial structure within the container. Based on these principles, we designed two 3D-printed panels, each with an array of five copper foil electrodes, and attached them to both jaws of the RoboCAP Gripper, with a small spring to provide compliance and adherence to the shape of non-cylindrical containers. This feature ensured uniform contact between all electrodes in an array and the container surface. In order to improve signal quality and diversity between electrodes, particularly during robotic pouring, as seen in Fig. 1, the capacitive arrays are mounted vertically to the panels to increase sensor distribution along the height axis of a container. The electrodes on each panel are connected to a Teensy LC microcontroller, mounted on the outside of the panel. The Teensy LC has dedicated hardware pins which use a 1-pF internal reference capacitor to account for environmental factors that affect capacitance readings such as temperature and humidity. We record data from all 10 electrodes at a frequency of 100 Hz. A thin layer of waterproof polypropylene tape, which in conjunction with air acts as the dielectric material in the parallel-plate capacitor model, protects the electrodes on the inside of the panels while a plastic film and hot glue are used to waterproof the electronics on the outside of each panel.
IV Substance and Container Classification
IV-A Classification Dataset
We collected a classification dataset using nine commonly found household containers and nine substances, several of which are found in other studies investigating classification of liquids or granular media [9]. The containers used were paper, styrofoam, ceramic, glass, wood, silicon, polyethylene terephthalate (PET) plastic, polypropylene (PP) plastic and polycarbonate (PC) plastic. The substances used were oats, vinegar, oil, honey, starch, rice, lentils, sugar and water. All containers were opaque except glass, PET, and PC, and all were non-cylindrical, i.e. shaped as a frustum of a cone, except ceramic and glass. The liquid and granular media we used had varying viscosity and opacity.
Capacitance data was collected for every combination of container and substance. In all, there were 81 combinations or classes. Three sets of data collection were conducted, each on a separate day, to capture variations in environmental factors such as temperature and humidity, which could marginally affect the magnitude of capacitance readings. Each set consisted of capturing capacitance measurements for 10 open-close trajectory iterations of the RoboCAP Gripper, for each if the 81 classes. In each iteration, the RoboCAP Gripper would close around the container, and then open. Data was collected while the RoboCAP Gripper closed around the container. These three sets were combined and used as training data. Another round of data collected on a fourth day was used as a holdout test set.
It takes the RoboCAP Gripper 2 seconds to traverse from the open to the close position, during which time the capacitance data was collected continuously. This resulted in a total of 200 individual sensor measurements per iteration of closing for each of the 10 electrodes, due to the sampling rate of 100 Hz. Additional implementation considerations are detailed in Appendix -A. Sample plots of capacitance during data collection for water and oil substances in glass and PP plastic containers are shown in Fig. 3.

IV-B Feature Extraction and Model Training
We partition our data into 2 second windows, corresponding to a single RoboCAP Gripper closing action. In each window of data, for each electrode, , the measured capacitance values, , are used to calculate the first order gradient, , using finite differencing. We concatenate the capacitance values and derivatives for all 10 electrodes to obtain our input feature vector, . In total, there are 2430 data samples (10 iterations per substance-container pair * 3 days * 81 classes) used for training and 810 samples (10 iterations per substance-container * 1 day * 81 classes) within the holdout test set. We standardized the training features (zero mean and unit standard deviation) and applied the computed fit to the test set. We trained a Random Forest Classifier (RFC) with default hyperparameters on the training samples and evaluated its performance on the holdout set.
V Pouring Estimation and Control
V-A Control Pipeline
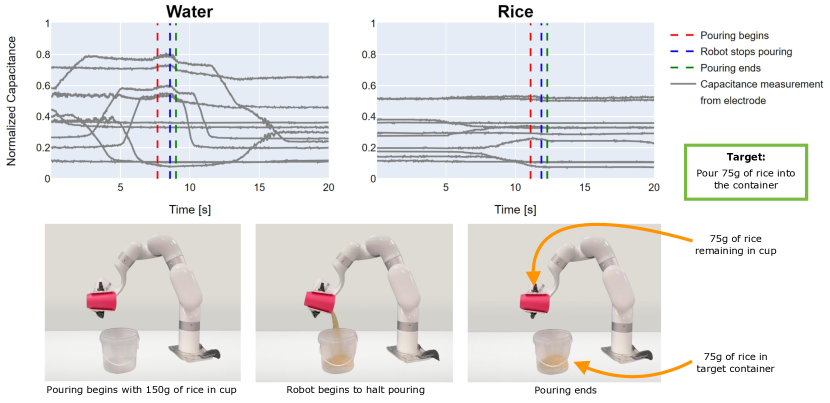
We propose a method, shown in Fig. 4, that allows a robot arm to precisely pour a specific quantity from a container, relying only on the knowledge of the substance being poured and real-time capacitance measurements. To perform precision pouring, a robot must first learn the relationship between the amount of substance poured and the corresponding capacitance measurements at each timestep in the pouring trajectory. The robot must then use this information to determine when to stop pouring. The inertia of the substance as it’s being poured makes this task challenging as the manipulator cannot stop pouring instantaneously. To prevent overpouring, a robot must proactively stop pouring before the target quantity is reached. Capacitance data and this pouring process is further shown visually in Fig. 5.
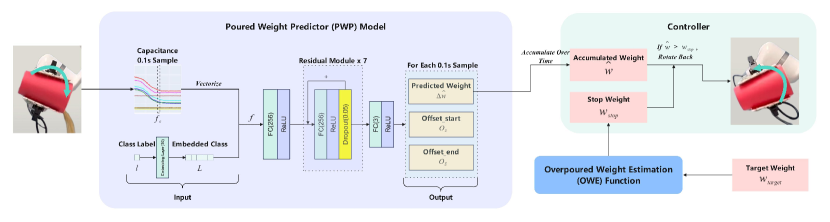
To tackle these challenges, we present a two-component approach to robotic precision pouring. The first component, which we call the Poured Weight Predictor (PWP), is a residual multi-layer perceptron, depicted in Fig. 4. It estimates the weight that has been poured, up until the robot starts rotating the container back to the upright state to stop pouring. The second component, called the Overpoured Weight Estimation (OWE) function, is a polynomial function that estimates how much of the substance will be “overpoured” while the robot attempts to stop pouring. Putting both pieces together, our controller rotates the RoboCAP Gripper forward and uses the PWP to predict how much of a substance has been cumulatively poured out. When the stop weight estimated by the OWE is reached, the controller starts to rotate the RoboCAP Gripper back so that the precise target weight is poured out by the time the gripper and substance stream come to a complete stop, thus preventing overpouring.
V-B Experimental Setup
In order to collect data for training and for evaluating our controller, we used five liquid and granular substances: water, vinegar, oil, rice, and lentils. All substances were poured from a polypropylene (PP) plastic container. Before pouring, each container was filled with 150g of a given substance. The container was grasped such that the top of the RoboCAP Gripper was 1 cm below the upper edge of the container, which ensured that all capacitive electrodes contacted the container. The pouring action was defined as a clockwise rotation of the robot’s wrist joint at a speed of 9∘/s, as shown in Fig 1. The maximum pouring angle for data collection for training was 123.5∘ from the container’s vertical orientation, 0∘. We captured capacitance measurements from all the electrodes at 100 Hz. Ground truth weight measurements were captured at 10 Hz from a strain gauge based weighing scale (0-5kg, 1g), which was placed beneath the target container.
V-C Poured Weight Predictor (PWP)
Fig. 4 depicts the neural network architecture for the Poured Weight Predictor (PWP) model. We utilize a residual multi-layer perceptron architecture [10, 11], with further training and architecture details described in Appendix -B. The model input consists of capacitance values and an embedded class label for substances, concatenated into a feature vector, , constructed as follows.
V-C1 PWP Dataset
To collect data to train the model, the robot performed 10 complete pouring trials for each of the five substances described in Sec. V-B, totaling 50 trials. In each trial, the wrist rotates to pour until it reaches the maximum pouring angle. Each pouring trial lasts 20 seconds. The full dataset of 50 total pouring trials is divided such that 80% (40 trials) are used for training and 20% (10 trials) are used for validation of the PWP model.
V-C2 PWP Model Inputs
First, we partition our capacitance data using a sliding window of size seconds, with a stride of 0.01 seconds. This results in 1991 samples per 20-second trial, with a total of 79,640 samples (1991 samples * 40 trials) for training and 19,910 samples (1991 samples * 10 trials) for validation. For each electrode, , within a window of data, we have measured capacitance values, . The data for all 10 electrodes is concatenated to form a vector, . Min-max normalization is applied to scale all capacitance values such that . The model also receives as input the substance class label, represented as an integer . Further details for the class label and feature vector can be found in Appendix -B.
V-C3 PWP Model Outputs
The first output of the PWP model is the predicted change in weight from the pouring container, , for each window. The predicted total weight poured from the container, , at each timestep , is equal to the cumulative sum of for all windows from the start of the pouring trajectory up to the current timestep . The cumulative ground truth weight poured from the container, , at each timestep sampled from the scale at 10 Hz, is linearly interpolated to match the frequency of capacitance measurements.
Since we cannot directly measure the total weight of the substance as it leaves the pouring container, we instead must measure the total weight in the target container using a scale. The time delay between when the substance leaves the lip of the pouring container and when it reaches the target container introduces some ambiguity in computing the ground truth change in weight from the pouring container , at a given timestep . To account for this delay, which is different for each substance and is also dependent on the distance between the lip of the container and the scale, we include two learned outputs in the PWP model, offset_start, , and offset_end, , for each s window of data. accounts for the time delay between the weight measurements and capacitance signals at the beginning of each window while accounts for the time delay at the end. Thus, we can define the change in the ground truth weight at a particular time as .
V-C4 Loss Function and Model Training
We define the training objective for the PWP as the sum of four component loss terms:
| (1) |
where , and are hyperparameters for balancing these four losses. We set , , and based on preliminary experiments.
The primary component loss term minimizes the differences between the and the changes in ground truth weight, , at corresponding timesteps, allowing the PWP to estimate the poured-out weight, , at every time window . This loss term is given by:
| (2) |
The second component loss term, , acts as a strong constraint on (2) to prevent (2) from being exploited during gradient descent and producing zero values for all the predicted weights. The remaining component loss terms, and , act as penalty losses to ensure that and are not artificially low or changing too rapidly. Detail of these loss terms is provided in Appendix -C.
V-D Overpoured Weight Estimation (OWE) Function
Our PWP model can be used to command the RoboCAP Gripper to stop pouring once the predicted cumulative weight reaches some target. However, after the pouring action stops, some of the substance will still pour out of the container due to inertia, surpassing the target weight in the receiving container. Thus, we must determine the weight at which the robot should begin rotating its RoboCAP Gripper to stop pouring, , to avoid exceeding the target weight . We define, as follows,
| (3) |
The relationship between and can be approximated as a second-degree polynomial, which we call the Overpoured Weight Estimation (OWE) function, denoted as:
| (4) |
where , , and are the coefficients of the second-degree polynomial which vary with the substance type.
We collect data to fit the OWE by executing 24 additional pouring trials per substance. In each trial we use the trained PWP model to pour out target quantities of each substance in 10g increments ranging from 30g to 100g. Since the PWP alone cannot account for overpouring, the robot will only rotate the container to stop pouring when it predicts that the target weight, , has been reached, causing some of the substance to inevitably be overpoured. The difference between the weight that the PWP model predicts it poured out and the ground truth weight is the overpoured weight, . We use ordinary least squares to fit the second-degree OWE polynomial to the collected data.
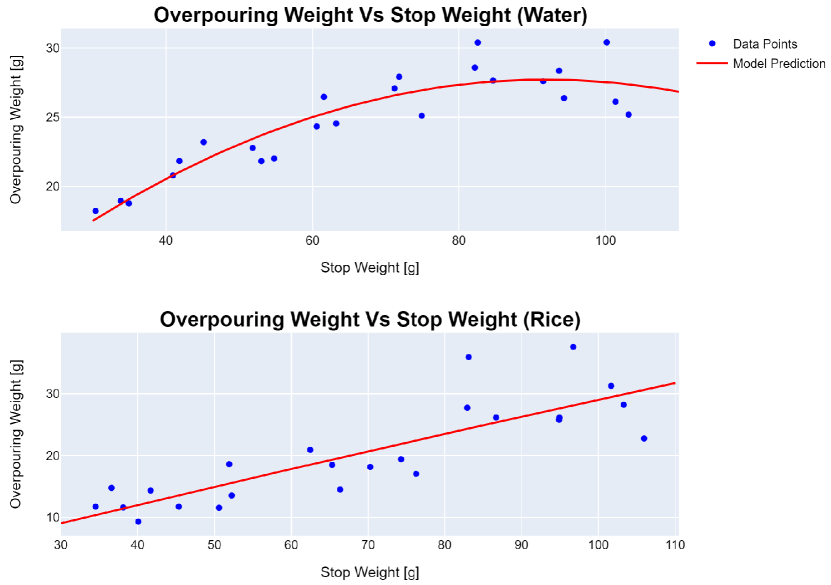
Fig. 6 shows two sample fitting curves of the OWE model for water and rice. In these plots, we can observe that the overpouring weight for both substances generally increases as the robot continues to rotate its end effector to pour out more substance.
Now, we can use PWP to estimate the total poured weight using the cumulative sum of , and the OWE model to calculate so that overpouring doesn’t occur. To evaluate our approach, we use the trained PWP model and fit OWE function for control to pour each of the five substances at four different target weights (50g, 75g, 100g, and 125g) ten times. The results from this evaluation is described in Section VI.
V-E Behavior Cloning Baseline
Behavior cloning (BC) is a commonly employed method in prior robotic pouring literature [28, 15], as well as in robotic manipulation more broadly [29]. The BC model takes as input the concatenated feature vector provided to the PWP model, , as well as the target weight class label (50g, 75g, 100g, or 125g). The BC model shares a similar architecture as that shown in Fig. 4, with a 1-dimensional output and sigmoid activation that indicates the direction of end effector rotation for pouring. We train using binary cross entropy loss and all other hyperparameters matching PWP. The behavior cloning model reaches its minimum validation loss within 50 epochs.
To train this BC model, we collect five human demonstrations for each substance at each target weight (in total 100 demonstrations), with a training and validation split of 80/20. To evaluate the trained BC model, we conduct 10 test trials for each substance and target weight.
| Container | Substance | Container+Substance | |
|---|---|---|---|
| Accuracy | 97.8% | 84.9% | 84.7% |


VI Results and Discussions
VI-A Substance and Container Classification
As previously noted, capacitive sensing arrays integrated at a robot’s end effector allow a robot to infer the materials of objects or containers it grasps, as well as the liquid or granular media inside of a visually opaque container. Here, we assess the performance of the trained container and internal substance classification model, described in Section IV. Table I presents the classifications results of our Random Forest RoboCAP Classification model over the holdout test set. The model correctly infers the class labels of containers with 97.8% accuracy and of substances with 84.9% accuracy. This performance at sensing internal substances is particularly notable since most of the containers are visually opaque such as ceramic and wood. Finally, the overall performance of our RoboCAP Classification model to estimate both container and internal substance correctly for all 81 combinations was 84.7% accuracy. The chance to correctly guess both the container and internal substance at random is 1.2%.
Fig. 7 presents confusion matrices for container and substance material classification separately. The containers and substances that were most frequently confused tended to produce very similar capacitance readings; for example, starch and vinegar had near-indistinguishable signals upon visual inspection. Overall, these results suggest that end-effector capacitive sensing presents a competitive methodology for inferring the materials of rigid objects as well as liquids and granular media inside of diverse containers.
To further evaluate the RoboCAP Classification approach, we provide further experiments and results in the Appendix; specifically, we explore the algorithm performance as capacitance electrodes are ablated in Appendix -E and the effect of changing the number of substance-container combinations on model performance in Appendix -F.

VI-B Precision Pouring
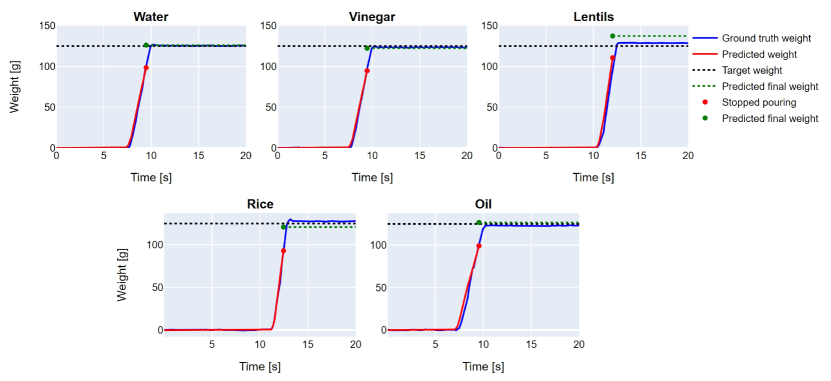
In addition to substance and container classification, capacitive sensing coupled with a model-based control strategy can enable a robot to precisely pour a diverse array of liquids and granular media. This is demonstrated in Fig. 9, where the red lines represent the amount predicted by our RoboCAP Controller system to have been poured into the receiving container, and the blue line represents the ground truth weight. It can be seen that the red and blue lines coincide during the pouring action, indicating that our RoboCAP Controller system can accurately predict the mass poured for the various substances over time.
In Fig.8, we provide the mean absolute error in grams of our RoboCAP Controller for pouring the five substances with four target weights. We also show the mean results across all the five substances. Across all substances and target weights, we achieve a low average error of 3.2g.
Our RoboCAP Controller approach’s average poured error is below 3 grams for all three liquids (water, vinegar, and oil). However, we notice that granular media such as lentils and rice have higher pouring errors in comparison to the liquids. We suspect this is due to how the friction between individual particles of granular media can cause piling and lead to random, sudden ”avalanches” when the end effector pour angle becomes steep enough. This may also be due to larger flow rates for lentils (8.2g/0.1s) and rice (10.2g/0.1s) in comparison to the three liquids (5-6 g/0.1s). Predicting changes in weight at higher frequencies could alleviate this problem.
In comparison to past works [23, 4, 20, 14, 6, 25, 1], RoboCAP obtains low error for robotic pouring while also generalizing to a diverse set of granular media and liquids with vastly different physical properties. Most previous methods are restricted to non-opaque containers and focus on pouring to target liquid levels, limiting the ability to precisely pour. In contrast to all prior work, RoboCAP precisely pours by estimating weight of the substance leaving the container allowing us to achieve state-of-the-art performance of 2.3 g mean error over 200 trials with target pour weights ranging from 50g-125g.
VI-B1 Comparison to Behavior Cloning Baseline
As seen in Fig. 8, we additionally compare our model-based pouring approach to a behavior cloning (BC) baseline, which directly selects the direction of rotation of the RoboCAP Gripper during pouring. The BC approach has an average error of 23.9g over all trials in comparison to our RoboCAP Controller method which achieved an average error of 3.2g.
Behavior cloning can usually only complete tasks with human demonstrations; as a result, in our case, where only four target weights are demonstrated, it can only complete pouring tasks for these weights. In contrast, our model-based system predicts how much of the substance has been poured out during a given 0.1s interval, computes the weight accumulated since the beginning of the pouring trajectory, and stops pouring as soon as the accumulated weight reaches the stopping weight, . This allows our RoboCAP Controller to accomplish pouring for any target weight within the training distribution.
| Substance | Ours | No OWE |
|---|---|---|
| Water | ||
| Vinegar | ||
| Lentils | ||
| Rice | ||
| Oil | ||
| Overall |
VI-B2 Ablation Studies
To motivate the inclusion of both the PWP model and OWE function in our controller, we ablate our RoboCAP Controller method to exclude the OWE function and demonstrate performance when we do not account for the overpoured weight. In this ablation, the results of which are summarized in Table II, we use the PWP model to rotate the RoboCAP Gripper back to stop pouring when the final target weight , instead of the stop weight , has been reached.
Without the OWE function, the ablated version of our RoboCAP Controller method overpoured each substance in amounts ranging from 18.6-26.4 g, compared to errors of 2.0-5.4 g for our full controller with both the PWP model and OWE function. These results show that effective controllers for robotic precision pouring must reason about the inertia of the substance being poured.
VII Conclusion
In this work, we show how capacitive sensing is a promising modality for the classification and manipulation of liquids and granular media, due to its ability to sense the dynamics of substances and its robustness to occlusion, ambient noise, and external forces. We present the RoboCAP Gripper, a robot end effector with embedded capacitive sensing arrays in its fingertips. We first show that capacitive data collected with this end effector can be used to accurately distinguish between 81 unique substance-container classes using our RoboCAP Classifier. Then, we present RoboCAP Controller, a model-based controller that is able to precisely pour specific quantities of five different substrates, while minimizing overpouring, achieving pouring performance far more accurate than an imitation learning baseline.
References
- Babaians et al. [2022] Edwin Babaians, Tapan Sharma, Mojtaba Karimi, Sahand Sharifzadeh, and Eckehard Steinbach. PourNet: Robust Robotic Pouring Through Curriculum and Curiosity-based Reinforcement Learning. In 2022 IEEE/RSJ International Conference on Intelligent Robots and Systems (IROS), pages 9332–9339. IEEE, 2022.
- Boonvisut and Çavuşoğlu [2012] Pasu Boonvisut and M Cenk Çavuşoğlu. Estimation of soft tissue mechanical parameters from robotic manipulation data. IEEE/ASME Transactions on Mechatronics, 18(5):1602–1611, 2012.
- Clarke et al. [2018] Samuel Clarke, Travers Rhodes, Christopher G Atkeson, and Oliver Kroemer. Learning audio feedback for estimating amount and flow of granular material. Proceedings of Machine Learning Research, 87, 2018.
- Do and Burgard [2019] Chau Do and Wolfram Burgard. Accurate pouring with an autonomous robot using an rgb-d camera. In Intelligent Autonomous Systems 15: Proceedings of the 15th International Conference IAS-15, pages 210–221. Springer, 2019.
- Donaher et al. [2021] Santiago Donaher, Alessio Xompero, and Andrea Cavallaro. Audio classification of the content of food containers and drinking glasses. In 2021 29th European Signal Processing Conference (EUSIPCO), pages 591–595. IEEE, 2021.
- Dong et al. [2019] Chenyu Dong, Masaru Takizawa, Shunsuke Kudoh, and Takashi Suehiro. Precision pouring into unknown containers by service robots. In 2019 IEEE/RSJ International Conference on Intelligent Robots and Systems (IROS), pages 5875–5882. IEEE, 2019.
- Guevara et al. [2018] Tatiana López Guevara, Rita Pucci, Nicholas Kenelm Taylor, Michael Gutmann, Subramanian Ramamoorthy, and Kartic Subr. To stir or not to stir: Online estimation of liquid properties for pouring actions. In Robotics: Science and Systems Workshop on Learning and Inference in Robotics: Integrating Structure, Priors and Models, 2018.
- Güler et al. [2014] Püren Güler, Yasemin Bekiroglu, Xavi Gratal, Karl Pauwels, and Danica Kragic. What’s in the container? Classifying object contents from vision and touch. In 2014 IEEE/RSJ International Conference on Intelligent Robots and Systems, pages 3961–3968. IEEE, 2014.
- Hanson et al. [2023] Nathaniel Hanson, Wesley Lewis, Kavya Puthuveetil, Donelle Furline, Akhil Padmanabha, Taşlan Padir, and Zackory Erickson. SLURP! Spectroscopy of Liquids Using Robot Pre-Touch Sensing. In 2023 IEEE International Conference on Robotics and Automation (ICRA), pages 3786–3792. IEEE, 2023.
- Haykin [1998] Simon Haykin. Neural networks: a comprehensive foundation. Prentice Hall PTR, 1998.
- He et al. [2016] Kaiming He, Xiangyu Zhang, Shaoqing Ren, and Jian Sun. Deep residual learning for image recognition. In Proceedings of the IEEE conference on computer vision and pattern recognition, pages 770–778, 2016.
- Huang et al. [2022] Hung-Jui Huang, Xiaofeng Guo, and Wenzhen Yuan. Understanding dynamic tactile sensing for liquid property estimation. arXiv preprint arXiv:2205.08771, 2022.
- Iashin et al. [2021] Vladimir Iashin, Francesca Palermo, Gökhan Solak, and Claudio Coppola. Top-1 corsmalAL challenge 2020 submission: Filling mass estimation using multi-modal observations of human-robot handovers. In Pattern Recognition. ICPR International Workshops and Challenges: Virtual Event, January 10-15, 2021, Proceedings, Part VIII, pages 423–436. Springer, 2021.
- Kennedy et al. [2019] Monroe Kennedy, Karl Schmeckpeper, Dinesh Thakur, Chenfanfu Jiang, Vijay Kumar, and Kostas Daniilidis. Autonomous precision pouring from unknown containers. IEEE Robotics and Automation Letters, 4(3):2317–2324, 2019.
- Li et al. [2022] Hao Li, Yizhi Zhang, Junzhe Zhu, Shaoxiong Wang, Michelle A Lee, Huazhe Xu, Edward Adelson, Li Fei-Fei, Ruohan Gao, and Jiajun Wu. See, hear, and feel: Smart sensory fusion for robotic manipulation. arXiv preprint arXiv:2212.03858, 2022.
- Liang et al. [2019] Hongzhuo Liang, Shuang Li, Xiaojian Ma, Norman Hendrich, Timo Gerkmann, Fuchun Sun, and Jianwei Zhang. Making sense of audio vibration for liquid height estimation in robotic pouring. In 2019 IEEE/RSJ International Conference on Intelligent Robots and Systems (IROS), pages 5333–5339. IEEE, 2019.
- Liang et al. [2020] Hongzhuo Liang, Chuangchuang Zhou, Shuang Li, Xiaojian Ma, Norman Hendrich, Timo Gerkmann, Fuchun Sun, Marcus Stoffel, and Jianwei Zhang. Robust robotic pouring using audition and haptics. In 2020 IEEE/RSJ International Conference on Intelligent Robots and Systems (IROS), pages 10880–10887. IEEE, 2020.
- Liu et al. [2021] Qi Liu, Fan Feng, Chuanlin Lan, and Rosa HM Chan. Va2mass: Towards the fluid filling mass estimation via integration of vision and audio learning. In Pattern Recognition. ICPR International Workshops and Challenges: Virtual Event, January 10-15, 2021, Proceedings, Part VIII, pages 451–463. Springer, 2021.
- Matl et al. [2019] Carolyn Matl, Robert Matthew, and Ruzena Bajcsy. Haptic perception of liquids enclosed in containers. In 2019 IEEE/RSJ International Conference on Intelligent Robots and Systems (IROS), pages 7142–7149. IEEE, 2019.
- Narasimhan et al. [2022] Gautham Narasimhan, Kai Zhang, Ben Eisner, Xingyu Lin, and David Held. Self-supervised transparent liquid segmentation for robotic pouring. In 2022 International Conference on Robotics and Automation (ICRA), pages 4555–4561. IEEE, 2022.
- Rozo et al. [2013] Leonel Rozo, Pablo Jiménez, and Carme Torras. Force-based robot learning of pouring skills using parametric hidden markov models. In 9th International Workshop on Robot Motion and Control, pages 227–232. IEEE, 2013.
- Saal et al. [2010] Hannes P Saal, Jo-Anne Ting, and Sethu Vijayakumar. Active estimation of object dynamics parameters with tactile sensors. In 2010 IEEE/RSJ International Conference on Intelligent Robots and Systems, pages 916–921. IEEE, 2010.
- Schenck and Fox [2017] Connor Schenck and Dieter Fox. Visual closed-loop control for pouring liquids. In 2017 IEEE International Conference on Robotics and Automation (ICRA), pages 2629–2636. IEEE, 2017.
- Taunyazov et al. [2020] Tasbolat Taunyazov, Weicong Sng, Hian Hian See, Brian Lim, Jethro Kuan, Abdul Fatir Ansari, Benjamin CK Tee, and Harold Soh. Event-driven visual-tactile sensing and learning for robots. arXiv preprint arXiv:2009.07083, 2020.
- Wang et al. [2023] Zhongli Wang, Guohui Tian, and Hao Pan. Robot gaining robust pouring skills through fusing vision and audio. ISA transactions, 135:428–437, 2023.
- Wilson et al. [2019] Justin Wilson, Auston Sterling, and Ming C Lin. Analyzing liquid pouring sequences via audio-visual neural networks. In 2019 IEEE/RSJ International Conference on Intelligent Robots and Systems (IROS), pages 7702–7709. IEEE, 2019.
- Xompero et al. [2022] Alessio Xompero, Santiago Donaher, Vladimir Iashin, Francesca Palermo, Gökhan Solak, Claudio Coppola, Reina Ishikawa, Yuichi Nagao, Ryo Hachiuma, Qi Liu, et al. The CORSMAL benchmark for the prediction of the properties of containers. IEEE Access, 10:41388–41402, 2022.
- Zhang et al. [2022] Dandan Zhang, Qiang Li, Yu Zheng, Lei Wei, Dongsheng Zhang, and Zhengyou Zhang. Explainable Hierarchical Imitation Learning for Robotic Drink Pouring. IEEE Transactions on Automation Science and Engineering, 19(4):3871–3887, 2022. doi: 10.1109/TASE.2021.3138280.
- Zhang et al. [2018] Tianhao Zhang, Zoe McCarthy, Owen Jow, Dennis Lee, Xi Chen, Ken Goldberg, and Pieter Abbeel. Deep imitation learning for complex manipulation tasks from virtual reality teleoperation. In 2018 IEEE International Conference on Robotics and Automation (ICRA), pages 5628–5635. IEEE, 2018.
-A Substance and Container Classification Data Collection Details
As described in Section IV-A, the RoboCAP Gripper closes around the container over the course of two seconds, yielding 200 individual readings for each of the ten electrodes due to the sampling frequency of 100 Hz. The microcontroller stops collecting values at the end of the two seconds, at which point the RoboCAP Gripper is fully closed around the container. Since the containers in our dataset have different diameters, we set the open and close positions manually. The RoboCAP Gripper was then commanded to open and this cycle was repeated for ten open-close trajectories for each substance-container combination. This comprised one set of data collection. All the containers were grasped at the same height, 1 cm from their base.
-B PWP Model Architecture and Training Details
The Res-MLP architecture, which our PWP model utilizes, consists of 7 residual modules with a 256 node fully-connected layer, followed by a ReLU activation, and a dropout of 0.05 within each module. The final output layer is followed by a ReLU activation since all three outputs are positive physical quantities. We train using the Adam Optimizer, with a batch size of 128, learning rate of , weight decay of , and all other parameters set to default PyTorch values. We train for approximately 150 epochs, which is when the Res-MLP model reaches its minimum loss on the pouring validation data.
Also, as mentioned in Section V-C2, a class label, representing a substance is provided as an input to the PWP model. This class label is embedded into a 50-dimensional vector . The embedding layer is learned through backpropagation with the rest of the neural network model. is concatenated with to form the input features, , for the PWP model.
-C PWP Model Loss Terms
As discussed in Section V-C4, our loss function consists of four terms. The second loss term, , acts as a constraint for the primary loss term (2). This loss term ensures that at any given timestep, , the sum of the predicted weights in all previous s time windows, should be equal to the ground truth weight at that timestep, . The timestep is randomly selected for each iteration during the training process.
| (A1) |
To ensure that and are not artificially low values, we also add two penalty losses, and , as follows:
| (A2) |
| (A3) |
Based on a frame-by-frame analysis of pouring videos for each substance, the minimum delay between when the poured substance initially leaves the container and eventually contacts the collecting cup is 0.15s. Since it is physically impossible for and to be shorter than this minimum delay, we define to penalize and that are less than s during training. Additionally, we reason that the time it takes for substance to reach the collecting cup should not vary significantly between adjacent timesteps. Thus, is used to penalize the cases where there is a large discrepancy between the predicted from one window and the predicted from the following window.
| Number of | Container | Substance | Container |
|---|---|---|---|
| Electrodes | + Substance | ||
| 10 | 97.8% | 84.9% | 84.7% |
| 6 | 94.9% | 81.9% | 81.0% |
| 2 | 84.0% | 71.2% | 69.5% |
| 1 | 69.4% | 56.0% | 46.9% |
-D Substance-Container Classification
In practice, a robot may encounter substances or containers that were not included in its initial training datasets. The generalization of capacitive end-effector sensing to novel, out-of-distribution containers or substances presents a promising yet challenging direction for future exploration, including the ability to classify new types of liquids and granular media outside the initial training distribution. One approach to doing so is to predict material properties [2, 12, 7] such as viscosity, density, surface tension, and thermal conductivity, rather than relying solely on discrete class labels. These continuous physical properties can provide a more nuanced understanding and categorization of materials. Further, employing machine learning techniques, such as transfer learning and few-shot learning, could enhance the gripper’s ability to generalize from known substances to new ones by leveraging similarities in material properties.
-E Substance-Container Classification: Electrode Ablations
To further motivate the selection of ten electrodes on the RoboCAP Gripper, we investigated the performance of our RoboCAP classifier with fewer electrodes. These results can aid researchers with more informed design decisions while integrating capacitive sensing in robotic end-effectors. For the six electrode case, we selected the 1st, 3rd and 5th electrodes from each panel. For the two electrode case, we selected the 1st and the 5th electrodes of the right panel (pouring side) since the electrodes from this panel have a relatively larger variation as the substance pours out. Lastly, for the one electrode case, we selected the third electrode on the right panel.
As seen in Table .1, increasing the number of electrodes leads to improved classification performance. However, classification performance when using smaller arrays of sensor remains competitive in performance and there exist several opportunities for future research and commercialization in terms of miniaturizing these arrays, such as using flexPCBs, to fit onto existing end effector fingertips.
| Substance | Ours | 6 electrodes | 2 electrodes |
|---|---|---|---|
| Water | |||
| Vinegar | |||
| Lentils | |||
| Rice | |||
| Oil | |||
| Overall |
-F Substance-Container Classification: Increasing Substance-Container Combinations
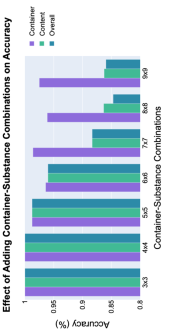
To further explore the ability of these methods to scale to more substance-container combinations that a robot may encounter in the real world, we present results, displayed in Fig. .1, on how classification accuracy varies when substance-container combinations are added. While container accuracy consistently stays above 95%, substance accuracy declines as more classes are added. This performance decline is expected as the classification problem becomes increasingly challenging with more classes. Future work could look into using hierarchical classifiers as proposed by Hanson et al. [9] to tackle this problem, as well as predicting continuous physical properties of containers and substances beyond discrete material classification. Additionally, future work may investigate multimodal sensing strategies, such as combining force-torque or haptic sensing in combination with capacitive sensing, to improve recognition performance of liquids and granular media.
-G Pouring: Electrode Ablations
We conducted an ablation study to explore the impact of the capacitive sensor’s design on pouring performance. The first set of experiments we ran for this study was with six electrodes. For this, we selected the 1st, 3rd and 5th electrodes from each panel and disabled the other electrodes during both the training and test trials. The second set of experiments were with two electrodes. Here we selected the 1st and the 5th electrodes of the right panel (pouring side) since the electrodes from this panel have a relatively larger variation as the substance pours out. All other electrodes are disabled for these experiments.
For each case described above, we collected 10 complete pouring trials in the same way as described in Sec. V-B, for each of the five substances for training, totaling 50 trials. Out of these, 80% of data collected was used for actual training and 20% for validation. We also collected 24 additional pouring trials per substance, in the same way as described in Sec. V-D for fitting the OWE function. For test, we conducted 5 trials for each substance at all four different target weights (50g, 75g, 100g, and 125g), totaling 100 trials. Table LABEL:tab:ablation shows the mean error and standard deviation for the two cases and our proposed design. Compared to the cases with the reduced number of electrodes, our proposed design exhibited better or on-par performance for all liquid and granular media substances. We further find that reducing the number of electrodes, or in some cases having information from only two electrodes, can also accurately predict the poured-out weight in a precision pouring context.
Overall, as the number of electrodes decreases, performance gradually declines. One reason for this can be that capacitive sensors are sensitive to environmental changes and electromagnetic interference (EMI). We find that using a larger number of electrodes helps improve robustness to noise in learning-based models. Without alternative signals from other electrodes, a model can erroneously learn noise patterns from a few number of electrodes, resulting in instabilities and lower performance during test time in new scenarios.
-H Pouring: Loss Term Ablations
To motivate our use of the offset start and end times, and respectively, when computing the change in ground truth weight , as well as the corresponding auxiliary loss terms A1, A2, and A3, we present results for the ablation of these terms when training the PWP model. Unlike our complete PWP model, which is trained using the full loss objective (1) and predicts , ,and , our ablated PWP model is trained only using loss term (2) and only predicts . Without the use of and , the ablated PWP model cannot account for the time delay between when a substance leaves the lip of the source container and when it reaches the target container and is measured by the weighing scale. As a result, the ablated PWP model maps capacitive sensor readings to the change in weight in the target container, while the complete PWP model maps to the change of weight in the source container. We also collected new data (120 pouring trials) to fit an OWE function, as described in V-D, and conducted 100 test trials, as in Appendix -G, for the ablated PWP to be used for control. Results comparing the complete PWP and ablated PWP, when used as part of our control pipeline to precisely pour the five substances, are summarized in Table .3. We found that pouring performance degrades when the PWP does not reason about the offset start and end times, and , reinforcing the impact of these terms in the proposed PWP loss function.
| Substance | Ours | No , |
|---|---|---|
| Water | ||
| Vinegar | ||
| Lentils | ||
| Rice | ||
| Oil | ||
| Overall |