Belle II Preprint 2024-012
KEK Preprint 2024-6
I. Adachi ,
Search for lepton-flavor-violating decays at Belle II
Abstract
We present the result of a search for the charged-lepton-flavor violating decay using a 424 sample of data recorded by the Belle II experiment at the SuperKEKB collider. The selection of events is based on an inclusive reconstruction of the non-signal tau decay, and on a boosted decision tree to suppress background. We observe one signal candidate, which is compatible with the expectation from background processes. We set a confidence level upper limit of on the branching fraction of the decay, which is the most stringent bound to date.
1 Introduction
In the standard model (SM) with massless neutrino hypotheses, the charged-lepton flavor is accidentally conserved. However, this symmetry is broken at loop-level when taking into account neutrino mixing, which implies the existence of charged-lepton-flavor violation, and thus the existence of processes such as , and conversions. In the simplest SM extension that allows for massive neutrinos, all charged-lepton-flavor-violating (LFV) rates are proportional to the square of neutrino masses. This results in predicted decay rates of ref:SM_cLFV ; ref:tau_lfv ; Blackstone:2019njl , well below the sensitivities of any experiment. The observation of LFV decays would, therefore, provide indisputable evidence of physics beyond the SM. Over the past four decades, the CLEO experiment at CESR, and the first generation -factory experiments BaBar at SLAC and Belle at KEK, have searched for LFV in -lepton decays. In total, 52 LFV decays with neutrinoless two-body or three-body final states have been investigated. Among these, decays,111Charge conjugation is implied throughout this paper. where , and in particular , have garnered significant attention in recent years. This is due to the potential enhancement of the branching fraction up to a value of in scenarios beyond the SM Abada:2021zcm ; Raidal:2008jk ; Teixeira:2016ecr ; Bhattacharya:2016mcc ; Feruglio:2017rjo ; Greljo:2015mma . The most stringent upper limit for this decay was set by the Belle collaboration at the level of at the 90% confidence level (C.L.) using electron-positron data corresponding to an integrated luminosity of 782 Hayasaka:2010np . The upper limits on the branching fraction set by the CLEO CLEO:1997aqy and BaBar BaBar:2010axs collaborations are 1.9 and , using 4.79 and 468 of data, respectively. In addition, experiments at the Large Hadron Collider have also contributed to this search. The LHCb LHCb:2014kws , ATLAS ATLAS:2016jts , and CMS CMS:2020kwy collaborations reported upper limits at the 90% C.L. of , and using proton-proton collision data corresponding to integrated luminosities of 3, 20.3, and 33.2 respectively. Recently, CMS presented a new result incorporating 2017 and 2018 data, amounting to a total integrated luminosity of 131, placing an upper limit at 2.9 at 90% C.L CMS:2023iqy . We report the results of a search for the LFV decay using an untagged selection, in which, in contrast to the previous searches, only the signal tau decay mode is explicitly reconstructed. We use a sample of 389 million events recorded with the Belle II detector Abe:2010gxa at the asymmetric-energy SuperKEKB collider Akai:2018mbz . The data, collected between 2019 and 2022, corresponds to an integrated luminosity of 424. Section 2 gives an overview of the Belle II detector and the data samples used. Section 3 presents the overall strategy for this analysis and the details of the candidate reconstruction and selection. Section 4 discusses the systematic uncertainties, and Section 5 presents the branching fraction measurement and limit computation. Finally, a summary is given in Section 6.
2 The Belle II detector, simulation and data samples
The Belle II detector consists of several subdetectors arranged in a cylindrical structure around the interaction point Abe:2010gxa . Charged-particle trajectories (tracks) are reconstructed using a two-layer silicon-pixel detector, surrounded by a four-layer double-sided silicon-strip detector and a central drift chamber (CDC). Only 15% of the second pixel layer was installed when the data were collected. Outside the CDC, which also provides / energy-loss measurements, particle identification using Cherenkov radiation is provided by a time-of-propagation (TOP) detector and an aerogel ring-imaging Cherenkov (ARICH) detector which cover the barrel and forward endcap regions, respectively. An electromagnetic calorimeter (ECL), divided into the forward endcap, barrel, and backward endcap regions, fills the remaining volume inside a 1.5 T superconducting solenoid and is used to reconstruct photons and electrons. A and muon detection system (KLM) is installed in the iron flux return of the solenoid. The axis of the laboratory frame is defined as the detector solenoid axis, with the positive direction along the electron beam. The polar angle and the transverse plane are defined relative to this axis. The search presented here is based on collisions at the center of mass energy of 10.58 GeV corresponding to the mass of the (362), 60 below it (42), and around 10.75 GeV (19). The corresponding cross sections for production are =0.919 at the energy, 0.929 for off-resonance data, and 0.891 around the energy, leading to a data sample of 389 million -pairs Banerjee:2007is . Monte-Carlo simulated events are used to optimize the selection and background rejection and to measure the signal efficiency. To study the signal process, we use 10 million events, in which one decays to three muons and the other to SM-allowed decays. The potential background processes studied using simulation include events, where indicates a , , , or quark; events; , where ; events, where indicates a pion, kaon, or proton; and four-lepton processes: . The process is generated using the KKMC generator Jadach:1999vf . The decays are simulated by the TAUOLA generator Jadach:1990mz and their final state radiated photons by PHOTOS Barberio:1990ms . We use KKMC to simulate and production; PYTHIA Sjostrand:2014zea for the fragmentation of the pair; PYTHIA interfaced with EvtGen Lange:2001uf for the production and decay of events; BabaYaga@NLO Balossini:2006wc ; Balossini:2008xr ; CarloniCalame:2003yt ; CarloniCalame:2001ny ; CarloniCalame:2000pz for events; and AAFH BERENDS1985421 ; BERENDS1985441 ; BERENDS1986285 and TREPS Uehara:1996bgt for the production of non-radiative four-leptons and final states. The size of the simulated samples for and events is equivalent to an integrated luminosity of 8 ab-1, while it ranges between 100 and 2 ab-1 for the other processes. The online event selection (hardware trigger) is based on the energy deposits (clusters) and their topologies in the ECL, or on independent trigger selection based on the number of charged particles reconstructed in the CDC. Most of the events are selected requiring a ECL total energy larger than 1 GeV and a topology incompatible with Bhabha events. The Belle II analysis software Kuhr:2018lps ; basf2-zenodo uses the GEANT4 Agostinelli:2002hh package to simulate the response of the detector to the passage of the particles and also provides a simulation of the triggers.
3 Event reconstruction and background rejection
3.1 Overall strategy
In the center-of-mass (c.m.) frame, the leptons are produced in opposite directions, with the decay products of one isolated from those of the other and contained in opposite hemispheres. The boundary between the hemispheres is experimentally defined by the plane perpendicular to the vector that maximizes the thrust value ():
| (1) |
where is the momentum of final state particle in the c.m. frame Brandt:1964sa ; Farhi:1977sg , including both charged and neutral particles. Here, and throughout the paper, quantities in the c.m. frame are indicated by an asterisk. We define the signal hemisphere as the one that contains the decay candidate, reconstructed by combining three charged particles. The trajectories of those particles are required to be displaced from the average interaction point by less than 3 along the axis and less than 1 in the transverse plane. Identification of muons of momentum greater than 0.7 relies mostly on their penetration depth in the KLM whereas for lower momenta information from the CDC and ECL dominate. Muons are identified using the discriminator where the likelihoods for each charged-particle hypothesis combine particle-identification information from CDC, TOP, ARICH, ECL, and KLM. The muon identification efficiency for the requirement is 92(89)% with a pion misidentification probability of 5(3)%, for particle momenta between 1.0 and 1.5. Since the decay is a neutrinoless process, the invariant mass of the reconstructed muons should be consistent with the mass of the lepton, except for decays affected by final state radiation (FSR) from the or its decay products. The energy in the c.m. system should be half of the c.m. energy except for corrections from initial state radiation (ISR) from the beams and FSR. Thus, the energy difference should be close to zero. These characteristic features are used to define the signal region, which is hidden until the finalization of the selection procedure to avoid any experimenter’s bias, and to optimize the selection criteria, which maximize the signal efficiency and suppress the contribution of background events. The distribution of signal in the (, ) plane is broadened by detector resolution and radiative effects. The radiation of photons from the initial state leads to a tail at low values of . Instead, FSR produces a tail at high values of and . Previous -factory experiments relied on the reconstruction of events where one decays to and the other , named the tag, decays into a final state with a single charged particle. The background rejection strategy relied on a cut-based selection. Here, we expand the search by using inclusive tagging to include a wider range of decays for the tag lepton. We also optimize the signal efficiency and reduce the background by using boosted decision trees (BDT). To compare the sensitivity of the inclusive tagging to the traditional one-prong tagging, we also perform a validation using a reconstruction method similar to the one used previously by Belle Hayasaka:2010np and BaBar BaBar:2010axs .
3.2 Inclusive tagging selection
Signal candidate decays are obtained by combining three muons originating from the interaction point with a total charge equal to , belonging to the same hemisphere and having . Instead of explicitly reconstructing the tagged lepton, we use the inclusive properties of all other particles in the event. Photons are reconstructed from ECL clusters within the CDC acceptance () and not associated with any tracks. Photons used for reconstruction must have an energy deposit of at least 0.1 . Neutral pions are then identified as photon pairs with invariant masses within , which corresponds to a range of approximately units of resolution about the known mass ParticleDataGroup:2022pth . All photons with energies greater than 0.2 , along with photons part of reconstructed candidates, are used to define variables related to the kinematic properties of the event such as the missing momentum, defined as the difference between the momenta of the initial and that of all reconstructed tracks and photons in the event, its mass and the thrust axis. This high energy threshold for photon candidates aims to reduce photons from beam background. All tracks and clusters that are not used in the signal reconstruction form the rest of the event (ROE), whose kinematic properties are exploited for further background suppression. In order to suppress beam-related backgrounds, the following criteria must be satisfied for particles to be retained as part of the ROE: photons are required to have energies of at least 0.2 , and tracks must have transverse momenta higher than 0.075 , and be displaced from the average interaction point by less than 3 along the axis and less than 1 in the transverse plane. In addition, tracks and photons should lie within the CDC angular acceptance. We define rectangular regions in the two-dimensional plane (, ) centered at the expected position of the signal peak (), with side lengths proportional to the expected resolutions (). For each variable, values are estimated as the widths of a bifurcated Gaussian function fitted to the simulated signal distribution. The expected peak position , and the high- and low-mass resolutions , are reported in Table 1.
| Variable |
|
||
|---|---|---|---|
| () | 1777.350.07 | 4.800.07 | 4.440.06 |
| () | 0.70.3 | 14.90.3 | 10.00.5 |
A -wide rectangular region in the (, ) plane is used for the background-rejection optimization using simulated data. The final yield extraction is performed in a 5 semi-axis wide, asymmetric elliptical signal region (SR). The rotation angle of the axis of the ellipse is obtained from a linear fit to the profile distribution of versus . The sideband region (SB), defined as the area covering , subtracted of the SR, is used for the validation of the background rejection. The background originates from radiative dilepton and four-lepton final states (low-multiplicity backgrounds) with potential electrons misidentified as muons, incorrectly reconstructed SM events, and continuum hadronization processes from events, where pions are misidentified as muons. The other simulated processes are found to be negligible. To suppress events with pions or other particles misidentified as muons, two of the muon candidates are required to have . Low-multiplicity backgrounds are concentrated at very high thrust values and have a missing momentum pointing at the boundaries of the polar angular acceptance in the c.m. frame. In Fig. 1, there are disagreements between data and simulation in these regions, consistent with unsimulated low-multiplicity backgrounds such as four-muon final state processes with initial and final state radiations. To suppress such backgrounds, we place requirements on the polar angle of the missing momentum, , and the thrust, . The overall signal efficiency after those requirements, including event reconstruction and selection, is , while analysis of the simulated background events predicts about 300 events in the region. They are mostly due to processes in which one or two of the final state muons are misidentified.


3.3 BDT-based background rejection
To suppress the remaining background events, a boosted decision tree classifier (BDT) is trained using the XGBoost library XGBoostPaper . The BDT uses 32 variables related to three distinct categories. The first category consists of variables associated with the signal , such as the muon energies, polar angles and ordered transverse momenta in the c.m. frame; the flight time of the divided by its uncertainty; the cosine of the angle between the momentum and its direction reconstructed from the origin and decay vertices; the angle between the momentum and the closest track in the event (including final-state muons); and the of the kinematic fit of the decay chain. The second category involves variables related to the ROE properties such as its mass, defined as the mass of the four-vector resulting from the sum of all reconstructed objects forming the ROE, its , computed as the difference between the total energy of all ROE objects and half the center-of-mass energy; the numbers of muon, pion and electron candidates in the ROE, which are identified according to the highest value; the product of the ROE charge (which can be anything) and signal charge (which is equal to ); the thrust and the following quantities related to the ROE thrust axis, where the ROE thrust axis is computed in a manner similar to the event thrust axis, but using only the ROE detector objects: the cosine of the angle between the ROE thrust axis and the signal thrust axis, and the cosine of the angle between the ROE thrust axis and the axis. The third category of input variables comprises the thrust, the numbers of tracks and photons in the event, the total photon energy in the c.m. frame, and variables related to the missing momentum of the event: its transverse component in the c.m. frame, its polar angle in the c.m. frame, the cosine of the angle between the missing momentum and each of the three muons, and the invariant missing mass squared. The BDT is trained on 176000 simulated signal events and 3400 simulated background and events in the region, corresponding to a data set equivalent to an integrated luminosity of 4. Given that the background retention is already low before the BDT training, a cross-validation (k-folding) algorithm is used to reduce the impact of statistical fluctuations on the training results 10.1145/307400.307439 . The BDT parameters are optimized using the Optuna library akiba_optuna_2019 , which minimizes the logarithmic loss function. The requirement on the BDT output () is chosen to maximize the Punzi figure-of-merit Punzi:2003bu defined as , where is the signal efficiency, the number of background events in the signal region and (i.e. we optimise the search for a three-standard-deviation signal). The size of the elliptical signal region is also optimized, and the initial width of 5 is found to be the best one, together with a requirement on the to be larger than 0.9. Finally, a data-driven requirement is introduced only to keep events in which the sum of the charged-particles charges is zero. The total signal efficiency evaluated on an independent simulation sample is , where the uncertainty is due to the limited size of the sample, for a background reduction of 98.2%. These values include corrections that account for the differences between data and simulation in particle identification efficiencies. After all background rejection steps, 88% of the selected signal candidates in the simulation have one track in the ROE, while 12% contain three tracks.
3.4 Simulation validation and expected background events
The agreement between data and simulation for the BDT output is checked using the SB region as shown in Fig. 2. After the BDT selection, the number of background events expected in the SB region from the simulation is , while in data we observe .

The number of expected events in the signal region after the BDT selection is obtained from a data-driven method using three other regions of the plane consisting of the BDT output and the distance to the signal peak: region is outside the SR with ; region is inside the SR with ; and region is outside the SR with . The distributions of events in data and simulation for those two variables are shown in Fig. 3.


Events in region correspond to a subset of the originally hidden SR. However, due to the BDT requirement, the signal efficiency in this region is 50 times lower than in the search region, and the potential signal is negligible compared with the background. The number of expected events in the SR region is given by
| (2) |
where is the transfer factor between the region and . The measured event yields are , , and , resulting in , obtained by assuming Poisson distributions with means corresponding to the yields in regions A, B and C.
4 Systematic uncertainties
One category of systematic uncertainties arises from differences between experimental data and simulation due to possible mismodeling in the generation and reconstruction of the simulated samples, and affects the signal efficiency uncertainty. We take into account the systematic uncertainty associated with the corrections to the simulated muon-identification efficiencies, derived from auxiliary measurements in data using , , and events. These corrections are obtained as functions of momentum, polar angle and charge, and applied to events reconstructed from simulation. The systematic uncertainty is obtained by varying the corrections within their statistical and systematic uncertainties and estimating the impact of these variations on the selection efficiency. Adding the statistical and systematic variations in quadrature, the result is a relative uncertainty in the signal efficiency of %. The difference between data and simulation in track-reconstruction efficiency is measured in events, selecting and decays. A discrepancy of 0.24% per track is observed, resulting in a systematic uncertainty of . The agreement between data and simulation for the trigger efficiency is evaluated using the control sample. In data, the trigger efficiency is computed using independent trigger selections: the efficiency of the ECL-based trigger selection is obtained using events triggered by the CDC, while the efficiency of the CDC-based trigger selection is evaluated using events passing the ECL trigger requirements. The agreement between data and simulation efficiencies is 0.5% for the ECL trigger selection and is 4.3% for the CDC trigger selection. Given that the efficiency of trigger selections based on the ECL only is 88%, the weighted average of the discrepancies is computed to be 0.7% and this is used as the systematic uncertainty of the trigger efficiency. The possible bias coming from the use of independent trigger selections to evaluate the trigger efficiency is tested on simulated events. A difference of 0.5% is found with respect to the absolute efficiency, and added in quadrature to the previous uncertainty. The control sample is also used to obtain a systematic uncertainty on the BDT selection. The same BDT that was trained for the signal decay is applied to these events and a requirement is chosen on the output in order to have the same efficiency on events as on the signal decay. The difference between the efficiency in data and simulation for this BDT requirement, , is considered as a systematic uncertainty. In order to take into account possible mismodeling of the ISR, FSR, and resolution of the signal extraction variables, we change the signal region definition by . This results in a variation of the signal efficiency, that we take as a systematic uncertainty. The number of expected background events is affected by an uncertainty that originates from imperfections in the magnetic field description used in the event reconstruction and material mismodeling. To correct for those effects, the momenta of charged particles are scaled with a factor of 0.99987, evaluated by measuring the mass-peak position of high-yield samples of decays reconstructed in data and comparing it to the world average value of the mass ParticleDataGroup:2022pth . The corresponding systematic uncertainty is obtained by varying the correction factor according to its uncertainty (), which leads to different data yields in the sideband region and, thus, different numbers of expected events . The resulting systematic uncertainty, taken as the difference from the nominal value, is %, and is mainly due to the small number of events. The systematic uncertainty in the integrated luminosity , measured with samples of Bhabha and diphoton events Belle-II:2019usr , is evaluated from the difference observed between the results from the two methods and amounts to 0.6% relative uncertainty. Finally, we also assign an uncertainty of 0.003 nb on the -pair production cross section, as evaluated in Ref. Banerjee:2007is . A summary of the systematic uncertainties is given in Table 2.
| Uncertainty (%) | |||
| Quantity | Source | Low | High |
| PID | 2.1 | 2.4 | |
| Tracking | 1.0 | 1.0 | |
| Trigger | 0.9 | 0.9 | |
| BDT | 1.5 | 1.5 | |
| Signal region | 3.9 | 2.9 | |
| Momentum Scale | 16 | 16 | |
| 0.6 | 0.6 | ||
| 0.3 | 0.3 | ||
In order to perform a validation of the inclusive reconstruction and BDT selection, we carry out an alternative analysis using one-prong tagging reconstruction similar to that done previously by Belle and Babar. We select events containing exactly four charged particles with zero total charge. Within the tag side, we categorize the charged particle as either a lepton (leptonic tag) or a hadron (hadronic tag). The contamination from events is mitigated using the data-driven requirements for leptonic and for hadronic tags, along with a requirement at most one signal track points to the endcaps. These requirements also suppress the and background components, which are further rejected by requiring the difference between the tag tau energy and half the center-of-mass energy to be less than , and . The background is suppressed by requiring the visible c.m. energy of all reconstructed particles in the event to be smaller than 10.2 and the missing momentum to be larger than 0.4 . To optimize the muon identification selection, charged particles are separated according to their momentum into three categories corresponding to tracks not reaching, partially crossing, or fully crossing the KLM. Selection criteria are optimized independently for the three categories using the Punzi figure-of-merit. The signal efficiency is 14.9%, which is nearly twice that achieved at the first generation -factory experiments. This increase is due to a more optimal selection, which includes low momentum muons on the signal side and decays in the tag side, as well as improved muon identification. The number of background events expected from simulation is 0.43. The inclusive-tagging selection has a 37% higher efficiency than that of the one-prong tagging method for a similar level of background and is thus used as the final result.
5 Result
The distribution of events in the (, ) plane is shown in Fig. 4 for data and simulated signal events. We observe one event in the signal region, . Using a signal efficiency of , where the first uncertainty is statistical and the second are systematic, and a number of expected background events in the formula given in Eq. 3,
| (3) |
we compute a branching fraction of , where the first uncertainty is statistical and the second is systematic. The other inputs to Eq. 3 are the integrated luminosity of the analyzed data sample; the -pair production cross section , where a weighted average of the cross sections at the different data taking energies is used.

The distributions of all selected events in the region for data and simulation for the and variables are shown in Fig. 5.


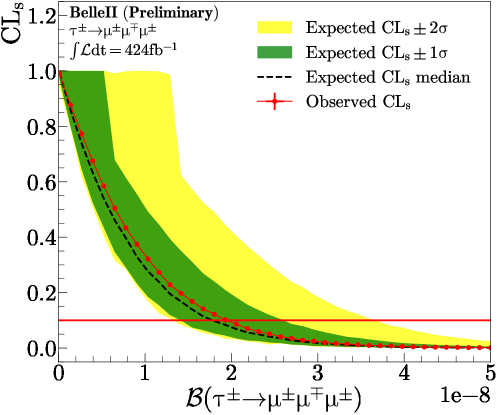
As no signal is found, we compute a 90% confidence level (C.L.) upper limit on the branching fraction. We estimate the upper limit using the modified frequentist Junk:1999kv ; Read:2002hq method implemented in the RooStat framework. We generate pseudo-experiments at 40 points distributed uniformly in the branching fraction range . The total statistical and systematic uncertainties affecting each experimental input, discussed in Sect. 4, are combined in quadrature. Figure 6 shows the curves computed as a function of the upper limit on the branching fractions for the inclusive tagging analysis. The dashed black line shows the expected and the green and yellow bands give the and contours, respectively. The expected limit assuming an observed number of events equal to 0.7, as expected from background estimation, is at 90% C.L, while the observed limit on the branching fraction of is at 90% C.L.
The limit is also evaluated using a Bayesian approach CALDWELL20092197 yielding the same result. Using the alternative one-prong tagging analysis, zero events are observed in the signal region. This corresponds to a branching fraction of , where the first uncertainty is statistical and the second is systematic. The small statistical uncertainty is coming from the fact that the number of expected background events is derived from simulation. The corresponding limit is at 90% C.L.
6 Summary
We present a search for the LFV decay using a 424 sample of electron-positron collision data collected by the Belle II experiment. Using a novel inclusive-tagging reconstruction followed by a BDT-based selection, the efficiency is higher by a factor of 2.5 than the efficiency in the latest Belle analysis Hayasaka:2010np and 37% higher than a one-prong tagging reconstruction performed on the same Belle II dataset, for an expected number of background events compatible with zero. We observe one event in the signal region, which corresponds to a branching fraction of , where the first uncertainty is statistical and the second one systematic. The observed (expected) limit at 90% C.L. computed in a frequentist approach is 1.9 (1.8) , which is more restrictive than the previous lowest limit. This work, based on data collected using the Belle II detector, which was built and commissioned prior to March 2019, was supported by Higher Education and Science Committee of the Republic of Armenia Grant No. 23LCG-1C011; Australian Research Council and Research Grants No. DP200101792, No. DP210101900, No. DP210102831, No. DE220100462, No. LE210100098, and No. LE230100085; Austrian Federal Ministry of Education, Science and Research, Austrian Science Fund No. P 34529, No. J 4731, No. J 4625, and No. M 3153, and Horizon 2020 ERC Starting Grant No. 947006 “InterLeptons”; Natural Sciences and Engineering Research Council of Canada, Compute Canada and CANARIE; National Key R&D Program of China under Contract No. 2022YFA1601903, National Natural Science Foundation of China and Research Grants No. 11575017, No. 11761141009, No. 11705209, No. 11975076, No. 12135005, No. 12150004, No. 12161141008, and No. 12175041, and Shandong Provincial Natural Science Foundation Project ZR2022JQ02; the Czech Science Foundation Grant No. 22-18469S; European Research Council, Seventh Framework PIEF-GA-2013-622527, Horizon 2020 ERC-Advanced Grants No. 267104 and No. 884719, Horizon 2020 ERC-Consolidator Grant No. 819127, Horizon 2020 Marie Sklodowska-Curie Grant Agreement No. 700525 “NIOBE” and No. 101026516, and Horizon 2020 Marie Sklodowska-Curie RISE project JENNIFER2 Grant Agreement No. 822070 (European grants); L’Institut National de Physique Nucléaire et de Physique des Particules (IN2P3) du CNRS and L’Agence Nationale de la Recherche (ANR) under grant ANR-21-CE31-0009 (France); BMBF, DFG, HGF, MPG, and AvH Foundation (Germany); Department of Atomic Energy under Project Identification No. RTI 4002, Department of Science and Technology, and UPES SEED funding programs No. UPES/R&D-SEED-INFRA/17052023/01 and No. UPES/R&D-SOE/20062022/06 (India); Israel Science Foundation Grant No. 2476/17, U.S.-Israel Binational Science Foundation Grant No. 2016113, and Israel Ministry of Science Grant No. 3-16543; Istituto Nazionale di Fisica Nucleare and the Research Grants BELLE2; Japan Society for the Promotion of Science, Grant-in-Aid for Scientific Research Grants No. 16H03968, No. 16H03993, No. 16H06492, No. 16K05323, No. 17H01133, No. 17H05405, No. 18K03621, No. 18H03710, No. 18H05226, No. 19H00682, No. 20H05850, No. 20H05858, No. 22H00144, No. 22K14056, No. 22K21347, No. 23H05433, No. 26220706, and No. 26400255, and the Ministry of Education, Culture, Sports, Science, and Technology (MEXT) of Japan; National Research Foundation (NRF) of Korea Grants No. 2016R1D1A1B02012900, No. 2018R1A2B3003643, No. 2018R1A6A1A06024970, No. 2019R1I1A3A01058933, No. 2021R1A6A1A03043957, No. 2021R1F1A1060423, No. 2021R1F1A1064008, No. 2022R1A2C1003993, and No. RS-2022-00197659, Radiation Science Research Institute, Foreign Large-Size Research Facility Application Supporting project, the Global Science Experimental Data Hub Center of the Korea Institute of Science and Technology Information and KREONET/GLORIAD; Universiti Malaya RU grant, Akademi Sains Malaysia, and Ministry of Education Malaysia; Frontiers of Science Program Contracts No. FOINS-296, No. CB-221329, No. CB-236394, No. CB-254409, and No. CB-180023, and SEP-CINVESTAV Research Grant No. 237 (Mexico); the Polish Ministry of Science and Higher Education and the National Science Center; the Ministry of Science and Higher Education of the Russian Federation and the HSE University Basic Research Program, Moscow; University of Tabuk Research Grants No. S-0256-1438 and No. S-0280-1439 (Saudi Arabia); Slovenian Research Agency and Research Grants No. J1-9124 and No. P1-0135; Agencia Estatal de Investigacion, Spain Grant No. RYC2020-029875-I and Generalitat Valenciana, Spain Grant No. CIDEGENT/2018/020; National Science and Technology Council, and Ministry of Education (Taiwan); Thailand Center of Excellence in Physics; TUBITAK ULAKBIM (Turkey); National Research Foundation of Ukraine, Project No. 2020.02/0257, and Ministry of Education and Science of Ukraine; the U.S. National Science Foundation and Research Grants No. PHY-1913789 and No. PHY-2111604, and the U.S. Department of Energy and Research Awards No. DE-AC06-76RLO1830, No. DE-SC0007983, No. DE-SC0009824, No. DE-SC0009973, No. DE-SC0010007, No. DE-SC0010073, No. DE-SC0010118, No. DE-SC0010504, No. DE-SC0011784, No. DE-SC0012704, No. DE-SC0019230, No. DE-SC0021274, No. DE-SC0021616, No. DE-SC0022350, No. DE-SC0023470; and the Vietnam Academy of Science and Technology (VAST) under Grants No. NVCC.05.12/22-23 and No. DL0000.02/24-25. These acknowledgements are not to be interpreted as an endorsement of any statement made by any of our institutes, funding agencies, governments, or their representatives. We thank the SuperKEKB team for delivering high-luminosity collisions; the KEK cryogenics group for the efficient operation of the detector solenoid magnet; the KEK Computer Research Center for on-site computing support; the NII for SINET6 network support; and the raw-data centers hosted by BNL, DESY, GridKa, IN2P3, INFN, and the University of Victoria.
References
- (1) T. Li, M.A. Schmidt, C.-Y. Yao and M. Yuan, Charged lepton flavor violation in light of the muon magnetic moment anomaly and colliders, Eur. Phys. J. C 81 (2021) 811 [2104.04494].
- (2) G. Hernández-Tomé, G. López Castro and P. Roig, Flavor violating leptonic decays of and leptons in the Standard Model with massive neutrinos, Eur. Phys. J. C 79 (2019) 84 [1807.06050].
- (3) P. Blackstone, M. Fael and E. Passemar, at a rate of one out of tau decays?, Eur. Phys. J. C 80 (2020) 506 [1912.09862].
- (4) A. Abada, J. Kriewald and A.M. Teixeira, On the role of leptonic CPV phases in cLFV observables, Eur. Phys. J. C 81 (2021) 1016 [2107.06313].
- (5) M. Raidal et al., Flavour physics of leptons and dipole moments, Eur. Phys. J. C 57 (2008) 13 [0801.1826].
- (6) A.M. Teixeira, Theoretical aspects of charged Lepton Flavour Violation, J. Phys. Conf. Ser. 888 (2017) 012029 [1612.05561].
- (7) B. Bhattacharya, A. Datta, J.-P. Guévin, D. London and R. Watanabe, Simultaneous Explanation of the and Puzzles: a Model Analysis, JHEP 01 (2017) 015 [1609.09078].
- (8) F. Feruglio, P. Paradisi and A. Pattori, On the Importance of Electroweak Corrections for B Anomalies, JHEP 09 (2017) 061 [1705.00929].
- (9) A. Greljo, G. Isidori and D. Marzocca, On the breaking of Lepton Flavor Universality in B decays, JHEP 07 (2015) 142 [1506.01705].
- (10) Belle collaboration, Search for Lepton Flavor Violating Tau Decays into Three Leptons with 719 Million Produced Pairs, Phys. Lett. B 687 (2010) 139 [1001.3221].
- (11) CLEO collaboration, New limits for neutrinoless tau decays, Phys. Rev. D 57 (1998) 5903 [hep-ex/9712010].
- (12) BaBar collaboration, Limits on tau Lepton-Flavor Violating Decays in three charged leptons, Phys. Rev. D 81 (2010) 111101 [1002.4550].
- (13) LHCb collaboration, Search for the lepton flavour violating decay - → - + -, JHEP 02 (2015) 121 [1409.8548].
- (14) ATLAS collaboration, Probing lepton flavour violation via neutrinoless decays with the ATLAS detector, Eur. Phys. J. C 76 (2016) 232 [1601.03567].
- (15) CMS collaboration, Search for the lepton flavor violating decay 3 in proton-proton collisions at 13 TeV, JHEP 01 (2021) 163 [2007.05658].
- (16) CMS collaboration, Search for the lepton flavor violating → 3 decay in proton-proton collisions at =13TeV, Phys. Lett. B 853 (2024) 138633 [2312.02371].
- (17) Belle II collaboration, Belle II technical design report, 1011.0352.
- (18) K. Akai, K. Furukawa and H. Koiso, SuperKEKB collider, Nucl. Instrum. Meth. A907 (2018) 188 [1809.01958].
- (19) S. Banerjee, B. Pietrzyk, J.M. Roney and Z. Wa̧s, Tau and muon pair production cross-sections in electron-positron annihilations at GeV, Phys. Rev. D 77 (2008) 054012 [0706.3235].
- (20) S. Jadach, B.F.L. Ward and Z. Wa̧s, The precision Monte Carlo event generator KK for two-fermion final states in collisions, Comput. Phys. Commun. 130 (2000) 260 [hep-ph/9912214].
- (21) S. Jadach, J.H. Kuhn and Z. Wa̧s, TAUOLA: A library of Monte Carlo programs to simulate decays of polarized tau leptons, Comput. Phys. Commun. 64 (1990) 275.
- (22) E. Barberio, B. van Eijk and Z. Wa̧s, PHOTOS: A universal Monte Carlo for QED radiative corrections in decays, Comput. Phys. Commun. 66 (1991) 115.
- (23) T. Sjöstrand, S. Ask, J.R. Christiansen, R. Corke, N. Desai, P. Ilten et al., An Introduction to PYTHIA 8.2, Comput. Phys. Commun. 191 (2015) 159 [1410.3012].
- (24) D.J. Lange, The EvtGen particle decay simulation package, Nucl. Instrum. Meth. A462 (2001) 152.
- (25) G. Balossini, C.M. Carloni Calame, G. Montagna, O. Nicrosini and F. Piccinini, Matching perturbative and parton shower corrections to Bhabha process at flavour factories, Nucl. Phys. B 758 (2006) 227.
- (26) G. Balossini, C. Bignamini, C.M.C. Calame, G. Montagna, O. Nicrosini and F. Piccinini, Photon pair production at flavour factories with per mille accuracy, Phys. Lett. B 663 (2008) 209.
- (27) C.M. Carloni Calame, G. Montagna, O. Nicrosini and F. Piccinini, The BABAYAGA event generator, Nucl. Phys. B Proc. Suppl. 131 (2004) 48.
- (28) C.M. Carloni Calame, An improved parton shower algorithm in QED, Phys. Lett. B 520 (2001) 16.
- (29) C.M. Carloni Calame, C. Lunardini, G. Montagna, O. Nicrosini and F. Piccinini, Large angle Bhabha scattering and luminosity at flavor factories, Nucl. Phys. B 584 (2000) 459.
- (30) F. Berends, P. Daverveldt and R. Kleiss, Radiative corrections to the process , Nucl. Phys. B 253 (1985) 421.
- (31) F. Berends, P. Daverveldt and R. Kleiss, Complete lowest-order calculations for four-lepton final states in electron-positron collisions, Nucl. Phys. B 253 (1985) 441.
- (32) F. Berends, P. Daverveldt and R. Kleiss, Monte Carlo simulation of two-photon processes: II: Complete lowest order calculations for four-lepton production processes in electron-positron collisions, Comp. Phys. Commun. 40 (1986) 285.
- (33) S. Uehara, TREPS: A Monte-Carlo Event Generator for Two-photon Processes at Colliders using an Equivalent Photon Approximation, 1310.0157.
- (34) Belle II Framework Software Group, The Belle II Core Software, Comput. Softw. Big Sci. 3 (2019) 1 [1809.04299].
- (35) Belle II collaboration, “Belle II Analysis Software Framework (basf2).” https://doi.org/10.5281/zenodo.5574115.
- (36) GEANT4 collaboration, GEANT4: A simulation toolkit, Nucl.Instrum.Meth. A506 (2003) 250.
- (37) S. Brandt, C. Peyrou, R. Sosnowski and A. Wroblewski, The Principal axis of jets. An Attempt to analyze high-energy collisions as two-body processes, Phys. Lett. 12 (1964) 57.
- (38) E. Farhi, A QCD Test for Jets, Phys. Rev. Lett. 39 (1977) 1587.
- (39) Particle Data Group, Review of Particle Physics, PTEP 2022 (2022) 083C01.
- (40) T. Chen and C. Guestrin, XGBoost: A scalable tree boosting system, in Proceedings of the 22nd ACM SIGKDD International Conference on Knowledge Discovery and Data Mining, KDD ’16, ACM, Aug., 2016, DOI.
- (41) A. Blum, A. Kalai and J. Langford, Beating the hold-out: Bounds for k-fold and progressive cross-validation, in Proceedings of the Twelfth Annual Conference on Computational Learning Theory, COLT ’99, (New York, NY, USA), p. 203–208, Association for Computing Machinery, 1999, DOI.
- (42) T. Akiba, S. Sano, T. Yanase, T. Ohta and M. Koyama, Optuna: A Next-generation Hyperparameter Optimization Framework, 1907.10902.
- (43) G. Punzi, Sensitivity of searches for new signals and its optimization, eConf C030908 (2003) MODT002 [physics/0308063].
- (44) Belle II collaboration, Measurement of the integrated luminosity of the Phase 2 data of the Belle II experiment, Chin. Phys. C 44 (2020) 021001 [1910.05365].
- (45) T. Junk, Confidence level computation for combining searches with small statistics, Nucl. Instrum. Meth. A 434 (1999) 435 [hep-ex/9902006].
- (46) A.L. Read, Presentation of search results: The CL(s) technique, J. Phys. G 28 (2002) 2693.
- (47) A. Caldwell, D. Kollár and K. Kröninger, BAT – The Bayesian analysis toolkit, Computer Physics Communications 180 (2009) 2197.
Additional Material
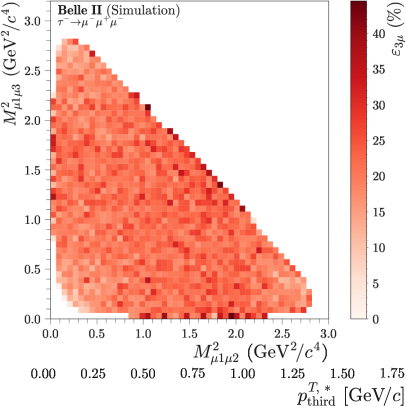
The signal efficiency as function of the two-dimensional plane defined by the mass squared of the opposite charge muons is provided in Fig. 7.

Comparison between data and simulation for the most discriminating variables used in the BDT are shown in Fig. 8.