Structure of proper motions in a sunspot penumbra111Published in IJAA, 2015, Vol. 2, Issue 1, Pages 39-57, DOI: 10.22128/IJAA.2015.16 (https://ijaa.du.ac.ir/).
Abstract
We study the structure and evolution of the horizontal proper motions in a regular sunspot penumbra, very close to the solar disc center, in active region NOAA 11092 using a 48 min time sequences of blue continuum images recorded by Hinode/SOT in 2010 August 3. During the day of the observation, the active region had a low activity level. We apply local correlation tracking (LCT) to the time series of the images to obtain the field of horizontal proper motions (flow field). The penumbra shows a slow (fast) flow field with an average speed of 0.2 (0.4) km/s starting at its middle towards the umbra (outer penumbral boundary) as an inward (outward) motion in accordance with previous findings. This behavior defines a continuous divergence line at the middle of the penumbra (). A distorted ringlike feature with very slow flows ( m/s; zero-flow ring: ZFR) co-spatial with the divergence line is clearly seen on the speed map of proper motions in logarithmic scale. Deep intrusion of coordinated penumbral filaments into the umbra can cause the ZFR a) to be significantly displaced towards the umbra (in most cases) or b) to be discontinuous, showing considerable speeds there ( m/s). Where the ZFR shows discontinuity, the divergence line does not move toward the umbra. Also, because of the different evolutionary flows of adjacent penumbral filaments, the ZFR and the divergence line show a stable backward/forward displacement along itself during the 48 min observation. The radial variations of the azimuthally averaged brightness show a local bright ring with a weak contrast of close to the ZFR. At the outer penumbra, we find that the converging filamentary flow occurs in a dark radial channel and the filamentary diverging flows are formed by the evolution of thin bright fibrils. Also, the large speeds at the penumbra boundary are produced by the displacement and/or the fragmentation of the bright fibrils in developing filamentary flows. At the near vicinity of the penumbra, in surrounding granulation, some divergence centers are strongly pushed away as a whole with an average speed of about 0.6 km/s by these developing filamentary flows.
keywords:
Sun: sunspots1 Introduction
Magnetic fields on the Sun interact in various ways with plasma and radiation producing a large variety of phenomena. In the convection zone, large and small scale magnetic fields are generated and partially transferred into the outer layers of the Sun. A sunspot as seen in the photosphere is the most prominent example of magnetic phenomena whose magnetic field extends into both the interior and the outer layers of the Sun. Therefore, sunspots are central to our understanding of solar magnetism.
At an insufficient spatial resolution (worse than 1 arcsec), the dark central/inner part of a sunspot, so-called umbra, is surrounded by a fairly uniform region, so-called penumbra, which is on average brighter than the umbra, but less bright than the surrounding granulation. However, at a spatial resolution of a few tenth of arcsec, a sunspot penumbra exhibits bright and dark filamentary structures and penumbral grains often appear at the head (the umbral side) of the bright filaments. Furthermore, it has been demonstrated that the formation of the penumbra is coupled to the Evershed flow - a nearly horizontal and radial outflow of plasma from inner penumbra towards the outer boundary [1] - which is correlated to the filamentary structures of the magnetic field (e.g., [2, 3]; for a review see [4]).
Borrero & Ichimoto [4] (also see references therein) have presented the spatial correlation between penumbral filaments and the Evershed flow and obtained that the Evershed flow correlates with more horizontal magnetic fields throughout the entire penumbra, while it correlates with bright filaments in the inner penumbra but with dark filaments in the outer penumbra.
At high angular resolution, penumbral filaments exhibit a central dark lane (core) and two lateral brightenings [5]. The common occurrence of dark-cored filaments and the fact that their various parts show a coherent behavior have raised expectations that they could be the fundamental constituents of the penumbra. The high-resolution spectroscopic measurements (e.g., [6, 7, 8]) have demonstrated that the Evershed flow appears preferentially in dark cores, although its velocity varies from one dark-cored filament to another.
The steady siphon-flow (e.g., [9, 10, 11, 12]) and the rising flux-tube [13, 14, 15] can give two possible mechanisms of the Evershed flow in the context of an uncombed flux-tube penumbra [16] or interlocking comb structure [17]. In the field-free gap model of a penumbra [18, 19], overturning convection takes place inside field-free gaps within the penumbra. Then, a radial outflow resembling the Evershed flow may be driven.
Deng et al. [20] point that a phenomenon related to a change in the local flow field in and around a sunspot, magnetic flux can affect the formation and decay of the sunspot penumbra. Therefore, a careful study of flow field in and around a sunspot penumbra in different evolutionary phases is necessary to understand the processes that might contribute to sunspot evolution.
In the present work, we do not deal with spectroscopic analysis. But, we are interested in local horizontal flows in a sunspot penumbra that can be derived with local correlation tracking (LCT, [21]) applied to a time series of intensity images (Sect. 2).
Generally, the measurement of the displacement of some tracers, using broad-band imagery provides two components of the local horizontal flow. The differential rotation of the Sun was discovered by tracking sunspots across the solar disc. Also, local horizontal flows (proper motions) in the solar photosphere can be inferred from the tracking of solar granulation. In this latter measurement, the horizontal flows are inferred from the displacement of a bright feature (feature tracking; e.g., [22], [23] and references therein).
However, the LCT algorithm has been used by several authors to derive the horizontal flow fields in different types of solar applications, e.g., Brandt et al. [24] found vortex flows in the solar granulation, November [25] studied the proper motion of solar granulation to search for mesogranulation. Also, Wang et al. [26] studied the vorticity and divergence in the solar photosphere and Roudier et al. [27] measured the lifetime of solar mesogranules. Bonet et al. [28], and Sobotka & Roudier [29] studied the dynamics of moat flow around sunspots. Molowny-Horas [30], Márquez et al. [31] and Denker et al. [32] measured horizontal proper motions in a sunspot penumbra.
We follow the definitions of Denker et al. [32] and use the terms flow, proper motion or speed when we refer to LCT results and leave the term velocity for spectroscopic/Doppler measurements of plasma motions, although this latter one is not the case of the present work.
LCT technique was used by Tan et al. [33] to study horizontal proper motions in the penumbra of a rapidly rotating -sunspot using Hinode G-band images with 2 min cadence. They used the Stokes V observations (Fe I at 630.2 nm: from Hinode Narrowband Filter Imager) to distinguish the proper motions of positive and negative magnetic elements in the shear flow region along the magnetic neutral line in the penumbra. They discussed that the variations of the penumbral intensity and penumbral flow (mean speeds temporally and spatially varied from 0.6 to 1.1 km/s within the penumbral decay areas) were associated with the CME/flare eruptions. Especially, they found that the magnitude of the shear flow apparently dropped down from 0.6 to 0.3 km/s in response to the magnetic energy release. They applied a time window of 20 min to average motions (see Sect. 2).
The motion of penumbral grains can affect directly on the LCT flow maps. It is useful to distinguish between penumbral grains located in the inner penumbra with lifetimes up to 3 h and penumbral grains located in the outer penumbra with lifetimes generally less than 1 h [34, 35, 36]. Moreover, the inner penumbral grains generally move radially inwards at an average speed of 0.3-0.7 km/s while the outer ones migrate both outwards and inwards at a higher speed of 0.4-0.9 km/s on average (e.g., [35, 36, 37] and their references).
2 Local Correlation Tracking Algorithm
The LCT algorithm which is the method used in the present work assumes that an “intensity pattern” is moved by the solar flow field [21, 25]. Then, horizontal flow field can be measured by finding the local correlation (called cross-correlation) of the contrast changes of intensity pattern in two successive sub-images (correlation windows) which are shifted with respect to each other. The shift which maximizes the defined cross-correlation is taken as the “true” displacement of the intensity structure.
Therefore, using the horizontal flow field (LCT flow maps), we can find and follow the dynamical structures of the flow. Also, downflows and upflows can be searched by finding convergence and divergence areas in LCT flow maps, and we can search for vortices as well by choosing suitable LCT free parameters.
Nevertheless, it should be noted that the displacements of an intensity pattern or a bright feature are not necessarily indicative of real plasma flows and may be due to heat diffusion, traveling waves or other effects leading to a misinterpretation. On the other hand, LCT does not distinguish between displacements of the bright and dark features. For example, Wang & Zirin [38] have reported the motion of dark fibrils towards the umbra in the inner part of a penumbra.
A detailed description of this algorithm (LCT) has been reviewed by, e.g., Švanda [39] and Verma & Denker [40]. The former author has processed MDI Dopplergrams measured in the Dynamics campaigns using the LCT algorithm.
Roudier et al. [41] have discussed and compared the two techniques of LCT and “feature tracking technique” for determination of horizontal flow field in the solar granulation. They suggested that the tracking of “coherent structures” in binary images gives more reliable results than using LCT of intensity pattern. This algorithm was developed by Rieutord et al. [42]. This algorithm needs the possibility of selecting specific structures (e.g. granules, magnetic bright points, penumbral grains, and umbral dots) in a sequence of images. However, the image processing steps identifying desired features rely on prior knowledge about them.
On the other hand, in LCT technique the choice of tracking parameters such as the size of the correlation window which smoothes the flows and is related to the spatial resolution of observation, the time cadence (lag) which defines a detectable minimum/maximum speed, and the time window over which a flow map is averaged can significantly affect the result.
However, Verma & Denker [40] have discussed the optimization and justifying the tracking parameters for LCT in time-series of G-band images obtained by Hinode/SOT with spatial resolution of 0.11 arcsec/pixel: features with low displacement rates (speeds) cannot be accurately tracked if the cadence is not enough long, whereas in much longer cadences, features will evolve too much so that the algorithm might not recognize them anymore. Averaging over time scales significantly longer than the lifetime of individual features can smooth their evolutionary proper motions resulting in a ‘global” flow field in a sequence of images of granulation. They found that the LCT algorithm produces the best results for G-band images having a cadence of 60-90 s.
3 Data Set
We implemented LCT method to measure horizontal flow field using a time-series of broad-band images (blue continuum, 450.4 nm) obtained with the Solar Optical Telescope on board Hinode (SOT, [45, 46]). Data from space do not suffer the distortion effects of Earth’s turbulent atmosphere so that intensity features can be followed from image to image.
This data set was acquired from 13:07 to 13:55 UT on August 3, 2010 with a cadence of 60 s. This selected time-series contains 49 images with the size of pixels and spatial sampling of 0.11 arcsec/pixel. The spatial resolution of the observation in blue continuum is around 0.25 arcsec. The observations were centered on active region NOAA 11092 practically located at disk centre, at heliocentric coordinates N W. The active region has a sunspot with a regular magnetic field configuration and is classified as a -region with a very low activity.
To align the images, we divided the whole series into 7 subseries. Then, we calculated shifts between current images and a reference image by computing the linear correlation coefficient and using the properties of Fourier transforms only on the central part of the images (mostly umbra) containing pixels. These shifts are then applied in the subseries to align images with respect to the reference image with sub-pixel accuracy. Exactly after co-aligning each subseries, its last image was selected as the reference image for the alignment of the next subseries, except for the first subseries for which the first image was selected as the reference image.
4 Results
As mentioned before, the core of the LCT algorithm is the
cross-correlation function. We used the modified program
flowmaker.pro (implemented in IDL [47]) in which
we adopted the cross-correlation function as the sum of square of
the local intensity differences in two subsequent images computed
over a Gaussian-weighted correlation window with a FWHM of 1 arcsec
(equivalent to 9 pixels). The position of the maximum of the
cross-correlation values is calculated with sub-pixel accuracy by a
parabola fit to the neighboring pixels. The time lag between
correlated images is 60 s.
4.1 Flow Maps
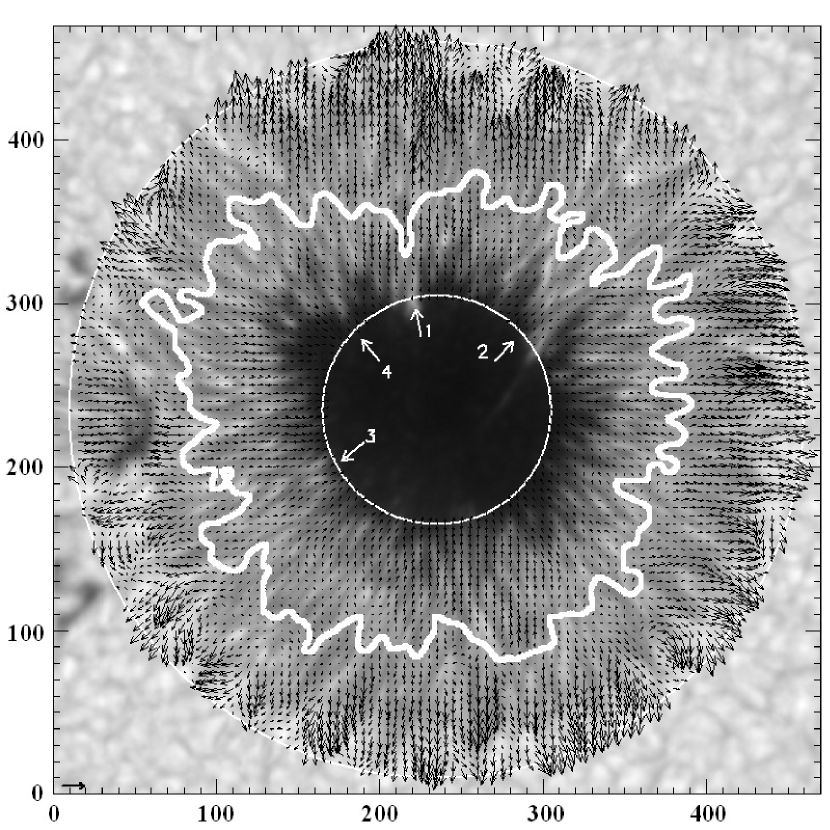
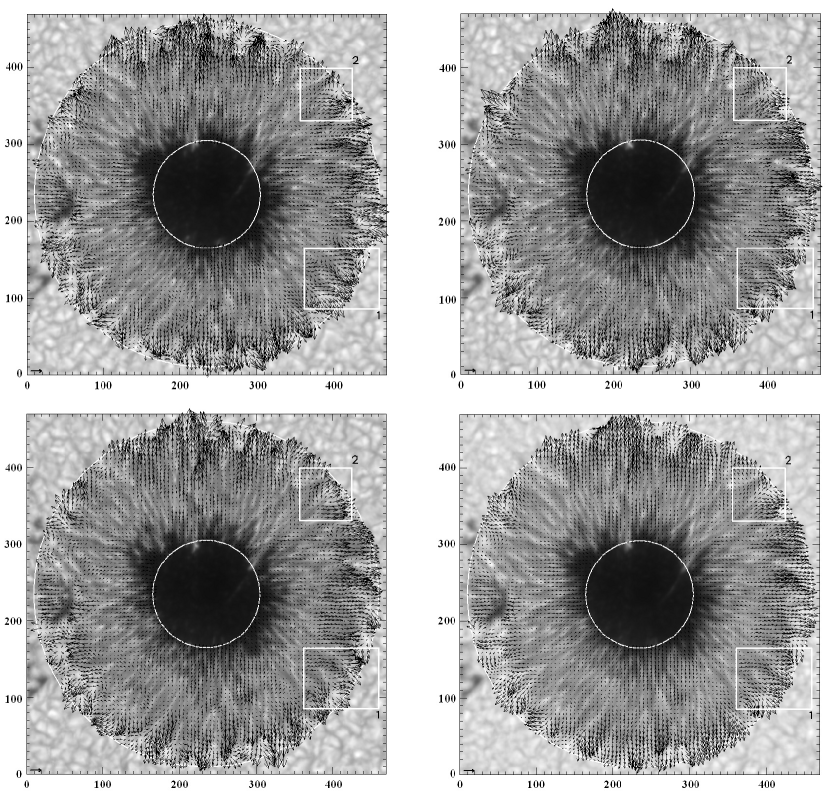
At first, we obtain the global flow field in the sunspot penumbra. Fig. 1 displays the calculated horizontal proper motions (vector flow field) averaged over the whole period of the time series, 48 min. The background of the vector flow field is the averaged intensity map in which stable dark and bright vena (filaments) are seen all over the penumbra. White circles are the defined inner and outer borders of the penumbra. These borders are defined so that two annular areas of 2-3 arcsec width of the umbra and the surrounding granulation are included in all flow maps. Also, we can see local phenomena in the vector flow field shown in Fig. 1, e.g. diverging/converging flow filaments in the outer penumbra and unidirectional inward and outward flows in the inner and outer penumbra, respectively, and more strongly at the periphery of the penumbra.
Our analysis confirms previous findings of radial proper motions and inward and outward flows which depend on the distance to the penumbral border: a slow flow (up to 0.7 km/s with an average of 0.2 km/s) is starting at the middle of the penumbra towards the umbra (inward motion) and a fast flow (up to 2.0 km/s with an average of 0.5 km/s) towards the outer penumbra boundary (outward motion). This diverging motion defines a divergence line approximately in the middle of the penumbra, in accordance with [20, 30, 32]. This divergence line is displayed in Fig. 1 as a white contour overlaid the mean vector flow field separating the areas with inward motions from those with outward motions. The distorted area at the left side of the penumbra was excluded. Also, Sobotka et al. [35] have found a divergence line in the penumbra when they studied the proper motions of penumbral grains using feature tracking technique.
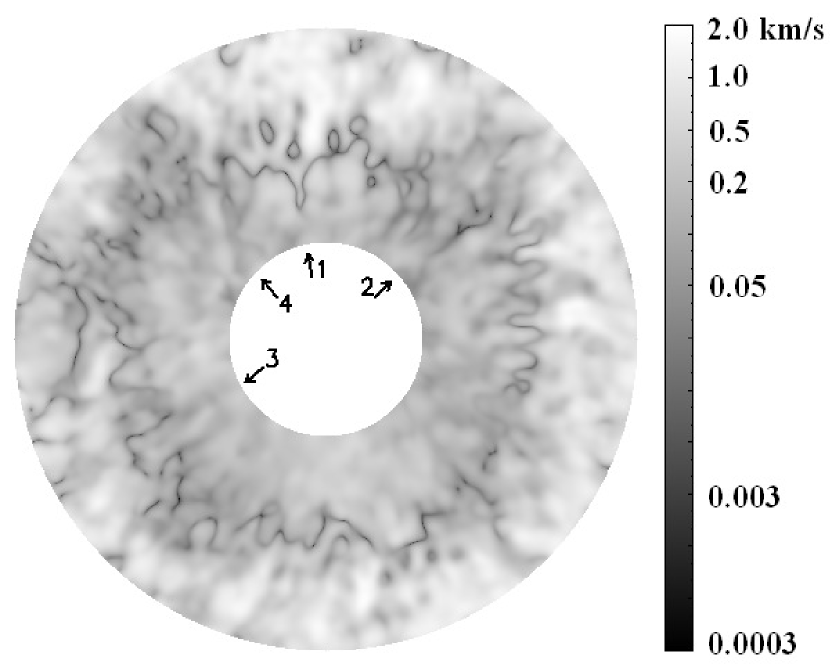
Fig. 2 shows the speed map displaying the magnitude of the vector flow field in logarithmic scale. The precision of the speeds can be estimated to be less than 0.03 km/s, if we compare the two speed maps obtained from two 48-frames time series which are shifted only one frame (the first 48 subsequent images and the sequence of images of ). If the speed map is calculated using a wider correlation window, the obtained proper motions (speeds) become slower with more smooth pathways (not shown here).
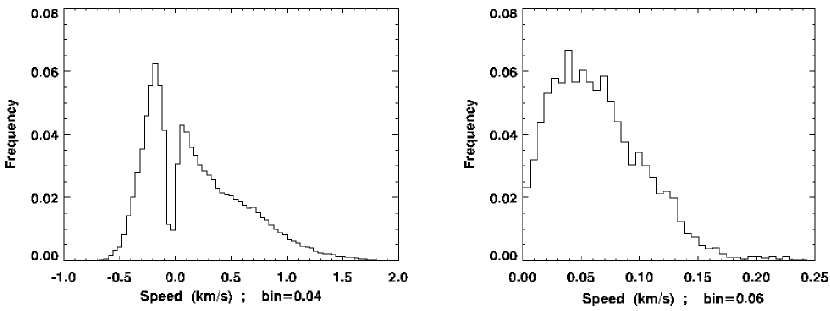
The histogram of speeds in inner (negative values; inward) and outer (positive values; outward) penumbra is shown in the left panel in Fig. 3. We can see that the penumbra shows an active kinematics in the LCT map, because of its low population at zero speed. This speed distribution is similar to the histogram of inward and outward speeds obtained by Molowny-Horas [30].
A ringlike feature with very slow flows ( m/s in average; zero-flow ring: ZFR) is clearly evident in the middle of the penumbra on the speed map in logarithmic scale in which this ring has the best contrast. Since the LCT algorithm makes a smoothed average of proper motions in a relatively wide correlation window, at the position of the divergence line, the proper motions in opposite directions cancel out each other. Therefore, we find a ZFR on the speed map that must be co-spatial with the divergence line. The right panel in Fig. 3 shows the histogram of speeds on the divergence line. However, the ZFR is not a smoothed/continuous circle likely due to the different evolutionary proper motions of penumbral filaments (see Sect. 4.3). Especially, a wide discontinuity and a considerable displacement of the ZFR towards the umbra are evident in regions where coordinated penumbral filaments are deeply intruding into the umbra. In Figs. 1 & 2, arrows 1 & 2 show examples of the displacement of the ZFR and its discontinuity in the studied penumbra, respectively.
Discontinuities in the ZFR means that there is no “zero” (very small) speed there, although we can find a divergence line in those areas. The averaged speed along the divergence line at the positions of discontinuities is about 150 m/s which is about three times the averaged speed in other positions of the divergence line, see the speed distribution on the divergence line shown in right panel in Fig. 3.
4.2 Radial Variations
Although the spot is circular, the flow field does not have a circular symmetry and behaves differently in different azimuthal directions (non-isotropic). However, we compute the azimuthal averages of speed and brightness as a function of radius in the penumbra. Fig. 4 displays the variation of these two quantities versus normalized distance from the sunspot centre. The radial position of the averaged ZFR (: its averaged radius) is in agreement with the averaged radius of the divergence line obtained by others, e.g. see [32] and the references therein.
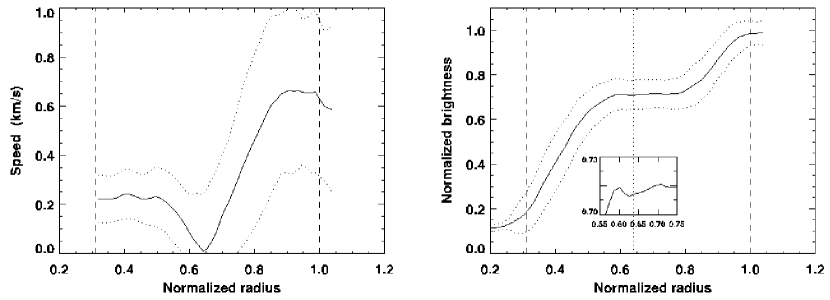
The right panel in Fig. 4 shows a wide plateau region in the radial profile of the normalized intensity of the studied penumbra at around 0.7 from 0.6 to which is consistent with the findings of Westendorp Plaza et al. [48].
Also, a weak bright ring with a low contrast of 1% can be seen in the radial intensity profile at around , similar to as reported in [48]. The inset in the right panel of Fig. 4 shows the magnified intensity profile around the weak bright ring.
We did not find any considerable correlations between intensity and inward/outward speed.
4.3 Time Evolution
The whole time interval (48 min) is now split in three windows of 16 min resulting in three consecutive sequences which are used to determine three new vector flow fields choosing a Gaussian-weighted correlation window with a FWHM of 1 arcsec. The results are shown in Fig. 5. Also, the average of these three vector flow fields is illustrated in Fig. 5, lower-right map, and should be similar to the one in Fig. 1. The precision of the speeds is estimated to be 0.08 km/s. These three subsequent maps show slow flows up to 0.85, 0.85 and 1.0 km/s, respectively, with an average of 0.2 km/s in the inner penumbra. However, in the outer penumbra, the flows reach the maxima of 2.4, 2.7 and 3.0 km/s in the subsequent maps, respectively, with the same mean speed of about 0.4 km/s. The temporal changes of speeds as well as directions of proper motions are seen all over the penumbra, especially at the periphery of the penumbra.
4.3.1 Evolving Filamentary Flows at outer penumbra
As mentioned before, despite of the circular shape of the sunspot, the vector proper motions are not isotropic in three successive maps displayed in Fig. 5. At the outer penumbra, the proper motions tend to diverge along filamentary structures with outward motions, resulting in adjacent convergent filamentary structures as well [31, 32], resembling roll convection [49] while inner penumbra does not display this behavior, probably because of the dominant radial migration of penumbral grains, if there exists.
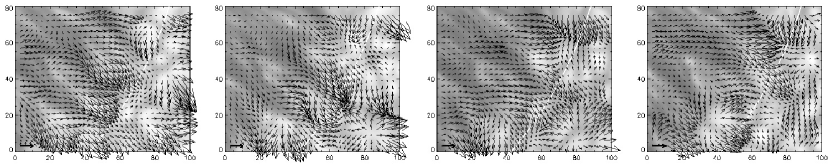
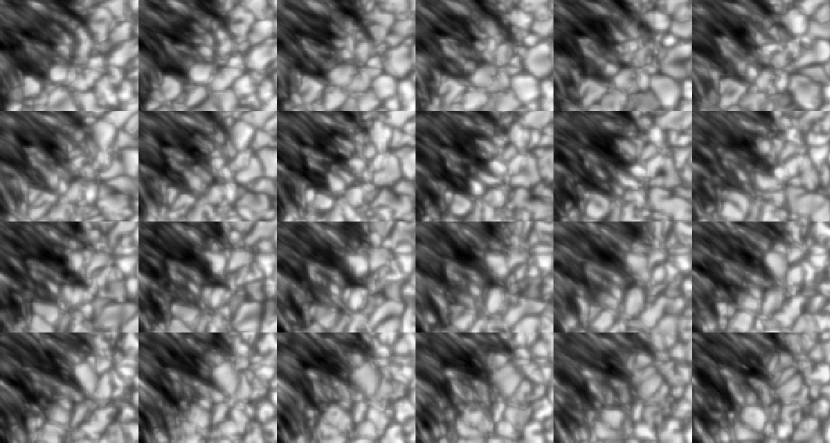
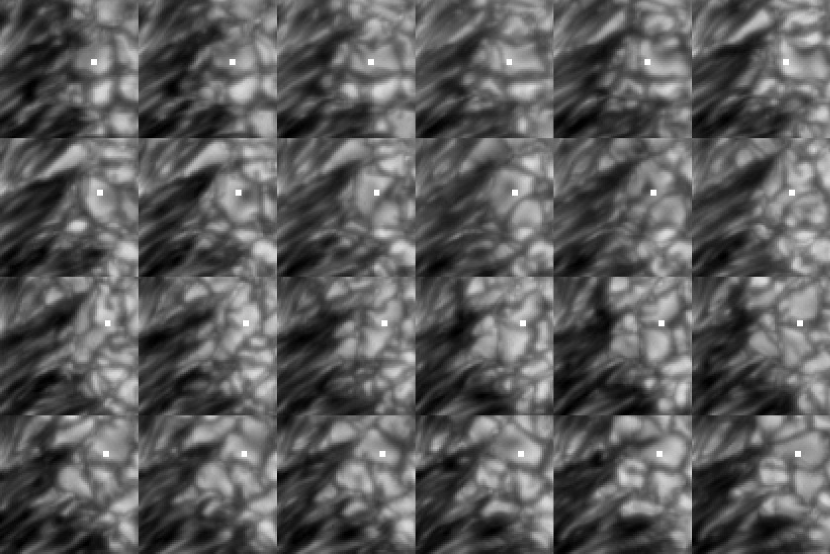
For a detailed study, four successive vector flow fields of the lower-right portion of the outer penumbra (the box 1 in Fig. 5) are displayed in Fig. 7. These maps are focusing on a converging filamentary flow (caused by two adjacent diverging flows) at the outer penumbra which develops along the diagonal of the map. Fig. 7 shows the corresponding successive intensity images with a 2 min lag illustrating the evolution of the brightness structure of the region. Each row, from top to bottom, corresponds to each map in Fig. 7, from left to right, respectively.
Comparing Figs. 7 & 7, we can see that the converging filamentary flow occurs in a dark radial channel and the diverging flows are formed by the evolution of thin bight fibrils. Also, the large speeds at the penumbra boundary are produced by the displacement and/or the fragmentation of the bright fibrils. It seems that these fast proper motions are sharply interrupted (see the centre of the first map in Fig. 7) by emerging a divergence center that is related to a multi-sector granule (see intensity images in Fig. 7) forming a sink/convergence point in between (lower-right corner of the second and third map in Fig. 7). This behavior is repeated in the forth map in Fig. 7 when two new divergence centers evolve. Also, it seems that the evolution and fragmentation of bright fibrils are closely related to the formation and evolution of the multi-sector granules connected to them. A multi-sector granule is the expanding and splitting granule producing a strong divergence center, so-called “Rosetta” by Sobotka et al. [43], in LCT maps which can be a member of a “Tree of Fragmenting Granules” or simply of a “family of granules” reported by Roudier et al. ([50] and references therein) and Bonet et al. [28], respectively.
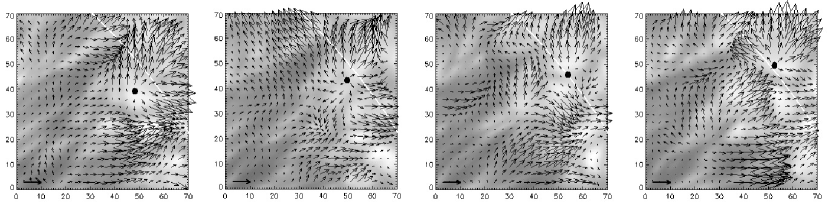
Similar to Fig. 7 but for the upper-right portion of the penumbra (box 2 in Fig. 5), four successive vector flow maps focusing on a divergence center at the periphery of the penumbra are shown in Fig. 9 in which the divergence center is marked by a black dot. Fig. 9 shows the corresponding successive intensity images in which the white dots mark the divergence center. A multi-sector granule is emerged and the connected bright fibrils grow and produce a strong radial flow. It is evident that the divergence center is not co-spatial with the center of the developing multi-sector granule in the intensity images. These maps illustrate how a divergence center is pushed away with a mean speed of 0.6 km/s by the development of a diverging filamentary flow produced by the evolution of a few long bright fibrils (see Fig. 9, especially the third row). Other examples of this behavior can be seen around the penumbra.
4.3.2 Zero-Flow Ring
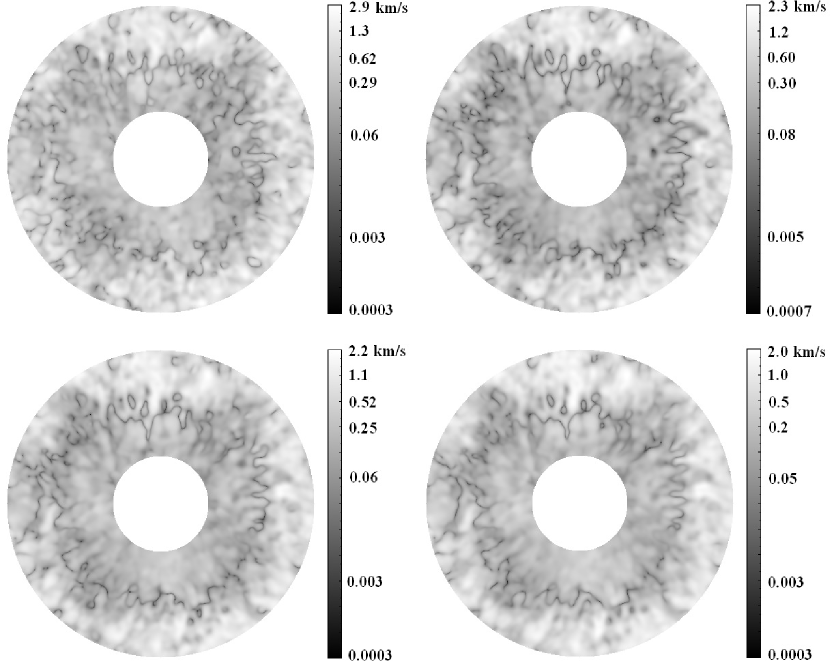
To investigate the changes of ZFR as well as the divergence line in time, we compute the maps of the speed of proper motions using the first 12 min, then the first 24 min, and finally the first 36 min and compare them with each other, and with the map of the speed of the whole (48 min) time series shown in Fig. 2. These four maps are illustrated in Fig. 10. These four maps show slow flows with averaged speeds of 0.24, 0.20, 0.19 and 0.19 km/s in the inner penumbra, respectively. However, in the outer penumbra, the averaged speeds of the flows reach 0.45, 0.40, 0.38 and 0.37 km/s in the maps, respectively. The smoothed speed obtained in a flow map depends on the length of the time series over which the LCT is applied. This is the reason that LCT algorithm gives smaller speeds when applied over the whole time series. However, the averaged speeds reach a convergent value during 48 min averaging.
It is evident in Fig.10 that while a longer time series of images is used (many subsequent images are included) to compute the speed of proper motions, the ZFR establishes its shape: the ZFR of this sunspot penumbra, with a low activity level, shows stable backward/forward displacements [32] or discontinuities along itself during the 48 min observation.
We make a visual inspection on the evolution of penumbral filaments to find out a possible relation between significant elongating displacements of ZFR or its discontinuities and the intruding filaments into umbra (compare the backgrounds in Fig. 5 with the shape of ZFR in Fig. 2). However, in agreement with Denker et al. [32], in one case the ZFR co-spatial with the divergence line moves (is carried) toward umbra where coordinated penumbral filaments intrude deeply into umbra, arrow 1 in Figs. 1 & 2. They have discussed that this is the imprint of the cluster of extremely bright penumbral grains (with a contrast in excess of 1.8 times the quiet Sun intensity) on the penumbral flow field so that their speeds were significantly increased in excess of 2 km/s. The applied time window and correlation window in the LCT map of Denker et al. [32] were, respectively, 30 min and arcsec2 contained a Gaussian weighting function with a FWHM of 0.5 arcsec.
On the other hand, during some deeply intrusion, the ZFR is “ruptured” or distorted (see Fig. 2, arrows 2 & 4), while the divergence line moves outward in this case (see Fig. 1; arrows 2 & 4). Also, in some cases, e.g. indicated by arrow 3 in Figs. 1 & 2, while penumbral filaments are intruding into umbra, neither the divergence line moves inward nor a discontinuity forms along the ZFR.
5 Discussion and Conclusion
Based on horizontal proper motions obtained from LCT, we confirm the existence of a divergence line at the middle of penumbra () dividing inward motions in inner penumbra from outward motions in outer penumbra (see e.g., [32, 35]). The displacement of the divergence line towards umbra was reported by Denker et al. [32]. They suggested that a tight cluster of extremely bright penumbral grains is the cause of this displacement where the speed of flow field significantly increases. Our studied penumbra shows an exception indicated by arrow 3 in Figs. 1 & 2.
Whereas the divergence line is continuous, a distorted ringlike feature with very slow speeds ( m/s; ZFR) co-spatial with the divergence line, is seen in penumbra. A few regions of the penumbra show deeply intrusion of coordinated penumbral filaments. The ZFR at some regions shows discontinuities showing relatively considerable speeds of about 150 m/s there. In these regions, the divergence line is not displaced toward umbra (arrows 2 & 4 in Fig. 1). In accordance to Denker et al. [32], in one case a considerable displacement of the ZFR co-spatial with the divergence line towards the umbra is seen. Also, stable local backward/forward shifts of ZFR are probably related to the different evolutionary proper motions of adjacent penumbral vena (filaments). We must mention that the different suitable values of FWHM do not significantly affect the shape of the ZFR.
Bellot Rubio [52] has defined the position at around penumbral radii as the transition between inner and outer penumbra where the azimuthal averages of atmospheric parameters, e.g. magnetic field inclination and filed strength undergo significant changes. He has concluded that this behavior can suggest the region at around 0.7 penumbral radii is the position where a new family of penumbral flux tubes carrying the Evershed flow emerges (see also [48, 51, 53, 54]).
On the other hand, Borrero & Ichimoto [4] have discussed about two distinct regions with two different magnetic structures in a sunspot penumbra. A region corresponds to the inner part of the penumbra, including the umbra , where the total magnetic field strength decreases from the deep photosphere upwards and the inclination of the magnetic field vector remains constant with height. In the outer part, , the situation, however, reverses. The total magnetic field strength, as well as the vertical and horizontal components of the magnetic field, increases from the deep photosphere to the higher photosphere. In this region, the inclination of the magnetic field vector decreases towards the higher photospheric layers (see also [48]). Also, they have investigated the variation of the azimuthally averaged plasma- (the ratio of gas pressure to magnetic pressure) as a function of the normalized radial distance in the sunspot. At continuum level, they have obtained in the inner part of the sunspot. However, increases from middle of penumbra outwards () and the magnetic field becomes highly non-potential where the dynamics of the outer penumbra are strongly dominated by the plasma motions. Therefore, it is not unlikely that the formation of ZFR (or divergence line) is related to the existence of the two different magnetic structures in a sunspot penumbra as discussed by, e.g. Bellot Rubio [52] or Borrero & Ichimoto [4].
On the other hand, Liu Yang et al. [55] have carried out a comparison between photospheric flows and subphotospheric flows inside active regions. The photospheric flow field was obtained from differential affine velocity estimator for vector magnetograms [56] using the data of HMI observed vector magnetograms. The subphotospheric flow field in a shallow depth down to 1 Mm was inferred from time-distance analysis using the HMI observed Doppergrams. In their work, a mature and simple active region (NOAA 11084) without significant flaring activities shows inward and outward flows in both photospheric and subphotospheric layers of the sunspot. Separation of the inward- and outward-flows (divergence line) takes place in the sunspot penumbra. However, the divergence lines are different in these two layers: the area having inward subphotospheric flow was larger than that in the photosphere. Also, they concluded that the horizontal flows caused by flux emergence do not extend deeply into the subsurface.
Also, similar to the findings of Westendorp Plaza et al. [48], in the radial intensity profile of the studied penumbra displayed in Fig. 4, we find a weak bright ring close to the ZFR () and a wide plateau region from 0.6 to . On the other hand, Rempel [57] has presented a series of numerical sunspot models in which they studied the dependence of the resulting sunspots on the magnetic top boundary condition and grid resolution by keeping initial condition fixed. In their work, only the simulated sunspots with higher resolutions show the formation of a plateau like feature at normalized intensity around 0.7 in the intensity map of the inner penumbra at around . However, the average of umbral intensity is about half of the umbral intensity of their simulated sunspots.
The diverging filamentary flows with outward motions in outer penumbra (Fig. 5) are consistent to the behavior of the penumbral filaments simulated by Rempel [57]. The top view of the penumbral filaments in his numerical simulations shows a central upflows with adjacent lateral downflows (see also [49]). While plasma is moving outward (Evershed flow), it moves to the edges of the filaments where it turns back into the photosphere, i.e. individual flow elements consist of both a radial outflow and lateral overturning motions.
The proper motions around the sunspot obtained by selecting high resolution integration parameters in LCT (1 arcsec and 12 min; Figs. 7 & 7) can be understood by combination in a vector summation of two components, as described in [28]: both mesogranular/convective flows producing divergence centers, and a large-scale flow driving the divergence centers.
However, as described in Sect. 4.3.1, at the near vicinity of the penumbra, in surrounding granulation some divergence centers are strongly pushed away as a whole with an average speed of about 0.6 km/s by a developing filamentary flow so that, after a while, we observe only a locally outward flow on those already-diverging centers (compare the second map in Fig. 9 with the third and fourth maps). In other words, in a vector summation the filamentary flow cancels out the component of the diverging flow on the penumbral side of a divergence center and increases its opposite component. Similar phenomenon has been reported in [20] where the moat flow component affects convective granular velocities around a pore located far from solar disc center (). However, Bonet et al. [28] have reported only elongated divergence centers (mesogranules as called by them) whose diverging speeds away from the sunspot are higher than those directed towards the sunspot. At present, we could not conclude if there is any relation between the mentioned large-scale flow and the evolving filamentary flows in outer penumbra.
At the outer penumbra, the converging filamentary flow occurs in a dark radial channel and the diverging flows are formed by the evolution of thin bight fibrils. Also, the large speeds at the penumbra boundary are produced by the displacement and/or the fragmentation of the bright fibrils. Furthermore, it seems that the evolution and fragmentation of bright fibrils are closely related to the formation and evolution of the multi-sector granules connected to them in their near surrounding granulation.
Acknowledgment
Hinode is a Japanese mission developed and launched by ISAS/JAXA, collaborating with NAOJ as a domestic partner, NASA and STFC (UK) as international partners. Scientific operation of the Hinode mission is conducted by the Hinode science team organized at ISAS/JAXA. This team mainly consists of scientists from institutes in the partner countries. Support for the post-launch operation is provided by JAXA and NAOJ (Japan), STFC (UK), NASA, ESA, and NSC (Norway). The author would also like to thank M. Sobotka and the referee for suggestions that improved the paper.
References
- [1] Evershed, J., 1909, MNRAS 69, 454
- [2] Title A.M., et al., 1993, ApJ 403, 780
- [3] Leka K.D., Skumanich A., 1998, ApJ 507, 454
- [4] Borrero J.M., Ichimoto K., 2011, Living Rev. Solar Phys., 8, lrsp-2011-4
- [5] Scharmer G.B., et al., 2002, Nature 420, 151
- [6] Bellot Rubio L.R., et al., 2005, A&A 443, L7
- [7] Bellot Rubio L.R., et al., 2007, ApJ 668, L91
- [8] Langhans K., et al., 2007, A&A 464, 763
- [9] Meyer F., Schmidt H.U., 1968, Mitteilungen der Astronomischen Gesellschaft Hamburg 25, 194
- [10] Montesinos B., Thomas J.H., 1993, ApJ 402, 314
- [11] Montesinos B., Thomas J.H., 1997, Nature 390, 485
- [12] Borrero J.M., et al., 2005, A&A 436, 333
- [13] Schlichenmaier R., et al., 1998, A&A 337, 897
- [14] Schlichenmaier R., et al., 1998, ApJ 493, L121
- [15] Schlichenmaier R., 2002, AN 323, 303
- [16] Solanki S.K., Montavon C.A.P., 1993, A&A 275, 283
- [17] Thomas J.H., Weiss N.O. (Eds.), 1992, Sunspots: Theory and observations, Proceedings of the NATO Advanced Research Workshop on The Theory of Sunspots, Cambridge, U.K., 1991, vol. 375 of NATO Science Series C, Kluwer, Dordrecht
- [18] Scharmer G.B., Spruit H.C., 2006, A&A 460, 605
- [19] Spruit H.C., Scharmer G.B., 2006, A&A 447, 343
- [20] Deng N., et al., 2007, ApJ 671, 1013
- [21] November L.J., Simon G.W., 1988, ApJ 333, 427
- [22] Tkaczuk R., et al., 2007, A&A 471, 695
- [23] Hamedivafa H., 2011, Solar Phys. 270, 75
- [24] Brandt P.N., et al., 1988, Nature 335, 238
- [25] November L.J., 1989, In: Von der Luhe O. (ed.), High Spatial Resolution Solar Observations, p. 457
- [26] Wang Y., et al., 1995, AJ 447, 419
- [27] Roudier Th., et al., 1998, A&A 330, 1136
- [28] Bonet J.A., et al., 2005, A&A 430, 1089
- [29] Sobotka M., Roudier Th., 2007, A&A 472, 277
- [30] Molowny-Horas R., 1994, Solar Phys. 154, 29
- [31] Márquez I., et al., 2006, ApJ 638, 553
- [32] Denker C., et al., 2008, AN 329, No. 8, 773
- [33] Tan C., et al., 2009, ApJ 690, 1820
- [34] Muller R., 1973, Solar Phys. 29, 55
- [35] Sobotka M., et al., 1999, A&A 348, 621
- [36] Zhang Y., Ichimoto K., 2013, A&A 560, 77
- [37] Sobotka M., Sütterlin P., 2001, A&A, 380, 714
- [38] Wang H., Zirin, H., 1992, Solar Phys., 140, 41
- [39] Švanda, M., 2007, Velocity Fields in the Solar Photosphere, Ph.D. Thesis, arXiv0712.1958S
- [40] Verma M., Denker, C., 2011, A&A 529,153
- [41] Roudier Th., et al., 1999, A&A 349, 301
- [42] Rieutord M., et al., 2007, A&A 471, 687
- [43] Sobotka M., et al., 1999, ApJ 511, 436
- [44] Rieutord M., et al., 2001, A&A 377, L14
- [45] Tsuneta S., et al., 2008, Solar Phys. 249, 167
- [46] Suematsu Y., et al., 2008, Solar Phys. 249, 197
- [47] Molowny-Horas R., Yi Z., 1994, ITA (Oslo) Internal Report No. 31
- [48] Westendorp Plaza C., et al., 2001, ApJ 547, 1130
- [49] Zakharov V., et al., 2008, A&A 488, L17
- [50] Roudier Th., et al., 2003, A&A 409, 299
- [51] Bellot Rubio L.R., et al., 2003, A&A 403, L47
- [52] Bellot Rubio L.R., 2003, in Third International Workshop on Solar Polarization, Trujillo Bueno J., Sánchez Almeida J. (Eds.), ASP Conf. Ser. 307, 301
- [53] Bellot Rubio L.R., et al., 2006, A&A 453, 1117
- [54] Tritschler A, et al., 2004, A&A 415, 717
- [55] Liu Yang, et al., 2013, Solar Phys. 287, 279
- [56] Schuck P.W., 2008, ApJ 683, 1134
- [57] Rempel M., 2012, ApJ 750, 62