Investigating the Origin of the Absorption-Line Variability in Narrow-Line Seyfert 1 Galaxy WPVS 007
Abstract
Broad Absorption Line Quasars (BALQs) are actively accreting supermassive black holes that have strong outflows characterized by broad absorption lines in their rest-UV spectra. Variability in these absorption lines occurs over months to years depending on the source. WPVS 007, a low-redshift, low-luminosity Narrow-line Seyfert 1 (NLS1) shows strong variability over shorter timescales, providing a unique opportunity to study the driving mechanism behind this variability that may mimic longer scale variability in much more massive quasars. We present the first variability study using the spectral synthesis code SimBAL, which provides velocity-resolved changes in physical conditions of the gas using constraints from multiple absorption lines. Overall, we find WPVS 007 to have a highly ionized outflow with a large mass-loss rate and kinetic luminosity. We determine the primary cause of the absorption-line variability in WPVS 007 to be a change in covering fraction of the continuum by the outflow. This study is the first SimBAL analysis where multiple epochs of observation were fit simultaneously, demonstrating the ability of SimBAL to use the time-domain as an additional constraint in spectral models.
1 Introduction
Broad Absorption Line Quasars (BALQs) are the subset of quasars that have wide, blue-shifted absorption lines in their rest-UV spectra indicative of energetic outflows that can reach velocities of 0.1c (e.g., Weymann et al., 1991). BALQs make up roughly 20% of the optically selected quasar population (Hewett & Foltz, 2003) and may impact the evolution of the host galaxy if their kinetic energies exceed 0.5–5% of their rest-mass energy (e.g., Hopkins & Elvis, 2010). Furthermore, BALQs may act to limit the growth of the central supermassive black hole by slowing accretion (e.g., Di Matteo et al., 2005).
Little is still known about how these outflows start and evolve, and the geometry of the outflow is poorly constrained as these sources are not spatially resolved. Studying the changes in outflow spectral signatures over time offers one method to map the outflow, for example by providing constraints on properties such as location of the outflow (e.g., McGraw et al., 2017) and density of the gas (e.g., Hamann et al., 1997) by making inferences about the cause of the variability. With the advent of new large quasar surveys there are multi-epoch observations available for many BALQs. These multi-epoch observations have shown (in some cases dramatic) variability of absorption-line structure. As different outflow velocities (with small velocities corresponding to small blueshifts from the central emission-line wavelength) could very well represent distinct locations within the wind, the rate and nature of variations can inform a picture of the geometry of the quasar wind and its driving mechanism, both of which are still poorly understood.
Broad quasar absorption lines frequently exhibit significant variation over rest-frame timescales from a few months (e.g., Capellupo et al., 2013) to a few years (e.g., Gibson et al., 2008). Some absorption lines have even completely disappeared over observations spanning a few years (e.g., Filiz Ak et al., 2012); the causes of such substantial changes in the spectra are still uncertain. Generally, the cause of variability has been attributed to either a change in the ionization state of the gas from a change in the continuum (Barlow, 1993; Filiz Ak et al., 2014; Wang et al., 2015; Grier et al., 2015; Wildy et al., 2015; Rogerson et al., 2018; Hemler et al., 2019) or variation due to an absorber crossing transverse to our line of sight (Gibson et al., 2010; Hamann et al., 2008; Filiz Ak et al., 2012; Hall et al., 2011; Capellupo et al., 2013; McGraw et al., 2015, 2017; Vivek et al., 2012a, 2016). Some studies are unable to distinguish between the two scenarios or have found support for both scenarios (Foltz et al., 1987; Lundgren et al., 2007; Capellupo et al., 2012; Vivek et al., 2012b; Filiz Ak et al., 2012; Vivek et al., 2014, 2018). To date, quantitative studies of variability have primarily relied on tracking changes in absorption-line equivalent widths (EWs) to determine the cause of the variability (e.g., Filiz Ak et al., 2012; Capellupo et al., 2013), and the distribution of as a function of time can be used to obtain crude estimates of the physical conditions of the gas.
These large-scale empirical studies have shown that higher-velocity components of BALs are more likely to vary than the low-velocity end of the absorption line (e.g., Lundgren et al., 2007; Capellupo et al., 2011; Filiz Ak et al., 2012), and BALs with lower equivalent widths are more likely to vary (e.g., Barlow, 1993; Lundgren et al., 2007). Furthermore, BALs do not typically vary uniformly as a function of velocity (Capellupo et al., 2012) and some lines (such as Si IV ) are more likely to vary than others (e.g., C IV ; Capellupo et al. 2013).
With multiple epochs of observation, the nature of the absorption-line variability of a source can be used to estimate a lower limit on the density of the gas (and consequently an upper limit on the radius) under the assumption that the cause of the change is due to a change in the ionization state of the gas (e.g., Barlow, 1993; Filiz Ak et al., 2013). Alternately, if the cause of the change is due to an absorber moving across the observer’s line-of-sight to the illuminating continuum, the radius of the outflow may be estimated from the crossing speed of the gas (e.g., Capellupo et al., 2011). Overall, the observations of variable absorption lines build up a dynamic picture of a wind that could either be reacting to changes in the ionizing spectral energy distribution resulting in changes in ionization parameter of the gas, or a cloud-crossing (eclipse) scenario where we see the depth of absorption lines change based on the gas column density and/or the fraction of the emitting source that is covered by the BAL gas.
Currently missing from the ensemble of variability studies in the literature is a detailed study of the changing physical conditions of BAL features from multiple ions considered together with simultaneous UV photometry to provide a critical link between observed changes in the UV spectrum of a source and a change in the absorbing gas properties. Such a study has been difficult to perform for many BALQs because this would typically require broad wavelength coverage and BALs that are not blended in order to use template-fitting methods to extract the physical parameters. However, with the development of the novel spectral synthesis code SimBAL (Leighly et al., 2018), we are able to use a forward modelling and spectral synthesis approach to spectral fitting, which allows the study of physical parameters for multiple blended lines simultaneously. The functionality of SimBAL also allows physical parameters to be fit as a function of velocity, so that variation in the BAL can be studied as a function of ion species, epoch, and velocity.
An excellent choice for a case study as described above is WPVS 007, a Narrow-line Seyfert 1 (NLS1) galaxy at redshift 0.02861 (NASA/IPAC Extragalactic Database redshift value) with a small black hole mass (; Leighly et al. 2009) and low luminosity (; Leighly et al. 2015) that is behaving like a BALQ with a high-velocity outflow. Low-luminosity AGN with smaller black hole masses and size scales will show variability on smaller timescales than the much larger BALQs making a rare low-redshift source like WPVS 007 an excellent laboratory to study variability in broad absorption line quasars. WPVS 007 has a high velocity for its luminosity, making it an outlier for the velocity-luminosity relationship found by Laor & Brandt (2002) for low-redshift, soft X-ray weak quasars (see Figure 13 and related discussion in Leighly et al., 2009).
When WPVS 007 was first detected in the ROSAT All Sky Survey (Voges et al., 1999), it showed the softest x-ray spectrum ever observed in an AGN (Grupe et al., 1995). Subsequent observations (including a Swift monitoring campaign from 2005 and continuing today) have also found the object to be X-ray-weak most of the time (Grupe et al., 2007, 2008; Komossa et al., 2017). It is not visible in X-rays in a single Swift observation and requires merging many observations in order to obtain a detection. A 1996 HST UV spectrum showed only a mini-BAL (typical mini-BALs have FWHM greater than 200–300 but less than 2000 ; Hamann & Sabra 2004); subsequently, a 2003 FUSE UV spectrum revealed the development of broad absorption lines ( and FWHM ; Leighly et al. 2009) in addition to the low-velocity mini-BALs ( and FWHM ; Leighly et al. 2009). Further UV spectroscopy with HST in 2013 indicated large variability in the broad absorption lines over short periods (e.g., Grupe et al., 2013; Leighly et al., 2015). Swift monitoring shows that WPVS 007 became fainter in UV (across Swift bands including U, V, B, UVW1, UVW2, and UVM2) from 2010 until 2015, reaching its faintest magnitude in February and March in 2015 before brightening again in 2017. These changes were determined to be an occultation event by Leighly et al. (2015) when the analysis of the photometry showed that the occultation dynamical timescale, the BAL variability timescale, and the density of the BAL gas taken together are consistent with the reddening material and the broad-absorption line gas originating in the torus.
More recently, Li et al. (2019) presented a detailed comparison of WISE mid-infrared photometry and the UV photometry from Swift. They attribute the variations in both data sets to changes in the accretion-disk luminosity and note that the brightness changes seen by WISE lag behind those seen in Swift by roughly 600 days as expected from the physical size of the UV and mid-infrared emitting regions at their respective wavelengths. They further propose that the strengthening and emergence of high-velocity absorption from the Si IV and C IV BALs are caused by an increase in the brightness of the ionizing continuum.
Our objective in this paper is to use the body of evidence in multiple epochs of UV spectroscopy to re-evaluate the cause of the BAL variability, taking into account velocity-resolved information. In §2, we present the five HST COS observations used in our analysis. The process used for fitting the continuum, emission-line and absorption-line features using Sherpa (Freeman et al., 2001) and SimBAL is described in §3. The results from the fitting and the primary physical driver of the observed variability in the absorption lines of WPVS 007 are given in §4. This section includes the best-fitting values of the physical parameters (ionization parameter, density, partial-covering parameter, and scaled column density). Derived parameters including column density, radial distance to the outflow, mass-outflow rate, and kinetic luminosity are given in §5. Lastly, in §6, we revisit the Li et al. (2019) conclusions and present our interpretation of the cause of the outflow variability from the results of our analysis. Throughout this paper, we adopt a flat universe cosmology with , , and (Planck Collaboration et al., 2020).
2 Observations and Data
This work primarily uses UV spectroscopy to investigate the underlying causes behind the clear changes in absorption-line structure of WPVS 007 over 7 years in the observed frame. The interpretation of these changes is aided by the consideration of the continuum changes probed by extensive UV and optical Swift photometry. WPVS 007 has been regularly monitored with Swift from 2005 to the present day. Further details of the UV spectral and UV and optical photometric observations are given below.
2.1 UV Spectral Observations
WPVS 007 has been observed with UV COS spectroscopy with HST five times. The details of the observations including instrument, grating, date, wavelength range, spectral resolution, exposure time, and S/N at 1450 Å are provided in Table 1. UV spectral observations with HST FOS in 1996 and FUSE in 2003 exist in the archive but were not included because they did not have comparable S/N (in the case of HST FOS) or wavelength range (in the case of FUSE) for a comparative analysis. Interestingly, there is no evidence for the UV BALs in 1996, though the narrow, low-velocity mini-BAL is still evident in the spectrum (Leighly et al., 2009).
| Instrument | Grating | Resolving | Observation | Spectral | Exposure | S/N |
|---|---|---|---|---|---|---|
| Power | Date | Coverage (Å) | Time (s) | at 1450Å | ||
| COS | G140L | 1500-4000 | Jun 2010 | 1165.2–1138.9aaTwo ranges due to detector gap. | 5061 | 23.5 |
| 1230.2–2476.1 | ||||||
| COS | G140L | 1500-4000 | Jun 2013 | 1026.9–2496.4 | 4607 | 29.1 |
| COS | G140L | 1500-4000 | Dec 2013 | 1026.7–2496.1 | 4607 | 21.1 |
| COS | G140L | 1500-4000 | Mar 2015 | 1028.9–2338.8 | 5323 | 10.5 |
| COS | G140L | 1500-4000 | Mar 2017 | 1028.9–2338.7 | 5495 | 13.9 |
The final data products for all epochs were downloaded from the archive in January 2020 for analysis. No recalibration was necessary. Spectra were adjusted to rest-frame wavelengths using a redshift of 0.02861 adopting the NASA/IPAC Extragalactic Database redshift value.
The objective was to accurately model the shape of the available UV absorption lines in order to determine the physical properties of the outflow that cause them. Modelling required that features have sufficient S/N. We used the spectra in the 1065–1600 Å range to include the P V and the C iii* multiplet BALs at the blue end of the wavelength range and the C IV line at the red end of the wavelength range. The Ciii] complex at 1900 Å has low S/N, and so we did not include this in our analysis.
Strong geocoronal lines are present from 1173–1189 Å and from 1257–1273 Å. We masked these sections from the analysis. We identified possible Galactic absorption lines from C II and Si II. Candidate Galactic lines were identified as narrow absorption lines that showed no change in optical depth between epochs. The region around the C II line was masked in all epochs. We identified Galactic lines of Si II overlapping the C iii* trough, most obvious in the observation from 2015 when the C iii* BAL was weak. These lines are likely Si II and that have been shifted to 1157Å and 1161Å respectively. Because these latter features overlapped with BALs, we included them in the modeling rather than masking them out. There is a detector gap in the 2010 epoch from 1139Å-1230Å in the rest frame.
2.2 Swift Photometry
Swift has observed WPVS 007 since October 2005 typically with a cadence of once per week Grupe et al. (2013). Observations prior to April 2013 are listed in Grupe et al. (2008, 2013). The Swift X-ray telescope (XRT; Burrows et al., 2005) was operating in photon-counting mode (Hill et al., 2004) and the data were reduced by the task xrtpipeline version 0.12.6., which is included in the HEASOFT package. Source counts were selected in a circle with a radius of 24.8 and background counts in a nearby circular region with a radius of 247.5. Due to the extremely low X-ray count rate of WPVS 007 of about it cannot be detected in a single observation. A X-ray detection of WPVS 007 with Swift requires stacking the data of several years together. The UV-optical telescope (UVOT; Roming et al., 2005) data of each segment were coadded in each filter with the UVOT task uvotimsum. Source counts in all 6 UVOT filters were selected in a circle with a radius of 5 and background counts in a nearby source-free region with a radius of 20. UVOT magnitudes and fluxes were measured with the task uvotsource based on the most recent UVOT calibration as described in Poole et al. (2008) and Breeveld et al. (2010). The UVOT data were corrected for Galactic reddening (; Schlegel et al., 1998). The correction factor in each filter was calculated with equation (2) in Roming et al. (2009) who used the standard reddening correction curves by Cardelli et al. (1989). Due to new UVOT calibrations files it was necessary to re-analyze all previously published data.
We are providing updated photometry from continued Swift monitoring since April 2013 (Grupe et al., 2013). This observing campaign is the only regular monitoring of such an unusual low-luminosity source with a fully developed BAL. In Figure 1, we show the results of the Swift monitoring campaign carried out over a period of 16 years. The Swift UVOT fluxes were corrected for Galactic extinction. As shown in Leighly et al. (2015), the 2015 occultation event resulting in the near disappearance of the BAL shows a corresponding minimum in UV flux. The 2010 BAL was found when WPVS 007 was in a high state at the brightest magnitude.

Figure 2 shows the SED using observations taken near the time of HST COS spectral observations, and is an updated version of the left panel of Figure 2 from Leighly et al. (2015). Although the SED for 2010 (where the BAL was at maximum absorption) shows higher flux and 2015 (during the occultation event) shows reduced flux, the SEDs for December 2013 and 2017 with variable BALs are nearly identical. These observed changes are in contrast to the June 2013 and December 2013 epochs that show variation in the SED with almost no change in the BALs.

.
Figure 3 shows the evolution of WPVS 007 in UV color-magnitude space, an updated plot from Figure 1 in Leighly et al. (2015). There is a clear correlation between color and magnitude. The 2010 and 2015 observations were taken when WPVS 007 occupied 2 extremes in the color-magnitude diagram with the NLS1 appearing bluest in 2010 and reddest in 2015. The 2013 and 2017 colors are intermediate. In Figure 1 of Leighly et al. (2015), the authors showed that variable reddening is a better fit to the observed changes in color and brightness observed from the Swift photometry than intrinsic optical/UV spectral variability.

3 Spectral Modeling and Analysis
The spectra for each epoch were first fit using Sherpa for initial values of the continuum normalization and power-law indices, and the fluxes and FWHM values for the emission lines. These were then fed into SimBAL to enable fitting the absorption-line features for individual spectra. The absorption features in many cases overlap with the emission lines. Rather than mask out absorption features (with the exception of those mentioned in the previous section), absorption lines were fit with a series of Gaussians. We used a power law to model the continuum and a series of Lorentzian and Gaussian lines to model the emission lines. Based on prior experience, the UV resonance lines were initially modeled with two Lorentzian lines. As an exception, the Ly line was modeled with two Gaussian components, with one at Å and a blue Gaussian component with the position, FWHM, and flux freed. We included an additional Gaussian component to model a blue wing of C IV after finding that absorption models favored an additional emission component. Additionally, we included the spline fit model of weak Fe II lines at wavelengths greater than Å used in Leighly et al. (2015). The full continuum model used in the SimBAL analysis consists of a power-law component with the normalization and slope of the power law fit as parameters, the Fe II template used in Leighly et al. (2015), and the emission-line model described above.
A key factor to determine is whether the absorber covers the continuum and emission lines fully, partially, or not at all. The model that performed best in preliminary fits of the data was a model where the BAL does not cover the line-emitting region, but the mini-BAL covers both the line-emitting region and power-law continuum equally. This model indicates the presence of unabsorbed line emission through the BAL outflow. Other studies of BAL sources have found absorbers that do not fully cover the emission-line region (e.g., Arav et al., 1999; Borguet et al., 2012; Choi et al., 2022b).
3.1 SimBAL
SimBAL (Leighly et al., 2018) is a novel forward-modelling and spectral-synthesis software package that has been used to model quasars with broad overlapping absorption troughs, leading for example to the discovery of the most powerful quasar outflow to date (Choi et al., 2020). SimBAL uses grids of ion column density created using Cloudy (Ferland et al., 2017) to produce a synthetic spectrum from available atomic data and MCMC python package emcee (Foreman-Mackey et al., 2013) to step through the parameter grids.
To generate the synthetic spectrum at each step, SimBAL uses the ionization parameter, density, covering factor, and hydrogen column density. The column density is parameterized as ; here is the unitless ionization parameter defined as , where is the number of ionizing photons per second, is the distance of the BAL from the SMBH, is the hydrogen density and is the speed of light. Partial covering is now widely accepted as endemic for BAL absorption lines (e.g., Barlow & Sargent, 1997; Arav et al., 1999), and can manifest as non-black saturation of BALs. Often this absorption is modeled as a step-function in column density, where the absorber covers part of the continuum uniformly, but light from the remaining uncovered region comes through unobstructed. SimBAL uses a power-law partial-covering model (see de Kool et al., 2002; Arav et al., 2005; Sabra & Hamann, 2005; Leighly et al., 2019) where with as the projection of the 2-D region onto 1-D with a value between 0 and 1 and is the parameter fit by SimBAL. Power-law partial covering assumes a power-law distribution of optical depth, where the power-law index is a fit parameter for SimBAL. When the index value is 0, this is equivalent to the homogeneous partial covering case, e.g., a sharp-edged, solid absorber. SimBAL uses power-law partial covering because it is computationally tractable and explains the observed difference in covering fraction between high and low ionization lines (e.g., Hamann et al., 2001). See Leighly et al. (2018) for further details about SimBAL and the spectral synthesis method of modelling BAL quasar absorption and Leighly et al. (2019) for further discussion of the covering fraction.
An advantage of SimBAL over traditional analysis methods is that the solution is self consistently constrained by all of the lines simultaneously, as well as from the upper limits of the absorption lines that are not detected. Therefore, in a velocity-resolved analysis (such as the analysis presented here), the physical parameters of the gas are constrained by multiple lines. This allows for excellent constraints on physical conditions of the gas due to the diagnostic power of lines with different physical properties such as oscillator strengths and abundances. The first velocity-resolved analysis using SimBAL was the of low-ionization BAL source SDSS J (Leighly et al., 2018, 2019). Applied to multi-epoch data, this methodology offers the capacity to study the change in the physical outflow properties over time as a function of velocity.
3.2 Absorption
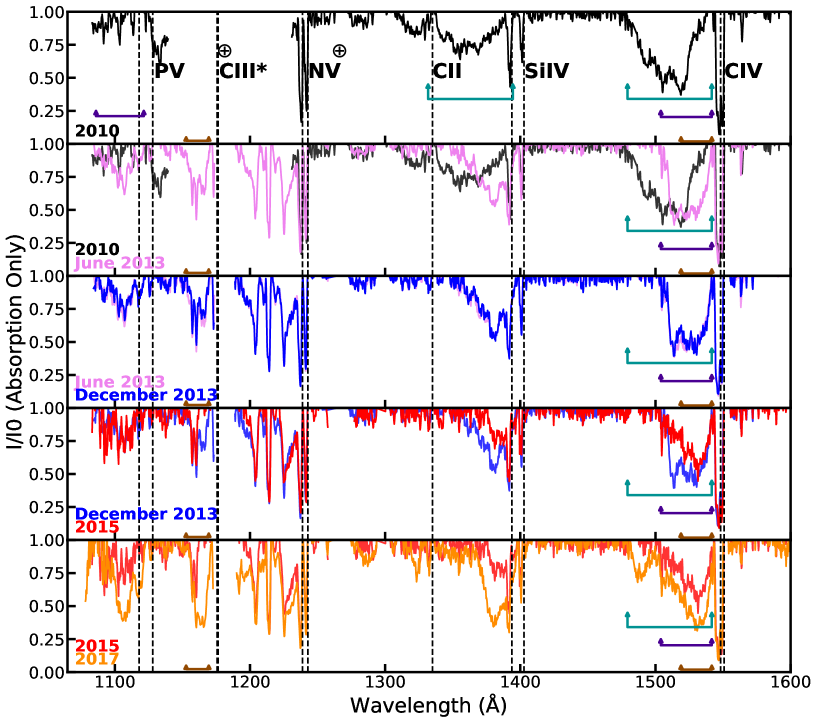
In Table 2, we list key lines modeled in absorption, including their ionization potential and primary diagnostic power for determining physical conditions of the gas. Figure 4 shows the differences in absorption between epochs after continuum normalization. To find a generic absorption model that would work for all epochs, we first look at the overall absorption structure in all epochs and at which BALs and BAL sub-features change over time. Subsequently, a starting model for absorption lines was chosen taking into consideration the morphology of the lines, total width of the absorption lines in all epochs, and variation within the structure of individual BAL lines between epochs.
The ionizing continuum used in the Cloudy grids is a relatively soft quasar SED (Hamann et al., 2011), that we use because WPVS 007 has been consistently found to be X-ray weak, with a soft X-ray spectrum (Grupe et al., 1995, 2007, 2008, 2013). We also assumed an enhanced metallicity consistent with previous findings that BALQs have metallicities as measured using emission-line ratios (Hamann et al. 2002, but see also Temple et al. 2021).
| Ion | Wavelength (Å) | IP (eV)aaIonization Potential in units of eV | Diagnostic |
|---|---|---|---|
| P V | 1118, 1128 | 65 | Column Densitybb Hamann (1998) and Ionization Parametercc Leighly et al. (2018) |
| C iii* | 1175dd Multiplet of 5 lines, each is modelled as a separate line in SimBAL. | 48 | Densityee Gabel et al. (2005) and Column Density |
| N V | 1239, 1243 | 98 | Ionization Parameter |
| C II | 1335, 1336 | 24 | Column Densityff Hazlett et al. (2019) |
| Si IV | 1394, 1403 | 45 | Covering Fraction and Ionization Parameter |
| C IV | 1548, 1551 | 64 | Covering Fraction and Ionization Parameter |
Of the physical outflow parameters listed in Table 2, density is the hardest to constrain with only the C iii* line. In order to constrain density, we need absorption from the collisionally excited state of an ion (e.g., Gabel et al., 2005; Arav et al., 2013). In this case, C iii* is the only ion within this wavelength range producing absorption from an excited state. Lines with high ionization potential, such as N V, are sensitive to changes in ionization parameter. As was discussed in Leighly et al. (2018), the P V line is very useful as a constraint on column density because it is rarely optically thick due to the low abundance of P V (Hamann, 1998) and also constrains the ionization parameter as a high ionization is required to produce P V (see also Leighly et al., 2009). We observe the P V line in all COS spectra, which is an indication that the much more abundant C IV will likely be saturated (Borguet et al., 2012).
The kinematic differences and opacity differences (in the case of C iii*) required us to look for ways to tie or fix parameters in the model. As a first step, we look for ways to group structures within the BAL. Based on relative velocity widths of various lines, we divided the velocity profile into 4 main regions, a high-velocity gas component as all absorption between –12,000 and –8,000 , a medium-velocity component consisting of absorption between and , and two low-velocity components with absorption between – and – , which we call low (1) and low (2) respectively. The C iii* line (that we rely on to constrain the density; see Table 2) absorbs only at low velocities (5,000 –600 ) in all epochs, but due to differences in absorption between low (1) and low (2) in the 2015 epoch compared to other epochs, we subdivided this velocity group further. The high-velocity gas is only present for some high-ionization lines such as C IV and N V in the 2010 and 2017 epochs, and not low-ionization lines such as C iii* or C II, and is not present in P V. The mini-BAL feature at velocities of 600 overlaps the C IV emission line (with strong absorption for other high-ionization lines of Si IV and N V). The mini-BAL absorption line is deeper than the BAL and does not show variation between epochs. The observed lack of variation implies a larger covering fraction for the mini-BAL than the BAL. For the remainder of the paper, we discuss absorption variability as a function of the velocity groups defined.
We used the tophat setting in SimBAL (see Leighly et al., 2018, 2019; Choi et al., 2020) to model the spectra. The tophat accordion model uses rectangular bins of equal velocity width to span the BAL. Both the maximum velocity and width per bin are fit as parameters in SimBAL, but the number of bins remains fixed. The starting bin size was chosen to be , roughly half the separation width of the Si IV doublet, or the velocity separation between the N V lines. We used C IV to select the number of bins necessary to model absorption across all epochs. The number of bins for each epoch was chosen so that variability in each sub-feature of key BALs could be studied between epochs. Specifically, we wanted to ensure that the number of bins in each epoch resulted in the final velocities of each bin roughly aligned between epochs. We chose the smallest number of bins to achieve this objective for each epoch. Using the velocity groups defined above, we use 12 bins to span absorption from velocities of to in 2010. For the 2013 epochs, we used 7 bins to span velocities from to , the 2015 epoch was fit with 8 bins spanning from to , and the 2017 epoch was fit with 11 bins spanning velocities from to . We use two tophat bins to fit the mini-BAL absorption. These tophats had widths of 300 spanning velocities from to 0 . Leighly et al. (2018) looked at the difference in final fit parameters when varying the total number of bins that span the BAL and found that the total number of bins used to model the absorption did not significantly affect the values of the final fit parameters.
To reduce the number of free parameters, we tied some absorption parameters between SimBAL bins within the same velocity group. Following the analysis of Leighly et al. (2018), each bin has a unique value of and partial covering parameter . Ionization parameter is tied between bins in a given velocity group (with unique ionization parameters assigned to low (1) and low (2)) to reduce the number of fit parameters (and therefore computation time). Ionization parameter is more difficult to constrain with the lines available in the spectrum, and we further found that freeing ionization parameter between bins did not improve the fit. With C iii* as the only density-sensitive line present in all spectra, we fit only one density value for each epoch. The low-velocity bins overlap with the C iii* line and are constraining the density value for this model. We tested whether freeing the density between velocity groups improves the fit, but found that this failed an F-test for significance.
3.3 Best-fit Results
As a first step we fit each epoch independently, letting all outflow, continuum, and emission-line parameters vary between epochs. In Figures 5 and 6, we present the fits and best-fit parameters respectively for the BAL and mini-BAL for all epochs. We note that the continuum in the 2013 epochs shows an uneven blue wing for the C IV line. We tested the impact of this shape on our final results by fitting a separate model for the December 2013 epoch with additional constraints to force a smooth shape for the final C IV emission line. The resulting final parameters were consistent with the original fit as expected because the C IV line is saturated, and therefore is not strongly constraining on the best-fitting model parameters.

The physical parameters as a function of velocity are shown for each HST COS epoch fit in the right panel of Figure 6. Density is not shown for the mini-BAL as it could not be constrained. The left panel of Figure 6 shows synthetic ion models produced by SimBAL using the final best-fit models for each epoch as a function of velocity. Dashed lines are used to show the corresponding BAL features for each velocity group. Velocity bins between main velocity groups were given unique ionization parameter values and not tied. Although the density was fit for the 2010 epoch (and shown in Figure 6), we do not present any parameters derived from the density value for 2010 as no density sensitive lines were present in the band pass. We note that the high-velocity component in 2017 has a lower ionization parameter than the low-velocity gas and yet shows no evidence of absorption from low-ionization line C iii*. The C iii* line is sensitive to more than ionization state alone. SimBAL is fitting the column density, ionization parameter, and covering fraction simultaneously for this component, all of which contribute to the opacity produced (or not produced in the case of the high-velocity gas component) in the synthetic spectrum.


4 What Physical Parameters Drive BAL Variability in WPVS 007?
We used SimBAL to fit the continuum, emission-line and absorption line features in 5 epochs of HST UV spectra of the NLS1 WPVS 007. The broad absorption lines present in the spectra between 1090Å and 1600Å including P V, C iii*, Ly , N V, C II, Si IV, and C IV were fit simultaneously as a function of velocity. Overall, our SimBAL results from fitting the individual epochs independently were grossly consistent over time. We found that the spectral fits are not very sensitive to changes in density and interchanging density values between epochs produces little change in the observed models. This makes sense because only C iii* in our bandpass probes density. We do not explore a change in density as a potential cause of the variability further. We were unable to pick out a clear single cause of the variability between a change in ionization parameter, column density, or partial covering from the results presented in Figure 6.
In the following sections, we turn to alternative methods for determining the primary cause of the variability including fitting more than one epoch simultaneously using SimBAL and quantifying the observed depth of the individual BAL lines as a function of velocity to investigate potential correlations between the depth of the BAL and the change in physical parameters.
4.1 Multi-Epoch Fits
We simultaneously fit 2 epochs at a time, tying all absorption parameters between epochs except one to see if a single parameter can explain the variability between epochs. These simultaneous fits of WPVS 007 are the first time more than one epoch of observation was fit simultaneously using SimBAL. This analysis was done with the December 2013, 2015, and 2017 HST COS observations. The 2010 observation was excluded due to missing observations of C iii* and N V lines, and we chose the December 2013 observation over the June 2013 observation as it is chronologically closer to the 2015 and 2017 observations. The 2013 and 2017 epochs were chosen first due to the comparable signal-to-noise and little change in continuum or line parameters between the two epochs. In the end, simultaneous fits of 2013–2017 (not including 2015), 2013–2015, and 2015–2017 epochs were carried out.
The scenarios tested are as follows: (1) there is a change in ionization state of the gas, which will be reflected as a change in ionization parameter (); (2) there is a change in column density; or (3) there is a change in partial covering (). As SimBAL fits the column density with respect to the hydrogen ionization front () instead of a total column density, we tied the column density for scenario (1) listed above.
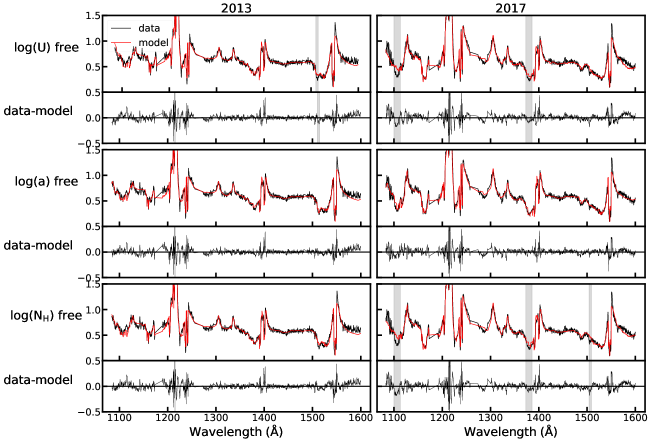
In Figure 7, we show the results of the 2013 and 2017 simultaneous fitting for the three test cases outlined above. The models fail to fit the full depth of the P V and Si IV BALs in both scenario (1) where we assume that the ionization parameter is causing the variability and (2) where we assume that the column density alone is controlling the variability. In contrast, all absorption features of both epochs can be fit by varying the partial-covering parameter, only. The variation in absorption lines can be therefore explained as largely driven by a change in the amount of partial covering.
Given that the parameter is the main driver for absorption-line variability between epochs, we further investigate if freeing either ionization parameter or column density in addition to partial covering improves the observed fit from the fits alone; these models fail the F-test for improvement to the model given the additional parameters.
The changing covering fraction best explains the changes between 2013 and 2017 and is less satisfactory for the ultra low state in 2015. We test whether these results are consistent with the 2015 data by fitting the 2015 spectrum with the best-fit values of density, ionization parameter, and column density from the combined 2013-2017 fit and allowing only the continuum parameters, velocity, and parameters to vary. Using an F-test, we find that the fit is improved statistically when all absorption parameters (not just are allowed to vary. The residuals show that the difference between the models (where only is free vs. where all absorption parameters are free) is mostly overlapping the emission lines and mini-BAL area, indicating that there may be either some small change in the mini-BAL in 2015 or that there is some degeneracy between the continuum parameters and the mini-BAL absorption parameters. As far as differences between the BAL models, the difference comes in a slightly poorer fit for C iii* in the two lowest velocity bins where we see the BAL disappear in 2015. The change in covering fraction is not able to explain the low opacity in 2015 for these lowest velocity bins, which may indicate that there are slight variations in other parameters at low velocities between these epochs that are not being taken into account when only is allowed to vary.
4.2 Correlation with Empirical Parameters
We wanted to see if we can determine the cause of variability using the individual fits of each epoch to confirm the result we obtained with the simultaneous fits of the 2013 and 2017 epochs. To do this, we look for correlations between the change in depth of the BAL and the change in physical parameters from the final SimBAL fits presented in Figure 6. Throughout this analysis, we used a change in bin depth between epochs to measure the absorption strength of the BAL at a certain velocity. As our velocity bins are , this change in bin depth is comparable to the statistic used by Capellupo et al. (2011, 2012, 2013) to quantify changes in BALs over time. Their parameter is the change in the fraction of the continuum-normalized flux removed over 1000 to 2000 velocity bins (Capellupo et al., 2011).
Using the final synthetic spectra from each single epoch fit, we produce bin-by-bin synthetic spectra for the C IV, C iii*, N V, Si IV, and P V lines and measure the change in bin depth per bin, for each ion between the same bins in different epochs. We examined the change in bin depth between each pair of epochs always with the form: later epoch - earlier epoch for each bin. Combinations of epochs are 2010-2013, 2010-2015, 2010-2017, 2013-2015, 2013-2017. We also calculate the change in each of the physical parameters (ionization parameter, covering parameter, , and column density) per bin between pairs of epochs. There are fewer data points for ionization parameter () as all bins of a particular velocity group have the same value, and so we only include one data point per unique value of ionization parameter. The bin depth for those data points is the mean of the change in bin depth for all bins that share the same ionization parameter. We exclude 1 outlier data point with a change in of less than as this data point came from the difference in ionization parameter from the high-velocity gas in 2010 and 2017, which may be poorly constrained due to a lack of absorption from C iii* and P V in both epochs. We additionally exclude 3 data points with a change greater than 2.1, as all 3 data points corresponded to the changes in the lowest velocity component from the 2010 epoch where the 2010 data has almost no opacity. We use the scipy.stats package to calculate the Spearman-rank correlation coefficient and corresponding -value in each case. The results are shown in Figure 8.


The high-ionization lines (C IV, Si IV, N V, P V) all show a negative correlation between the parameter and the change in bin depth (–0.88 for C IV, –0.65 for Si IV, –0.88 for N V, and –0.34 for P V) with very small -values ( for C IV, Si IV, N V, and P V respectively) indicating that this correlation is strong and a decrease in covering fraction manifests as a decrease in line depth across all of the high-ionization lines. The low-ionization line (C iii*), which is unsaturated, did not show the correlation with , but showed a positive correlation with column density (0.67 with a -value of ) and (0.65 with a -value of ). These correlations may indicate that variability in different lines may be controlled by different parameters. This analysis supports the result obtained from section 4.1 that covering fraction is the primary driver of the variability observed.
4.2.1 Regression
The physical parameters fit with SimBAL may not be independent, and so to further examine the relationship between the change in the depth of the absorption lines and the change in physical parameters, we fit a linear model to our results to look for a relationship between the BAL depth and physical parameters.
A backward elimination method was used to determine which parameters are statistically significant (e.g. Choi et al., 2022a). We used an iterative method to select features: first we fit a linear model to the data using the statsmodels.api OLS function, then determined the maximum -value for all parameters. If the maximum -value was greater than 0.05 (and therefore not considered significant), the parameter was removed from the fit and then this test was repeated until no parameters were left with values greater than 0.05. We found that the only feature removed from C IV, C iii*, and P V was the ionization parameter, , with , , and all being considered significant. For Si IV, was also removed, leaving only and as significant. For N V, is removed in addition to , leaving only and as significant. For each ion line, once the significant features were selected, the dataset was then split into a training and test set with a test size of 20% of the dataset. We fit a linear model to the training set, predict on the test data and calculate the coefficient of determination ( value222Defined as one minus the ratio of the sum of residuals squared over the total sum of squares, ), a statistic used to determine goodness-of-fit, using the test data. In each case we calculated an value greater than 0.9, indicating that for each ion our model is able to predict the change in BAL depth with reasonable accuracy.
From this analysis, we confirm that is the primary driver controlling the variability observed between epochs. In addition to changing, either the column density or both the column density and the BAL thickness (as quantified by the parameter) appear to be changing over time. We discuss the possible physical picture for this scenario in section 6.
5 Physical Properties of the Outflow
5.1 Derived Outflow Properties
The physical wind parameters that are directly fit by SimBAL can be used to calculate derived physical properties of the outflow including total hydrogen column density, mass-loss rate, radius, and kinetic luminosity, given in Table 3. We discuss in further detail below how the properties were calculated and their implications. For column density and radius, these values are given both by velocity group and in total.
=15mm
| Parameter | Velocity Group | 2010 | June 2013 | Dec. 2013 | 2015 | 2017 |
|---|---|---|---|---|---|---|
| aa | High | - | - | - | ||
| Medium | ||||||
| Low (1) | ||||||
| Low (2) | ||||||
| Total BAL | ||||||
| Mini-BAL | ||||||
| High | N/AbbN/A is given for regions and parameters where the density could not be constrained due to a lack of C iii* absorption. | - | - | - | ||
| Medium | N/A | |||||
| Low (1) | N/A | |||||
| Low (2) | N/A | |||||
| Mini-BAL | N/A | N/A | N/A | N/A | N/A | |
| BAL | ||||||
| BAL | ||||||
| BAL |
Note. — In each velocity section, values are the mean of the bins in each velocity group where the parameters were well sampled. Upper and lower limits represent the 95% confidence interval sampled from the distributions of each parameter. Velocity ranges given are approximate for each epoch.
5.1.1 Radius
The radius of the BAL is calculated from the density and ionization parameter values from the SimBAL fits, and , the number of ionizing photons per second, using the ionization parameter equation defined in section 3.1. The value of is found by scaling a standard quasar SED (the soft quasar SED used to create the SimBAL grids; Hamann et al. 2011) to best match the UV SED and photometry available for each epoch, and then integrating the photon flux for energies larger than 13.6 eV. is estimated to be (phot s-1); the range in values is due to the differences in the normalization for each epoch (see Figs. 2, 3).
The radius of the medium and low-velocity gas has lower uncertainties because the density is better constrained by the presence of C iii* absorption. To estimate the radius of the high velocity gas with no independent C iii* constraints, we assumed the same density values as the lower velocity gas for each epoch. The lowest (mini-BAL) velocity absorbers have no independent density constraints, but are likely to have larger radius values than the BAL gas because the mini-BAL absorbing gas completely covers both the continuum and emission-line regions.
The radius per velocity bin is presented in Figure 9. The density is measured per epoch and ionization parameter is measured per velocity group. The low and medium-velocity BAL gas has an average value across all epochs of 0.07 pc. The much larger radius calculated for the high-velocity component (3.5 pc) may be an artifact of the assumption that both components share the same density when they have much different values of ionization parameter. If the high-velocity component has a higher density, the radius would be lower; a density value of would put the high velocity gas at the same radius as the lower-velocity gas. No radius value is presented for the BAL in the 2010 epoch or for the mini-BAL in all epochs due to the lack of C iii* absorption (the line is not in the bandpass in 2010) to directly constrain the density.

For reference, the dust sublimation radius is estimated to be 0.01 pc calculated using the equation pc from Laor & Draine (1993) and a bolometric luminosity of (Leighly et al., 2015). With a radius estimate of from SimBAL models, this places the winds in the torus, consistent with Leighly et al. (2015) who found the radius to be in the vicinity of the torus with a distance of 0.17–1.47 pc based on photometric variability.
5.1.2 Column Density
We present the total hydrogen column density correcting for the partial covering of the BAL in Table 3. The log of the hydrogen column density varies between its lowest point in December 2013 (22.11 cm-2) and its highest point in 2017 (23.24 cm-2). Differences between epochs are minimal and there is no change within errors between the 2010, 2015, and 2017 epochs.
5.1.3 Mass-Loss Rate
Mass-loss rate is calculated per bin using (Dunn et al., 2009) in units of M⊙ yr-1 and the total mass-loss rate is the sum of the mass-loss rate per bin. The mean molecular weight, , is assumed to be 1.4 amu and the global covering fraction, , is assumed to be 0.2 from the BAL population demographics (Hewett & Foltz, 2003). Overall, the mass-loss rate (between and 5 M⊙ yr-1 across epochs) is high for this source given its low luminosity. In contrast, the mass outflow rate for the LoBAL SDSS J studied with SimBAL was found to be 17–28 M⊙ yr-1 for a source that is more luminous (Leighly et al., 2018). However, a comparison to mass-loss rates found for AGN with comparable bolometric luminosities to WPVS 007 found mass-loss rates as high as for the UV component of the outflow for source NGC 3516 and 4.61–8.25 M⊙ yr-1 for the UV outflow in NGC 3783 with bolometric luminosities of and respectively (Crenshaw & Kraemer, 2012). The sample studied in Crenshaw & Kraemer (2012) studied UV and X-ray outflows from AGN; we compare our results to the listed total UV outflow component only, excluding the X-ray outflow.
The mass accretion rate estimated using assuming that WPVS 007 is radiating 10% of its rest-mass energy () using a bolometric luminosity, , of (Leighly et al., 2015) is . With an Eddington accretion rate of , WPVS 007 is accreting at 10% the Eddington limit. This would place the outflow rate between 20 and 543 times the accretion rate depending on the epoch of observation. The study of mass outflow rates of UV outflows for Seyfert 1 galaxies by Crenshaw & Kraemer (2012) found mass outflow rates 10-1000 times the mass accretion rates for luminosities of 1043–1045 erg s-1 considering both the X-ray and UV outflows in their sample and 0.1–300 times the mass accretion rates considering the UV outflow components only (values for UV-only components were calculated using available information in Tables 1 and 3 of Crenshaw & Kraemer (2012)), indicating that the values found for WPVS 007 may not be unusual for a nearby AGN. We do note that we are comparing the UV BALs present in WPVS 007 to non-BAL UV absorbers in Crenshaw & Kraemer (2012), therefore the maximum velocity of the comparison AGNs are typically on the order of 1000 or less, and some have black hole masses up to 10 higher than the mass of WPVS 007. Such a powerful outflow coming from a less massive black hole emphasizes how unique this system is.
5.1.4 Kinetic Luminosity
Kinetic luminosity was calculated per bin using with the sum across all bins presented as the total kinetic luminosity in Table 3. WPVS 007 has a range in of 41.97–43.80 erg s-1 (across epochs with 41.97 erg s-1 from the December 2013 epoch and 43.80 erg s-1 from the 2017 epoch) with corresponding –1.1. Comparing this value to the kinetic luminosities of NGC 3516 and NGC 3783 from Crenshaw & Kraemer (2012) with luminosities roughly 3 times that of WPVS 007), we found that the outflow for WPVS 007 has a higher kinetic luminosity than NGC 3516 and NGC 3783 which have values of 41.7 and 42.5 erg s-1, respectively from their UV outflow components only (with much lower velocities than WPVS 007). The ratio of for WPVS 007 is comparable to outflows from BALQs (e.g., Borguet et al., 2013; Chamberlain et al., 2015; Choi et al., 2020). This value is higher than the HiBAL source SDSS J studied with SimBAL where the authors find (for the solar metallicity case; Leighly et al. 2018). However, many more HiBAL objects need to be studied using SimBAL in order to make a definitive comparison.
5.2 Effective Covering Fraction
As the power-law-partial-covering parameter is the most empirical and least intuitive of the SimBAL physical parameters, we calculated the effective covering fraction per bin from the partial covering parameter. The effective covering fraction is the fraction of the emission region covered. Since power-law partial covering must, by definition, assume that no region is truly uncovered, to calculate the total effective covering fraction, we assume some cutoff in optical depth, below which we assume there is no contribution to total covering. Effective covering fraction is taken to be the fraction of the surface area covered by gas with an opacity greater than 0.5. The criteria is given in Arav et al. (2005) as a good cutoff to estimate the effective covering fraction. Optical depth as a function of velocity in the power-law partial covering case is defined as where (Savage & Sembach, 1991) and is the oscillator strength of the transition, is the wavelength (Å), and is the ion column density (). This calculation was done for the high ionization lines of C IV, Si IV, N V, and P V, as well as the low-ionization lines C II and C iii* to examine changes in effective covering fraction as a function of velocity, epoch, and ion line as was done in Figure 16 of Leighly et al. (2019).
In Figure 10, we show the effective covering fraction per velocity bin as a function of transition and time from 2010 to 2017. These results show that the high ionization lines cover more of the continuum than the low ionization lines. The covering fraction was higher for the medium velocity gas in 2010 and 2017 when the BALs were deepest and the high-velocity component was present. The effective covering fraction was lowest for the medium and low velocity gas in 2015 when the high-velocity BAL component was absent and the BALs were the shallowest. At the lowest velocities, the effective covering fraction does not change significantly from 2013 to 2017 and even appears to increase in 2015, although these bins overlap with emission lines so small changes between epochs could reflect changes in the emission lines and not a change in absorption. For the bins around 8,000 there is a change in covering fraction of Si IV from in 2015 to 0.4 in 2017, whereas we see almost no change in Si IV for the low-velocity bins between the two epochs. Unlike previous work with WPVS 007, we find absorption at low velocities in 2015 due to our finding that the line emission is uncovered. The lowest velocity gas seemed to disappear from C IV and P V in 2010, but the Si IV component remained well-covered. Overall, we observe small changes in effective covering align with small changes in BAL depth for a particular velocity bin and large changes in effective covering align with regions of the BAL where larger changes were observed.

5.3 Mini-BAL Outflow
The mini-BAL parameters are the same within errors between epochs for , , , and , consistent with the observed lack of variation in mini-BAL depth between epochs. This gas shows lower ionization parameter (average of across all epochs) compared to the BAL gas ( average of 1.27 across all epochs and velocities), lower column density (average of 20.6 cm-2) compared to the total column density of the BAL (average of 22.6 cm-2), and higher covering fraction (average of 0.71 for the mini-BAL) than the BAL (average of 1.5 across all epochs and velocities). We determined that the BAL does not cover the line-emitting region, whereas the mini-BAL fully covers the emission-line region. The difference in covering of the line and continuum from the BAL gas, together with the large covering fraction, suggests that the mini-BAL is an outflow separate from the BAL gas, existing on larger scales and likely farther away (although this cannot be confirmed without the density constraint needed to calculate ). An estimate for the ratio of the radius of the mini-BAL outflow to the radius of the BAL outflow for different epochs, assuming that the mini-BAL has the same density of the BAL for a particular epoch, shows that the mini-BAL could be around 10 times the distance of the BAL outflow.
6 Discussion
With and a small radius for the BAL outflow, pc (this work), WPVS 007 has a significantly smaller mass and outflow size than the BALQs at that are the principal target of variability studies to date (Leighly et al., 2009). Previous work has estimated the lifespan of a typical BAL to be decades or longer (Gibson et al., 2008; Filiz Ak et al., 2012, 2013). However, the low redshift (, with correspondingly little time dilation) and smaller size means that variability studies of WPVS 007 on timescales of years have the ability to probe dramatic BAL changes that might take decades to see with larger, more massive, and higher redshift samples. Furthermore, variability studies of typical BALQs (with masses of ) have shown that the amount of variability increases with increasing time between observations (e.g., Capellupo et al., 2013). As seen in Figure 1 of Capellupo et al. (2013), the fractional change in maximum absorption-line depth of 24 C IV BALs on timescales up to 10 years is no more than 0.5. We observe comparable fractional changes in absorption-line depth of 0.4 for WPVS 007 within only one year.
6.1 Comparison of Outflow Properties with Previous Work
With our new multi-epoch SimBAL analysis with simultaneous fits of the continuum and several absorption lines, we are in a position to better constrain the physical properties of the outflow, and so we compare this work to previous studies of WPVS 007. From the SimBAL fit results, we found that the ionization parameter of WPVS 007 is high, up to =1.88 (as seen in 2015). This ionization parameter is significantly higher than previous constraints on the ionization parameter from studies of this object. For example, Li et al. (2019) gave a maximum value for of 0.0.
The SimBAL analysis gives us confidence in our results, as we simultaneously fit multiple lines as a function of velocity. The strong, high ionization lines of P V and N V in particular are powerful diagnostics. The model fits presented here show strong N V and P V BALs, with a P V apparent optical depth almost matching that of C IV at the lowest velocities. These lines together imply a large ionization parameter and a large column density (e.g., Hamann, 1998) because of the low cosmic abundance of P V (; Grevesse et al. 2007). Specifically, we find that the ionization parameter varies from =–0.28 to =1.88 for bins that cover the P V BAL. Our value is consistent with the previous analysis of the 2003 FUSE observations by Leighly et al. (2009) that gave the lower limit of from the strong, almost saturated P V absorption line and saturated N V line. In addition, the assumption of Li et al. (2019) that the N V BAL is weak is not consistent with our spectral-fitting results. Assuming complete covering of the continuum and emission lines leads to a significant underestimate of the amount of absorption from the N V line. BALs not fully covering emission lines have been observed before (e.g., Arav et al., 1999; Borguet et al., 2012; Choi et al., 2022b). With a robust determination of the ionization parameter and the density constraints from the C iii* line, we used the definition of ionization parameter to calculate the radius of the outflow over the velocity bins where the C iii* feature is present. The average radius across velocity regions (assuming the density is uniform) and epochs (excluding the high-velocity gas in 2017 and the 2010 epoch) is 0.07 pc. The initial launching radius of the outflow can be estimated from ionization and kinematic arguments (based on assuming the Keplerian velocity at the launch radius and terminal velocity of the outflow are comparable), and gives much smaller values of pc (Leighly et al., 2009; Li et al., 2019). Alternately, Leighly et al. (2015) give an estimate for the outflow radius of 0.17–1.47 pc based on the variability, with a torus radius of pc. Our value for the outflow is thus also consistent with being found in the vicinity of the torus.
6.2 What Causes the BAL Variability in WPVS 007?
Understanding the physical reason behind BAL variability offers promise for understanding more about the geometry and structure in quasar outflows. With the use of SimBAL, we have the unique opportunity to study the difference between the physical properties of the gas over time. To date, many studies of variability use an observed change in equivalent width of the C IV line (or C IV and Si IV) to inform the understanding of the cause of the variability in the BAL (e.g., Capellupo et al., 2011, 2012, 2013; Filiz Ak et al., 2012, 2013, 2014). However, studies such as Lundgren et al. (2007) have emphasized the importance of having lines other than C IV (which is often saturated) when studying variability.
In the case of WPVS 007, we find this to be true; had we studied only the C IV line, we would not have been able to distinguish between a change in ionization parameter, column density, or covering fraction. In the multi-epoch fits in section 4.1, all tested scenarios were able to fit the C IV line for the December 2013 and 2017 epochs (see Figure 7). As mentioned above, the presence of P V in the spectrum, given the low abundance of phosphorus compared to carbon and its high ionization potential, is an indicator of high column density and high ionization parameter (e.g., Leighly et al., 2009, 2018; Capellupo et al., 2014). In this parameter regime, the C IV absorption line will always be highly saturated (Borguet et al., 2012), and therefore large changes in some physical properties of the outflow may show little effect in the C IV EW. In particular, saturated lines – as C IV is whenever a P V BAL is present – are insensitive to changes in ionization parameter (McGraw et al., 2017; Vivek, 2019). For WPVS 007, it was only with the combined simultaneous fit of several lines, including P V, N V, Si IV, and C IV, that a change in covering fraction was revealed to be the driving source of variability between epochs. From Figure 7, the models where the ionization parameter or column density were allowed to vary could not produce the full depth of the P V BAL. C iii* also was critical in the analysis as the only density-sensitive line. Like P V, C iii* is not saturated, but is also not present at all velocities where C IV is observed.
Previous studies of BAL variability have linked the cause of variability to one of two causes: (1) a change in ionization of the gas caused by a change in strength or shape of the ionizing continuum or (2) a change in absorption caused by gas moving transverse across our line of sight with the quasar, the “cloud-crossing” scenario. The origin of the cause of variability is frequently used to determine the physical conditions of the gas. If a change in ionization is causing the observed variability, then the timescale between observations can be used to estimate the electron density and then the radius (e.g., Barlow, 1993). If variability is caused by cloud crossing, the timescale and degree of change in the depth of the BAL can be used to estimate the crossing speed and therefore the radius (assuming Keplerian motions, e.g., Capellupo et al., 2013). Using SimBAL, the constraints on ionization parameter and density that allow us to calculate the radius are obtained directly from the MCMC fits.
Overall, it is unlikely that a change in continuum flux is driving the observed changes in the BALs. A changing ionization parameter causing the observed changes in absorption would indicate that the variability is likely being caused by a changing continuum. We found no support for a change in ionization parameter driving the variability in the BALs as discussed above through our use of simultaneous fitting as well as poor correlation between the change in ionization parameter and change in depth of the BALs. This interpretation of the variability differs from that proposed by Li et al. (2019). Li et al. (2019) examined patterns between the WISE infrared photometry, the Swift photometry, and the equivalent widths of the C IV and Si IV lines to find that the cause of the variability is due to a change in the ionizing continuum instead of a change in a line-of-sight absorber. They were able to reproduce the observed Swift light curve using stochastic changes to the emission from the disk. They further calculate the concordance index (absorption line EWs are assigned a if the EW and continuum change in the same direction and for the opposite case) to compare the stochastic changes in the disk to the variation in the UV Si IV and C IV BALs. In comparing the UV luminosity and BAL EW for the same 5 epochs of spectroscopy used in this analysis, Li et al. (2019) found a positive concordance index (the luminosity and BAL EW vary in the same direction) in all cases for C IV and most cases for Si IV. This method has been used to link a change in continuum with a change in absorber optical depth before (e.g., Wang et al., 2015). We observe the same stochastic changes in the photometry (see Figs. 1 and 3) due to variation in the accretion disk, but disagree that these stochastic changes are the reason for the observed variation in BAL EWs. Using SimBAL, we are able to test these underlying assumptions that a changing EW is controlled by a change in the ionizing continuum. Given the saturation of the C IV, the EW of this line is not sensitive to changes in ionization state. Moreover, the high ionization parameter required by the presence of P V absorption means that the concordance scenario proposed by Li et al. (2019) predicts a decrease of C IV EW with an increase in luminosity contrary to what has been observed.
Previous studies have linked coordinated variability across all velocities of a BAL to a change in ionization state, whereas a change in a portion of the BAL is often linked to a change in covering fraction (e.g., Capellupo et al., 2013). Although coordinated variability fits more naturally to a change in ionization parameter (a change in continuum would globally affect the outflow), this is not the case for saturated BALs, where covering fraction controls the apparent opacity of saturated lines (see Hall et al., 2011; Capellupo et al., 2014). Much like the case of Q1413+1143 observed by Capellupo et al. (2014), WPVS 007 shows a saturated C IV line with variability in C IV, Si IV, and P V, which indicates a change in ionization state of the gas cannot cause the variability, even if there are apparently coordinated changes across the BALs, because covering fraction is controlling the depth. Furthermore, though variations across the BALs appear to vary together, the changes across the BALs for WPVS 007 are not as coordinated as a function of velocity as they initially appear. Although the overall depths of the lines change, there are smaller changes along the BAL. As a function of velocity, not all components of the C IV line vary uniformly (e.g., the depth at the blue edge of the C IV line is changing separately from the red edge). For example, in 2015, most of the BALs seem to have gotten weaker in tandem. However, SimBAL analysis (which considered separately the high and low velocity BAL components) identified more absorption at low velocities in 2015 than previously modeled. Once the emission-line covering fraction was accounted for (with the low velocity BAL gas not covering the emission lines), the low-velocity gas component did not disappear in 2015 as previously thought.
From fitting the continuum emission, we found that there is no significant change to either the power-law component or emission-line parameters between 2013 and 2017, but there is a significant change to the BAL absorption between these epochs. Furthermore, the continuum is different between 2015 and 2017, with the 2015 continuum being significantly redder, but the ionization parameter of the BAL gas between 2015 and 2017 is consistent. Although the Swift photometry shows variation epoch-to-epoch, these photons are longer in wavelength than the continuum photons that would be ionizing the gas in the outflow. We measured the continuum flux levels during the 2013 and 2017 HST observations by sampling the median flux in a line-free region of the continuum (1450 Å). We observe no change within errors between 2013 and 2017, while at the same time we observe a dramatic change in the BAL lines. The 2010 and 2015 epochs show the strongest and weakest continuum flux levels, respectively, consistent with the Swift photometry (see Fig. 3). This indicates that there are changes in the continuum over time, but those changes are not driving the BAL variability between all epochs. For WPVS 007, we can therefore reject scenario (1), a cause in ionization parameter, and now consider the cloud-crossing scenario.
In previous variability studies, a change in covering fraction has been synonymous with the cloud-crossing scenario, where an absorber passes across the continuum-emitting region along the line of sight (Gibson et al., 2010; Hamann et al., 2008; Filiz Ak et al., 2012; Hall et al., 2011; Capellupo et al., 2013; McGraw et al., 2015, 2017; Vivek et al., 2012a, 2016). In particular, Capellupo et al. (2014) found a case of a P V BAL showing variability in the P V, C IV, and Si IV lines and determined the cause of the variability to be cloud-crossing. A change in absorption-line structure due to cloud crossing would produce a change in partial covering parameter, , and possibly also a change in column density in SimBAL. Although we have ruled out a change in column density as the main driver of the variability; the results of the regression analysis discussed in §4.2.1 imply that column density may also be a contributing factor determining the change in depth of the BALs. The cloud-crossing scenario for the case of WPVS 007 is shown in the middle panel of Figure 11.

We can calculate the expected time for the BAL to completely cross the continuum, assuming Keplerian motion of the gas around the black hole. Using a radius of 0.07 pc, the speed of the gas is about , from where is the gravitational constant, is the mass of the black hole and is the outflow radius. Given the size of the accretion disk at 1550 Å is estimated to be pc (Leighly et al., 2015), it would take between months and years to cross the continuum at . This crossing time is shorter than the time between the luminosity peak in 2010 and the occultation event in 2015. We can use the cloud-crossing method outlined in Capellupo et al. (2013) to calculate the crossing speed from the change in depth of the BAL, assuming the absorber and continuum are uniform and circular. Considering all bins and epochs, the crossing speed would range from 6.6–423 km s-1, which leads to an outflow radius of 0.1–400 pc. At the low end, this is only marginally higher than the 0.07 pc radius determined using SimBAL, making the cloud-crossing scenario a possible cause of the variability observed in WPVS 007.
Leighly et al. (2015) speculate that the outflowing gas may be ablated material driving from the torus the same way “wind ablates spray from the crest of a wave”. The outflow would therefore be the upper edge of the torus; this is consistent with the constraints on from SimBAL and from Leighly et al. (2015). It is widely accepted that the torus must be clumpy (e.g., Netzer, 2015). Given this picture, Leighly et al. (2015) proposed that the variability is caused by the changing scale-height of the torus that on occasion more completely eclipses our line-of-sight. The changing torus scale-height model assumes that our line-of-sight skims the edge of the torus, and as the torus rotates, our view of the quasar is either relatively unobscured when the torus has a low scale-height (in the case of 2010 where the BAL was strong, the photometry blue, and the emission lines broad), or highly obscured when the torus has a high scale-height (in the case of 2015 where the BAL was weak, the photometry red, and the emission lines narrow). The outflow is clumpy and embedded in a larger region of gas and dust that controls the variability on longer timescales. A changing covering fraction would be consistent with the Leighly et al. (2015) picture. The changing torus scenario is shown in Figure 11 and in Figure 5 of Leighly et al. (2015).
Alternatively, if the outflow is located beyond the location of the torus, when the scale-height of the torus is low (2010, 2013, 2017), it does not block any of the continuum, and therefore the angular size of the continuum is larger from the point of view of the outflow. (Note that we are assuming that the torus is completely opaque in this picture.) In contrast, a high torus scale height (2015) blocks part of the continuum. In this case, the changing covering fraction results from the changing angular size of the continuum, and not a cloud crossing the observer’s line of sight. When the angular size of the continuum as viewed from the outflow is larger, more of the outflow can cover the continuum, and so the covering fraction is larger; the changing scale-height model is the geometry that allows this to happen.
Alternatively, a change in covering fraction without a change in column density could be consistent with the formation and dissipation of clumps of material along the line of sight. Due to the way that SimBAL uses power-law partial covering, a change in power-law partial covering could be interpreted as a change in how diffuse clumps are along our line of sight (see Figs. 12 and 20 in Leighly et al. 2019). We have used this idea from Leighly et al. (2019) to construct a diagram of what could be occurring in WPVS 007 (see the bottom panel of Figure 11). In this picture, the smaller, dense portions of clumps will have high opacity and lower covering fraction. However, the steep opacity profile would mean low opacity for other (larger) regions within the wind; we propose that this could be the case for the wind in 2015 when the covering fraction of the high and medium velocity gas is low. With a shallow opacity profile across clouds, we would see increased optical depth and therefore a higher covering fraction across all velocities (this would be the case for 2017 as we demonstrate in Fig. 11).
We calculated the dissipation timescale of a clump of material, assuming that the high velocity, medium velocity, and low-velocity gas all represent distinct single “clouds” within the outflow. The diameters of the clouds are estimated using and the dissipation timescale is assumed to be , where is the maximum velocity of the gas (e.g., Hamann et al., 2013). We found that the dissipation timescale has a large variation between all epochs and velocity groups. The shortest dissipation timescales occur for the high-velocity gas in 2017, where dissipation occurs on the order of 3 hours. The medium velocity gas across all epochs shows dissipation timescales on the order of hours for the 2013 observations, which is inconsistent with the lack of observed variability between June and December observations. The longest timescales we find are for the low-velocity gas in 2017 with dissipation timescales of almost 2 years. Considering that we see little variation for the low-velocity gas from 2013 to 2017, this is also inconsistent. The assumption that entire portions of the outflow consist of single large clumps of gas is very limiting and likely not physical. SimBAL itself uses a partial covering approach that assumes that the wind is made up of an ensemble of small clouds. However, the assumption that the clouds are small would further reduce the dissipation time of the clumps. MHD simulations of disk winds have shown evidence for the formation and dissipation of high-density knots that form from instabilities in the wind every 3 years (Proga et al., 2000), however these simulations were for line-driven accretion disk winds in a much larger system. The outflow of WPVS 007 is highly unusual in its dramatic variability and may make an ideal candidate for evaluating future models of AGN outflows.
7 Summary and Future Work
WPVS 007 is a low-redshift (z=0.028) NLS1 with a small black hole mass () that shows high-velocity broad-absorption lines characteristic of BALQs. Due to its small mass and more compact size, the outflow in WPVS 007 varies on a faster timescale than its much more massive quasar counterparts making it an excellent lab for studying BAL variability. We present the analysis of the BAL variability of NLS1 galaxy WPVS 007 using forward-modelling and spectral synthesis code SimBAL. By fitting five epochs of HST COS observations taken between the years of 2010 and 2017, we determine that a change in covering fraction of the continuum is controlling the variability observed in the BALs. Specifically, we found a correlation between the change in partial covering parameter (used in place of covering fraction) from SimBAL analysis and the change in depth of individual BAL lines. The partial covering parameter was determined to be the main driver of the variability across high-ionization lines including C IV, Si IV, N V, and P V. This result was confirmed using pairwise fits of epochs from December 2013 and 2017 using SimBAL, where varying the partial covering parameter alone was able to fit the variability in all 3 epochs, December 2013, 2015, and 2017. A change in ionization parameter or column density alone could not fit the lines across these epochs.
This analysis was the first SimBAL variability analysis performed, and the first time SimBAL was used to fit more than one absorption spectrum simultaneously. SimBAL is therefore a powerful tool for linking a physical change in the gas to observed variation within the BALs and paves the way for future variability studies of BALQs that show different characteristic variability that may arise from other changes in physical conditions.
Although our solution is well constrained, we are limited by a lack of density-constraining absorption lines. The high-velocity gas did not show absorption for key diagnostic lines such as C iii*, limiting our ability to draw conclusions about the nature of the high-velocity gas component. We used a single density parameter constrained by gas at low velocities to describe all gas in the system, when the high-velocity gas may have different physical conditions. Multiple epochs of observation of density-sensitive lines like S IV (observed in 2003 with FUSE but not present in the band pass in any of the HST COS epochs) would help constrain the density in general, but may not help in modelling high-velocity components that only show absorption in C IV.
Only one observation was taken with COS during its peak in the UV light curve, in 2010. The 2010 observation happened to be taken in a mode that did not observe critical BALs necessary to perform a proper fit, including the C iii* BAL, Ly , and N V BAL in full. There continues to be regular monitoring of the UV photometry with Swift, and so an ideal observation to better understand the nature of the outflow would be to observe WPVS 007 in the high state with HST COS in a mode to cover all absorption lines between 1065 and 1600Å along with simultaneous deep X-ray observations to constrain the shape of the ionizing continuum and the absorber total hydrogen column density.
References
- Arav et al. (1999) Arav, N., Becker, R. H., Laurent-Muehleisen, S. A., et al. 1999, ApJ, 524, 566, doi: 10.1086/307841
- Arav et al. (2013) Arav, N., Borguet, B., Chamberlain, C., Edmonds, D., & Danforth, C. 2013, MNRAS, 436, 3286, doi: 10.1093/mnras/stt1812
- Arav et al. (2005) Arav, N., Kaastra, J., Kriss, G. A., et al. 2005, ApJ, 620, 665, doi: 10.1086/425560
- Barlow (1993) Barlow, T. A. 1993, PhD thesis, California University
- Barlow & Sargent (1997) Barlow, T. A., & Sargent, W. L. W. 1997, AJ, 113, 136, doi: 10.1086/118239
- Borguet et al. (2013) Borguet, B. C. J., Arav, N., Edmonds, D., Chamberlain, C., & Benn, C. 2013, ApJ, 762, 49, doi: 10.1088/0004-637X/762/1/49
- Borguet et al. (2012) Borguet, B. C. J., Edmonds, D., Arav, N., Benn, C., & Chamberlain, C. 2012, ApJ, 758, 69, doi: 10.1088/0004-637X/758/1/69
- Breeveld et al. (2010) Breeveld, A. A., Curran, P. A., Hoversten, E. A., et al. 2010, MNRAS, 406, 1687, doi: 10.1111/j.1365-2966.2010.16832.x
- Burrows et al. (2005) Burrows, D. N., Hill, J. E., Nousek, J. A., et al. 2005, Space Sci. Rev., 120, 165, doi: 10.1007/s11214-005-5097-2
- Capellupo et al. (2014) Capellupo, D. M., Hamann, F., & Barlow, T. A. 2014, MNRAS, 444, 1893, doi: 10.1093/mnras/stu1502
- Capellupo et al. (2013) Capellupo, D. M., Hamann, F., Shields, J. C., Halpern, J. P., & Barlow, T. A. 2013, MNRAS, 429, 1872, doi: 10.1093/mnras/sts427
- Capellupo et al. (2011) Capellupo, D. M., Hamann, F., Shields, J. C., Hidalgo, P. R., & Barlow, T. A. 2011, Mon. Not. R. Astron. Soc, 413, 908, doi: 10.1111/j.1365-2966.2010.18185.x
- Capellupo et al. (2012) Capellupo, D. M., Hamann, F., Shields, J. C., Hidalgo, P. R., & Barlow, T. A. 2012, Mon. Not. R. Astron. Soc, 422, 3249, doi: 10.1111/j.1365-2966.2012.20846.x
- Cardelli et al. (1989) Cardelli, J. A., Clayton, G. C., & Mathis, J. S. 1989, ApJ, 345, 245, doi: 10.1086/167900
- Chamberlain et al. (2015) Chamberlain, C., Arav, N., & Benn, C. 2015, MNRAS, 450, 1085, doi: 10.1093/mnras/stv572
- Choi et al. (2022a) Choi, H., Leighly, K. M., Dabbieri, C., et al. 2022a, ApJ, 936, 110, doi: 10.3847/1538-4357/ac854c
- Choi et al. (2022b) Choi, H., Leighly, K. M., Terndrup, D. M., et al. 2022b, ApJ, 937, 74, doi: 10.3847/1538-4357/ac61d9
- Choi et al. (2020) Choi, H., Leighly, K. M., Terndrup, D. M., Gallagher, S. C., & Richards, G. T. 2020, ApJ, 891, 53, doi: 10.3847/1538-4357/ab6f72
- Crenshaw & Kraemer (2012) Crenshaw, D. M., & Kraemer, S. B. 2012, ApJ, 753, 75, doi: 10.1088/0004-637X/753/1/75
- de Kool et al. (2002) de Kool, M., Korista, K. T., & Arav, N. 2002, ApJ, 580, 54, doi: 10.1086/343107
- Di Matteo et al. (2005) Di Matteo, T., Springel, V., & Hernquist, L. 2005, Nature, 433, 604, doi: 10.1038/nature03335
- Dunn et al. (2009) Dunn, J. P., Bautista, M. A., Arav, N., et al. 2009, ApJ, 709, 611, doi: 10.1088/0004-637X/709/2/611
- Ferland et al. (2017) Ferland, G. J., Chatzikos, M., Guzmán, F., et al. 2017, Rev. Mexicana Astron. Astrofis., 53, 385. https://arxiv.org/abs/1705.10877
- Filiz Ak et al. (2012) Filiz Ak, N., Brandt, W. N., Hall, P. B., et al. 2012, ApJ, 757, 114, doi: 10.1088/0004-637X/757/2/114
- Filiz Ak et al. (2013) —. 2013, ApJ, 777, 168, doi: 10.1088/0004-637X/777/2/168
- Filiz Ak et al. (2014) —. 2014, ApJ, 791, 88, doi: 10.1088/0004-637X/791/2/88
- Foltz et al. (1987) Foltz, C. B., Weymann, R. J., Morris, S. L., & Turnshek, D. A. 1987, ApJ, 317, 450, doi: 10.1086/165290
- Foreman-Mackey et al. (2013) Foreman-Mackey, D., Hogg, D. W., Lang, D., & Goodman, J. 2013, PASP, 125, 306, doi: 10.1086/670067
- Freeman et al. (2001) Freeman, P., Doe, S., & Siemiginowska, A. 2001, in Society of Photo-Optical Instrumentation Engineers (SPIE) Conference Series, Vol. 4477, Astronomical Data Analysis, ed. J.-L. Starck & F. D. Murtagh, 76–87, doi: 10.1117/12.447161
- Gabel et al. (2005) Gabel, J. R., Kraemer, S. B., Crenshaw, D. M., et al. 2005, ApJ, 631, 741, doi: 10.1086/432682
- Gibson et al. (2010) Gibson, R. R., Brandt, W. N., Gallagher, S. C., Hewett, P. C., & Schneider, D. P. 2010, The Astrophysical Journal, 713, 220, doi: 10.1088/0004-637X/713/1/220
- Gibson et al. (2008) Gibson, R. R., Brandt, W. N., Schneider, D. P., & Gallagher, S. C. 2008, The Astrophysical Journal, 675, 985, doi: 10.1086/527462
- Grevesse et al. (2007) Grevesse, N., Asplund, M., & Sauval, A. J. 2007, Space Sci. Rev., 130, 105, doi: 10.1007/s11214-007-9173-7
- Grier et al. (2015) Grier, C. J., Hall, P. B., Brandt, W. N., et al. 2015, THE SLOAN DIGITAL SKY SURVEY REVERBERATION MAPPING PROJECT: RAPID C, Institute of Physics Publishing, doi: 10.1088/0004-637X/806/1/111
- Grupe et al. (1995) Grupe, D., Beuerman, K., Mannheim, K., et al. 1995, A&A, 300, L21. https://arxiv.org/abs/astro-ph/9506087
- Grupe et al. (2013) Grupe, D., Komossa, S., Scharwächter, J., et al. 2013, AJ, 146, 78, doi: 10.1088/0004-6256/146/4/78
- Grupe et al. (2008) Grupe, D., Leighly, K. M., & Komossa, S. 2008, AJ, 136, 2343, doi: 10.1088/0004-6256/136/6/2343
- Grupe et al. (2007) Grupe, D., Schady, P., Leighly, K. M., et al. 2007, AJ, 133, 1988, doi: 10.1086/513072
- Hall et al. (2011) Hall, P. B., Anosov, K., White, R. L., et al. 2011, MNRAS, 411, 2653, doi: 10.1111/j.1365-2966.2010.17870.x
- Hamann (1998) Hamann, F. 1998, ApJ, 500, 798, doi: 10.1086/305776
- Hamann et al. (1997) Hamann, F., Barlow, T. A., Junkkarinen, V., & Burbidge, E. M. 1997, ApJ, 478, 80, doi: 10.1086/303781
- Hamann et al. (2013) Hamann, F., Chartas, G., McGraw, S., et al. 2013, MNRAS, 435, 133, doi: 10.1093/mnras/stt1231
- Hamann et al. (2011) Hamann, F., Kanekar, N., Prochaska, J. X., et al. 2011, MNRAS, 410, 1957, doi: 10.1111/j.1365-2966.2010.17575.x
- Hamann et al. (2008) Hamann, F., Kaplan, K. F., Rodríguez Hidalgo, P., Prochaska, J. X., & Herbert-Fort, S. 2008, MNRAS, 391, L39, doi: 10.1111/j.1745-3933.2008.00554.x
- Hamann et al. (2002) Hamann, F., Korista, K. T., Ferland, G. J., Warner, C., & Baldwin, J. 2002, ApJ, 564, 592, doi: 10.1086/324289
- Hamann & Sabra (2004) Hamann, F., & Sabra, B. 2004, Astronomical Society of the Pacific Conference Series, Vol. 311, The Diverse Nature of Intrinsic Absorbers in AGNs (Astronomical Society of the Pacific Conference Series), 203
- Hamann et al. (2001) Hamann, F. W., Barlow, T. A., Chaffee, F. C., Foltz, C. B., & Weymann, R. J. 2001, ApJ, 550, 142, doi: 10.1086/319733
- Hazlett et al. (2019) Hazlett, R., Leighly, K., Dabbieri, C., et al. 2019, in American Astronomical Society Meeting Abstracts, Vol. 233, American Astronomical Society Meeting Abstracts #233, 242.41
- Hemler et al. (2019) Hemler, Z. S., Grier, C. J., Brandt, W. N., et al. 2019, ApJ, 872, 21, doi: 10.3847/1538-4357/aaf1bf
- Hewett & Foltz (2003) Hewett, P. C., & Foltz, C. B. 2003, AJ, 125, 1784, doi: 10.1086/368392
- Hill et al. (2004) Hill, J. E., Burrows, D. N., Nousek, J. A., et al. 2004, in Society of Photo-Optical Instrumentation Engineers (SPIE) Conference Series, Vol. 5165, X-Ray and Gamma-Ray Instrumentation for Astronomy XIII, ed. K. A. Flanagan & O. H. W. Siegmund, 217–231, doi: 10.1117/12.505728
- Hopkins & Elvis (2010) Hopkins, P. F., & Elvis, M. 2010, MNRAS, 401, 7, doi: 10.1111/j.1365-2966.2009.15643.x
- Komossa et al. (2017) Komossa, S., Grupe, D., Schartel, N., et al. 2017, in New Frontiers in Black Hole Astrophysics, ed. A. Gomboc, Vol. 324, 168–171, doi: 10.1017/S1743921317001648
- Laor & Brandt (2002) Laor, A., & Brandt, W. N. 2002, ApJ, 569, 641, doi: 10.1086/339476
- Laor & Draine (1993) Laor, A., & Draine, B. T. 1993, ApJ, 402, 441, doi: 10.1086/172149
- Leighly et al. (2015) Leighly, K. M., Cooper, E., Grupe, D., Terndrup, D. M., & Komossa, S. 2015, ApJ, 809, L13, doi: 10.1088/2041-8205/809/1/L13
- Leighly et al. (2009) Leighly, K. M., Hamann, F., Casebeer, D. A., & Grupe, D. 2009, ApJ, 701, 176, doi: 10.1088/0004-637X/701/1/176
- Leighly et al. (2018) Leighly, K. M., Terndrup, D. M., Gallagher, S. C., Richards, G. T., & Dietrich, M. 2018, ApJ, 866, 7, doi: 10.3847/1538-4357/aadee6
- Leighly et al. (2019) Leighly, K. M., Terndrup, D. M., Lucy, A. B., et al. 2019, ApJ, 879, 27, doi: 10.3847/1538-4357/ab212a
- Li et al. (2019) Li, J., Sun, M., Wang, T., He, Z., & Xue, Y. 2019, MNRAS, 487, 4592, doi: 10.1093/mnras/stz1393
- Lundgren et al. (2007) Lundgren, B. F., Wilhite, B. C., Brunner, R. J., et al. 2007, The Astrophysical Journal, 656, 73, doi: 10.1086/510202
- McGraw et al. (2015) McGraw, S. M., Shields, J. C., Hamann, F. W., et al. 2015, MNRAS, 453, 1379, doi: 10.1093/mnras/stv1697
- McGraw et al. (2017) McGraw, S. M., Brandt, W. N., Grier, C. J., et al. 2017, MNRAS, 469, 3163, doi: 10.1093/mnras/stx1063
- Netzer (2015) Netzer, H. 2015, ARA&A, 53, 365, doi: 10.1146/annurev-astro-082214-122302
- Planck Collaboration et al. (2020) Planck Collaboration, Aghanim, N., Akrami, Y., et al. 2020, A&A, 641, A6, doi: 10.1051/0004-6361/201833910
- Poole et al. (2008) Poole, T. S., Breeveld, A. A., Page, M. J., et al. 2008, MNRAS, 383, 627, doi: 10.1111/j.1365-2966.2007.12563.x
- Proga et al. (2000) Proga, D., Stone, J. M., & Kallman, T. R. 2000, ApJ, 543, 686, doi: 10.1086/317154
- Rogerson et al. (2018) Rogerson, J. A., Hall, P. B., Ahmed, N. S., et al. 2018, ApJ, 862, 22, doi: 10.3847/1538-4357/aabfe5
- Roming et al. (2005) Roming, P. W. A., Kennedy, T. E., Mason, K. O., et al. 2005, Space Sci. Rev., 120, 95, doi: 10.1007/s11214-005-5095-4
- Roming et al. (2009) Roming, P. W. A., Koch, T. S., Oates, S. R., et al. 2009, ApJ, 690, 163, doi: 10.1088/0004-637X/690/1/163
- Sabra & Hamann (2005) Sabra, B. M., & Hamann, F. 2005, arXiv e-prints, astro. https://arxiv.org/abs/astro-ph/0509421
- Savage & Sembach (1991) Savage, B. D., & Sembach, K. R. 1991, ApJ, 379, 245, doi: 10.1086/170498
- Schlegel et al. (1998) Schlegel, D. J., Finkbeiner, D. P., & Davis, M. 1998, ApJ, 500, 525, doi: 10.1086/305772
- Temple et al. (2021) Temple, M. J., Ferland, G. J., Rankine, A. L., Chatzikos, M., & Hewett, P. C. 2021, MNRAS, 505, 3247, doi: 10.1093/mnras/stab1610
- Vivek (2019) Vivek, M. 2019, MNRAS, 486, 2379, doi: 10.1093/mnras/stz947
- Vivek et al. (2018) Vivek, M., Srianand, R., & Dawson, K. S. 2018, MNRAS, 481, 5570, doi: 10.1093/mnras/sty2712
- Vivek et al. (2016) Vivek, M., Srianand, R., & Gupta, N. 2016, MNRAS, 455, 136, doi: 10.1093/mnras/stv2240
- Vivek et al. (2012a) Vivek, M., Srianand, R., Mahabal, A., & Kuriakose, V. C. 2012a, MNRAS, 421, L107, doi: 10.1111/j.1745-3933.2012.01216.x
- Vivek et al. (2014) Vivek, M., Srianand, R., Petitjean, P., et al. 2014, MNRAS, 440, 799, doi: 10.1093/mnras/stu288
- Vivek et al. (2012b) —. 2012b, MNRAS, 423, 2879, doi: 10.1111/j.1365-2966.2012.21098.x
- Voges et al. (1999) Voges, W., Aschenbach, B., Boller, T., et al. 1999, A&A, 349, 389. https://arxiv.org/abs/astro-ph/9909315
- Wang et al. (2015) Wang, T., Yang, C., Wang, H., & Ferland, G. 2015, ApJ, 814, 150, doi: 10.1088/0004-637X/814/2/150
- Weymann et al. (1991) Weymann, R. J., Morris, S. L., Foltz, C. B., & Hewett, P. C. 1991, ApJ, 373, 23, doi: 10.1086/170020
- Wildy et al. (2015) Wildy, C., Goad, M. R., & Allen, J. T. 2015, MNRAS, 448, 2397, doi: 10.1093/mnras/stv142