How a table modulates the risk of airborne transmission between facing individuals
Abstract
Airborne transmission has been recognized as an important route of transmission for SARS-CoV-2, the virus responsible for the COVID-19 pandemic. While coughing and sneezing are spectacular sources of production of infected aerosols with far-reaching airflows, the prevalence of asymptomatic transmissions highlighted the importance of social activities. Gathering around a table, a common scenario of human interactions, not only fixes a typical distance between static interlocutors, but influences airborne transmission, by serving both as a flow diverter and a surface for droplet deposition. Here, we use high-fidelity large-eddy simulations to characterize short-range airborne transmission when two people face each other at a typical table. We show that compared to the natural distance travelled by free buoyant puffs and jets, the distance between the table and the emission constitutes a new length scale that modifies downward exhaled flows, common during nose breathing, speech, and laughter. When the table is close to the emitter, its main effect is to restrict the forward spread of emitted particles. However, if the distance between individuals is too short, particles reaching the recipient become more concentrated, rising transmission risks. Additionally, simulations of forceful exhalations, like laughter, demonstrate that the table acts as a filter that collects medium-sized particles that would have remained in the free jet otherwise, but can in that case be involved in the fomite transmission route. The table introduces a cut-off size for particles that depends on the inertia of the exhaled material, thereby modifying the size distribution of particles suspended in the air.
Human expiratory flows and airborne transmission
00footnotetext: *Corresponding author: simon.mendez@umontpellier.frMore than four years after the onset of the Coronavirus disease 2019 (COVID-19) pandemic, caused by the severe acute respiratory syndrome coronavirus 2 (SARS-CoV-2), the time for emergency is over. Nevertheless, the terrible human and economic costs of the pandemic, the possible emergence of similar viruses or new variants of SARS-CoV-2 [1], constitute formidable motivations to elucidate the biological, physical and social mechanisms at play in the transmission of such a disease [2, 3, 4, 5, 6]. In particular, the question of how microenvironments modulate the transmission risks remains acute [7] to define relevant public policies.
In airborne transmission of respiratory diseases, susceptible people get infected after inhaling viruses contained in particles suspended in the air, previously emitted by an infected individual [8, 9, 2, 10]. Respiratory droplets are emitted during all expiratory activities, their number and size distribution depending on the activity and on inter-individual factors [11, 12, 13, 14, 15]. After their emission, the size of the particles evolves in the air due to the evaporation of their water content. While leaving the mouth and/or the nose, they are accompanied with a mass of warm, humid air. The associated buoyant and turbulent flows modulate the transport of pathogen-laden particles in two principal ways: First, compared to isolated droplets, the settling time of suspended droplets is increased due to their entrapment in the turbulent flow [16]. Second, the evaporation is delayed, the humid and warm expiratory air flows creating a buffer between the droplets and the environment, which is often colder and drier [10, 17].
Many studies have been dedicated to coughing and sneezing puff flows from symptomatic individuals [18, 16, 17, 10]. Recently, the importance of presymptomatic, paucisymptomatic, and asymptomatic transmissions of COVID-19 [19] has highlighted that expiratory modes such as breathing and speech had been overlooked [20, 21, 22, 23, 24, 25, 26]. From the flow point of view, breathing and speaking are characterized by successive puffs that may coalesce to form jet-like flows in the far field [22, 23, 24]. In addition, flow rates, mouth positions and flow directions vary during speech [22, 27], possibly generating upward, forward and downward puffs, so that the knowledge gathered for coughs and sneezes is not directly transferable to speech [22, 28].
Superspreading events in indoor settings [29, 30] have shed light on the long-range airborne transmission of SARS-CoV-2, for which exposure times and air renewal rates are critical [31, 8, 32]. On the other hand, in everyday conversations, people may keep a short distance from each other, which significantly reduces the time and length scales relevant to the airborne transmission. In such ‘short-range’ situations, the fine details of the expiratory air flows and droplet transport are crucial [2, 7], which has for instance motivated the study of temperature and ambient air currents effects [33, 34].
However, case-control studies have shown that frequenting places that offer on-site eating and drinking are risk factors for contracting COVID-19 [35, 36]. Indeed, in restaurants, bars and coffee shops for instance, people sit, unmasked, around a table, which fixes a distance of the order of a meter between them. The table is a surface on which the largest emitted droplets may deposit, but it also modifies the air flows directed downwards, such as nose breathing, laughs [32] (see experimental illustrations in movies S1-S3) and some speech-associated puffs (like ‘ka’ or ‘ta’ [27] or in words ending with a ‘t’, such as ‘light’, for instance). Despite the interest of the table configuration for COVID-19 transmission, the specific studies are rare and do not detail the flow-table interaction [37, 26]. In particular, does the presence of a table help or prevent forward propagation? What is the impact of a table for different sizes of respiratory particles? Does it change the concentration in infected particles potentially reaching someone seating opposite an infected person?
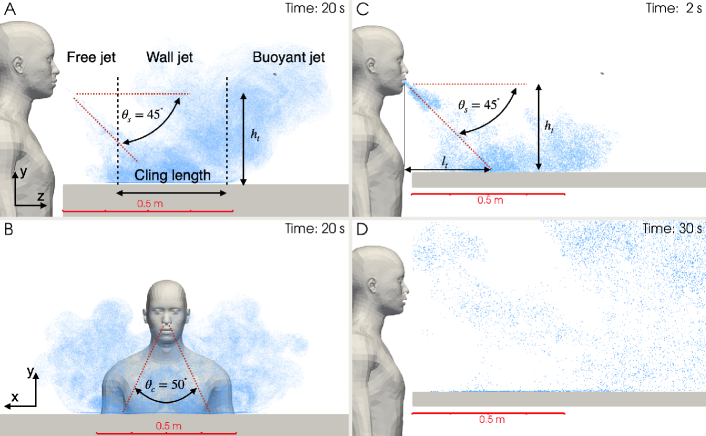
In this paper, we use numerical simulations of expiratory flows to explore those open questions. Focus is made on two configurations chosen to mimic archetypes of expiratory flows: nose breathing, in which periodic exhalations coalesce to form a jet interacting with the table, and laughter, with a sudden series of air expulsions forming a puff impacting on the table, which is also a model for coughs or strong speech flows, such as plosion utterances. The scenarios are illustrated in Fig. 1.
Breathing Flow
Nose breathing is first considered. During such a maneuver, emitted particles are less than a few microns in diameter and originate from the lower respiratory tract [15]. Their small size makes them readily transported by the exhaled flow and suspended for long times in the surrounding environment [8, 41]. The impact of evaporation on their trajectory is negligible. As a consequence, the trajectory of the exhaled particles is determined by the flow itself, which justifies focusing on the jet dynamics. Nose breathing flows are mainly characterised by three features [38]: 1) the flow rate is roughly periodic due to the successive exhalations and inhalations; 2) the flows are directed downward, with an angle in both the lateral and the vertical directions; 3) the exhaled air is generally warmer than the ambient environment. First, as observed for mouth breathing [22], we can expect that the periodic exhalation and inhalation only matters close to the nose, the puffs of the successive breaths coalescing to form two starting jets (one at each nostril). The initial vertical momentum of the warm jets is opposed to the body forces caused by the density difference between the exhaled air and surrounding environment, which makes the jets negatively buoyant [42, 43]. This is well visualised in Fig. 1A,B, where the exhaled jets descend, then lift, propagating over a horizontal distance of approximately one meter. The inertial and thermal effects can be quantified by the Reynolds number and the densimetric Froude number , with the time-averaged bulk velocity, the hydraulic diameter of a nostril, , with its surface area, the kinematic viscosity of air and the reduced gravity due to the density difference between the jet and the ambient fluid.
Nose breathing flow is investigated using cm, an exhaled volume rate of 15 L/min [38] and temperatures of for the exhaled air and for the ambient air (see the Materials and Methods). This yields and . A cycle of 4 s with 1 L exhaled per breath is repeated 20 times to compute 80 s of physical time (Fig. S1 shows the signal used). The jet is seeded at constant concentration with massless tracer particles, whose dynamics is essentially the same as the small droplets exhaled during nose breathing, allowing to characterize the cloud generated by the nose breathing along time. Using the residence time of tracers , which denotes the time since their injection, an average trajectory can be calculated as
| (1) |
is the coordinates vector of the th tracer emitted from nostril , the number of tracers injected at each nostril. The symmetry of the geometry with respect to yields an average trajectory in the (,) plane (see Fig. 1).
The trajectory of the unbounded jet (no-table), is shown in Fig. 2A (see also Fig. S2). Here we introduce the classical length scale to nondimensionalize the coordinates, which is further discussed below. The inclined, unbounded jet is initially momentum-driven and its trajectory first follows a straight line. As the jet gradually expands in the cross-stream direction, it decelerates due to both the entrainment of the ambient fluid and the opposing buoyancy force. Eventually, the buoyancy overcomes the vertical momentum flux, causing the jet to reach a terminal depth at before going upwards, along a skewed trajectory that is best characterised by quartic polynomial ([44], see also Fig. S2). The length scale indeed characterizes this transition from jet-like to plume-like motion [45]. It reads [43] (see the Materials and Methods). For the jet considered here, the mean value for is found to be approximately 30 cm.
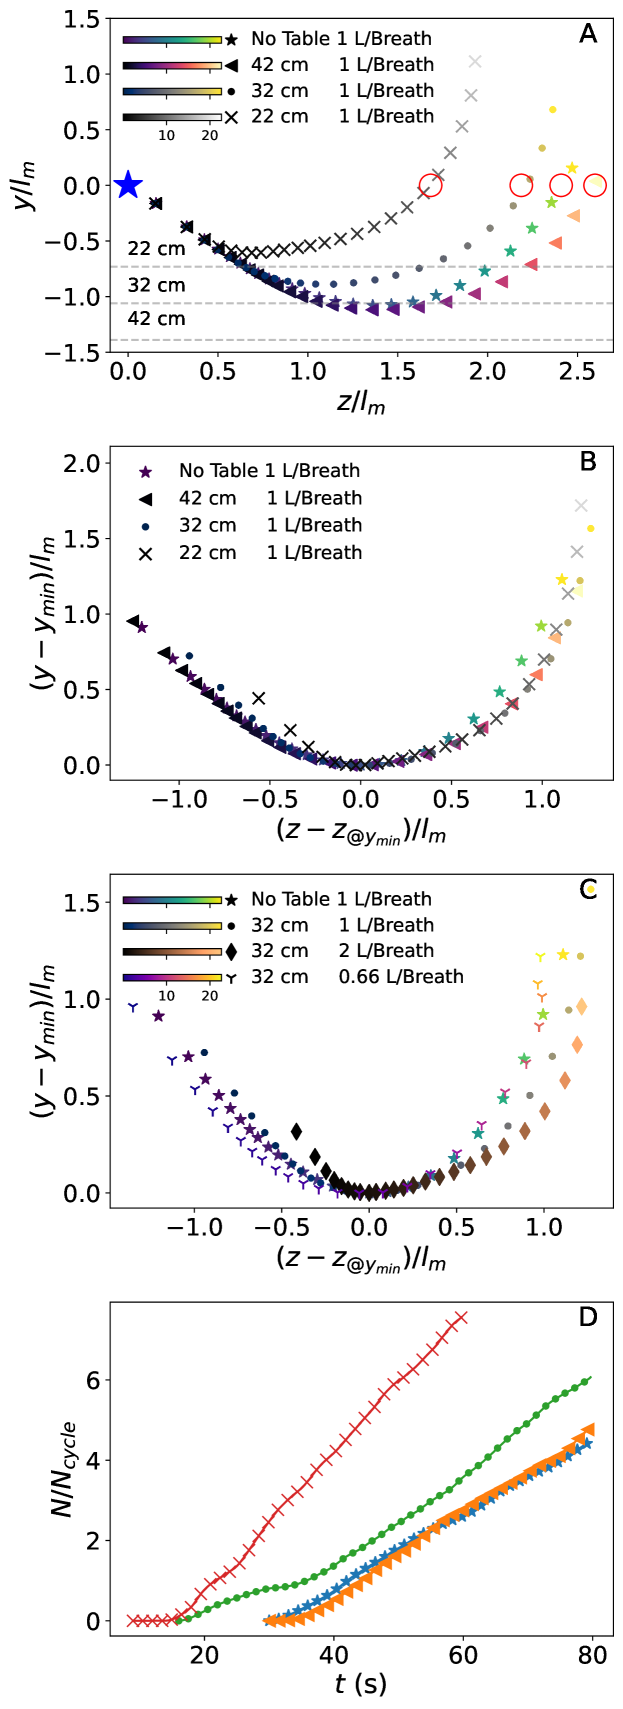
Clinging results from a ‘Coanda-like effect’ in the lower part of the jet, where the limited entrainment of the ambient air because of the wall creates a vertical pressure gradient, pulling the jet toward the surface. Sharp and Vyas explored the conditions that lead to the clinging of a jet (refer to Fig 5. in [39]). In the present case, clinging is estimated to occur for tables placed less than 48 cm (1.6 ) lower than the nose. Simulations of the interaction between breathing jets and a horizontal table are presented with three nose-wall separation heights: , , and cm (which correspond to 0.73 , 1.06 and 1.39 , respectively). Clinging is thus expected for the three cases [39].
In Fig. 2A, the average trajectories of the ‘table-jets’ are compared to that of the free jet. Initially, the table-jets develop as the unbounded jet. Then, the interaction with the table results in the formation of buoyant wall jets (see Fig. 1A and Movie S4). When the table is higher than the terminal height of the free jet trajectory (cases 22 cm and 32 cm), the jet development is strongly constrained, yielding a shorter penetration in the vertical and the horizontal directions. For lower table heights, the jet-wall interaction is less pronounced. Nevertheless, the convergence to the free-jet trajectory is not monotonic, as shown by the 42-cm case: the jet trajectory barely differs from the free jet in the descending region. However, due to clinging, the wall prevents the jet from lifting normally due to buoyancy forces [39], so that the jet is closer to the wall and forward penetration near the table is enhanced.
In order to compare the trajectories of the wall jets, they are plotted with their origin shifted to the location of the minimum vertical position (;) in Fig. 2B. It shows that the three wall jets trajectories actually superimpose in the ascending portion, even though the jets have interacted with the table at different distances from the source, and thus different velocity, diameter, Froude number: in particular, friction forces are different, as higher velocities are obtained closer to the wall when is small: the decrease in the forward motion is thus not related to viscous friction. The interpretation is that in the jet initial development, its diameter increases like , the distance from the emission and the local Froude number decreases like , so that the quantity is conserved at the jet-wall impact. Thus, even if the wall jets have different ratios of momentum and buoyancy forces, the characteristic length needed for the buoyancy forces to overcome the momentum forces is conserved, which yields similar ascending trajectories.
To explore the effect of exhaled volume on the propagation of breathing clouds, we use simulations for three different exhaled volumes (0.66, 1.0 and 2.0 L per breath, corresponding to approximately , and , respectively) at constant cm (Fig. 2C). The jet with the lowest breathing volume does not cling and behaves similarly to a free jet. However, for the clinging jets, the trajectory depends on the Froude number. For the largest breathed volume (2 L/cycle), a notable increase in the near-wall horizontal extent of the jet is observed. This is consistent with the non-linear behavior of cling length with predicted by Sharp and Vyas [39]). In cases with high Froude number, the trajectory near the wall becomes flatter due to the mitigation of buoyancy effects.
In turbulent jets, the concentration of the discharged material decreases as the inverse of the distance from the emission . Let us consider the height of the emitter’s nose () as the height at which infectious particles may be inhaled by an interlocutor. Fig. 2A shows that ‘table-jets’ at and cm return to by travelling a shorter distance than the free jet. As a consequence, they are expected to carry a larger density of infectious particles to a susceptible person reached by the jets. To quantify such an effect, we place fictive spherical probes of 5 cm radius at the positions of the jet-centerline where they reach , as shown by red markers in Fig. 2A. For each jet, we report the number of particles that have entered the spherical probe as a function of time (Fig. 2D), which provides a cumulative number of particles that may reach a susceptible interlocutor along time. First, differences between the free jet and the ‘42 cm’ table jet are small. On the contrary, transmission risks are increased in the ‘22 cm’ and ‘32 cm’ table-jets by two effects: first, the time at which the first particles reach the interlocutor’s face is smaller than for the free-jet; then, the slope of the curves, which informs about the particle flux, indicate that the local particle concentration opposite to the emitter is more intense in the table jets when (22 and 32 cm cases).
Laughing flow
While breathing flow is characterised by periodic exhalations at moderate Reynolds numbers, some of the human exhalation types are shorter and faster: shout, cough, laughter, sometimes speech, not to mention sneeze. We consider here a signal mimicking laughter, composed of 2 series several short and high-speed exhalations directed downwards as in laughter (see Fig. S1). Laughter can indeed generate high-speed downward flows [32], as illustrated by an experiment shown in movie S3 (and Fig. S5).
An inflow signal of 1.5 s per cycle is considered, with a flow rate profile that captures the intermittent feature of laughing flows with high-frequency bursts generating coalescent puffs: it consists of an exhalation of 1 s with 5 peaks at 2 to 3 L/s and an inhalation of 0.5 s. Two consecutive cycles are computed. The total volume exhaled is 1 L/cycle (see Table S1). The inflow is issued from a mouth in elliptic-like shape.
The maximum Reynolds number during the emission is approximately 11750. The flow is directed forward and downward, at an angle of with respect to the streamwise axis , and has a temperature of with relative humidity (RH) of 90. The flow is released into a still environment. Particles with initial diameters ranging from to with a uniform distribution are injected at the inflow with an initial velocity equal to that of the gas. These particles are used as a proxy for expiratory droplets and evaporate down to a minimum diameter. The evolution of the particle cloud is studied in the presence of a horizontal table located 40 cm lower than the person’s mouth (Fig. 1C,D), or without that table. In both cases, the emission lasts less than 3 s, but the simulation is continued without any input flow up to 125 s to study the particle cloud and associated flow dynamics.
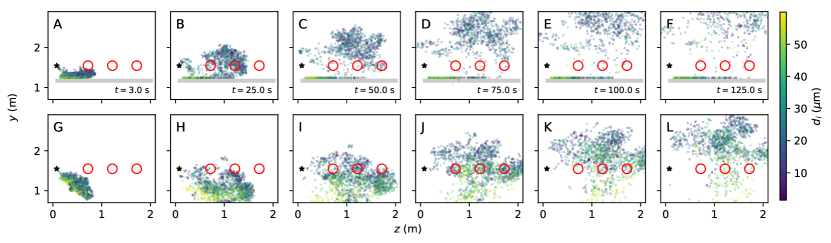
Fig. 3 shows the evolution in time of the particle cloud in both configurations. In the ‘no-table’ case (bottom row), the cloud is first dominated by inertia. When buoyancy overwhelms the vertical momentum, the cloud is deflected upwards, as shown by the dynamics of the smallest particles. The largest droplets leave the cloud early in the descent stage and are mostly settled out of the cloud during its ascent. As in the breathing flow cases, when a table is placed above the location of the terminal descent of the free jet, the exhaled flow impacts the table, which cancels its vertical momentum and limits its forward motion (top row). The maximum streamwise distance reached in the ‘no-table’ configuration is more than 2.5 m, but less than 2 m in the case with the table. A number of particles deposit on the table, which will be analyzed further.
In the table case, the ascending phase starts almost immediately after the puff injection (see Fig. 3A, s). This early deflection makes the puff rapidly reach potential interlocutors in front of the emitter. As the distance travelled from the source is proportional to and that the concentration field evolves as [46] in free puffs, we estimate that concentration varies with time as . Therefore, we predict that the ‘table-puff’ may carry a higher droplet concentration than free-puff would when reaching a receiver.
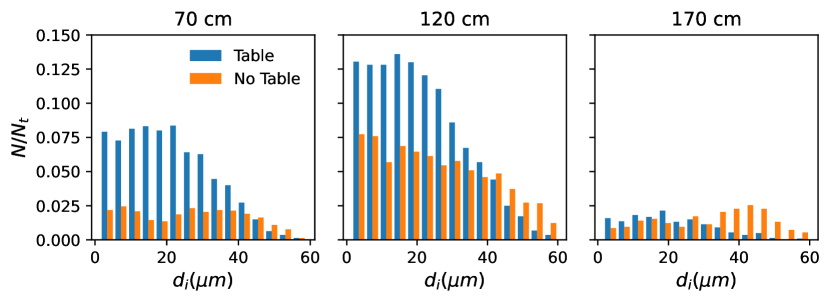
To quantify the impact of the table on the particles that may be inhaled by a person located in front of the emitter at different distances, three spherical probes with a radius of are placed opposite the emitter at 70, 120 and 170 cm. Fig.4A displays the histogram of diameters for the particles having entered those spheres during the simulation. At short distances, the puff-table interaction significantly increases the number of particles with an initial diameter less than , compared to the case without table. However, few particles reach the probe at cm. On the other hand, for the three locations considered, the number of droplets with an initial diameter larger than is larger without a table: in that case, flow motions counteract sedimentation and transport some of the largest droplets simulated to a height where they may be inhaled. The deposition of particles on the table is now examined to understand this difference.
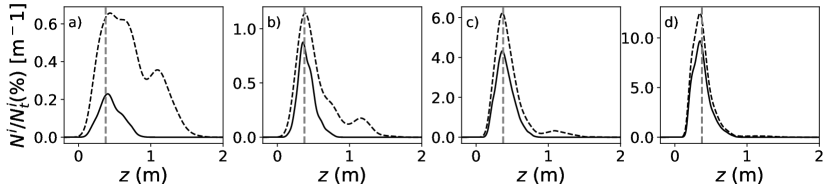
In Fig. 4B, we present the density in the direction of particles deposited over the table, integrated over the spanwise direction . (The integral over and is provided in Fig. S3.) Particles are grouped according to their initial diameter and results are plotted at 5 s, soon after the injection, and at 125 s. First, the different scales on the y-axes indicate that the proportion of deposited particles increase with their size (see also Fig. S3). Moreover, particles within the range rapidly deposit, as evidenced by the small differences between the 5 s and the 125 s curves: large particles actually impact on the table due to their initial inertia. The maximum deposition of these droplets occur near the geometric stagnation point, which is consistent with the deposition profile in impinging jets with large nozzle-to-surface distances [47]. In contrast, the deposition of smaller particles is more progressive in time and spans over a larger region: it is associated with their sedimentation from the cloud. Fig. 4B gathers results from the two cycles simulated. Differences between the two cycles are actually obtained for the smallest particles: the particles emitted during the first cycle are pushed further downstream and contribute more significantly to the deposition for m (see Fig. S4). Overall, the table acts as a filter that collects the largest particle at impact, which modifies the distribution of airborne particles and explains the absence of large airborne particles observed in Fig. 4A in the table case.
Conclusions
We have used large-eddy simulations to explore human expiratory flows and the associated particle transport around a table, to understand short-range airborne transmission from asymptomatic individuals in everyday social interactions, for example, in meetings and restaurants.
Different types of exhalations generate flows directed downwards which, in a colder medium, first have a straight trajectory before being deflected by buoyancy forces. If a table is located above the terminal depth reached by the puffs or jets, it obstructs the vertical penetration of flows and causes them to deviate earlier. While this shortens the forward propagation of the exhaled material, the flows also reach a susceptible person facing the emitter sooner since their injection, thus at higher concentration, potentially increasing pathogen exposure and transmission risk. We have shown that the presence of a table introduces a new length scale , the distance between the nose/mouth of the emitter and the table, which modifies the free flow dynamics as soon as it is shorter than the terminal penetration of the flow without table.
Finally, not only the table modifies the trajectory of the exhaled material, but also the content of the exhaled clouds. Indeed the impact of the flow on the table makes it an inertial impactor [48] that collects the largest particle. The table thus introduces a cut-off diameter for the particles able to remain suspended and participate to airborne transmission. As the response of inertial impactors is known to scale as the square root of the particle Stokes number [48], one expects that the cut-off particle diameter for impaction on the table evolves like the inverse of the square root of the inflow velocity: the faster the exhalation, the smaller the particles remaining in the air after impact. Interestingly, this also allows to provide new insights in the particles that would participate to the fomite transmission route after deposition on the table surface.
Like most short-range transmission studies [17, 22, 34], we investigated how an infected individual seeds the immediate surroundings with infectious particles, here in the presence of a table, and use airborne concentration as a proxy to transmission risk. The thermal boundary layer (TBL) due to the body temperature of the emitter has been neglected, the exhaled air velocities at the mouth/nose exit being much larger than those in the TBL, in particular in the presence of a table [49]. On the contrary, it would be necessary to account for the TBL of a susceptible interlocutor [23, 24] if they were explicitly included in the simulation. Indeed, including a second person in the simulation would be especially interesting in the cases where the emitted flow is sufficiently energetic to travel along the whole table and impact the second body. In that case, we may expect the transport of the airborne particles from the table to the person’s face to be influenced by their TBL.
By demonstrating the richness of the phenomena at play in a simple configuration, our study opens the way to numerous possibilities in short-range airborne transmission research, for instance by coupling geometrical, flow and thermal effects. In addition, it highlights the interest of investigating more fundamental situations, as the dynamics of impacting turbulent puffs, or unsteady effects in inertial impactors. We are only at the beginning of the investigation into the effects of geometry settings on the transmission of respiratory diseases.
Materials and Methods
Large-eddy simulations of the variable-density Navier-Stokes equations in the low-Mach regime were performed using the in-house flow solver YALES2BIO, already used in the airborne transmission context [22, 33]. Droplets are accounted for by a one-way spherical point-particle formalism accounting for drag and gravity forces. Their diameter evolve due to evaporation. They are assumed to be made of water, but include a non-volatile fraction that limits their evaporation: the final diameter is 1/3rd of the initial diameter, which corresponds to a non-volatile fraction of 3.7% [41].
Characteristics of human nasal respiration vary with various factors, such as anatomy, age, posture and physical activity, etc. [18]. Here, we do not aim to examine all possible flow conditions: we rather use values that are typical of breathing and explore the effect of some parameters, focusing on the interaction with a horizontal table. We define a 4 s cycle, with an exhalation time of 2.4 s (see Fig. S1).We set that jets are inclined by downwards with respect to the streamwise axis and and to to the symmetry plane (see Fig. 1). Breathing volume per breath is varied from 0.66 L to 2 L per breath, which is a heavy breathing. The hydraulic diameter of each nostril is cm, with its surface area =. 20 cycles are computed, for a total physical time of 80 s simulated. For Eq. 1, we consider particles with injection times ranging from 20 to 80 seconds to obtain well-converged trajectories from to , discarding the initial transient phase.
For the laugh flow, a 2-cycle signal previously used for speech [22] is compressed in time so that the exhalation in each cycle lasts 1 s and the exhaled volume per cycle is 1 L (see Fig. S1). The flow exits from an elliptic mouth surface of hydraulic diameter . After the 2 cycles of injection, a large puff is formed. The simulation is continued until without any flow rate at the mouth.
For the laugh flow, we have used a temperature of C, classical in human exhalation studies. For the nose breathing, a temperature of C has been used, to render the heat exchange role of the nose. However, the absolute values are only indicative, the important figures being obviously the non-dimensional numbers that quantify the relative effects of the different physics involved. Relative humidity has been set to in the exhaled air and in the ambient air, whose temperature is fixed to C. A more detailed characterization of the flows are provided in the SI.
The length scale , representing the transition from jet-like to plume-like motion, is derived through dimensional analysis as = . , are the specific fluxes of momentum and buoyancy [43], defined as , with , , and the densimetric Froude number, the jet velocity, the reduced gravity and the nostril diameter, respectively.
Acknowledgments
The setup of the CFD simulations was designed with P. Bénard, G. Lartigue, V. Moureau (CORIA, France), G. Balarac, P. Bégou (LEGI, France), Y. Dubief (Univ. Vermont, USA) and R. Mercier (Safran Tech, France). CFD simulations were performed using HPC resources from TGCC-IRENE (Grants No. A0100312498 to A0140312498). This work was funded by the Agence Nationale de la Recherche, project TransporTable (ANR-21-CO15-0002) as well as by the LabEx NUMEV (ANR-10-LABX-0020) under the SATIS project, within the I-Site MUSE (ANR-16-IDEX-0006).
References
- [1] Alessandro M Carabelli, Thomas P Peacock, Lucy G Thorne, William T Harvey, Joseph Hughes, COVID-19 Genomics UK Consortium de Silva Thushan I. 6, Sharon J Peacock, Wendy S Barclay, Thushan I de Silva, Greg J Towers, et al. SARS-CoV-2 variant biology: immune escape, transmission and fitness. Nature Reviews Microbiology, 21(3):162–177, 2023.
- [2] Chia C. Wang, Kimberly A. Prather, Josué Sznitman, Jose L. Jimenez, Seema S. Lakdawala, Zeynep Tufekci, and Linsey C. Marr. Airborne transmission of respiratory viruses. Science, 373, 8 2021.
- [3] Vincenzo Galasso, Vincent Pons, Paola Profeta, Michael Becher, Sylvain Brouard, and Martial Foucault. Gender differences in COVID-19 attitudes and behavior: Panel evidence from eight countries. Proceedings of the National Academy of Sciences, 117(44):27285–27291, 2020.
- [4] Renyi Zhang, Yixin Li, Annie L. Zhang, Yuan Wang, and Mario J. Molina. Identifying airborne transmission as the dominant route for the spread of COVID-19. Proceedings of the National Academy of Sciences, 117(26):14857–14863, 2020.
- [5] Fernanda Crunfli et. al. Morphological, cellular, and molecular basis of brain infection in COVID-19 patients. Proceedings of the National Academy of Sciences, 119(35):e2200960119, 2022.
- [6] Jeremy Howard, Austin Huang, Zhiyuan Li, Zeynep Tufekci, Vladimir Zdimal, Helene-Mari van der Westhuizen, Arne von Delft, Amy Price, Lex Fridman, Lei-Han Tang, Viola Tang, Gregory L. Watson, Christina E. Bax, Reshama Shaikh, Frederik Questier, Danny Hernandez, Larry F. Chu, Christina M. Ramirez, and Anne W. Rimoin. An evidence review of face masks against COVID-19. Proceedings of the National Academy of Sciences, 118(4):e2014564118, 2021.
- [7] Peter V Nielsen and Chunwen Xu. Multiple airflow patterns in human microenvironment and the influence on short-distance airborne cross-infection–a review. Indoor and Built Environment, 31(5):1161–1175, 2022.
- [8] Lidia Morawska and Junji Cao. Airborne transmission of SARS-CoV-2: The world should face the reality. Environment International, 139:105730, 2020.
- [9] S Balachandar, Stephane Zaleski, Alfredo Soldati, Goodarz Ahmadi, and Lydia Bourouiba. Host-to-host airborne transmission as a multiphase flow problem for science-based social distance guidelines. International Journal of Multiphase Flow, 132:103439, 2020.
- [10] Lydia Bourouiba. The fluid dynamics of disease transmission. Annual Review of Fluid Mechanics, 53:473–508, 2021.
- [11] GR Johnson, Lidia Morawska, ZD Ristovski, Megan Hargreaves, Kerrie Mengersen, CY Hang Chao, MP Wan, Y Li, Xaiojan Xie, David Katoshevski, et al. Modality of human expired aerosol size distributions. Journal of Aerosol Science, 42(12):839–851, 2011.
- [12] William F Wells. On air-borne infection: study ii. droplets and droplet nuclei. American Journal of Epidemiology, 20(3):611–618, 1934.
- [13] Sima Asadi, Anthony S Wexler, Christopher D Cappa, Santiago Barreda, Nicole M Bouvier, and William D Ristenpart. Effect of voicing and articulation manner on aerosol particle emission during human speech. PloS ONE, 15(1):e0227699, 2020.
- [14] David A. Edwards, Dennis Ausiello, Jonathan Salzman, Tom Devlin, Robert Langer, Brandon J. Beddingfield, Alyssa C. Fears, Lara A. Doyle-Meyers, Rachel K. Redmann, Stephanie Z. Killeen, Nicholas J. Maness, and Chad J. Roy. Exhaled aerosol increases with COVID-19 infection, age, and obesity. Proceedings of the National Academy of Sciences, 118(8):e2021830118, 2021.
- [15] Gholamhossein Bagheri, Oliver Schlenczek, Laura Turco, Birte Thiede, Katja Stieger, Jana M. Kosub, Sigrid Clauberg, Mira L. Pöhlker, Christopher Pöhlker, Jan Moláček, Simone Scheithauer, and Eberhard Bodenschatz. Size, concentration, and origin of human exhaled particles and their dependence on human factors with implications on infection transmission. Journal of Aerosol Science, 168:106102, 2023.
- [16] Lydia Bourouiba, Eline Dehandschoewercker, and John WM Bush. Violent expiratory events: on coughing and sneezing. Journal of Fluid Mechanics, 745:537–563, 2014.
- [17] Kai Leong Chong, Chong Shen Ng, Naoki Hori, Rui Yang, Roberto Verzicco, and Detlef Lohse. Extended lifetime of respiratory droplets in a turbulent vapor puff and its implications on airborne disease transmission. Physical Review Letters, 126(3):034502, 2021.
- [18] Jitendra K Gupta, C-H Lin, and Q Chen. Flow dynamics and characterization of a cough. Indoor air, 19(6):517–525, 2009.
- [19] Daniel P Oran and Eric J Topol. Prevalence of asymptomatic SARS-CoV-2 infection: a narrative review. Annals of Internal Medicine, 173(5):362–367, 2020.
- [20] Valentyn Stadnytskyi, Christina E Bax, Adriaan Bax, and Philip Anfinrud. The airborne lifetime of small speech droplets and their potential importance in SARS-CoV-2 transmission. Proceedings of the National Academy of Sciences, 117(22):11875–11877, 2020.
- [21] Siyao Shao, Dezhi Zhou, Ruichen He, Jiaqi Li, Shufan Zou, Kevin Mallery, Santosh Kumar, Suo Yang, and Jiarong Hong. Risk assessment of airborne transmission of COVID-19 by asymptomatic individuals under different practical settings. Journal of Aerosol Science, 151:105661, 2021.
- [22] Manouk Abkarian, Simon Mendez, Nan Xue, Fan Yang, and Howard A Stone. Speech can produce jet-like transport relevant to asymptomatic spreading of virus. Proceedings of the National Academy of Sciences, 117(41):25237–25245, 2020.
- [23] Arghyanir Giri, Neelakash Biswas, Danielle L Chase, Nan Xue, Manouk Abkarian, Simon Mendez, Sandeep Saha, and Howard A Stone. Colliding respiratory jets as a mechanism of air exchange and pathogen transport during conversations. Journal of Fluid Mechanics, 930, 2022.
- [24] Rohit Singhal, S Ravichandran, Rama Govindarajan, and Sourabh S Diwan. Virus transmission by aerosol transport during short conversations. Flow, 2, 2022.
- [25] G. Cortellessa, L. Stabile, F. Arpino, D. E. Faleiros, W. van den Bos, L. Morawska, and G. Buonanno. Close proximity risk assessment for SARS-CoV-2 infection. Science of The Total Environment, 794:148749, 11 2021.
- [26] David Engler Faleiros, Wouter van den Bos, Lorenzo Botto, and Fulvio Scarano. TU Delft COVID-app: A tool to democratize CFD simulations for SARS-CoV-2 infection risk analysis. Science of the Total Environment, 826:154143, 2022.
- [27] M. Abkarian and H. A. Stone. Stretching and break-up of saliva filaments during speech: A route for pathogen aerosolization and its potential mitigation. Physical Review Fluids, 5:102301, Oct 2020.
- [28] Julian W Tang, Andre DG Nicolle, Jovan Pantelic, Mingxiu Jiang, Chandra Sekhr, David KW Cheong, and Kwok Wai Tham. Qualitative real-time schlieren and shadowgraph imaging of human exhaled airflows: an aid to aerosol infection control. PLoS ONE, 6(6):e21392, 2011.
- [29] Shelly L. Miller, William W. Nazaroff, Jose L. Jimenez, Atze Boerstra, Giorgio Buonanno, Stephanie J. Dancer, Jarek Kurnitski, Linsey C. Marr, Lidia Morawska, and Catherine Noakes. Transmission of SARS-CoV-2 by inhalation of respiratory aerosol in the Skagit Valley Chorale superspreading event. Indoor Air, 31:314–323, 3 2021.
- [30] Parham Azimi, Zahra Keshavarz, Jose Guillermo Cedeno Laurent, Brent Stephens, and Joseph G Allen. Mechanistic transmission modeling of COVID-19 on the Diamond Princess cruise ship demonstrates the importance of aerosol transmission. Proceedings of the National Academy of Sciences, 118(8):e2015482118, 2021.
- [31] Martin Z Bazant and John WM Bush. A guideline to limit indoor airborne transmission of COVID-19. Proceedings of the National Academy of Sciences, 118(17):e2018995118, 2021.
- [32] Rajesh K Bhagat, MS Davies Wykes, Stuart B Dalziel, and PF Linden. Effects of ventilation on the indoor spread of COVID-19. Journal of Fluid Mechanics, 903, 2020.
- [33] Simon Mendez, Willy Garcia, and Alexandre Nicolas. From microscopic droplets to macroscopic crowds: Crossing the scales in models of short-range respiratory disease transmission, with application to COVID-19. Advanced Science, 10(19):2205255, 2023.
- [34] Jietuo Wang, Mobin Alipour, Giovanni Soligo, Alessio Roccon, Marco De Paoli, Francesco Picano, and Alfredo Soldati. Short-range exposure to airborne virus transmission and current guidelines. Proceedings of the National Academy of Sciences, 118, 9 2021.
- [35] Kiva A Fisher, Mark W Tenforde, Leora R Feldstein, Christopher J Lindsell, Nathan I Shapiro, D Clark Files, Kevin W Gibbs, Heidi L Erickson, Matthew E Prekker, Jay S Steingrub, et al. Community and close contact exposures associated with COVID-19 among symptomatic adults 18 years in 11 outpatient health care facilities — United States, July 2020. Morbidity and Mortality Weekly Report, 69(36):1258, 2020.
- [36] Simon Galmiche, Tiffany Charmet, Laura Schaeffer, Juliette Paireau, Rebecca Grant, Olivia Chény, Cassandre Von Platen, Alexandra Maurizot, Carole Blanc, Annika Dinis, et al. Exposures associated with sars-cov-2 infection in france: a nationwide online case-control study. The Lancet Regional Health–Europe, 7, 2021.
- [37] Shirun Ding, Jia Shing Lee, Mohamed Arif Mohamed, and Bing Feng Ng. Infection risk of SARS-CoV-2 in a dining setting: Deposited droplets and aerosols. Building and Environment, 213:108888, 2022.
- [38] Jitendra K Gupta, Chao-Hsin Lin, and Qingyan Chen. Characterizing exhaled airflow from breathing and talking. Indoor air, 20(1):31–39, 2010.
- [39] JJ Sharp and BD Vyas. The buoyant wall jet. Proceedings of the Institution of Civil Engineers, 63(3):593–611, 1977.
- [40] HC Burridge and GR Hunt. From free jets to clinging wall jets: The influence of a horizontal boundary on a horizontally forced buoyant jet. Physical Review Fluids, 2(2):023501, 2017.
- [41] Roland R. Netz and William A. Eaton. Physics of virus transmission by speaking droplets. Proceedings of the National Academy of Sciences, 9 2020.
- [42] James S Turner. Jets and plumes with negative or reversing buoyancy. Journal of Fluid Mechanics, 26(4):779–792, 1966.
- [43] Hugo B Fischer, John E List, C Robert Koh, Jorg Imberger, Robert CY Koh, and Norman H Brooks. Mixing in inland and coastal waters. Academic press, 1979.
- [44] Ilias G Papakonstantis and George C Christodoulou. Simplified modelling of inclined turbulent dense jets. Fluids, 5(4):204, 2020.
- [45] Philip JW Roberts, Adrian Ferrier, and Greg Daviero. Mixing in inclined dense jets. Journal of Hydraulic Engineering, 123(8):693–699, 1997.
- [46] R. Sangras, O. C. Kwon, and G. M. Faeth. Self-preserving properties of unsteady round nonbuoyant turbulent starting jets and puffs in still fluids. J. Heat Transfer, 124(3):460–469, 2002.
- [47] Wes Burwash, Warren Finlay, and Edgar Matida. Deposition of particles by a confined impinging jet onto a flat surface at Re= . Aerosol Science and Technology, 40(3):147–156, 2006.
- [48] Virgil A Marple and Benjamin YH Liu. Characteristics of laminar jet impactors. Environmental Science & Technology, 8(7):648–654, 1974.
- [49] Dusan Licina, Jovan Pantelic, Arsen Melikov, Chandra Sekhar, and Kwok Wai Tham. Experimental investigation of the human convective boundary layer in a quiescent indoor environment. Building and Environment, 75:79–91, 2014.