subsubsection
myAURA: Personalized health library for epilepsy management via knowledge graph sparsification and visualization
Abstract
Objective — We report the development of the patient-centered myAURA application and suite of methods designed to aid epilepsy patients, caregivers, and researchers in making decisions about care and self- management.
Materials and Methods — myAURA rests on the federation of an unprecedented collection of heterogeneous data resources relevant to epilepsy, such as biomedical databases, social media, and electronic health records. A generalizable, open-source methodology was developed to compute a multi-layer knowledge graph linking all this heterogeneous data via the terms of a human-centered biomedical dictionary.
Results — The power of the approach is first exemplified in the study of the drug-drug interaction phenomenon. Furthermore, we employ a novel network sparsification methodology using the metric backbone of weighted graphs, which reveals the most important edges for inference, recommendation, and visualization, such as pharmacology factors patients discuss on social media. The network sparsification approach also allows us to extract focused digital cohorts from social media whose discourse is more relevant to epilepsy or other biomedical problems. Finally, we present our patient-centered design and pilot-testing of myAURA, including its user interface, based on focus groups and other stakeholder input.
Discussion — The ability to search and explore myAURA’s heterogeneous data sources via a sparsified multi-layer knowledge graph, as well as the combination of those layers in a single map, are useful features for integrating relevant information for epilepsy.
Conclusion — Our stakeholder-driven, scalable approach to integrate traditional and non-traditional data sources, enables biomedical discovery and data-powered patient self-management in epilepsy, and is generalizable to other chronic conditions.
Keywords: Personal health libraries, Epilepsy, Chronic disease, Patient self-management, Network inference, Network visualization, Social media mining, Electronic health records, Human-centered design, Data federation, Heterogeneous data.
1 Introduction
Epilepsy is a chronic neurological disorder that affects more than 3.4 million Americans and 65 million people worldwide [1, 2]. People with epilepsy (PWE) are at risk for lower quality of life, social isolation, depression, anxiety, medication-related symptoms, and premature death [1, 2, 3, 4, 5, 6, 7, 8, 9, 10]. Exacerbating these risks, PWE can wait up to 9 months to get a neurologist appointment and 6 months more to see an epileptologist, so many PWE are treated by general practitioners as they wait [3, 11, 12, 13, 14]. Thus, alongside specialized medical care, self-management by PWE and their caregivers (PWEC) becomes essential for achieving desirable health outcomes [3]. However, PWEC face uncertainty due to a daunting array of options about treatments, drugs, drug interactions and side effects, diet, lifestyle, and stigma. Indeed, chronic health conditions unfold as a complex interplay among all these biological, psychological, and societal factors that change over time. While much recent research has aimed to help patients retrieve health information online, the abundance PWEC typically discover from heterogeneous data sources makes it more difficult to distinguish the best treatment options available or even the relevance of information to an individual case.
Integrated and individualized information retrieval, as a personal health library, thus has a clear role to play in improving health outcomes for PWE and, indeed, anyone with a chronic health condition. Qualitative and quantitative studies [7, 15, 16], including those pursued under our project [17, 18], show a clear need for visually engaging, easy-to-use, online tools for two key purposes: (i) to extract, classify, organize, and personalize information; and (ii) to provide automated recommendations in support of evidence-based decisions about treatment and self-management. Despite the importance, there are currently no such online tools that integrate relevant information for PWEC. They must conduct multiple separate searches of many different resources and manually comb through an array of often irrelevant and confusing results.
Here we present milestones of the ongoing myAURA interdisciplinary project that aims to address this problem directly with data- and network-science methods to integrate multiple resources into a personalized, easy-to-use web service for PWEC. To design this service according to their needs, our interdisciplinary team of experts in biomedical informatics, text and social media mining, visualization, user interface design, and epilepsy self-management work with patients, caregivers, and their advocates. We also leverage a collaboration with important stakeholders at the Epilepsy Foundation of America (EFA), through an exclusive use agreement to obtain PWEC data from their website, discussion groups, and social media presence, and to recruit PWEC for our user study group and to provide general feedback about results. All of this goes into computing a large-scale epilepsy knowledge graph, comprised of a set of networks associating data from heterogeneous data sources relevant to PWEC. In addition, we discuss how computing its metric backbone, a network sparsification method based on removing edges that are redundant for shortest path computation [19], yields a powerful method to infer, identify, visualize, and recommend personalized, relevant information for PWEC.
We also summarize our patient-centered methodology for designing a myAURA application, with input from PWEC. Per stakeholder needs and human-centered design specifications, when fully deployed, myAURA will integrate practical, location- and patient-specific health-care information with targeted scientific literature, biomedical databases, social media platforms, and epilepsy-related websites with information about specialists, clinical trials, drugs, community resources, and chat rooms. The innovative data- and network-science methods that myAURA is designed upon drive the following three research aims:
-
1.
Produce a multi-layer epilepsy knowledge graph by federating heterogeneous sources of large-scale data such as social media, electronic health records (EHR), patient discussion boards, scientific literature databases, and advocacy websites. This knowledge graph is built with epilepsy-focused terminology including the tagging of symptoms and medications.
-
2.
Develop recommendation and visualization algorithms based on automatically extracting the metric backbone of the knowledge graph, which, by reducing redundant edges, is likely to contain the information associations most relevant to a specific user’s interests.
-
3.
Design and pilot test myAURA using focus groups studies that survey PWEC regarding their desired myAURA content and its format, including interaction with mock-ups of the myAURA interface to solicit suggestions for a more usable, valuable, and effective application.
In summary, our immediate-goal as detailed in the following is to produce and visualize a knowledge graph representation of heterogeneous resources useful to PWEC. The epilepsy knowledge graph supports a user-friendly web service to facilitate PWEC self-management and we also report on the interface design built from PWEC focus groups, as well as design requirements for other similar applications. Our long-term goal is to generate a personal health library for PWEC and in so doing create a method that can be generalized to support self-management of other chronic diseases.
2 Data and Methods
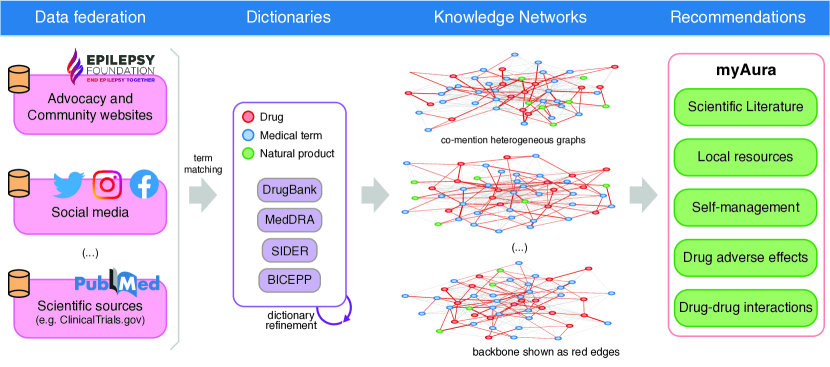
A vital requirement for developing patient-centered tools is integrating information resources relevant to end-users. To ensure that myAURA meets the needs of PWEC, we not only engage them in its development, but also federate on their behalf data from epilepsy-specific advocacy and community websites, social media, EHR, research literature, and clinical and pharmacology databases. We process the data from these resources to produce various large-scale knowledge networks [20, 21] that are amenable to analysis with the powerful tools of network science [22, 23, 24, 25] and machine learning [26, 27]. The overall architecture is depicted in Figure 1.
2.1 Data federation and processing
In our federated database architecture we included two main groups of resources relevant to epilepsy and PWEC.
2.1.1 Social media and community websites
We have previously demonstrated the utility of social media data in the study of epilepsy and other biomedical problems [10, 28, 29, 30, 31, 32, 33], and here included digital cohorts from Instagram, X (Twitter), Reddit, Facebook, YouTube comments, and the EFA website forums and Facebook discussion wall as detailed below.
Instagram currently has more than 1.2 billion monthly active users. The current study uses a dataset collected between October 2010 and January 2016 via its API [29, 28]. This epilepsy-specific digital cohort contains 9,890 complete user timelines, i.e. all time-stamped posts of users who posted at least once about a drug used to treat epilepsy, resulting in a total of 8,496,124 posts.
From X (Twitter), using the historical gardenhose and the OSoMe data and tool set [34], we collected a random sample of 700,000 user timelines from from which we selected and processed 5,958 complete timelines with same criteria as for Instagram, containing 14,152,929 posts.
Reddit is a user-moderated forum organized into over 100 thousand sub-forums called subreddits that are devoted to specialized topics. Reddit has over 57 million daily active unique user accounts and more than 13 billion posts and comments. Of particular interest is the r/Epilepsy subreddit, which is devoted to PWEC. This subreddit has been active since August 2010 and has more than 30 thousand unique users who have posted more than 277,367 comments/posts (typically larger than posts on Instagram or X). For more direct comparison with Instagram and X, we identified a subcohort of users who posted at least once about a drug used to treat epilepsy. Their timelines contain a total of posts that, unless otherwise noted, comprise our epilepsy digital cohort for Reddit.
YouTube, used by an estimated 81 percent of Americans in 2021, is the most popular social media platform in the US. Via its API, using the same criteria as for Instagram and X, we collected a digital cohort of more than 2 thousand users who have explicitly mentioned drugs used in the treatment of epilepsy, from a population of more than 330 thousand users who have engaged with epilepsy-related content over an 18-year period.
From Facebook, with support from the EFA and via a specially-developed application, we collected a small cohort of entire timelines of 12 victims of Sudden Unexpected Death in Epilepsy (SUDEP) for a study suggesting that SUDEP victims observe increased activity on Facebook prior to death [10].
In summary, we collected over 48K complete user timelines, with over 23M posts, of X, Instagram, Reddit, YouTube and Facebook users who posted at least once about drugs related to epilepsy, or participated in forums on the topic (e.g., r/Epilepsy on Reddit).
While the social media sites provide large and broad platforms for investigating health-related signals, advocacy and community websites provide data specific to epilepsy. Via an exclusive use agreement, we have access to the EFA website (epilepsy.com), with more than 1 million unique user visits per month, and its highly used message boards, chat rooms, comment threads, and the MyEpilepsyDiary (which allows users of the EFA website to track medications, seizures, triggers, side effects, and symptoms). Indeed, the social activity on the site is akin to those on social media [28] with the added research benefit that they are focused on the target PWEC community and their activities and health considerations. Data was collected from 2004-2016, and it includes timelines of 22,938 active users with a total of 111,075 posts—the subcohort of users who posted at least once about a drug used to treat epilepsy is comprised of 8,488 user timelines with a total of 78,948 posts. Additionally, we have been granted access to the EFA Facebook page, which has recently substituted the user forums (message boards and chat rooms) that were previously hosted on the EFA website. It has 115,000 followers with user comments from 2009-present.
2.1.2 Biomedical and patient data
In addition to social media data, the federated database includes Clinical, pharmacological, health, and scientific databases, including EHR, which are relevant to epilepsy and PWEC and detailed below.
Electronic Health records. We use anonymized population-level EHR data extracted directly from health information systems. It includes population-wide EHR from the public healthcare systems of the cities of Blumenau (Brazil, pop. 330.000) and Indianapolis (USA, pop. 864.447), and the whole of Catalonia (Spain, pop. 7,5M). We curate these EHR data to compute knowledge graphs that uncover drug-drug interactions (DDI) and adverse drug effects (ADR) by risk level (major, medium, and minor), gender, and age. Analysis of these graphs, discussed below (§3.1),has already revealed important sex and age biases in all three populations [35, 36]. Including these drug and symptom knowledge graphs in the myAURA data federation allows us to focus on epilepsy-relevant DDI and ADR, as well as epilepsy-specific biases. Moreover, these graphs enable the future comparison and analysis of drug interactions, adverse reactions, symptoms, and temporal comorbidity trajectories in myAURA’s user population, with those observed in these independent, larger patient populations. This will facilitate issuing medication and symptom warnings to myAURA users and PWEC at large [36].
PubMed is a service of the National Library of Medicine, a “free resource supporting the search and retrieval of biomedical and life sciences literature with the aim of improving health–both globally and personally” that includes over 35 million citations dating back to the 1860s. We process updated local copies of the entire PubMed/MEDLINE database (28 million citations) and use them in the myAURA knowledge graph to enable the recommendation of scientific literature relevant to PWEC (e.g., abstracts, MeSH terms, and references related to medications).
ClinicalTrials.gov is a central registration site for clinical trials operated by the National Institutes of Health that has been available to the public since 2000 [37]. Both publicly and privately funded trials are represented. The full dataset is available online and we ingested a local copy of the data into the Scholarly Database at Indiana University, which has been integrated into myAURA’s federated database and tagged with its dictionary for knowledge graph construction. As explained below (§2.2) , the dictionary construction required processing several pharmacology and clinical resources, such as DrugBank [38], SIDER [39], FAERS [40], MedWatch [41], and Drugs.com, to link relevant pharmacology and symptom information.
Via our PWEC user focus groups (§3.5), we identified and ingested other resources deemed most useful to patient experiences, such as the American Epilepsy Society’s Find a Doctor Database [42], which contains geographic locations of all epileptologists in the United States. Furthermore, based on the focus group study, the design of myAURA’s user interface (§3.5) includes local transportation information, integrating services such taxi, Lyft, UBER, and other public transportation via their APIs or Google Maps.
2.2 Biomedical dictionaries & sentiment analysis
To build an epilepsy knowledge graph, relevant concepts are needed to define its nodes. Indeed, a key aspect of federating the various resources is the construction of dictionaries with all the relevant entities and terminology for automatically tagging text of potential relevance to epilepsy. As others have done for studying depression using Twitter [43, 44], we first included terms obtained from clinicians and extracted from epilepsy patient social media [29]. This was supplemented with additional dictionaries that were previously carefully curated by pharmacology and biomedical informatics experts to be used in pipelines for extracting DDI from the scientific literature [45, 46, 29, 30, 47]. These dictionaries contain +170,000 standardized terms from sources such as FDA drug labels, DrugBank [38], SIDER [39], BICEPP [48], FAERS [40], and a standardized medical terminology dictionary built from clinical notes, MedDRA[49]. Parent terms and synonyms were associated in a hierarchical manner, e.g., Prozac is resolved to fluoxetine and cold to nasopharyngitis. Drug terms were expert-curated to best capture experimental evidence for DDIs and adverse drug reactions in the literature. Our myAURA dictionary was shared with the community with a corpus of PubMed articles and sentences with direct experimental evidence of DDI [47, 50].
Clinical terminology is not tailored for social media language so it can bias biomedical inference pipelines, such as the pharmacological surveillance that we reviewed elsewhere [28]. We therefore refined the dictionary via human-centered curation, with 14 annotators, iterative design of annotation guidelines, and the Instagram epilepsy digital cohort collected as described above. We showed that text mining pipelines built for scientific literature must be refined when applied to general-purpose social media text where many topics are discussed simultaneously. Indeed, the removal of just the 12 terms deemed most ambiguous by human annotators reduced false-positive tokens in the tagging of social media data, and significantly improved recommendations on the epilepsy knowledge graph [31].
Using the final myAURA dictionary, all textual data from the federated resources above were tagged with its terms, to ensure capturing discourse that is most relevant for PWEC such as epilepsy symptoms and terminology, drugs and pharmacology, natural products, and adverse reaction terminology. Specifically, we extracted and tagged the relevant text fields from all the federated resources, such as social media posts, prescription data e EHR, or eligibility criteria in clinical trials. These were then indexed in a data warehousing system for easy linking of relevant concepts to text units, users and all data fields in the federated data resources above. The tagged concepts/terms are subsequently used as nodes in the epilepsy knowledge graph described below (§2.3).
In addition to the biomedical-dictionary tagging, we used several dictionary-based sentiment analysis tools such as ANEW [51], VADER [52], and LIWC [53] to tag each post, tweet, and comment in social media and community website data sources, with a mood state along sentiment dimensions including valence (happy/sad), arousal (calm/excited), and dominance (in-control/dominated) [32]. This allows us to estimate individual and collective psychological mood state of the epilepsy digital cohorts, affording various types of health-related discoveries, as we reviewed for the biomedical data science community [28]. For instance, as part of this project, we studied a small Facebook cohort of victims of SUDEP and showed that certain sentiment measures such as increased or altered verbosity may be predictive of this serious outcome, an important result for stakeholders [10].
2.3 Building the myAURA epilepsy Knowledge graph
Given that the textual items of the federated data resources were tagged with dictionary terms, it is straightforward to build weighted graphs (i.e., networks), where edges denote a co-occurrence proximity measure (or its inverse, distance), e.g., the co-occurrence of drugs and medical terms on social media posts or EHR entries. Specifically, given the set of all terms, we first compute a symmetric co-occurrence matrix, , whose entries denote the number of textual units where terms and co-occur [54, 19]. Unit may denote a PubMed abstract [55], a user timeline-window on Instagram [29, 28], or an EHR prescription period [35, 36]. The diagonal entries of this matrix, , denote the total number of times term was mentioned in a unit of analysis with any other term in the dictionary : .
To measure a normalized strength of association among the terms, we compute a proximity graph whose edge weights are given by the Jaccard similarity [56, 57] (though other measures are possible [54, 58, 59, 60, 61]):
| (1) |
where denotes a proximity between two terms and . When the terms never co-occur on textual units we have , and when they are both always mentioned together we have ; naturally, .
These proximity or associative knowledge graphs (KG) are simple, yet powerful, data representations to study the relationships among different entities. We have used these associative knowledge graphs (KG) to build competitive recommender algorithms [54, 62, 63, 64], biomedical text mining pipelines [55, 65, 66, 67], scientific maps [68, 69, 70, 71, 72], network inference in biomedicine [36, 73, 35, 29, 19], and automatic fact-checking [58]. Also, computing KGs is scalable; it depends only on pairwise comparison of vectors for each pair [54, 74].
Finally, the myAURA epilepsy KG, , is composed of all the KGs for each federated data source described above and dictionary terms in . Because the dictionary terms, , are shared across KGs, this can be cast as a multi-layer graph where term associations for each data source are represented separately, with inter-layer edges connecting the same dictionary terms on each layer, as represented in Figure 1.
3 Results
3.1 Studying Drug-Drug Interaction via KGs
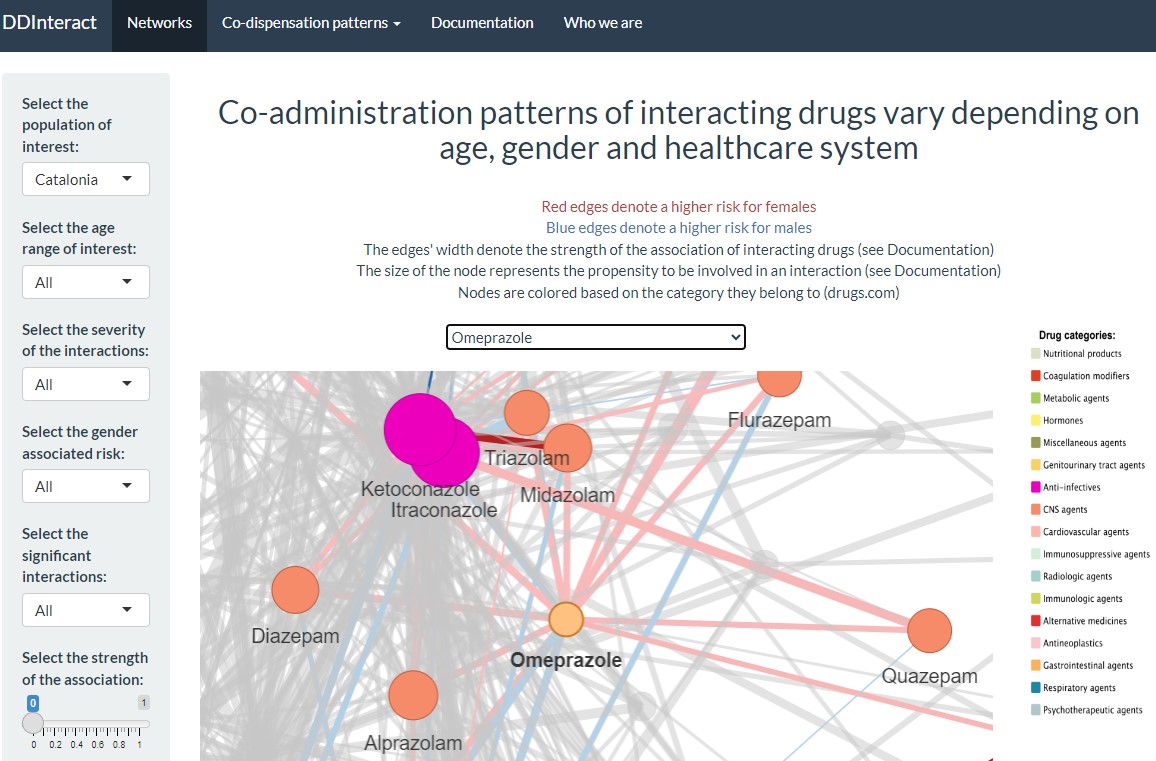
Let us exemplify the utility of the myAURA KG with the networks obtained from EHR data. We processed 18 months of EHR data from all 133K patients in the primary care public health system of Blumenau, Brazil, then conducted a large longitudinal study of the prevalence of known DDIs. We discovered very significant sex and age biases, even after correcting for multiple factors. Women and older patients were at significantly higher risk of being exposed to DDI than their polypharmacy regimens would suggest [76], with several drugs used in epilepsy implicated (e.g. see Figure 2). To understand if such biases occur beyond Brazil, we showed generalizability and reusability of our pipeline using additional primary care data from distinct locations: Indiana State, 2 yrs, 265K patients; and Catalonia, Spain, 10 yrs, 5.5M patients. We found very similar sex and age biases in the prevalence of known DDI in both locations, albeit sometimes involving distinct drugs [36]. The analysis also revealed actionable interventions that easily reduce both biases and the burden of DDI, e.g., by replacing the drug Omeprazole with other proton-pump inhibitors. This study was enabled by the EHR data federated with our dictionary and other databases, and the KGs built from them to characterize drug interactions in proximity graphs for each population. Indeed, a web tool (DDIInteract [75, 36]) was built by external collaborators to enable third-party analysis of the DDI KGs from all the myAURA EHR datasets (Figure 2), further demonstrating reusability of our data and KGs.
The focus group user studies discussed below (§3.5) revealed that detailed pharmacological information is of particular importance to epilepsy patients. Therefore, in addition to studying DDI in EHR data, we also built text classifiers to identify PubMed abstracts (and sentences) with direct experimental evidence of DDI. We trained/fine-tuned classical and large language models like BioBERT and ChatGPT on the human annotated DDI corpora that we helped develop [47] and on the refined dictionary described above, and they performed very well (MCC for in vitro and in vivo, and for clinical evidence) [77]. The recommendation of relevant experimental DDI evidence supports functionalities in the myAURA mockup discussed below (§3.5), e.g., when users click on nodes representing drugs in the KG visualizations. This study also revealed knowledge gaps in the scientific literature by identifying drug pairs in need of experimental in vitro, in vivo, or clinical DDI studies [77].
We developed standardized open-source code for efficient data ingestion, preprocessing, dictionary term matching, construction, storage, and joining of networks from different data sources into PostgreSQL, and for computing the metric backbone discussed next. It provides a unique, fast, and streamlined process that, in a few commands, reproduces the complete KG construction pipeline for each independent data source that gets updated. This source code is publicly shared through github111at github.com/cns-iu/myaura for KG construction and github.com/CASCI-lab/ for the backbone extraction pipeline., the most widely used public repository of public software, with appropriate licenses that allow other researchers to re-use and build on our source code.
3.2 The Metric Backbone for KG sparsification
As discussed in the previous subsection, KGs are multidimensional representations useful for inference and interpretation of biomedical issues from large scale data. However, they are often dense with many edges that are not relevant for analysis, inference, link prediction, and recommendation—and furthermore impair visualization and slow down computation. Thus, we developed a sparsification methods to facilitate analysis and visualization of myAURA’s epilepsy KG and other biomedical informatics problems based on network data.
Many network inference methods depend on shortest paths, which are computed on distance graphs easily obtained from the proximity graphs of the epilepsy KG via the nonlinear map applied to the weights of the latter (given by eq. 1):
| (2) |
where , and the resulting distance weights are symmetrical and inversely proportional to the strength of association between terms; i.e. they convey a measure of distance necessary to compute path length.
Shortest paths allow us to infer the strength of indirect association (or likely transmission): If is connected to with a finite distance, and is similarly connected to , the length of the shortest indirect path quantifies how close is to , or the “cost” of transmitting information from to via . This type of inference is ubiquitous in network problems [22, 23, 24, 25], including link prediction [78] and recommendation [79, 80], our inference of DDI from social media and EHR [36, 29, 35, 28], automated fact-checking on Wikipedia [58], and epidemics on social networks [81, 82].
We have shown that such distance graphs obtained from real-world data are typically not metric, but rather semi-metric [54, 62]: The triangle inequality () is not observed for every edge of [83]. That is, the shortest distance between at least two nodes in the graph is not the direct edge, but rather an indirect path via other nodes.
Computing shortest paths of a distance graph, where path length is the sum of constituent edge (distance) weights (), e.g., via Dijkstra’s algorithm [84], yields its metric closure , a new graph that obeys the triangle inequality at every edge [54]. If an edge in the original graph is semi-metric, its weight gets replaced by the length of the shortest indirect path between the nodes it connects. In other words, the metric closure (or All Pairs Shortest Path Problem [85]) is the graph obtained by computing the shortest paths between all pairs of nodes in the distance graph and replacing the original distance edges with the length of the shortest path between and : , via an arbitrary number of intermediary nodes . In summary, edge weights of that do not change after computation of the metric closure aremetric because they obey the triangle inequality—there is no indirect path shorter than the direct edge between and —while those that change, are the semi-metric edges.
Significantly, there is a metric backbone subgraph [19] of the original graph that is invariant under the metric closure and is sufficient to compute all shortest paths: . The edge weights of the metric backbone graph are given by:
| (3) |
where means there is no direct edge between and in the distance backbone graph.
The size of the backbone subgraph, in relation to the size of the original graph, defines the amount of redundancy in the network. Edges not on this backbone are superfluous in the computation of shortest paths and in all network measures derived from shortest paths (e.g., betweenness centrality). Importantly, the metric backbone is an algebraically principled network sparsification method with unique features: it (a) preserves all connectivity and shortest-path distribution, (b) does not alter edge weights or delete nodes, (c) is exact, not sampled or estimated, and (d) requires no parameters or null model estimation [19]. Furthermore, it outperforms available state-of-the-art network sparsification methods in (e) preserving the community structure of the original graph [81] and (f) recovering most of the original (macro and micro) transmission dynamics in social contact networks, while revealing the most important infection pathways in epidemics, and resulting in greater reduction without breaking apart the original network [73, 82, 19].
| KG Network | Nodes | Edges | % metric |
| PubMed* | 8,891 | 590,781 | 18.59% |
| Clinical Trials | 1,275 | 31,371 | 53.75% |
| 1,686 | 25,235 | 15.1% | |
| X (Twitter) | 1,022 | 5,082 | 37.0% |
| r/Epilepsy (Reddit) | 1,270 | 17,558 | 17.0% |
| EFA | 1,529 | 33,795 | 15.7% |
| *only epilepsy related publications. | |||
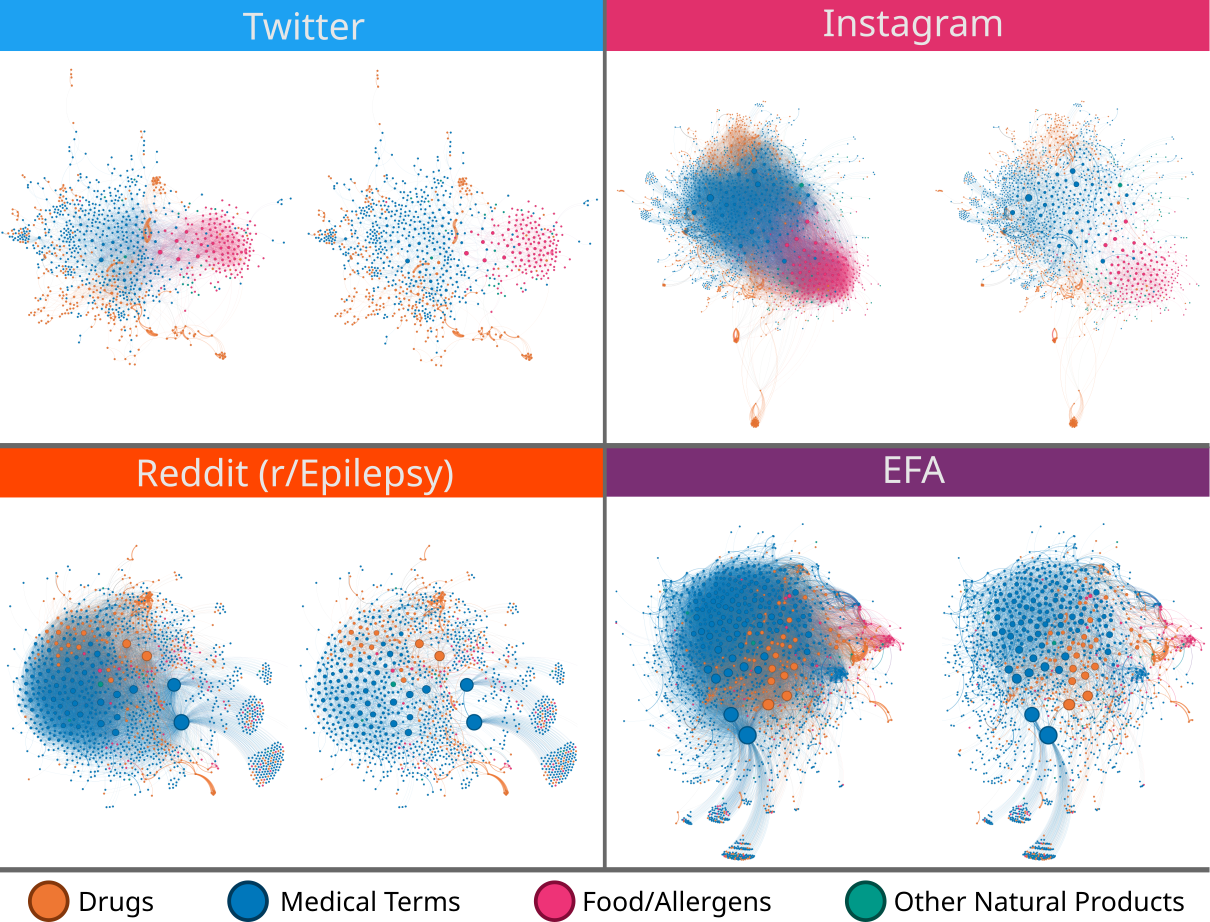
All layers of myAURA’s KG have a small backbone (large amount of redundancy) as can be seen in Table 1) and Figure 3. This is coherent with what is observed in networks across biological, technological, and social domains, which typically possess very small metric backbones—revealing that network robustness to attacks and failures seems to stem from surprisingly vast amounts of (shortest-path) redundancy [19]. For instance, the metric backbone of the KG of more than 3 million concepts extracted from Wikipedia is composed of only 2% of the original edges, but it is sufficient to compute all shortest paths used by our automated fact-checking inferences [58]. Likewise, the metric backbone of a protein interaction network of more than 11K human genes involved in spermatogenesis comprises of the original edges [73]. The 90% of edges not on the backbone were also obtained from experimental evidence, but they are redundant for shortest paths and likely less important for regulatory pathways, which led to our discovery of new genes involved in male infertility [73]. Similarly, the backbones of social contact networks important for epidemic spread are within 5-20% [81, 19]; those of the human brain connectome and functional and multiomic gene co-expression networks are typically 5-11% [19] and have distinguishing network features that enable effective classification between healthy and diseased human cohorts in Alzheimer’s, autism, depression, and psychotic disorder [86, 87, 88].
These observations show that the metric backbone is more than a mathematical construct and “has a phenotype”: its measurement in many biomedical and social complexity problems reveals important functional characteristics, such as community structure, information spreading dynamics, and the most important (central) network nodes, edges, and pathways for inference [19, 81, 82]. Additionally, since the backbones of large networks are typically very small, this natural sparsification provides substantial memory and computational parsimony in storing and analyzing them [74]. Certainly, removing edges that are redundant for shortest paths yields a powerful sparsification methodology that facilitates analysis and visualization of KGs [19], which we illustrate next (§3.3).
An open-source Python package for metric backbone extraction and analysis, DistanceClosure [89], was developed to be compatible with NetworkX, for interoperability with common graph formats (e.g. GraphML, GML).
3.3 Analysis of myAURA’s KG backbones
KG sparsification enables various types of inference, extraction and recommendation from digital libraries, automatic fact-checking to protein-protein interaction extraction [19, 58, 63, 62, 64, 55, 65, 66, 67]. Let us exemplify with the extraction of focused digital cohorts from social media, which are most useful to study the interplay between human behavior and medical treatment in chronic diseases such as epilepsy [10, 28].
Social media sites vary in the generality of their discourse; while X and Instagram simultaneously trade in a wide range of topics, Reddit subgroups and the EFA discussion forums are much more focused on health-related discourse. The metric backbones of the myAURA KGs from Instagram, X, r/Epilepsy, and EFA forums are similar in size: of original, except X with (see Table 1 and Figure 3). Even though user timelines were harvested with the same criterion (at least one post mentioning an epilepsy drug) in all platforms, the proportion of users who contribute to backbones (users with at least one post containing a pair of dictionary terms represented by an edge on the backbone) is quite distinct. A much higher proportion of users contribute to the backbone in epilepsy-focused than in general-purpose social media: 65 and 71% on Instagram and X vs. 95 and 93% on EFA forums and r/Epilepsy—as showed in detail in [90]. In other words, in the general-purpose platforms there are a lot more users who do not contribute to any shortest-path inference on the derived KGs; they contribute to redundant KG edges.
Interestingly, there is a clear discourse distinction between users who contribute to the backbone from those who do not. Using the human-annotated corpus of Instagram posts utilized to refine the myAURA dictionary (see §2.2) [31], we observed that the false positive rate (dictionary terms used without medical relevance) is significantly higher for the set of users who do not contribute to the backbone (32%) than for those who do (14%). Moreover, this difference is not a matter of engagement because false positive rates are similar for users who post a lot (13%) or little (18%). In sum, this backbone filtering methodology enables the extraction of focused digital cohorts from general-purpose social media, such as X or Instagram, by identifying user sets more like those on special-purpose forums of biomedical relevance such as the EFA and r/Epilepsy. In other words, the metric backbone sparsifcation of KGs can be used to increase personalization of social media data for a specific health problem [90].
The sparsification of original networks into their metric backbone subgraph can also be used to uncover drug side effects while highlighting key drug and medical term associations on the epilepsy patient discourse . For instance, the backbone of the Reddit r-Epilepsy KG (Figure 3, bottom, left) consists of only 17% of the 17,558 original edges, characterizing the co-occurrence of pairs of dictionary terms in posts by users who posted at least once about a drug used to treat epilepsy (/S 2.1). Due to the sparsification, this backbone is easier to visually inspect, without any loss to the original shortest path distribution, thus preserving the distance associations among all terms revealed by the data, which are the most relevant for information spreading [81, 82].
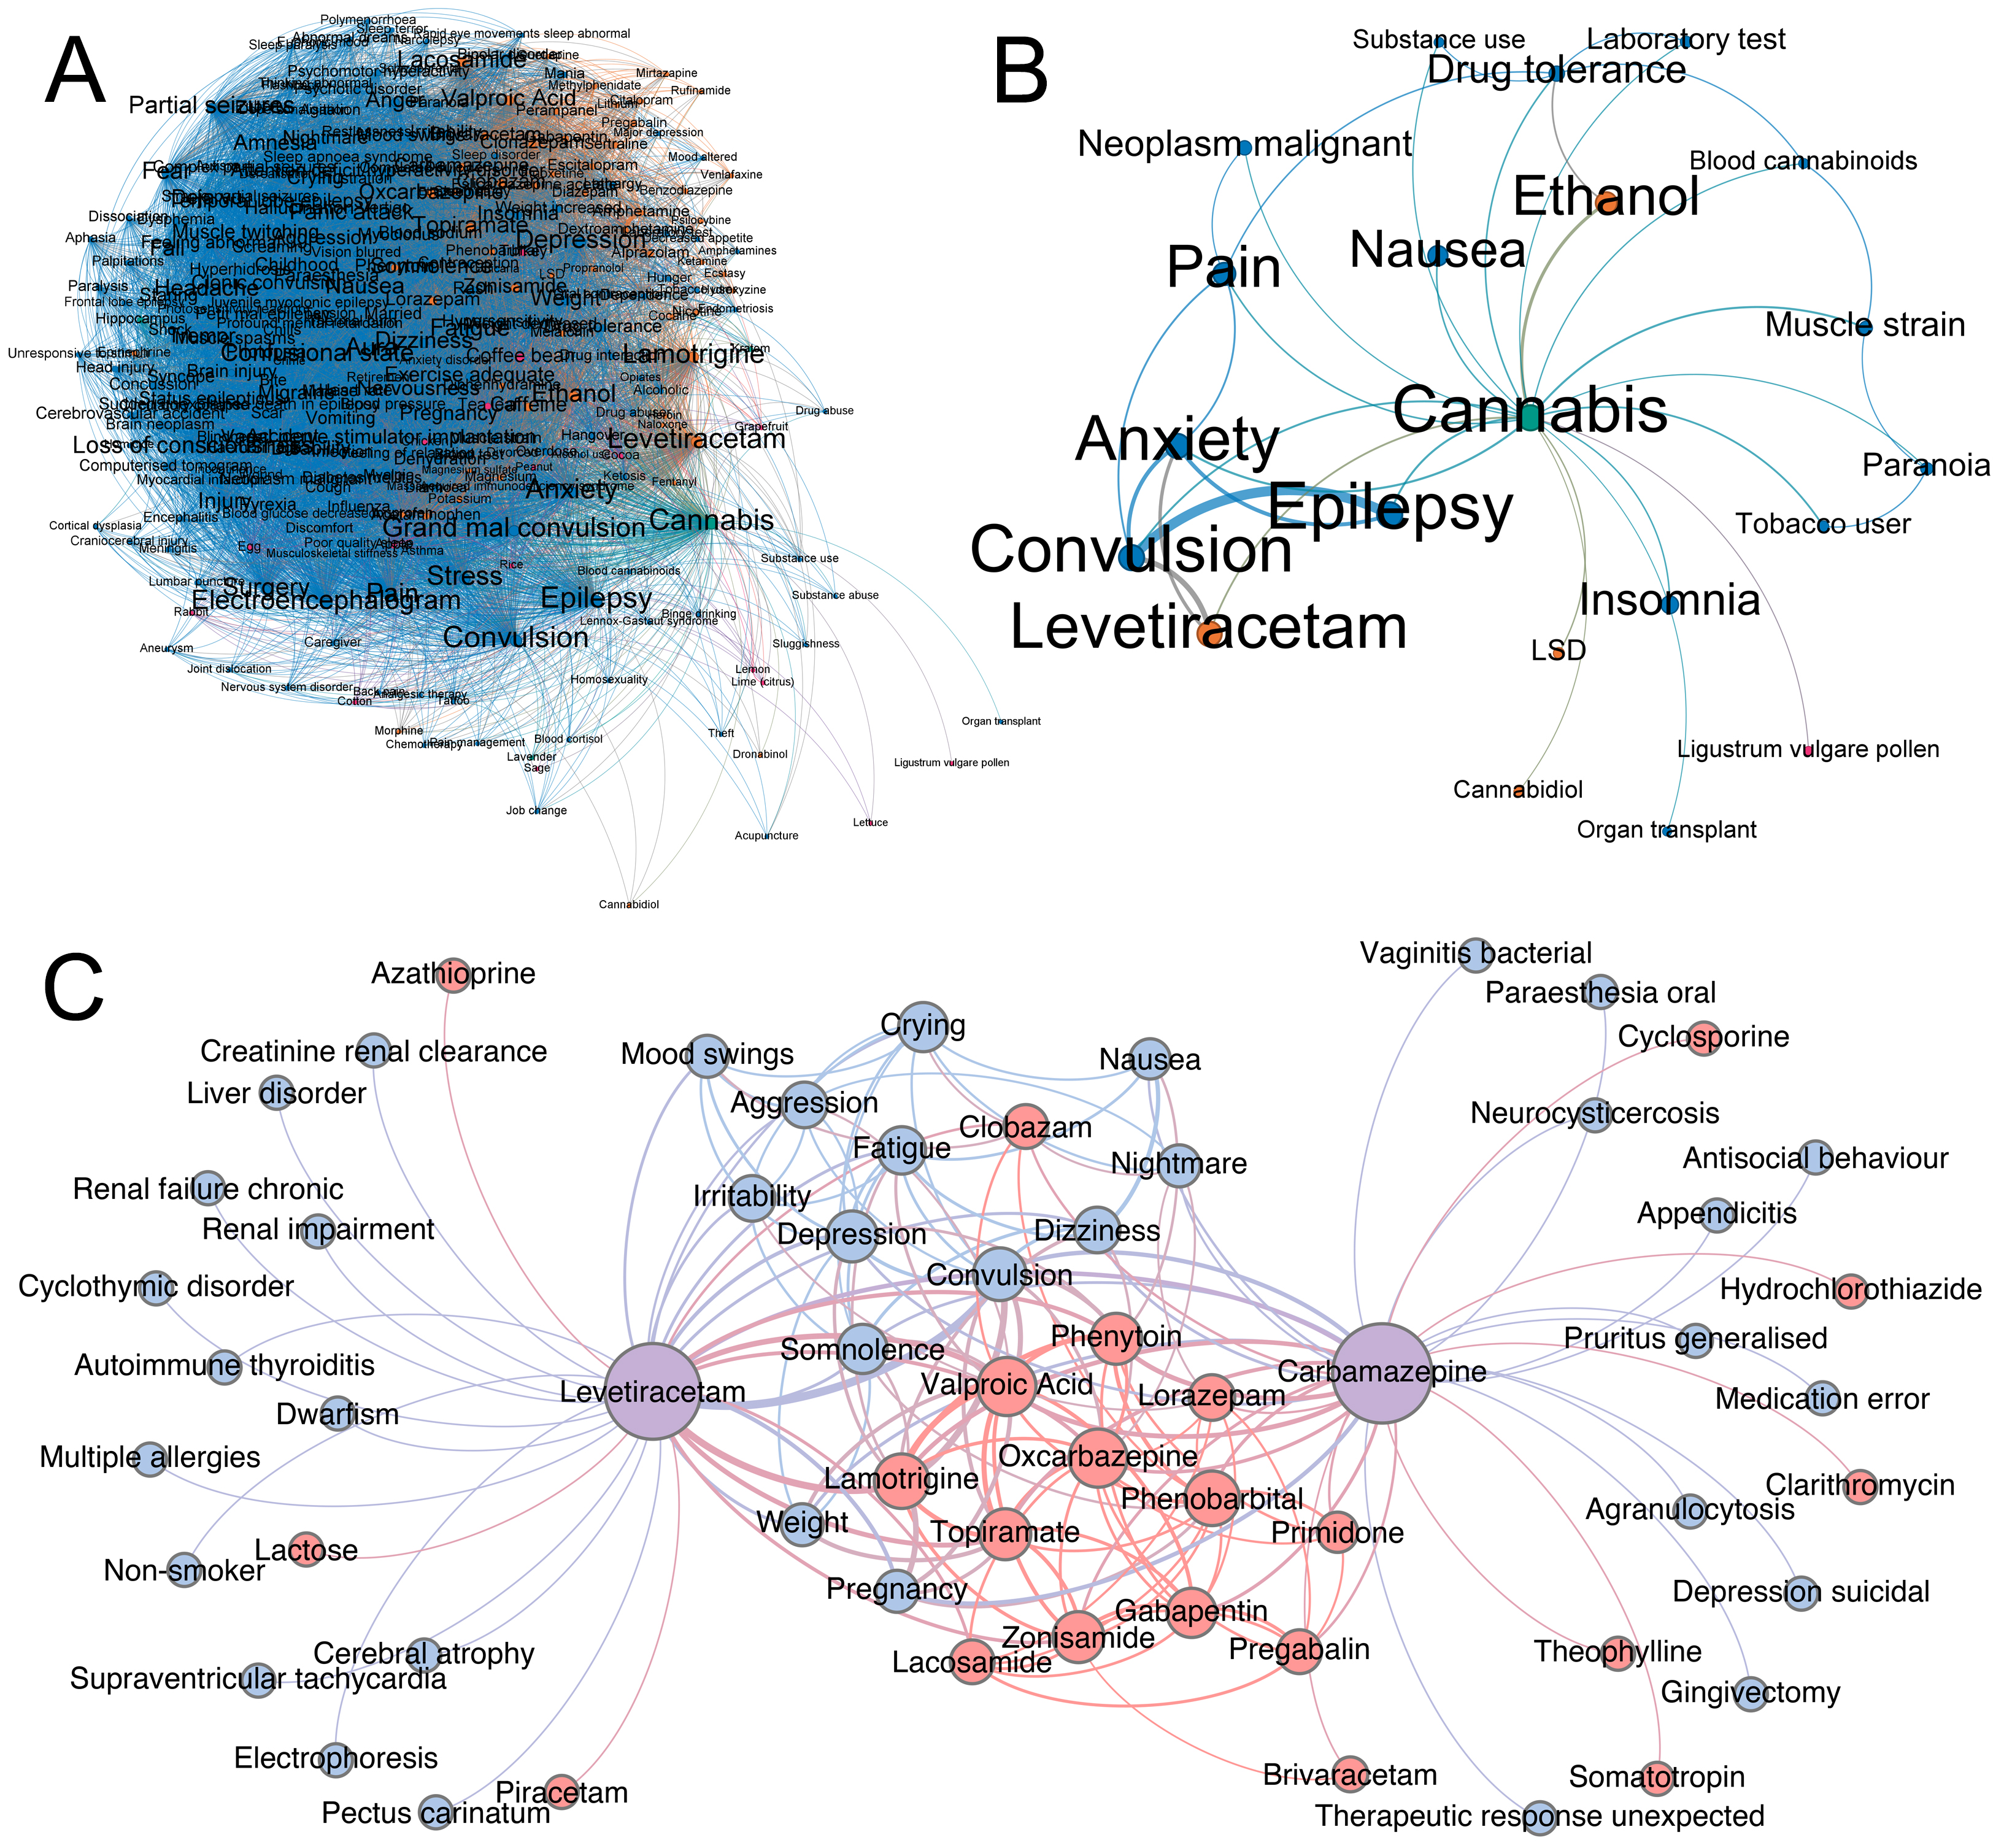
Figure 4, shows the Ego network for the target term “Cannabis” (A). This is the subgraph to the Reddit r/Epilepsy KG with all terms directly associated with “Cannabis” (co-occurring in posts), including associations with one another. The backbone of this graph (B) removes most of those associations. Note that no reachability or shortest path information is lost in the backbone sparsification; all nodes shown in Figure 4.A are reachable from the “Cannabis” node via an indirect path on the full backbone KG (Figure 3) with the exact same shortest distance as in the original KG. However, most are no longer directly connected to “Cannabis” as shown in Figure 4.B Importantly, the nodes that remain directly connected to “Cannabis” have a transitive relationship to this target node—i.e. the direct distance is shorter or equal than any other indirect path between them and to “Cannabis”. In other words, their association with the target node is direct, and not correlated with a third or more terms. Similarly, many edges between nodes disappear in the “Cannabis” ego-backbone, because their relationship via this target term is stronger than direct measurement of their co-occurrence. In summary, from the perspective of shortest-paths, the dictionary terms that remain connected in the “Cannabis’ ego-backbone are the most relevant to understand how the Epilepsy digital cohort extracted from the subReddit r/Epilepsy discusses this term.
Another example is the backbone of the EFA KG (Figure 3, bottom, right), which consists of only 15.7% of the 33,795 original edges, characterizing the co-occurrence of dictionary terms in posts by users who posted at least once about a drug used to treat epilepsy (/S 2.1). Figure 4.C shows a subgraph of this backbone with all the nodes directly associated with two drugs known to treat epilepsy, Levetiracetam and Carbamazepine (larger purple nodes), and frequently prescribed together in refractory (drug-resistant) epilepsy. Several terms appear in the middle of the graph that are shared by both drugs. These include additional drugs (in red) often co-prescribed with these medications in a clinical attempt to control patient seizures, and medical terms (in blue) related to the side effects of these drugs. Some are minor, such as fatigue, somnolence, and dizziness. Other terms such as Mood swings, aggression, depression, and crying are moderate to severe side effects associated with Levetiracetam (often main reasons patients switch from this medication) and they appear in close proximity to the drug in the graph. Nightmares are a common side effect of both drugs, but typically worse with Carbamazepine and appears closer to it in the subgraph. Note there is no direct backbone connection between Nightmares and Levetiracetam. Also, Carbamazepine is not safe to take during Pregnancy as it is associated with neural tube defects. Levetiracetam is considered safer, therefore many women of childbearing age or who plan to become pregnant will switch medications during this time, so it is interesting that the term appears between both drugs. Likewise, Carbamazepine can cause significant Weight gain, making patients switch to Levetiracetam because it is weight neutral.
The examples above highlight how the metric backbone of KGs can be leveraged to more clearly understand how patients discuss drugs and their side effects in a particular social medium, such as the EFA forums or Instagram. Such network analysis can be relevant to other patients as well as biomedical researchers studying these drugs. Ego-networks and other KGs have shown to be useful in various mental health and biomedical problems [91], and the metric backbone sparsification facilitates such analysis as discussed above.
3.4 Maps of myAURA’s knowledge graph
The full myAURA KG, is comprised of various networks , whose edges are extracted from distinct data sources and units of analysis (i.e., EFA comments, tweets, or paper abstracts). Thus, myAURA users can trace the specific discourse that gave rise to an edge to understand the context in which the terms were used. To support such analysis, we developed novel visualizations of KG backbones to leverage their interpretation in an interactive manner.
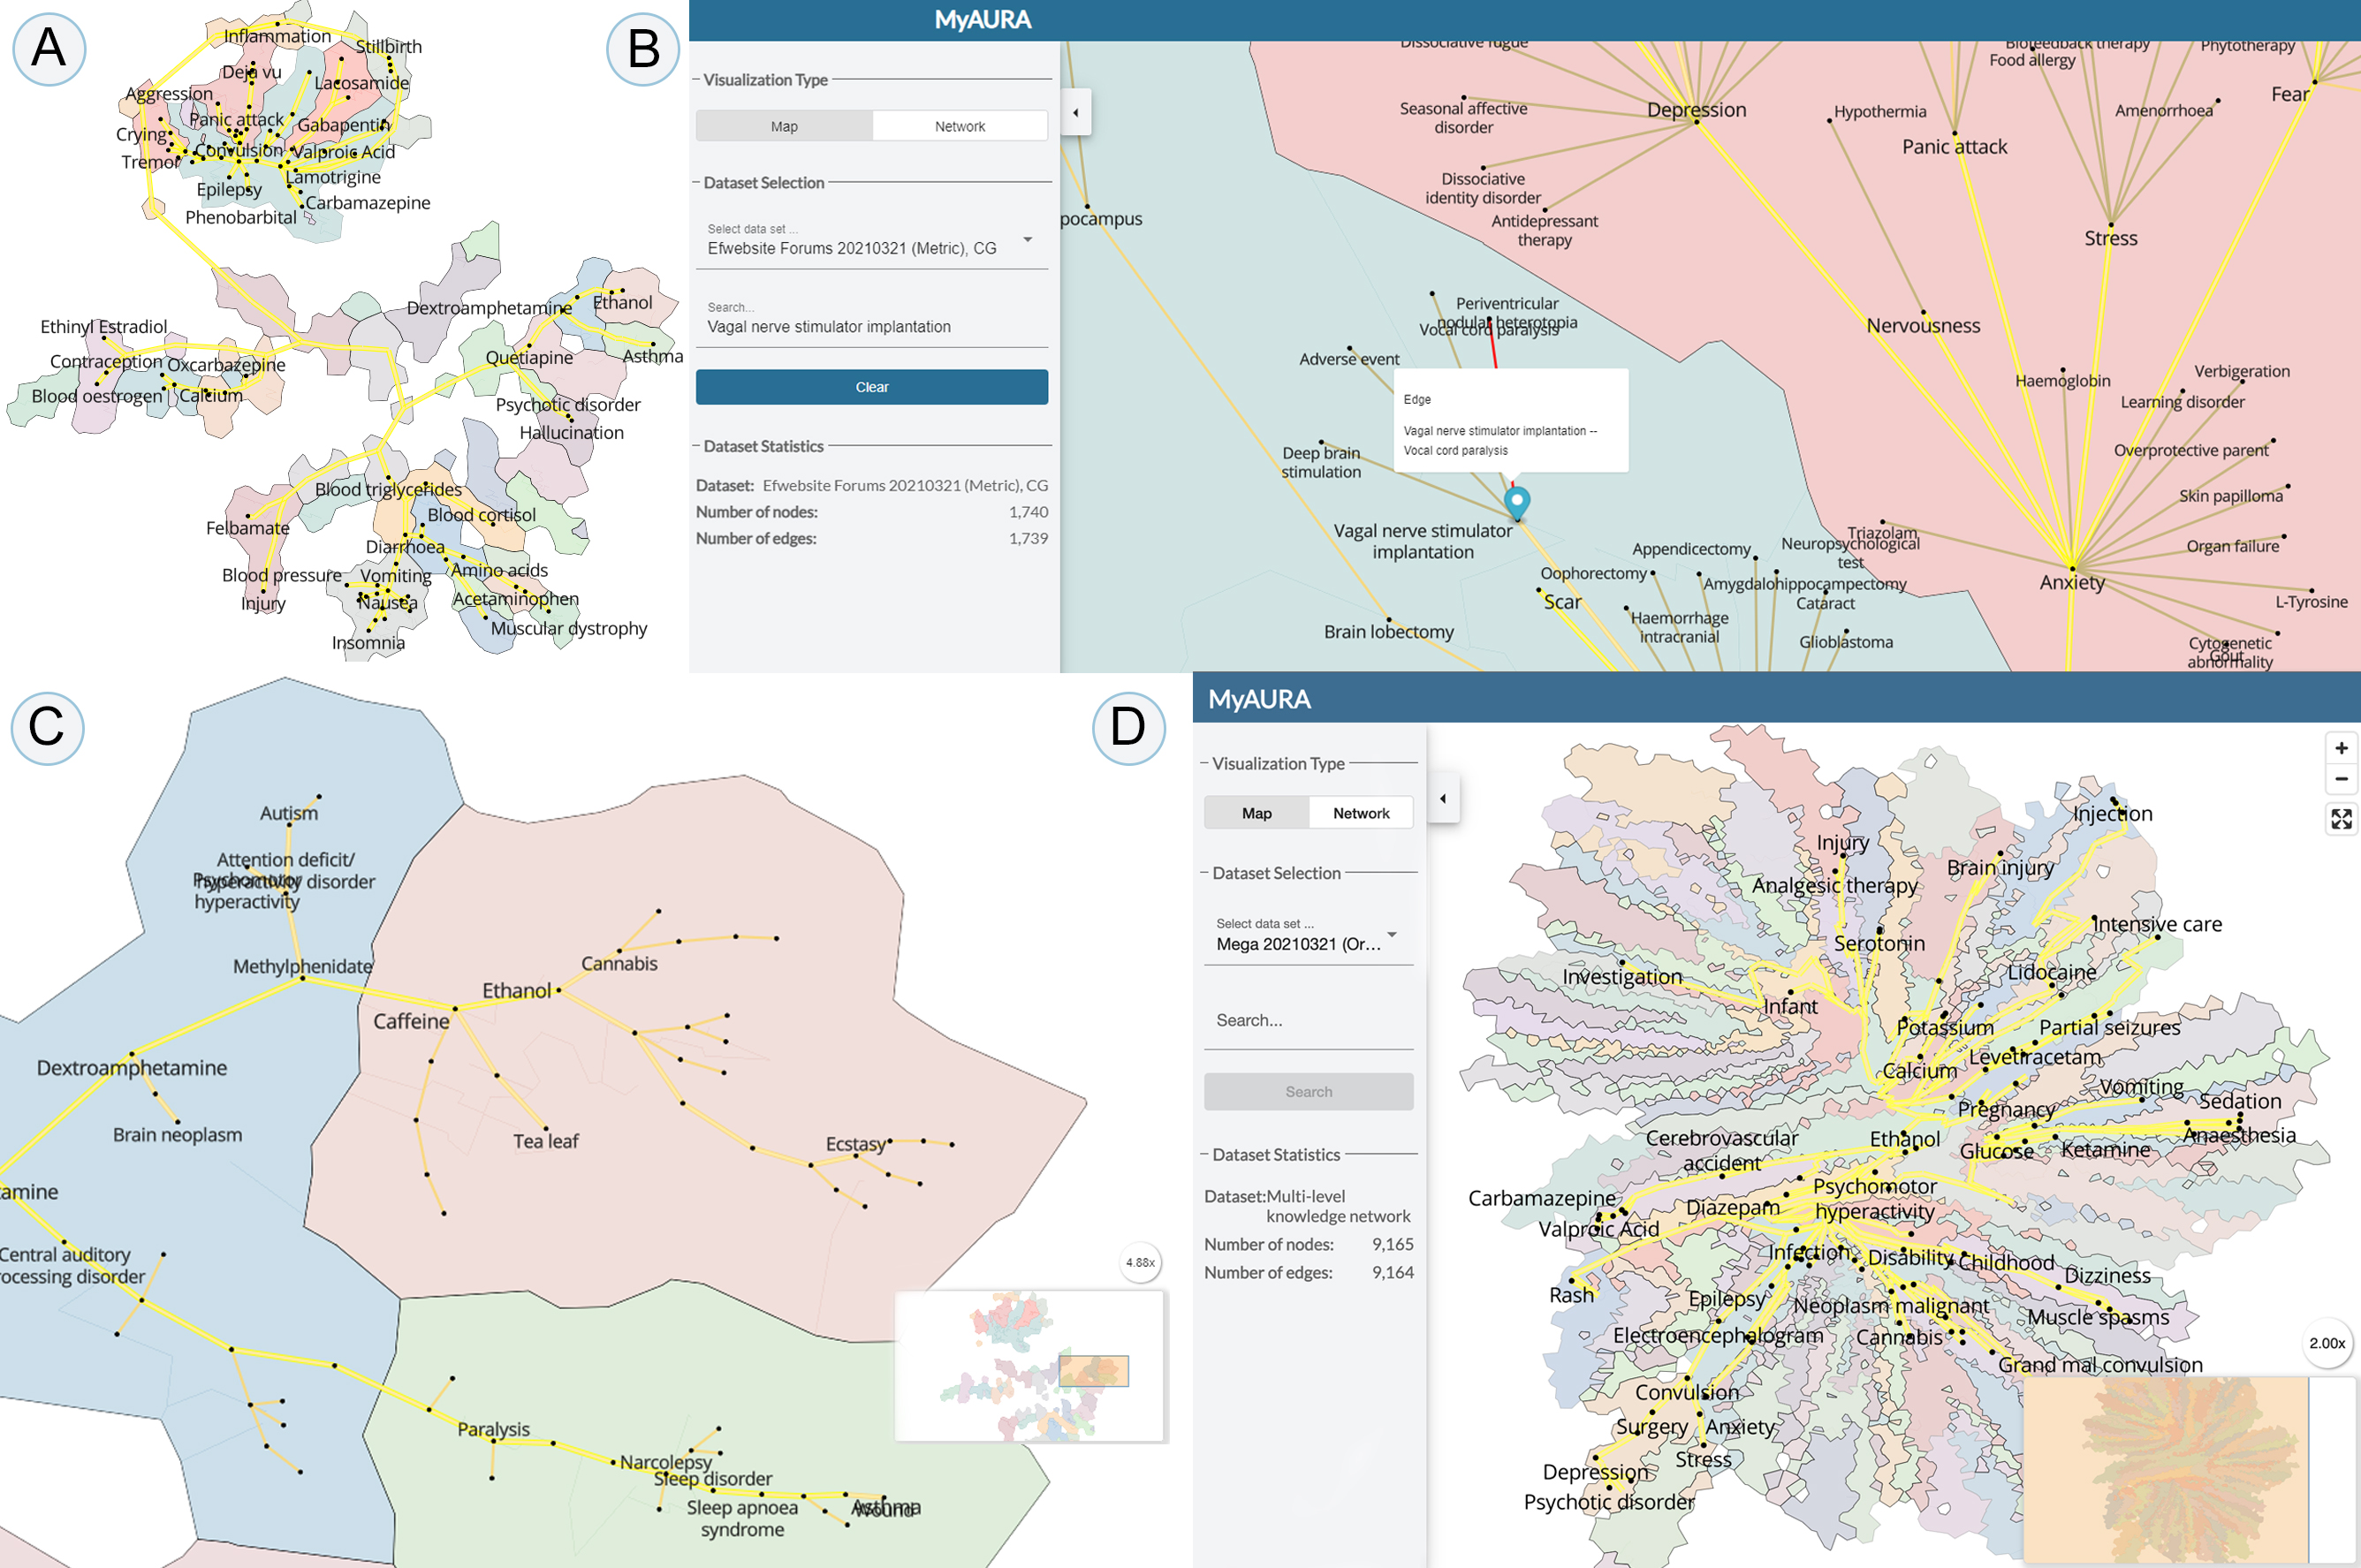
The inherent parsimony of associations and paths in the metric backbone of KGs makes them ideal lines of argumentation for explaining why a certain inference is made. Thus, we developed a myAURA KG visualization tool [92] using the map4sci visualization suite [72, 93]. Our KG visualization differs from traditional node and edge representations of networks. Using the Zoomable Multi-Level Tree (ZMLT) algorithm [94, 95], it charts the knowledge embedded on backbone subgraphs obtained from our various data sources onto a 2D plane resembling a cartographic map, with three graph layouts: BatchTree, which optimizes for scalability using C++ and OpenMP, balancing between a compact layout and edge length preservation; CG, which optimizes compactness at the expense of preserving edge length; and DELG, which optimizes to preserve edge length.
All variations are based on the metric backbone of KGs and use the same visual metaphor that displays semantic countries (defined by clusters of related dictionary terms) as regions with cities (the terms) linked by roads (the most important associations for information transmission). We have shown with human subject studies that such map-like visualizations are as good or better than standard node-edge representations of graphs, in terms of task performance, and memorization and recall of the underlying data [96]. Notice that semantic countries are mostly unaffected by sparsification because the metric backbone preserves community structure [81].
As a user zooms in, edges down the hierarchy of importance are revealed as peripheral roads between lower importance dictionary term nodes. The tool allows easy dictionary-term search in the map, e.g. searching for the term “Vagal nerve stimulator implantation” as depicted in Figure 5.B. The online version of the map visualization tool also allows clicking on edges to retrieve information associated with the connected terms. However, due to privacy and access rights for each data source, it does not retrieve the actual data items where the terms are co-mentioned e.g. EFA Forum posts associated with an edge connecting “Vagal nerve stimulator implantation” to “Vocal cord paralysis” as depicted in Figure 5.B. Only our private, PHI-compliant research prototype is able to retrieve ranked data from all included resources after clicking on specific nodes and edges (e.g. EHR, clinical trials, or social media posts).
Importantly, the visualization allows us to represent myAURA’s multi-layer KG, , as a single, two-dimensional map. This is done by combining edges from each constituent network according to a specific aggregation operation [19]. In the current implementation values from each layer are averaged across data sources, but other aggregations are possible, e.g. choosing the maximum (minimum , see eqs. 1 and 2) in all layers as we have done in the aggregation of multi-layer protein-protein networks in another setting [73]. The ability to search and explore myAURA’s heterogeneous data sources via a single combined map is a useful feature of this visualization approach as depicted in Figure 5.D.
3.5 User-centered design and pilot testing of myAURA through focus groups
Our priority was to understand and include the needs of PWEC in prototyping an application to support epilepsy self-management. To best design myAURA, we carried out a series of focus group interviews to understand how to deliver personalized recommendation and visualization of information from myAURA’s KG. The initial focus group had 12 PWEC participants that met for four sessions. We learnt that they experienced difficulties in finding the right information due to diverse symptoms among PWE, as well as in tracking and managing epilepsy-related information since it is gathered via multiple sources, forcing them to use multiple apps and strategies for those goals. They also reported difficulties in sharing information with doctors and family members and in getting support while and after having seizures. [17, 18].
Participants were eager for an application like myAURA to be an epilepsy-specific, all-in-one platform to track symptoms, seizures, available treatments, and other relevant factors, and provided them and caretakers a holistic image of their epilepsy status [17, 18]. The ability to tailor information (e.g., finding the most effective treatments regarding individual PWE’s symptoms and contexts) was also very important for them, as was the ability to share information easily with family members, friends, teachers, and health care providers.
Using these initial findings, we produced an initial interactive mockup prototype with the desired key features, and subsequently tested it with a second focus group (a subset of the original group). Access to the initial mockup was provided at a virtual meeting where participants were asked to perform a few tasks while the screen was shared with the researcher. They also used the mockup freely for several minutes before sharing their experience, including challenges, in a short follow-up interview. Finally, they completed and additional survey designed to measure their perceptions and experiences with the mockup on a 7-point Likert scale [97]. Overall, the interview and survey results showed that their perceptions and experiences were positive. Higher scoring items were easiness to learn (6.38), feeling of control (6.19), and overall impression (6.17). Although creativity (5.19), usefulness (5.34), and satisfaction (5.36) scored relatively lower than other items, their overall scores were still positive.
Elicited additional desired functions, they suggested items such as water/food intake trackers, medication or appointment reminders, and ability to share data with other care stakeholders (e.g., a physician, or a child’s teacher). The ability to track and graph multiple aspects of life was deemed fundamental to provide meaningful information to PWEC, family and the medical team (e.g. identifying seizure triggers).
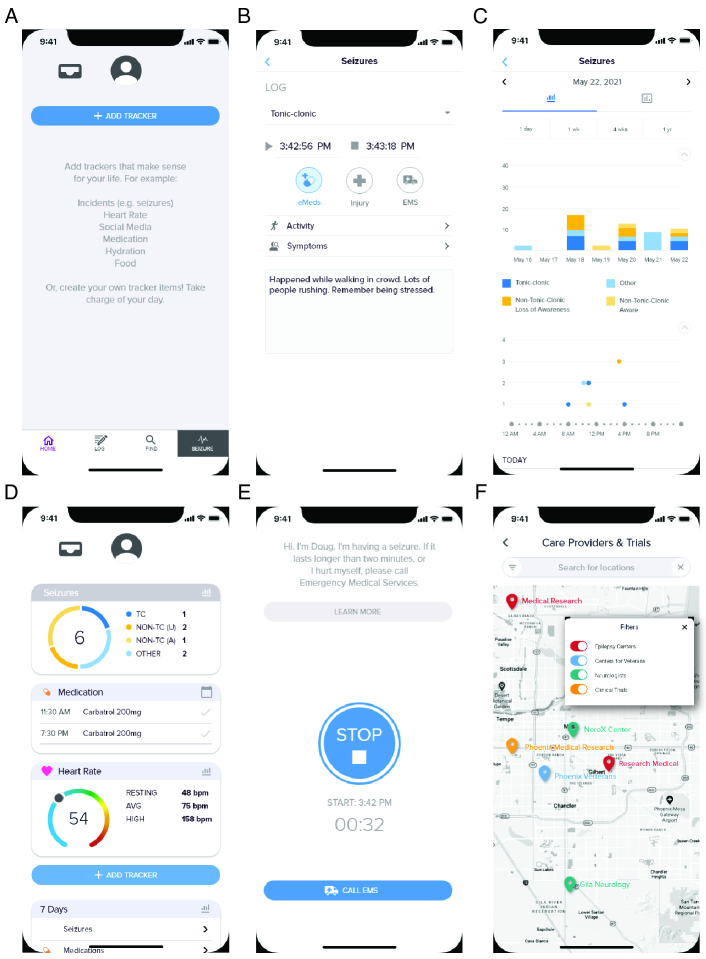
Based on this feedback, we designed and implemented a final interactive mockup myAURA app (see Figure 6), which included trackers (e.g., food/water intake, sleep, menstrual cycles), modifications to the navigation of screens, a dedicated media library where users may curate epilepsy-related information, an emergency/seizure response function, the ability to sync the platform with fitness trackers (e.g., FitBit), and appointment/medication reminders.
To identify additional potential functions and to understand seizure management experience in diverse environments (e.g., home, school/workplace, public transport), we conducted a (third) follow-up study with the updated mockup [17]. Our aim was to better understand the contexts, challenges, and coping strategies for seizure management devised by PWEC. We focused on understanding the social stigma experienced by PWE and proposed human-computer interaction design requirements to effectively deliver appropriate first aid information to bystanders to a seizure [17].
The three studies further allowed us to complete a system design framework to characterize challenges PWEC face in finding the right just-in-time information, tracking, and sharing it with family, caregivers, and others. With this human-centered approach, we proposed a design framework to mitigate the challenges PWEC face and improve epilepsy information management and care coordination in myAURA or a similar future technology [18].
4 Discussion
Our interdisciplinary efforts toward building myAURA, a personalized, easy-to-use web service for PWEC are ongoing. Most of our efforts so far have been in researching novel data and network science methods to design and implement the computational architecture of myAURA as a user-friendly web service to improve patient activation. This has been translated into several important novel developments discussed next.
Our approach rests on an unprecedented collection of large-scale heterogeneous data resources of relevance to study the specific biomedical and social complexity of epilepsy, in support of PWEC, including social media and community websites, electronic health records (EHR), and biomedical databases (§2.1). To integrate all that data, we developed a generalizable methodology to compute a multi-layer KG (§2.3), based on the federation of the constituent heterogeneous data sources (§2.1) in separate layers linked via the terms of a human-centered biomedical dictionary (§2.2). The power of this KG approach was exemplified in the study of the drug-drug interaction phenomenon (§3.1) in EHR [35, 36], the scientific literature[47, 77], and social media [28, 29].
To analyze the multi-layer KG, we developed a network sparsification method (with corresponding open-source code) that allows us to extract the metric backbone of KGs, removing edges redundant for shortest paths. It outperforms existing network sparsification methods (features (a) to (f) in §3.2) and uncovers the most important edges and pathways for inference, recommendation, and visualization [19, 81, 82]. In addition to those powerful and general benefits, we showed that metric backbones of KGs reveal how patients discuss disease factors and pharmacology on social media 3.3, and led to another novel method to extract focused digital cohorts from general-purpose social media whose discourse is more relevant to epilepsy or other biomedical problems [90].
The metric backbone is particularly amenable to simplifying the visualization of network data [19]. Thus, we developed geospatial map-like visualizations of sparsified KGs, which enable the intuitive exploration of networks [94, 96], interactive search and extraction of relevant underlying data items, and merging of myAURA’s multi-layer KG into a single map (§3.4). The ability to search and explore myAURA’s heterogeneous data sources via a single sparsified and combined map is a useful feature for integrating all relevant information for PWEC and epilepsy researchers.
For PWEC, the KG maps, or even the underlying sparsified network directly, can provide meaningful information in an easily consumable visual format. They can, for example, query multiple different sources of information about topics such as medications, side effects, scientific literature, and clinical trials all on one platform. The resulting visualization can display the relationships among these important topics acquired from a robust combination of data sources that PWEC would not typically be able to access, such as large samples of social media and discussion forums related to epilepsy, clinical trials, or scientific literature.
Clinicians such as neurologists, epileptologists, nurse practitioners, physician assistants, psychologists, etc., can quickly and easily visualize knowledge about practice-relevant topics affecting PWE. Once a working tool is produced addressing the privacy and access rights for each data source, the KG visualization of EHR and scientific literature data could be used quickly, even during a patient encounter, to guide assessments or recommendations in the patient’s treatment. In particular, the access and visualization of a combination of data from social media and EHR can reveal the relationship between important issues as discussed by PWEC and in association with their health records. Thus, in forthcoming work, we will validate these sparsified visualizations and different methods of combining multi-layer edges with both PWEC and epilepsy researchers.
All steps of our approach relied on on stakeholder input, whereby myAURA’s functionalities and interface were developed and pilot tested with patient-centered design principles based on focus groups studies (§3.5). The participation of the EFA alongside the focus groups in all aims was instrumental in informing the user-centered design and development of the overall myAURA project according to stakeholder needs. This includes studying how social media can assist in predicting epilepsy outcomes [28], human-centered dictionary refinement [31], human-centered app design [18, 17], epilepsy-focused digital cohort extraction [90], and our biomedical data science approach at large. To our knowledge, our team is the first to investigate PWEC practices and preferences for seeking out and curating epilepsy-related content. The focus on stakeholders further resulted in a design framework devloped from up-close and personal descriptions of the challenges faced by PWEC which will be leveraged to improve myAURA, and is also useful for others interested in developing a similar app [18, 17]. Indeed, the methods we detail here, and several of the data sources we have federated (e.g., EHR, social media, clinical trials) are relevant not only to epilepsy patients but also to those with other chronic conditions.
Now that the data federation, KG construction, inference based on metric backbone sparsification, multi-layer map visualization, human-centered design requirements and pilot testing for myAURA have been completed—with constituent methods, tools, and code shared with relevant communities—app production and deployment will continue in partnership with the EFA and other stakeholders.
5 Conclusion
Chronic health conditions unfold as a complex interplay among biological, psychological, and societal factors that change over time. Such complex multi-layer dynamics of human health require new science, new tools, and new interdisciplinary thinking to accelerate data-driven discovery and management of chronic conditions [98, 99, 100]. We reported the advances our team has made in developing myAURA a personal library application prototype and suite of methods to support epilepsy research and self-management through the daunting array of treatments, drugs, interactions and side effects, diet, lifestyle, and stigma. We worked with PWEC and stakeholders to design and pilot-test the approach, which entailed federating many large-scale heterogeneous data streams into an epilepsy knowledge graph that we analyzed using novel network inference, sparsification, and visualization methods in support of personalized recommendation, digital cohort identification, understanding of pharmacology in epilepsy, etc. We showed that significant advances empowered by biomedical informatics are within reach for self-management and scientific discovery in epilepsy, especially by leveraging unconventional data from EHR, social media, and digital cohorts, as well as computational and theoretical advances in characterizing and visualizing multilayer complex networks. We look forward to continue developing the myAURA system towards production and deployment of a full application for epilepsy, as well expanding it to include a broad range of chronic conditions and benefit many more patients in the future.
6 Acknowledgements
All authors were partially funded by NIH, National Library of Medicine Grant 1R01LM012832. In addition, R.B.C, was partially funded by Fundação para a Ciência e a Tecnologia (grant PTDC/MEC-AND/30221/2017). L.M.R., K.B., and X.W. were partially funded by a National Science Foundation Research Traineeship “Interdisciplinary Training in Complex Networks and Systems” Grant 1735095. L.M.R. was also partially funded by a Fulbright Commission fellowship and by Fundação para a Ciência e a Tecnologia (grant 2022.09122.PTDC). The funders had no role in study design, data collection and analysis, decision to publish, or preparation of the manuscript.
References
- 1. EFA . Epilepsy Statistics. Available from http://www.epilepsy.com/learn/epilepsy-statistics 2016.
- 2. Ngugi AK, Bottomley C, Kleinschmidt I, Sander JW, Newton CR. Estimation of the burden of active and life-time epilepsy: a meta-analytic approach. Epilepsia. 2010;51(5):883–890.
- 3. Hesdorffer DC, Beck V, Begley CE, et al. Research implications of the Institute of Medicine Report, Epilepsy Across the Spectrum: Promoting Health and Understanding. Epilepsia. 2013;54(2):207–216.
- 4. Mölleken D, Richter-Appelt H, Stodieck S, Bengner T. Influence of personality on sexual quality of life in epilepsy. Epileptic disorders: international epilepsy journal with videotape. 2010;12(2):125–132.
- 5. Tomson T, Surges R, Delamont R, Haywood S, Hesdorffer DC. Who to target in sudden unexpected death in epilepsy prevention and how? Risk factors, biomarkers, and intervention study designs. Epilepsia. 2016;57(S1):4–16.
- 6. Miller WR, Young N, Friedman D, Buelow JM, Devinsky O. Discussing sudden unexpected death in epilepsy (SUDEP) with patients: Practices of health-care providers. Epilepsy & Behavior. 2014;32:38–41.
- 7. Austin JK, Hesdorffer DC, Liverman CT, Schultz AM. Testimonies submitted for the Institute of Medicine report: Epilepsy across the spectrum: Promoting health and understanding. Epilepsy & Behavior. 2012;25(4):634–661.
- 8. England MJ, Liverman CT, Schultz AM, Strawbridge LM. Epilepsy across the spectrum: Promoting health and understanding.: A summary of the Institute of Medicine report. Epilepsy & Behavior. 2012;25(2):266–276.
- 9. Bazargan-Hejazi S, Dehghan K, Edwards C, et al. The health burden of non-communicable neurological disorders in the USA between 1990 and 2017. Brain Communications. 2020;2(2):fcaa097.
- 10. Wood IB, Correia RB, Miller WR, Rocha LM. Small cohort of patients with epilepsy showed increased activity on Facebook before sudden unexpected death. Epilepsy & Behavior. 2022;128:108580.
- 11. Miller WR, Wion RK, Eads P. Evaluation of emergency department-based seizure and epilepsy education: Exploring the need for early epilepsy self-management intervention. Epilepsy & Behavior. 2021;116:107702.
- 12. Majersik JJ, Ahmed A, Chen IHA, et al. A shortage of neurologists–we must act now: a report from the AAN 2019 Transforming Leaders Program. Neurology. 2021;96(24):1122–1134.
- 13. Elkhider H, Sharma R, Sheng S, et al. Predictors of no-show in neurology clinics. in Healthcare;10:599MDPI 2022.
- 14. Ross SC. An option for improving access to outpatient general neurology. Neurology: Clinical Practice. 2014;4(5):435–440.
- 15. Unger WR, Buelow JM. Hybrid concept analysis of self-management in adults newly diagnosed with epilepsy. Epilepsy & Behavior. 2009;14(1):89–95.
- 16. Miller WR. Patient-centered outcomes in older adults with epilepsy. Seizure. 2014;23(8):592–597.
- 17. Min A, Miller WR, Rocha LM, Börner K, Brattig Correia R, Shih PC. Just In Time: Challenges and Opportunities of First Aid Care Information Sharing for Supporting Epileptic Seizure Response. Proc. ACM Hum.-Comput. Interact.. 2021;5(CSCW1):113.
- 18. Min A, Miller WR, Rocha LM, Börner K, Brattig Correia R, Shih PC. Understanding Contexts and Challenges of Information Management for Epilepsy Care. Proc. SIGCHI Conference on Human Factors in Computing Systems 2013. 2023;328.
- 19. Simas T, Correia RB, Rocha LM. The distance backbone of complex networks. Journal of Complex Networks. 2021;9:cnab021.
- 20. Steyvers M, Tenenbaum JB. The Large-Scale Structure of Semantic Networks: Statistical Analyses and a Model of Semantic Growth. Cognitive Science. 2005;29(1):41-78.
- 21. Johnson N, Rasmussen S, Joslyn C, Rocha L, Smith S, Kantor M. Symbiotic intelligence: self-organizing knowledge on distributed networks, driven by human interaction. in Proceedings of the 6th International Conference on Artificial LifeMIT Press 1998.
- 22. Börner K, Sanyal S, Vespignani A. Network science. Annual Review of Information Science and Technology. 2007;41(1):537–607.
- 23. Wasserman S, Faust K. Social Network Analysis: Methods and Applications. Cambridge University Press 1994.
- 24. Monge PR, Contractor NS. Theories of Communication Networks. Oxford University Press 2003.
- 25. Barabási AL. Linked: The new science of networks. AAPT 2003.
- 26. Chakrabarti D, Faloutsos C. Graph Mining: Laws, Generators, and Algorithms. ACM Computing Surveys. 2006;38(1).
- 27. Börner K. Plug-and-play macroscopes. Communications of the ACM. 2011;54(3):60.
- 28. Correia RB, Wood IB, Bollen J, Rocha LM. Mining social media data for biomedical signals and health-related behavior. Annual Review of Biomedical Data Science. 2020;3:433–458.
- 29. Correia RB, Li L, Rocha LM. Monitoring Potential Drug Interactions and Reactions via Network Analysis of Instagram User Timelines. in Pacific Symposium on Biocomputing (21 . , ed.):492–503 2016.
- 30. Correia RB. Prediction of Drug Interaction and Adverse Reactions, with data from Electronic Health Records, Clinical Reporting, Scientific Literature, and Social Media, using Complexity Science Methods. PhD thesisLuddy School of Informatics, Computing & Engineering, Indiana UniversityBloomington, IN 2019.
- 31. Min A, Correia R, Wang X, Shih P, Miller W, Rocha L. Refinement of an Epilepsy Dictionary through Human Annotation of Health-related posts on Instagram. 2024:Submitted.
- 32. Wood IB, Varela PL, Bollen J, Rocha LM, Gonçalves-Sá J. Human Sexual Cycles are Driven by Culture and Match Collective Moods. Scientific Reports. 2017;7(1):17973.
- 33. Wood IB. Time-Series Analysis of Sentiment in Social Media Can Predict Individual and Collective Behavior of Public Health Significance. PhD thesisIndiana University 2023.
- 34. Davis CA, Ciampaglia GL, Aiello LM, et al. OSoMe: The IUNI Observatory on Social Media. PeerJ Computer Science. 2016;2:e87.
- 35. Correia RB, Araújo LP, Mattos MM, Rocha LM. City-wide Analysis of Electronic Health Records Reveals Gender and Age Biases in the Administration of Known Drug-Drug Interactions. npj Digital Medicine. 2019. In Press.
- 36. Sánchez-Valle J, Correia RB, Camacho-Artacho M, et al. Prevalence and differences in the co-administration of drugs known to interact: an analysis of three distinct and large populations. BMC medicine. 2024;22(1):166.
- 37. Zarin DA, Tse T, Williams RJ, Califf RM, Ide NC. The ClinicalTrials.gov Results Database–Update and Key Issues. New England Journal of Medicine. 2011;364(9):852–860.
- 38. Wishart DS, Feunang YD, Guo AC, et al. DrugBank 5.0: a major update to the DrugBank database for 2018. Nucleic Acids Research. 2017;46(D1):D1074–D1082.
- 39. Kuhn M, Letunic I, Jensen LJ, Bork P. The SIDER database of drugs and side effects. Nucleic Acids Research. 2015;44(D1):D1075–D1079.
- 40. US Food and Drug Administration . FDA Adverse Event Reporting System (FAERS). Available from http://www.fda.gov/Drugs/GuidanceComplianceRegulatoryInformation/Surveillance/AdverseDrugEffects 2019.
- 41. US Food and Drug Administration . Medwatch: What is a serious adverse event. 2017.
- 42. American Epilepsy Society . Find a Doctor Database. Available from https://my.aesnet.org/FindaDoctor 2017.
- 43. Sarker A, Ginn R, Nikfarjam A, et al. Utilizing social media data for pharmacovigilance: A review. Journal of Biomedical Informatics. 2015;54:202–212.
- 44. Schwartz HA, Sap M, Kern ML, et al. Predicting Individual Well-Being Through The Language of Social Media. in Pacific Symposium on Biocomputing;21:516–527 2016.
- 45. Kolchinsky A, Lourenço A, Li L, Rocha LM. Evaluation of linear classifiers on articles containing pharmacokinetic evidence of drug-drug interactions. in Pacific Symposium on Biocomputing;18:409–420 2013.
- 46. Kolchinsky A, Lourenço A, Wu HY, Li L, Rocha LM. Extraction of Pharmacokinetic Evidence of Drug-Drug Interactions from the Literature. PLOS ONE. 2015;10(5):1–24.
- 47. Zhang S, Wu H, Wang L, et al. Translational drug–interaction corpus. Database. 2022;2022:baac031.
- 48. Lin FP, Anthony S, Polasek TM, Tsafnat G, Doogue MP. BICEPP: an example-based statistical text mining method for predicting the binary characteristics of drugs. BMC Bioinformatics. 2011;12(1):112.
- 49. MedDRA . Medical Dictionary for Regulatory Activities. meddra.org. Accessed: 2021-11-19.
- 50. Wu HY, Shendre A, Zhang S, et al. Translational knowledge discovery between drug interactions and pharmacogenetics. Clinical Pharmacology & Therapeutics. 2020;107(4):886–902.
- 51. Bradley M, Lang P. Affective Norms for English Words (ANEW): Technical manual and affective ratings. Technical Report C-1The Center for Research in Psychophysiology,University of Florida 1999.
- 52. Hutto C, Gilbert E. VADER: A Parsimonious Rule-based Model for Sentiment Analysis of Social Media Text. in Proceedings of the Eighth International AAAI Conference on Weblogs and Social Media 2014.
- 53. Tausczik YR, Pennebaker JW. The Psychological Meaning of Words: LIWC and Computerized Text Analysis Methods. Journal of Language and Social Psychology. 2010;29(1):24–54.
- 54. Simas T, Rocha LM. Distance Closures on Complex Networks. Network Science. 2015;3(2):227–268.
- 55. Abi-Haidar A, Kaur J, Maguitman A, et al. Uncovering protein interaction in abstracts and text using a novel linear model and word proximity networks. Genome biology. 2008;9(Suppl 2):S11.
- 56. Jaccard P. Distribution de la flore alpine dans le bassin des Dranses et dans quelques régions voisines.. Bulletin de la Société Vaudoise des Sciences Naturelles. 1901;37:241–272.
- 57. Grefenstette G. Explorations in Automatic Thesaurus Discovery. Kluwer Academic 1994.
- 58. Ciampaglia GL, Shiralkar P, Rocha LM, Bollen J, Menczer F, Flammini A. Computational Fact Checking from Knowledge Networks. PLOS ONE. 2015;10(6):1–13.
- 59. Baeza-Yates R, Ribeiro-Neto B. Modern Information Retrieval. New York: ACM Press, Addison-Wesley 1999.
- 60. Turney PD. Mining the Web for Synonyms: PMI-IR versus LSA on TOEFL. in Proceedings of the European Conference on Machine Learning;2167(Berlin, Heidelberg):491–502Springer Berlin Heidelberg 2001.
- 61. Klir GJ. Uncertainty and Information: Foundations of Generalized Information Theory. Wiley-IEEE Press 2005.
- 62. Rocha LM. Semi-metric Behavior in Document Networks and its Application to Recommendation Systems. in Soft Computing Agents: A New Perspective for Dynamic Information Systems (Loia V. , ed.):137–163IOS Press 2002.
- 63. Rocha LM, Simas T, Rechtsteiner A, Giacomo MD, Luce R. MyLibrary@LANL: Proximity and Semi-metric Networks for a Collaborative and Recommender Web Service. in Proceedings of the 2005 IEEE/WIC/ACM International Conference on Web Intelligence (WI’05):565–571IEEE Press 2005.
- 64. Simas T, Rocha LM. Semi-metric Networks for Recommender Systems. in Proceedings of the The 2012 IEEE/WIC/ACM International Joint Conferences on Web Intelligence and Intelligent Agent TechnologyWI-IAT ’12(Washington, DC, USA):175–179IEEE Computer Society 2012.
- 65. Verspoor K, Cohn J, Joslyn C, et al. Protein annotation as term categorization in the gene ontology using word proximity networks. BMC Bioinformatics. 2005;6(1):S20.
- 66. Kolchinsky A, Abi-Haidar A, Kaur J, Hamed AA, Rocha LM. Classification of Protein-Protein Interaction Full-Text Documents Using Text and Citation Network Features. IEEE/ACM Transactions on Computational Biology and Bioinformatics. 2010;7(3):400–411.
- 67. Lourenço A, Conover M, Wong A, et al. A linear classifier based on entity recognition tools and a statistical approach to method extraction in the protein-protein interaction literature. BMC Bioinformatics. 2011;12(8):S12.
- 68. Manz T, Gold I, Patterson NH, et al. Viv: multiscale visualization of high-resolution multiplexed bioimaging data on the web. Nature methods. 2022;19(5):515–516.
- 69. Börner K. Atlas of Forecasts: Modeling and Mapping Desirable Futures. The MIT Press 2021.
- 70. Azoulay P, Graff-Zivin J, Uzzi B, et al. Toward a more scientific science. Science. 2018;361(6408):1194–1197.
- 71. Börner K. Atlas of Knowledge: Anyone Can Map. The MIT Press 2015.
- 72. Ginda M, Herr BW, Börner K, others . Introducing the open biomedical map of science. Frontiers in Research Metrics and Analytics. 2023;8.
- 73. Correia RB, Almeida JM, Wyrwoll MJ, et al. The conserved transcriptional program of metazoan male germ cells uncovers ancient origins of human infertility. eLife. 2024:In Press. Biorxiv: 2022.03.02.482557.
- 74. Kalavri V, Simas T, Logothetis D. The Shortest Path is Not Always a Straight Line: Leveraging Semi-metricity in Graph Analysis. Proc. VLDB Endow.. 2016;9(9):672–683.
- 75. Sanchez-Valle J. DDInteract. 2024. Available at: http://disease-perception.bsc.es/ddinteract/.
- 76. Correia RB, Wood IB, Ratkiewicz N, Miller W, Rocha LM. Public health monitoring of drug interactions, patient cohorts, and behavioral outcomes via network analysis using multi-source user timelines. in Conference on Complex Systems 2017(Cancun, Mexico) 2017.
- 77. Wang X, Correia RB, Wood IB, et al. Systematic prediction of drug-drug-interaction study types and discovery of evidence gaps in the literature. 2024;Submitted.
- 78. Lü L, Zhou T. Link prediction in complex networks: A survey. Physica A: Statistical Mechanics and its Applications. 2011;390(6):1150–1170.
- 79. Li X, Chen H. Recommendation as link prediction in bipartite graphs: A graph kernel-based machine learning approach. Decision Support Systems. 2013;54(2):880–890.
- 80. Dong Y, Tang J, Wu S, et al. Link Prediction and Recommendation across Heterogeneous Social Networks. in 2012 IEEE 12th International Conference on Data Mining:181–190 2012.
- 81. Brattig Correia R, Barrat A, Rocha LM. Contact networks have small metric backbones that maintain community structure and are primary transmission subgraphs. PLOS Computational Biology. 2023;19(2):e1010854.
- 82. Soriano Paños D, Costa FX, Rocha LM. Semi-metric topology characterizes epidemic spreading on complex networks. arXiv e-prints. 2023:arXiv–2311.
- 83. Galvin F, Shore SD. Distance Functions and Topologies. The American Mathematical Monthly. 1991;98(7):620–623.
- 84. Dijkstra E. A note on two problems in connexion with graphs. Numerische mathematik. 1959;1(1):269–271.
- 85. Zwick U. All pairs shortest paths using bridging sets and rectangular matrix multiplication. Journal of the ACM (JACM). 2002;49(3):289–317.
- 86. Dorsant-Ardon V, Sanjay AB, Rocha LM, Correia RB, Apostolova LG. Gene co-expression network analyses in Mild cognitive impairment. Alzheimer’s & Dementia. 2023;19:e082238.
- 87. Simas T, Suckling J. Commentary: Semi-Metric Topology of the Human Connectome: Sensitivity and Specificity to Autism and Major Depressive Disorder. Frontiers in Neuroscience. 2016;10:353.
- 88. Peeters S, Simas T, Suckling J, et al. Semi-metric analysis of the functional brain network: Relationship with familial risk for psychotic disorder. NeuroImage: Clinical. 2015;9:607–616.
- 89. Team C. DistanceClosure. 2024. Available at: https://github.com/CASCI-lab/distanceclosure.
- 90. Guo Z, Felag J, Rozum J, Correia R, Rocha L. Selection of relevant patient cohorts from social media using the metric backbone of knowledge networks. 2024;Submitted.
- 91. Perry BL, Pescosolido BA, Small ML, McCranie A. Introduction to the special issue on ego networks. Network Science. 2020;8(2):137–141.
- 92. Team . MyAura-specific knowledge graph visualization tool. 2023. Available at: https://cns-iu.github.io/myaura/.
- 93. Borner k. map4sci visualization suite. 2023. Available at: https://github.com/cns-iu/map4sci/.
- 94. DeLuca F, Hossain I, Kobourov S, Börner K. Multi-level tree based approach for interactive graph visualization with semantic zoom. 2019.
- 95. Ahmed R, Angelini P, Bekos MA, et al. Splitting vertices in 2-layer graph drawings. IEEE Computer Graphics and Applications. 2023.
- 96. Saket B, Scheidegger C, Kobourov S, Börner K. Map-Based Visualizations Increase Recall Accuracy of Data. Computer Graphics Forum. 2015;34:441-450.
- 97. Laugwitz B, Held T, Schrepp M. Construction and Evaluation of a User Experience Questionnaire. in HCI and Usability for Education and Work (Holzinger A. , ed.)(Berlin, Heidelberg):63–76Springer Berlin Heidelberg 2008.
- 98. Pescosolido BA, Olafsdottir S, Sporns O, et al. The social symbiome framework: Linking genes-to-global cultures in public health using network science. in Handbook of Applied System Science:25–48Taylor and Francis Inc. 2016.
- 99. Trochim WM, Cabrera DA, Milstein B, Gallagher RS, Leischow SJ. Practical challenges of systems thinking and modeling in public health. American journal of public health. 2006;96(3):538–546.
- 100. Rusoja E, Haynie D, Sievers J, et al. Thinking about complexity in health: a systematic review of the key systems thinking and complexity ideas in health. Journal of evaluation in clinical practice. 2018;24(3):600–606.