Understanding solid nitrogen through machine learning simulation
Abstract
We construct a fast, transferable, general purpose, machine-learning interatomic potential suitable for large-scale simulations of \ceN2. The potential is trained only on high quality quantum chemical molecule-molecule interactions, no condensed phase information is used. The potential reproduces the experimental phase diagram including the melt curve and the molecular solid phases of nitrogen up to {10}GPa. This demonstrates that many-molecule interactions are unnecessary to explain the condensed phases of \ceN2. With increased pressure, transitions are observed from cubic (-\ceN2), which optimises quadrupole-quadrupole interactions, through tetragonal (-\ceN2) which allows more efficient packing, through to monoclinic (-\ceN2) which packs still more efficiently. On heating, we obtain the hcp 3D rotor phase (-\ceN2) and, at pressure, the cubic -\ceN2 phase which contains both 3D and 2D rotors, tetragonal -\ceN2 phase with 2D rotors and the rhombohedral -\ceN2. Molecular dynamics demonstrates where these phases are indeed rotors, rather than frustrated order. The model does not support the existence of the wide range of bondlengths reported for the complex -\ceN2 phase. The thermodynamic transitions involve both shifts of molecular centres and rotations of molecules. We simulate these phase transitions between finding that the onset of rotation is rapid whereas motion of molecular centres is inhibited and the cause of the observed sluggishness of transitions. Routine density functional theory calculations give a similar picture to the potential.
I Introduction
Bonding in solid nitrogen is extremely inhomogeneous. On one hand, the triple bond of nitrogen is very strong with a dissociation energy of {9.72}eV/molecule [Strak2007]. On the other, interactions between molecules are weak, and the free energy differences between competing crystal structures can be extremely small, in the meV/molecule range.
The many ways to orient the \ceN2 molecule mean that the pressure-temperature phase diagram of condensed nitrogen is extremely complex. The molecular stability of nitrogen persists to over {100}GPa, so crystal phases below that pressure involve ordering of well-defined molecules. Above {100}GPa, molecular bond dissociates and either an amorphous solid [Goncharov2000, Eremets2001] or the crystalline cubic gauche structure [Eremets2004] is observed to form depending on exact P, T conditions.
Even within the molecular limit, there is a surprisingly large diversity of crystal structures. In addition to the melt, a series of six crystalline phases below {10}GPa had been experimentally reported by multiple groups up to 2016 ( and [Scurlock1992, Eucken1916, Swenson1955, Stewart1956, Cromer1981, Schiferl1985, mills1986structures, Olijnyk1990, stinton2009crystal]), and more recently two more ( and [frost2016novel, turnbull2018unusually]). Transformations between them can be sluggish, so experiments tend to show considerable hysteresis. With the exception of iota, the reported \ceN2 bondlengths in the crystal phases are all close to {1.09}Å .
The accurate description of the potential energy surface of the system of interacting \ceN2 molecules plays an essential role in governing its dynamics and properties. Solid nitrogen has been studied extensively with a variety of theoretical methods such as free electron gas model [LeSarGordon1983N2DFT, LeSar1984ImprovedGasModelN2] (FEG), density functional theory (DFT) [pickard2009high], Møller–Plesset perturbation theory [Erba2011] (MP), coupled cluster (CC) [Hellmann2013], Monte Carlo [Belak1988, Belak1990, Mulder1996, Mulder1997] (MC), molecular dynamics (MD) and others [Zunger1975, Murthy1980, NoseKlein1986, Etters1986].
For the purpose of atomistic simulation a number of interatomic potentials (IP) have been developed. It was quickly recognised that the simple atom-atom pair potentials are insufficient [Murthy1980]. The solid phases of nitrogen have been the subject of extensive MD studies and the ability to reproduce various \ceN2 phases, has been recognised in early reviews [Zunger1975, Murthy1980]. Interestingly, Nose and Klein showed that the phase predicted using LJ atom-atom pairwise potentials was different from that when quadrupole interactions were added, and different again from a formal charge model. [NoseKlein1986]. They argued that the quadrupole-quadrupole interaction is unimportant for \ceN2 at moderate pressure based on the similarity of the -\ceN2 phase to the ambient pressure crystal structure of oxygen. However their simple potential grossly overestimated the volume of the trigonal cell as compared with the experiment and is inadequate for other crystal phases.
While great progress has been made in identifying relevant physical mechanisms governing the behaviour of the nitrogen solid phases, an IP for nitrogen which explains the seven phases below {10}GPa has remained elusive. For a long time it seemed that only potentials specifically fitted to reproduce could obtain it [RaichMills, Mandell1974] and purpose-built potentials were needed to study different crystal phases [KOBASHI198574, NoseKlein1986, Powell1989, Westerhoff1997].
Several of the proposed \ceN2 phases are believed to involve disordered or freely rotating molecules. These two situations are difficult to resolve experimentally, but they constitute an ideal problem to tackle with MD. However accurate IPs have remained the problem. It is perhaps surprising that for such a fundamental system as \ceN2 there is no general purpose transferable IP capable of reproducing well established experimental phases as well as the liquid state. Currently, the NIST Interatomic Potentials repository lists just one 6-12 LJ potential with the following note: “(…) its ability to model structures other than dimers is unknown” [Becker2013, Hale2018]. A brief test verifies that it is rather insufficient for condensed phases.
Machine learning interatomic potentials (MLIP) trained on density functional theory data have become a go-to method for describing complex phases in condensed matter. We have developed a flexible machine learning package, Ta-dah!, which enables us to implement this, alongside community codes CASTEP and LAMMPS [Segall2002, Thompson2022LAMMPSScales]. Unfortunately, much understanding of the underlying chemistry is lost in the gigabytes of data needed for an accurate DFT calculation. This is then compounded by deriving a potential via “machine learning”, a process which is good at replicating nature, but not equivalent to “researcher understanding”.
Moreover, machine-learning models are often only reliable for interpolating within the regime where they are trained - successful extrapolation requires physical insight.
The Frenkel line for nitrogen was previously studied with a Ta-dah! potential trained directly on CCSDT(Q) data [Pruteanu2021]. Therein we introduced a self-teaching method for machine learning, in which a series of trial MLIPS are built, each of which is used to generate a training dataset for its successor. While the model was successful it is still just a black box with limited transferability beyond the training dataset.
Consequently, here we build a readily understandable model for nitrogen with greatly improved transferability. We demonstrate that the low pressure \ceN2 phases can be readily understood by two-molecule pairwise interactions, trained with no reference to condensed phase electronic structure calculation.
This paper is structured as follows: first, we outline the machine-learning procedure as implemented in the Ta-dah! package; second, the methods are then developed to generate a model based on CCSDT(Q) calculations; third, the physical accuracy of the potential is assessed in large-scale simulations by comparison to the known experimental phase diagram of \ceN2.
II Potential Development
The potential developed in this report makes use of our Ta-dah! software which is publicly available at https://git.ecdf.ed.ac.uk/tadah along with an extensive documentation. The package is designed to assist in the development of custom-made MLIPs and deployment of those in LAMMPS[Thompson2022LAMMPSScales] via a provided plugin. Ta-dah! is written in modern C++ and its modular structure allows rapid implementation and testing of new ideas, followed by seamless deployment to large-scale MD simulations. The code provides an easy-to-use command line interface as well as C++ application programming interface for more advanced use.
The small energy differences between different competing solid phases require extremely accurate training datasets, including accurate dispersion forces as well as an adequate parametrisation procedure. Ta-dah! incorporates a two-stage fitting procedure where the nonlinear hyperparameters in the model’s descriptors are simultaneously optimised along with the usual machine-learning of model parameters with linear algebra. The detailed description of Ta-dah! machine-learning and hyperparametrisation procedure is published elsewhere[thesis]. Here we limit our discussion to physically meaningful detail.
The local energy of molecule is obtained by iterating over all of its nearest neighbouring molecules within a center of mass cutoff distance and summing over each molecule-molecule interaction in a pairwise fashion. The total energy of the system, is then obtained by accumulating all local molecular energies
| (1) |
The atomic forces are readily available from the derivative of the total energy with respect to the atomic positions. However, the force between bonded atoms is removed using the SHAKE algorithm [RYCKAERT1977327] as implemented in LAMMPS such that the bond length is kept fixed at {1.1014}Å . We note that the self-consistency loop in SHAKE is unnecessary for diatomic molecules, so the algorithm is much faster than for more complex molecules.
The choice of rigid bonds means the vibrational degree of freedom is not excited. At {2739}cm^-1, the mode is only excited at around {4000}K, well above any temperatures considered here. Rigid bonding means that the potential has no spurious contribution to the heat capacity, as a flexible bond would. Nevertheless, the inclusion of the bond length in the descriptor implies that the bond energy varies with environment, so the functional form can fit the weakening of the triple bond with pressure.
II.1 Descriptor and regression choice
For the \ceN2 molecular system each atom is permanently associated with a molecule. The local atomic environment of each atom is captured by a combination of two-body (eq. 3) and many-body descriptors (eq. 6) as implemented in Ta-dah!. To represent the interaction between molecules and we choose descriptors to have chemically intuitive meaning.
The two-body terms can be loosely associated with short-ranged repulsion and van der Waals interactions while the many-body term captures complex electric multipole interactions. In practice both terms are fitted simultaneously by polynomial regression.
This means that the energy and forces for each molecule can be written as a sum over interactions between molecules - there are no three-molecule terms. Chemically, this assumes that the electronic structure of the molecule is only perturbatively affected by another nearby molecule. It exploits the fact that quantum forces calculated via the Hellmann-Feynman theorem are simply electrostatic in nature. We further assume a rigid bond, i.e. that the \ceN2 vibration is in its ground state, such that it makes no spurious contribution to specific heat or entropy. These assumptions imply that our simple potential is designed to work at pressures where the triple-bond remains intact and at temperatures up to {2000}K.
Every intermolecular () configuration is uniquely described by the set of six interatomic distances defined between four atoms which are then used as an input to calculate atomic descriptors. Here and are two bonded atoms of molecule and similarly and belong to molecule . The numerical subscripts label atoms in a given molecular interaction, such that the separation between atoms and is . In total, four atomic descriptors are computed, one per atom, for every molecule-molecule interaction. Once all four descriptors are calculated, the energy for this particular interaction is obtained and contributions to the forces are integrated accordingly. The descriptors are then discarded and the process is repeated for next pair.
We use blip basis functions, , for the expansion of both two- and many-body descriptors [Hernandez1997BasisCalculations]. The blip is composed piecewise out of B-spline polynomials in the four intervals [-2,-1], [-1,0], [0,1] and [1,2]. B-splines are localised basis functions used to represent functions in terms of cubic splines [Schumaker2007SplineTheory]. The blip function is defined for our purpose as
| (2) |
where and is a parameter which centres the function on a grid position and controls its width such that is the span of a blip. The shape of the blip functions is similar to Gaussians but because of their full localisation the number of computations can be significantly lower as the latter has infinite span. With the automated hyperparameter tuning, as implemented in Ta-dah!, we were able to reduce both two- and many-body blip grids to just four sets of parameters (SM).
The component of the pairwise descriptor of the -th atom is accumulated by summing over three relevant distances using blip basis functions (eq. 2), where labels one of sets of hyperparameters.
| (3) |
where the sum runs over the neighbours of atom within its own molecule and in one adjacent molecule and is the cosine function (eq. 4) which ensures smooth energy cutoff
| (4) |
The four-body interactions are captured by first computing local atomic densities using Gaussian Type Orbitals [Zhang2018DeepMechanics, Takahashi2017] (eq. 5):
| (5) |
where , and are components of the displacement vector between two interacting atoms.
The summation is constrained (eq. 6) to ensure rotational invariance of the descriptor , despite not having this property.
| (6) |
In the current work, this many-body expansion is truncated at , so that and are all equal to 1. Combined with the four choices of hyperparameters and , this means we use eight components to the many body descriptor for each atom. While in principle this results in a three-body descriptor (the expansion up to the p-orbital) it is found sufficient when combined with a linear regression and second order polynomial basis functions. By taking the combinations of descriptor’s components, an accurate representation of the four dimensional PES of two interacting \ceN2 molecules is obtained.
The descriptor vectors are used to construct a design matrix . The optimal set of weights, , is obtained by employing the Bayesian approach to linear regression
| (7) |
where, is a vector of targets containing training energies and the covariance matrix is given by
| (8) |
The complexity of the model is controlled by the ridge regression with the regularisation parameter which is optimised by the evidence approximation algorithm [Bishop2006]. This automated procedure avoids model overfitting given a sufficiently large training database.
II.2 Training Database
The training set is built upon publicly available quantum chemistry data for two interacting \ceN2 molecules [Hellmann2013]. Therein a coupled cluster method with single, double and noniterative triple excitations (CCSD(T)) were used to obtain 408 data points for 26 distinct angular configurations. The bond length was fixed at {1.1014}Å . The data were further refined by including the effects of quadruple excitations, relativistic effects and core-core and core-valence correlations. A five-site per molecule analytical model is given in the paper which allows one to generate CCSDT(Q)-based energies. This model, called CCSDT(Q)-5, is the only external input to our training data - we do not use any DFT data. In principle, CCSDT(Q)-5 could be applied directly in MD using 5 massless sites in the molecule; however, the presence of the Coulomb term results in the infinite span.
III Molecular dynamics
Our Ta-dah! package provides a plugin for the LAMMPS code to allow the custom made potential to be employed in large-scale MD. The constraint on the bond lengths was enforced using LAMMPS fix SHAKE. For a diatomic molecule this is trivial but for a five-site linear model such as CCSDT(Q)-5 the algorithm is unstable and can generate bogus dipole moments.
Calculations used the NPT ensemble with Nose-Hoover thermostat and barostat for single-phase materials, and the NPH ensemble for the two phase calculations. A timestep of {1}fs is used throughout.
The melting curve is obtained using the phase-coexistence method with the following procedure. The initial box contains the relevant solid phase for a given pressure. The initial configuration is equilibrated for {20}ps in the NPT ensemble with temperature and pressure being close to the expected melt point. After initial equilibration, approximately half of the box is kept frozen while the remaining molecules are first heated to , where is experimental melting temperature, then cooled down to the initial temperature. The stages of melting and cooling takes {10}ps each. Finally the NPH ensemble is used to simulate the entire system for at least {350}ps. The long simulation time is required for the system to equilibrate. There are three possible scenarios at this stage. The molecules in the box either completely solidify, melt or a mixture of solid and liquid is present at the end of the simulation. The first two cases indicate that the initial temperature was too low or to high respectively. The latter case means that the simulation has equilibrated at thermodynamic pressure and temperature conditions somewhere on the melt curve. The time averaged kinetic energy from the last {50}ps is assumed to be corresponding to the melting temperature.
IV NPT MD - Crystal phases
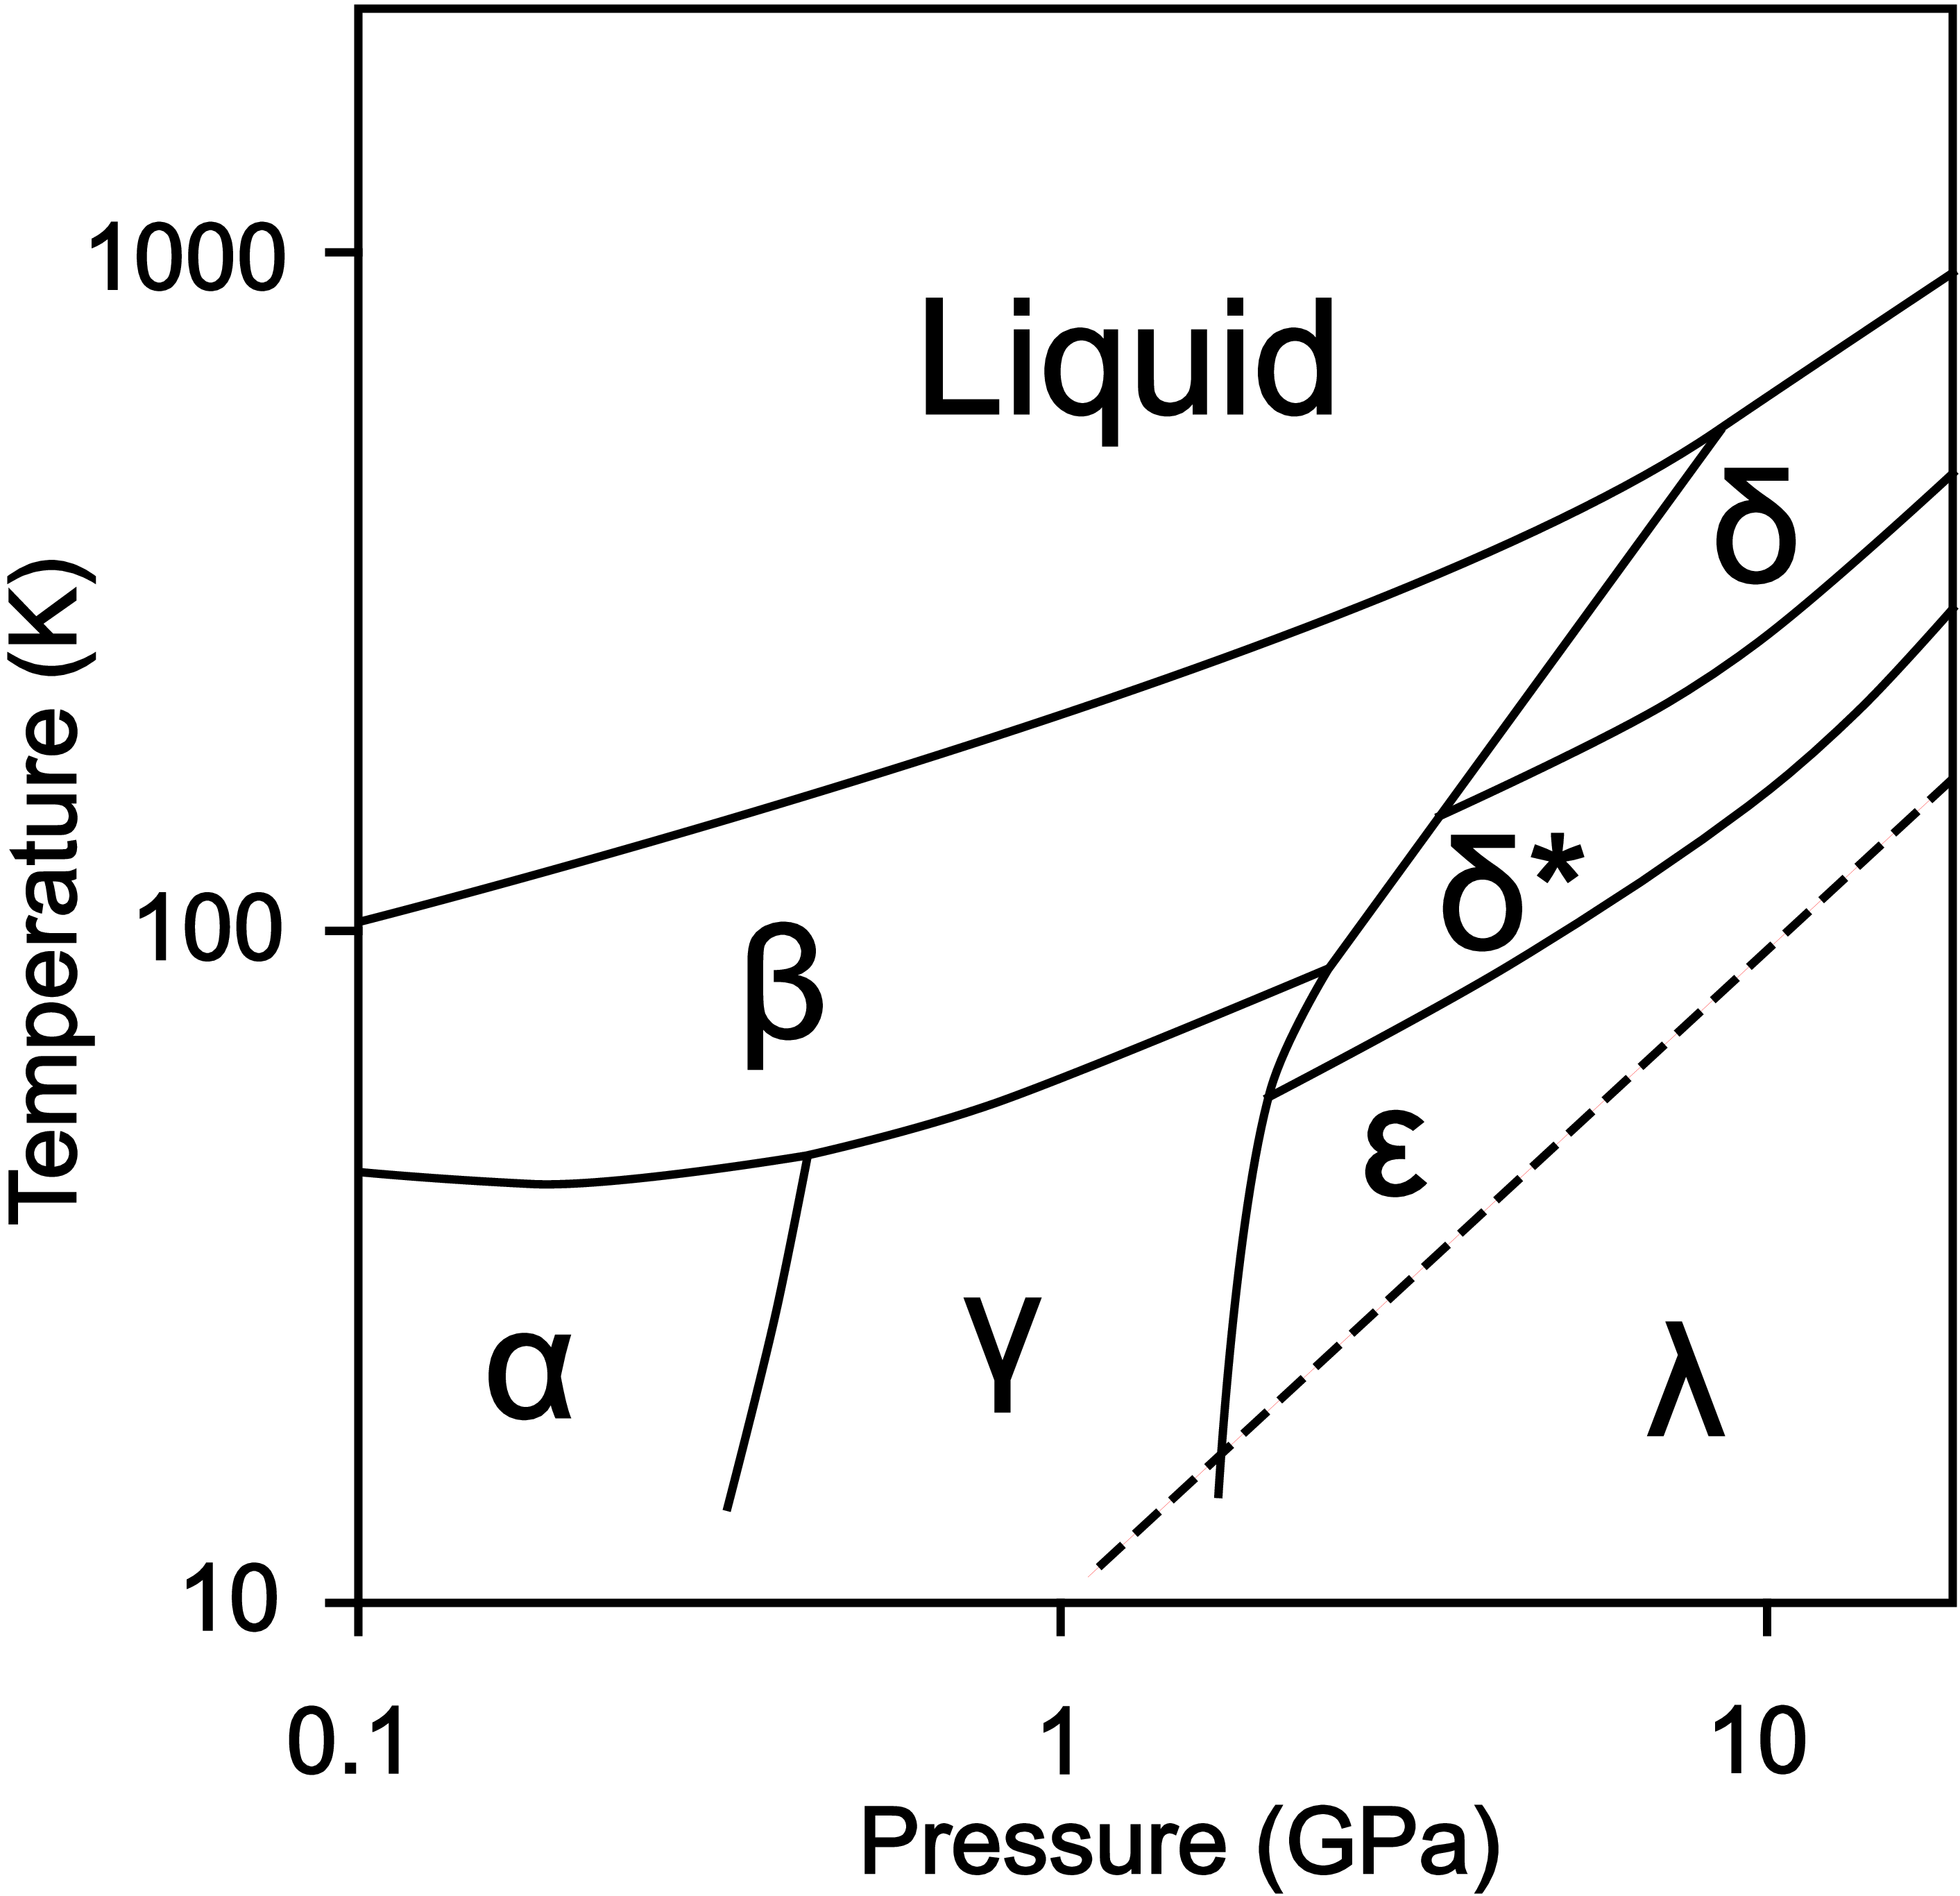
We begin exploration of the \ceN2 system by running NPT MD at different pressure-temperature conditions to establish at least metastability of solid phases. This also allows us to identify the approximate position of the melt curve and some of the solid phases boundaries. Those initial findings are then used to fully resolve the phase diagram of \ceN2 (VII). The obtained phase diagram is then compared with zero temperature DFT calculations (V). The aim is to investigate all relevant phases under {10}GPa which are shown on the experimental phase diagram in Fig. 1.
IV.1 Alpha phase (-\ceN2)
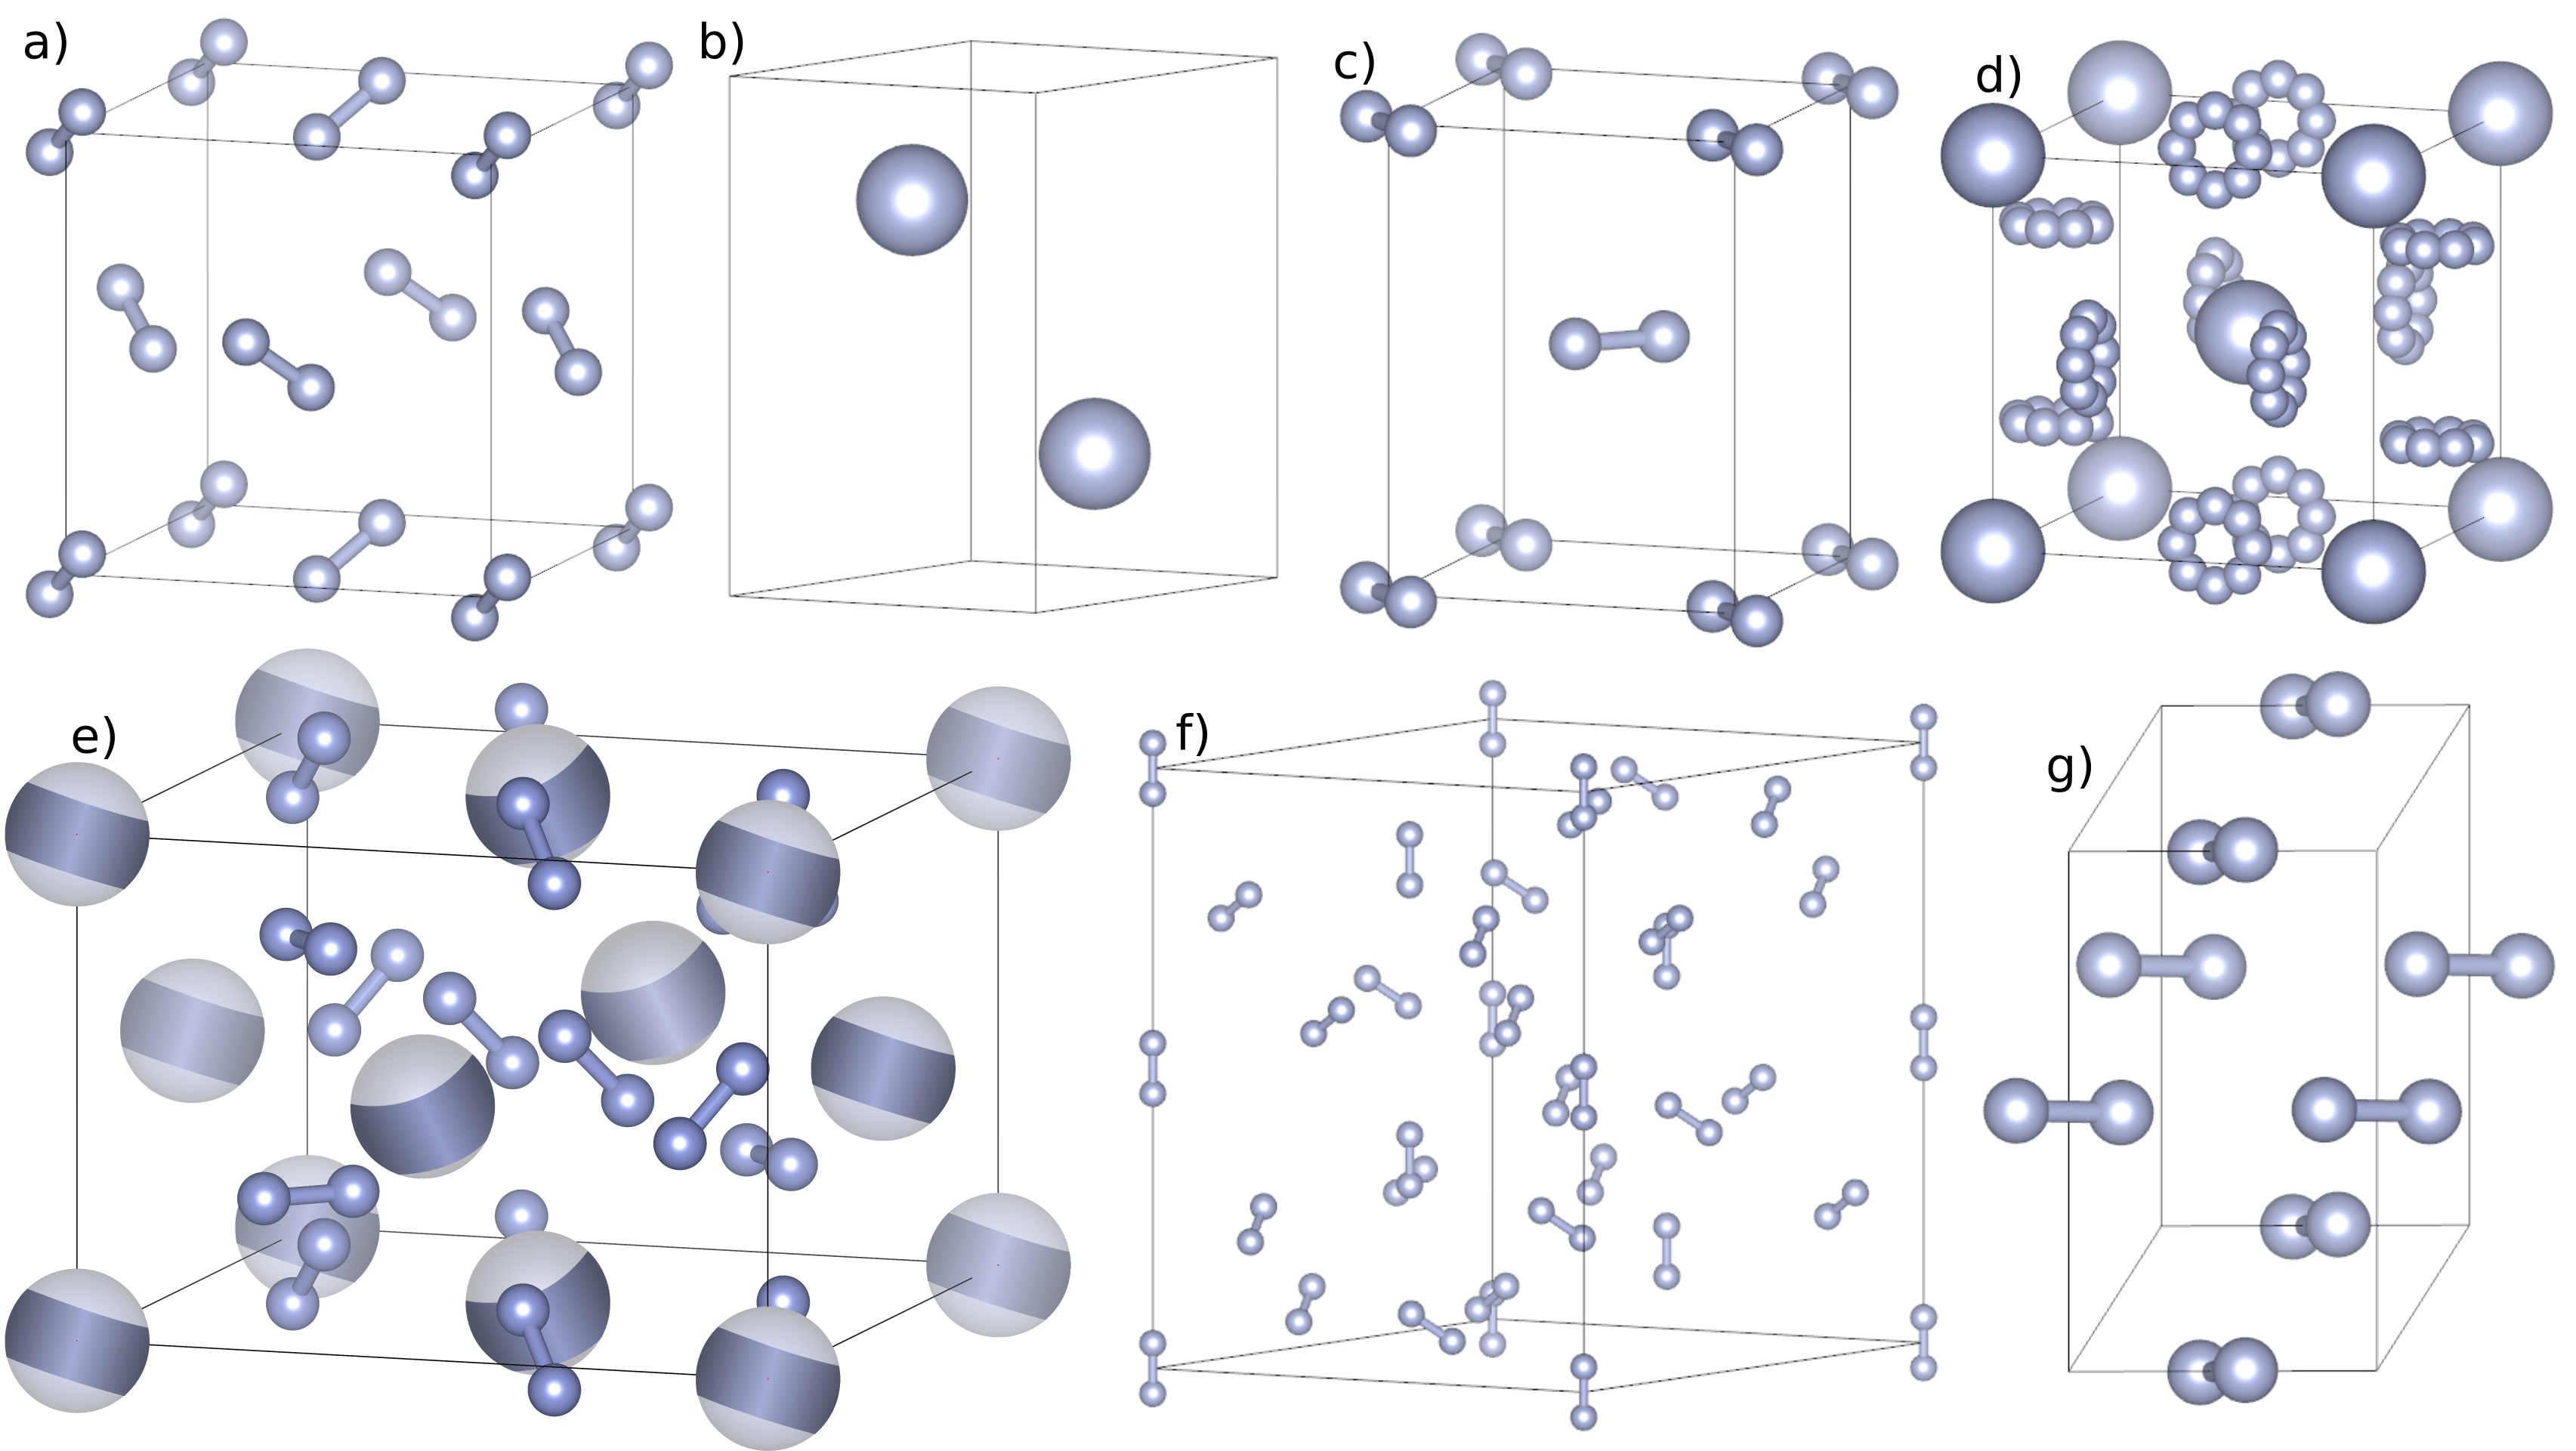
Figure 2a) shows alpha nitrogen -\ceN2 which is a low temperature and low pressure phase. The molecular centres of the -\ceN2 are located on the face centred cubic (fcc) lattice. Each molecule is aligned along a different cube body diagonal which preserves cubic symmetry. In NPT molecular dynamics simulation the -\ceN2 was found to be stable at temperatures above {25}K which is in agreement with the experimental evidence [Swenson1955, Schuch1970]. At temperatures below {20}K it transitions to tetragonal -\ceN2 phase. The computed lattice parameter at {0.4}GPa and {30}K is and is in excellent agreement with the experimental measurement [Schuch1970]. Upon heating, the -\ceN2 libron oscillations increases and around the experimentally observed phase transition to the -\ceN2 phase there is a sudden change to full 3D rotors. We note that the molecular centres remain on the fcc sites.
The compression of -\ceN2 at {15}K produces a transition to a twinned microstructure of -\ceN2 at {7}GPa, suggesting that the transformation path to this defective structure is martensitic. The transition is hindered by the high-energy barrier between the structures along a path that requires both unit cell strain and molecular rotation. We use the NPT ensemble, but the twinning reduces the overall strain in the supercell. The twin boundary has a higher energy than the perfect crystalline -\ceN2, indicating significant hysteresis in the transition.
IV.2 Beta phase (-\ceN2)
The -\ceN2 is a dominant high temperature phase up to around {9}GPa with molecular centres located in a structure close to hexagonal close packing (hcp). The high symmetry can be maintained if the molecules point along the -axis, but this is implausible for a high-T phase and more likely indicates that the atomic positions are highly disordered or rotating [Schuch1970] (see Fig. 2a)). The MD simulations show that the -\ceN2 phase remains stable in the PT conditions where it is experimentally observed. As expected, the molecules are close to freely rotating. The hcp lattice parameters and their respective ratios, as obtained from MD simulations at experimentally relevant pressures and temperatures, are close to the ideal ratio for hexagonal close-packed hard spheres. For example, the calculated lattice parameters at {0.5}GPa and {50}K are and . The obtained values agrees well with the experimental findings of and [Schuch1970]. Upon heating in the NPT ensemble the -\ceN2 melts, while the quenching results in a twinned but ordered structure with molecular centres remaining on the original hcp sites.
IV.3 Gamma phase (-\ceN2)
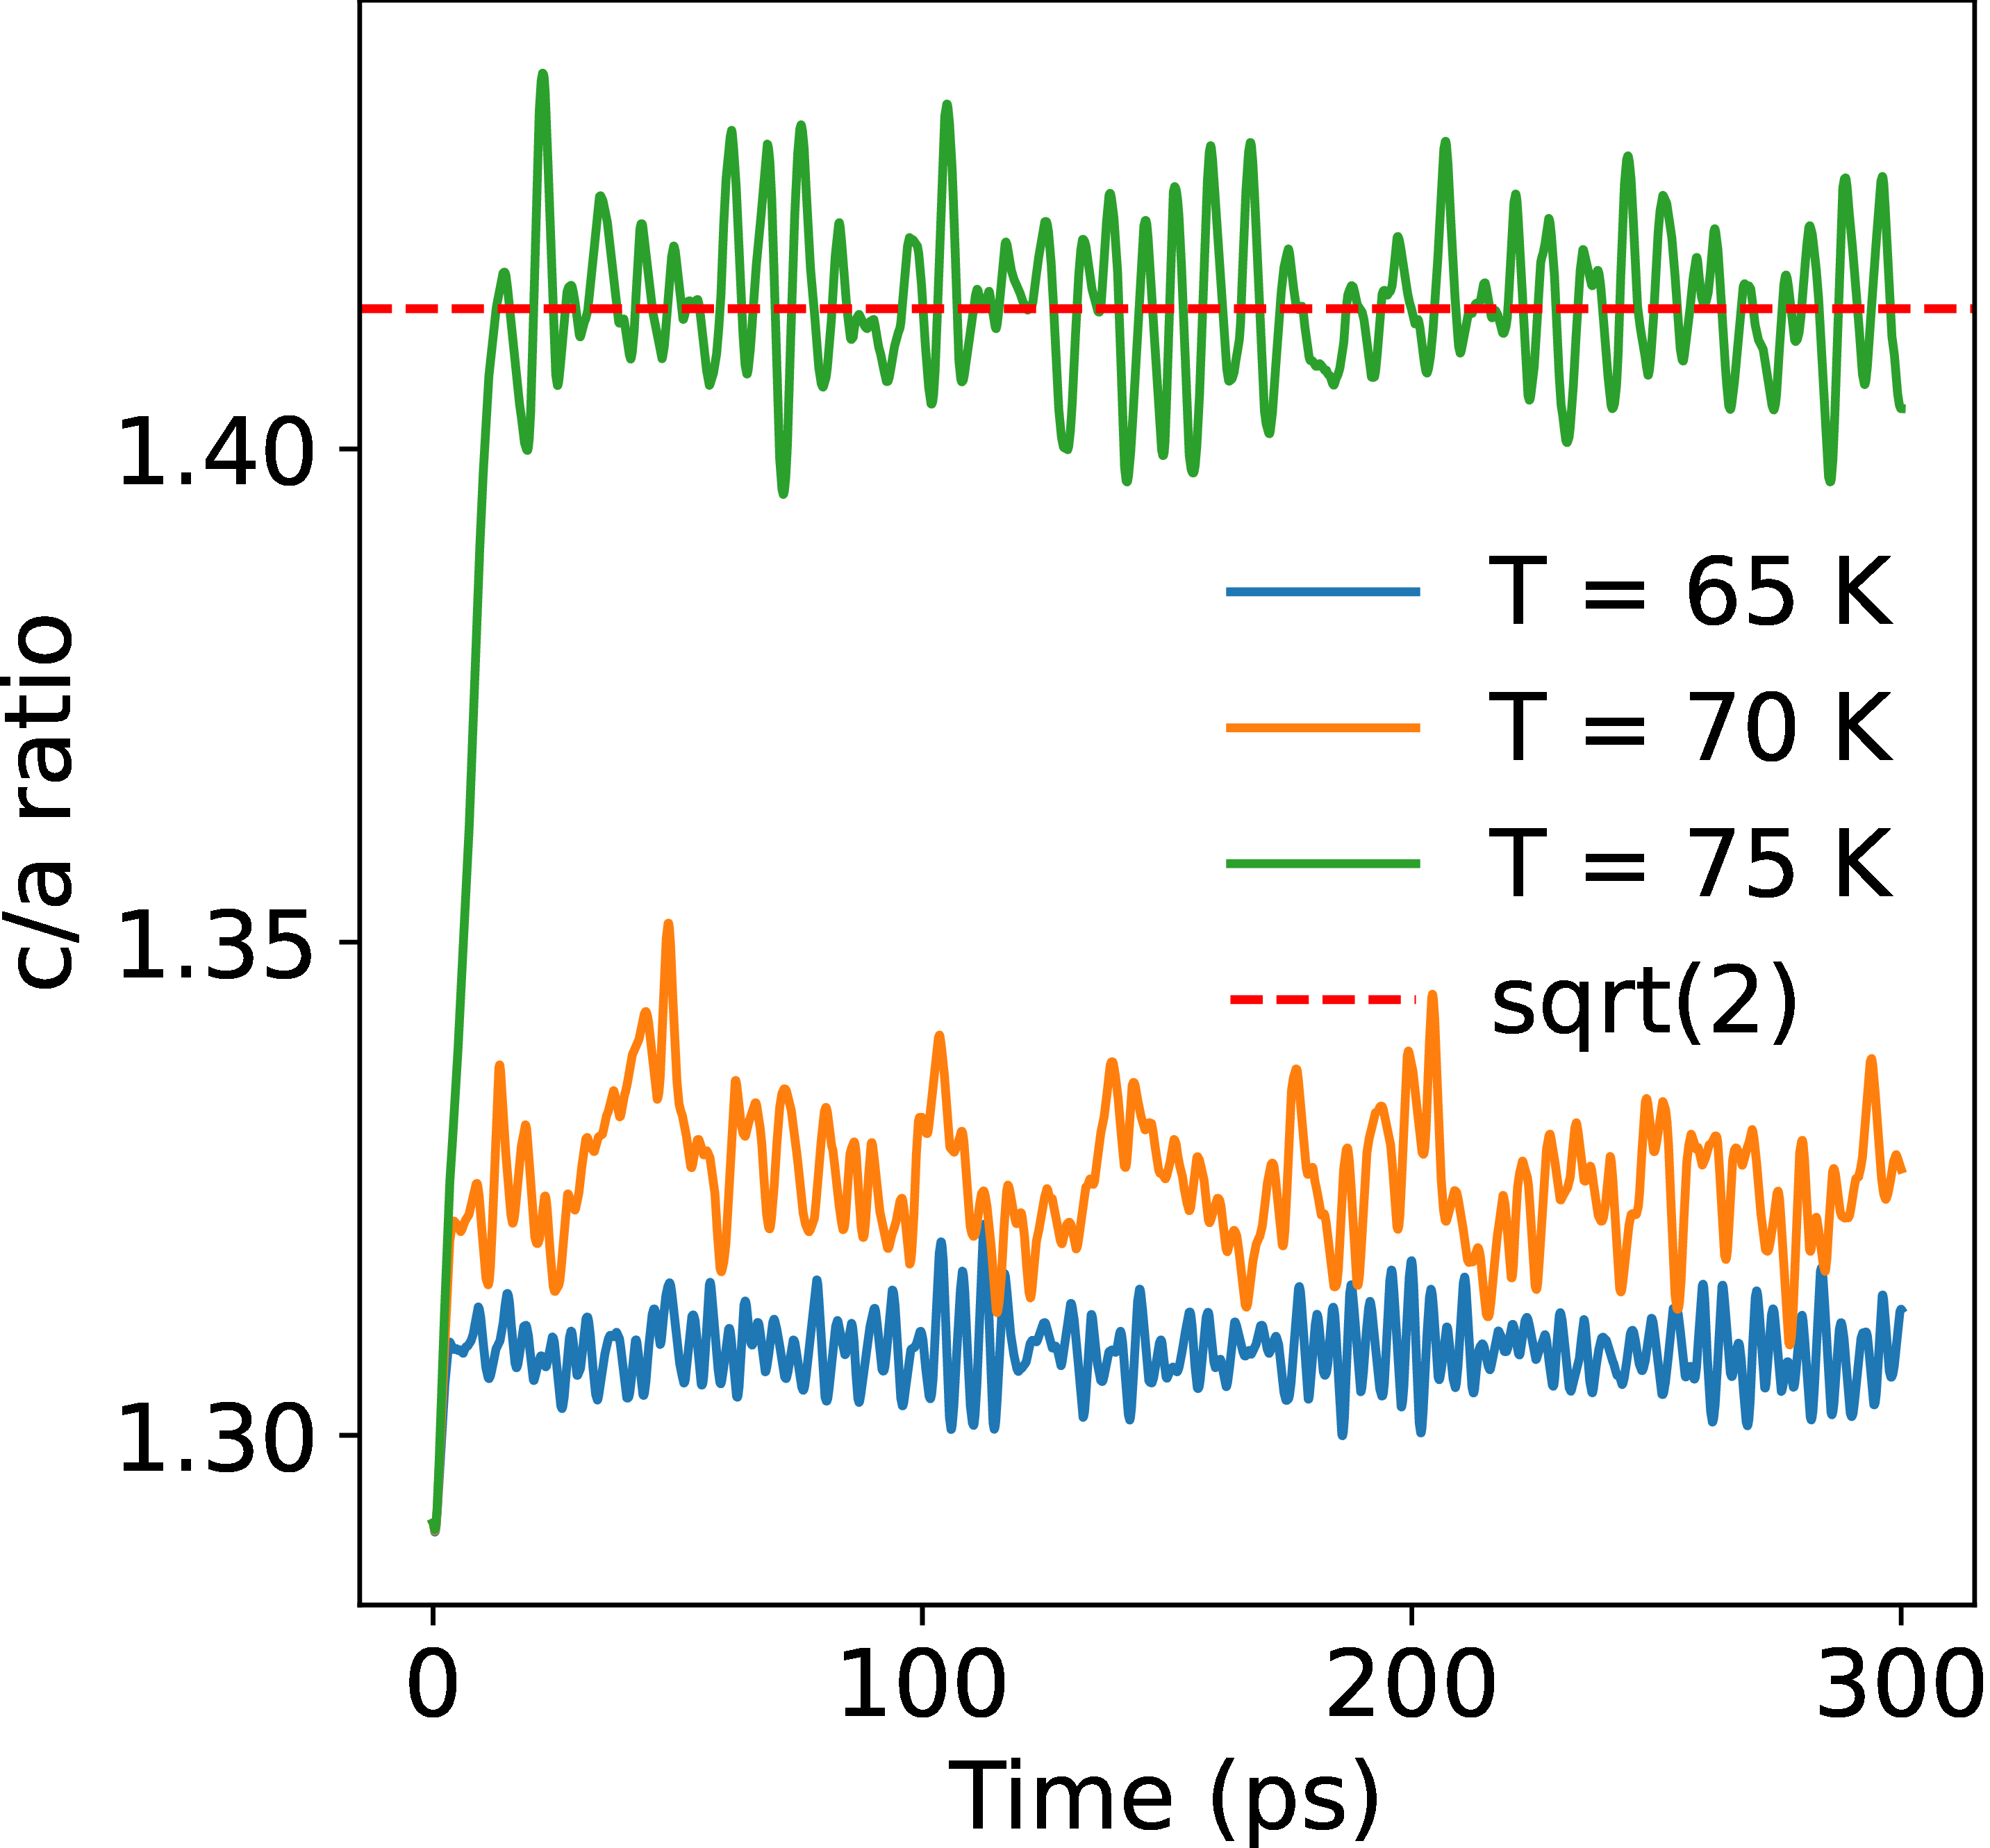
The -\ceN2 phase is a low temperature and moderate pressure ordered phase of nitrogen and is shown in Fig. 2c). Its crystal structure has been determined by X-ray diffraction as tetragonal with two molecules per unit cell at Wyckoff position of space group [Schuch1970]. Equivalently, -\ceN2 can be described as a body centred tetragonal (bct) lattice with a central molecule pointing along direction and the corner molecule pointing along , orthogonal to the central one. In NPT simulations at temperatures below {50}K the -\ceN2 phase remains at least metastable across the wide pressure range from {0.1}GPa up to approximately {5}GPa. The calculated unit cell parameters are within {1}% of the experimental ones [Schuch1970]. The structure can be related to -\ceN2 via the Bain path as follows. One places the molecular centers on an fcc lattice, and reorients the molecules from pointing along (-\ceN2) to along ,, (-\ceN2) this breaks the cubic symmetry. The c/a ratio drops from to 1.29.
IV.4 Delta phase (-\ceN2)
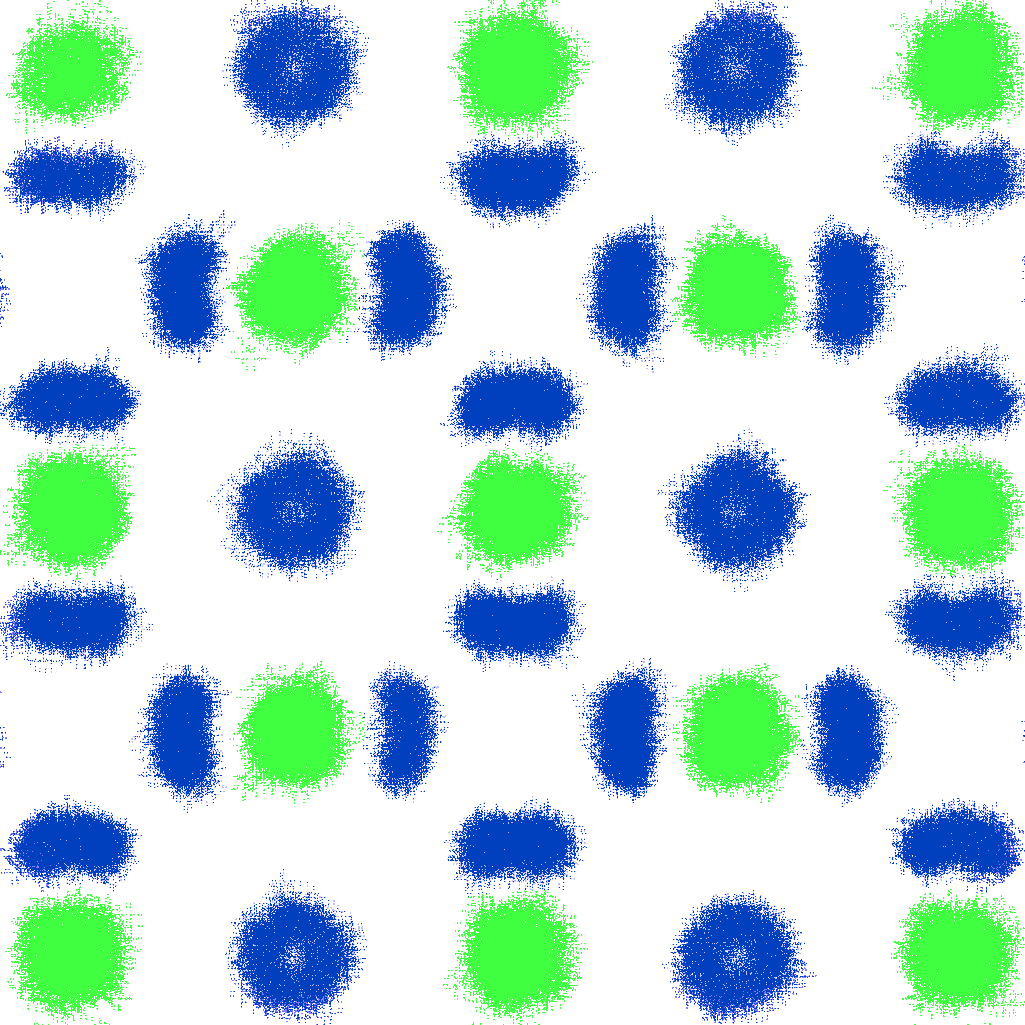
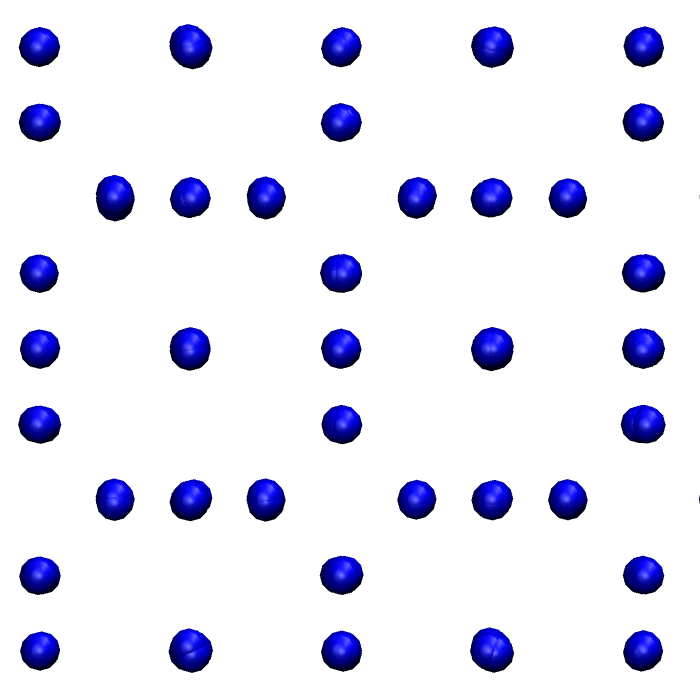
The cubic -\ceN2 phase has the Weaire-Phelan A15 structure (-tungsten) space group with eight molecules per unit cell and is similar to and at {50}K and atmospheric pressure [Cromer1981, mills1986structures]. The unit cell of the -\ceN2 phase (Fig. 2d)) consists of the two molecules located at Wyckoff sites at and which are approximately spherically disordered (represented as large spheres on Fig. 2d)), however they preferentially avoid pointing along the cubic directions [stinton2009crystal]. The remaining six molecules are located at Wyckoff sites at and the respective cubic symmetry equivalents and their motion is disc-like.
The MD simulations confirms the existence of 3D rotors at Wyckoff sites and discs on sites (Fig. 3). It is observed that for both spheres and discs the center of the molecule moves significantly away from its respective symmetry site under thermal motion. This results in a saddle shaped atomic distribution around the discs in agreement with [Cromer1981]. These disclike molecules form chains rotating around the x, y or z-direction. Heating of -\ceN2 does not result in solid-solid phase transitions: the phase ultimately melts once over the experimentally observed melting curve. Quenching at {5.7}GPa proceeds through initial ordering of the disc-like molecules and associated distortion of the unit cell to a tetragonal lattice. The lattice parameter, as obtained from NPT MD, at {5.7}GPa and {293}K is agrees very well with the experimental value [stinton2009crystal].
IV.5 Delta* phase (-\ceN2)
The tetragonal -\ceN2 (Fig. 2e)) is a unit-cell doubling from -\ceN2. Its space group has been proposed as in 1998 by [Hanfland1998] and finally resolved in 2009 by [stinton2009crystal]. The measured unit cell parameters are and at {14.5}GPa and {293}K [stinton2009crystal], giving a c/a ratio just {0.3}% different from -\ceN2. The -\ceN2 phase is considered an intermediate phase between fully ordered -\ceN2 phase and almost perfectly disordered -\ceN2 phase. The -\ceN2 shares the same positions for the molecular centres as -\ceN2 and -\ceN2 [stinton2009crystal, mills1986structures]. However, in the -\ceN2 phase all molecules appear to show preferred directions. The refinement of the experimental structure has been performed in [stinton2009crystal] who reported disc-like coordinated motion where molecular orientations are either paired or perpendicular to each other. However, they note that their proposed structure does not produce the observed number of Raman and infrared modes.
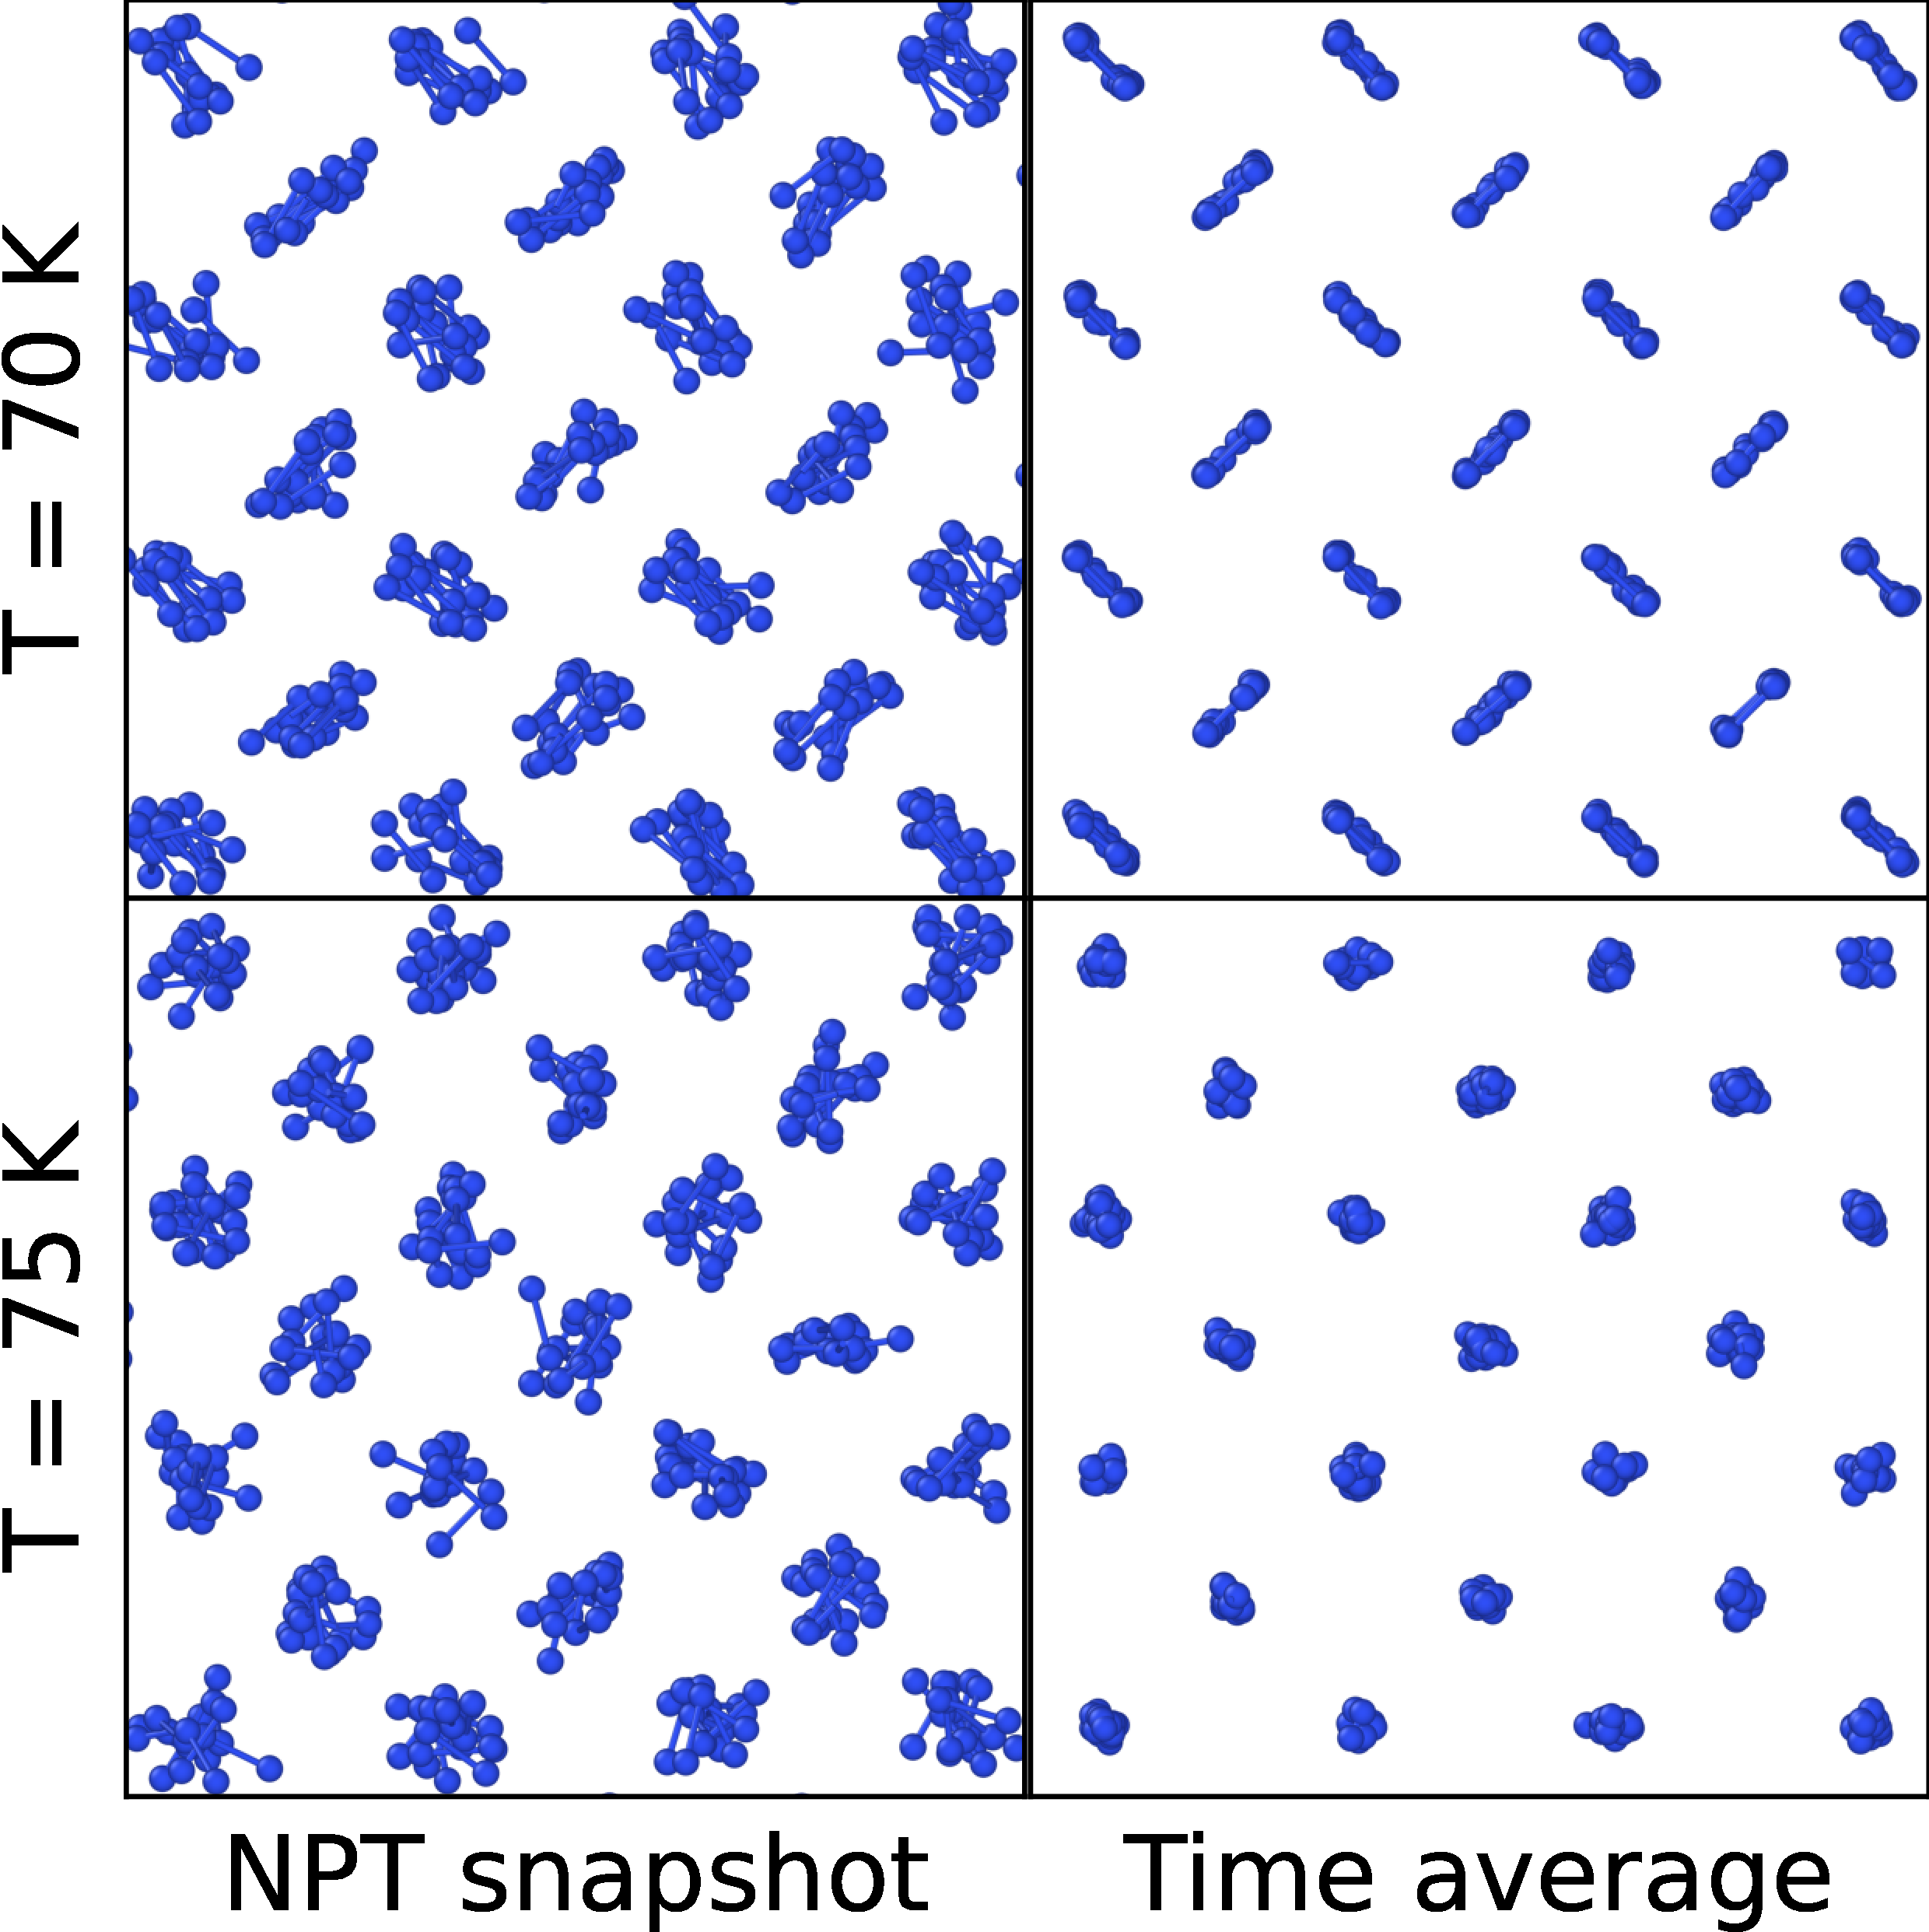
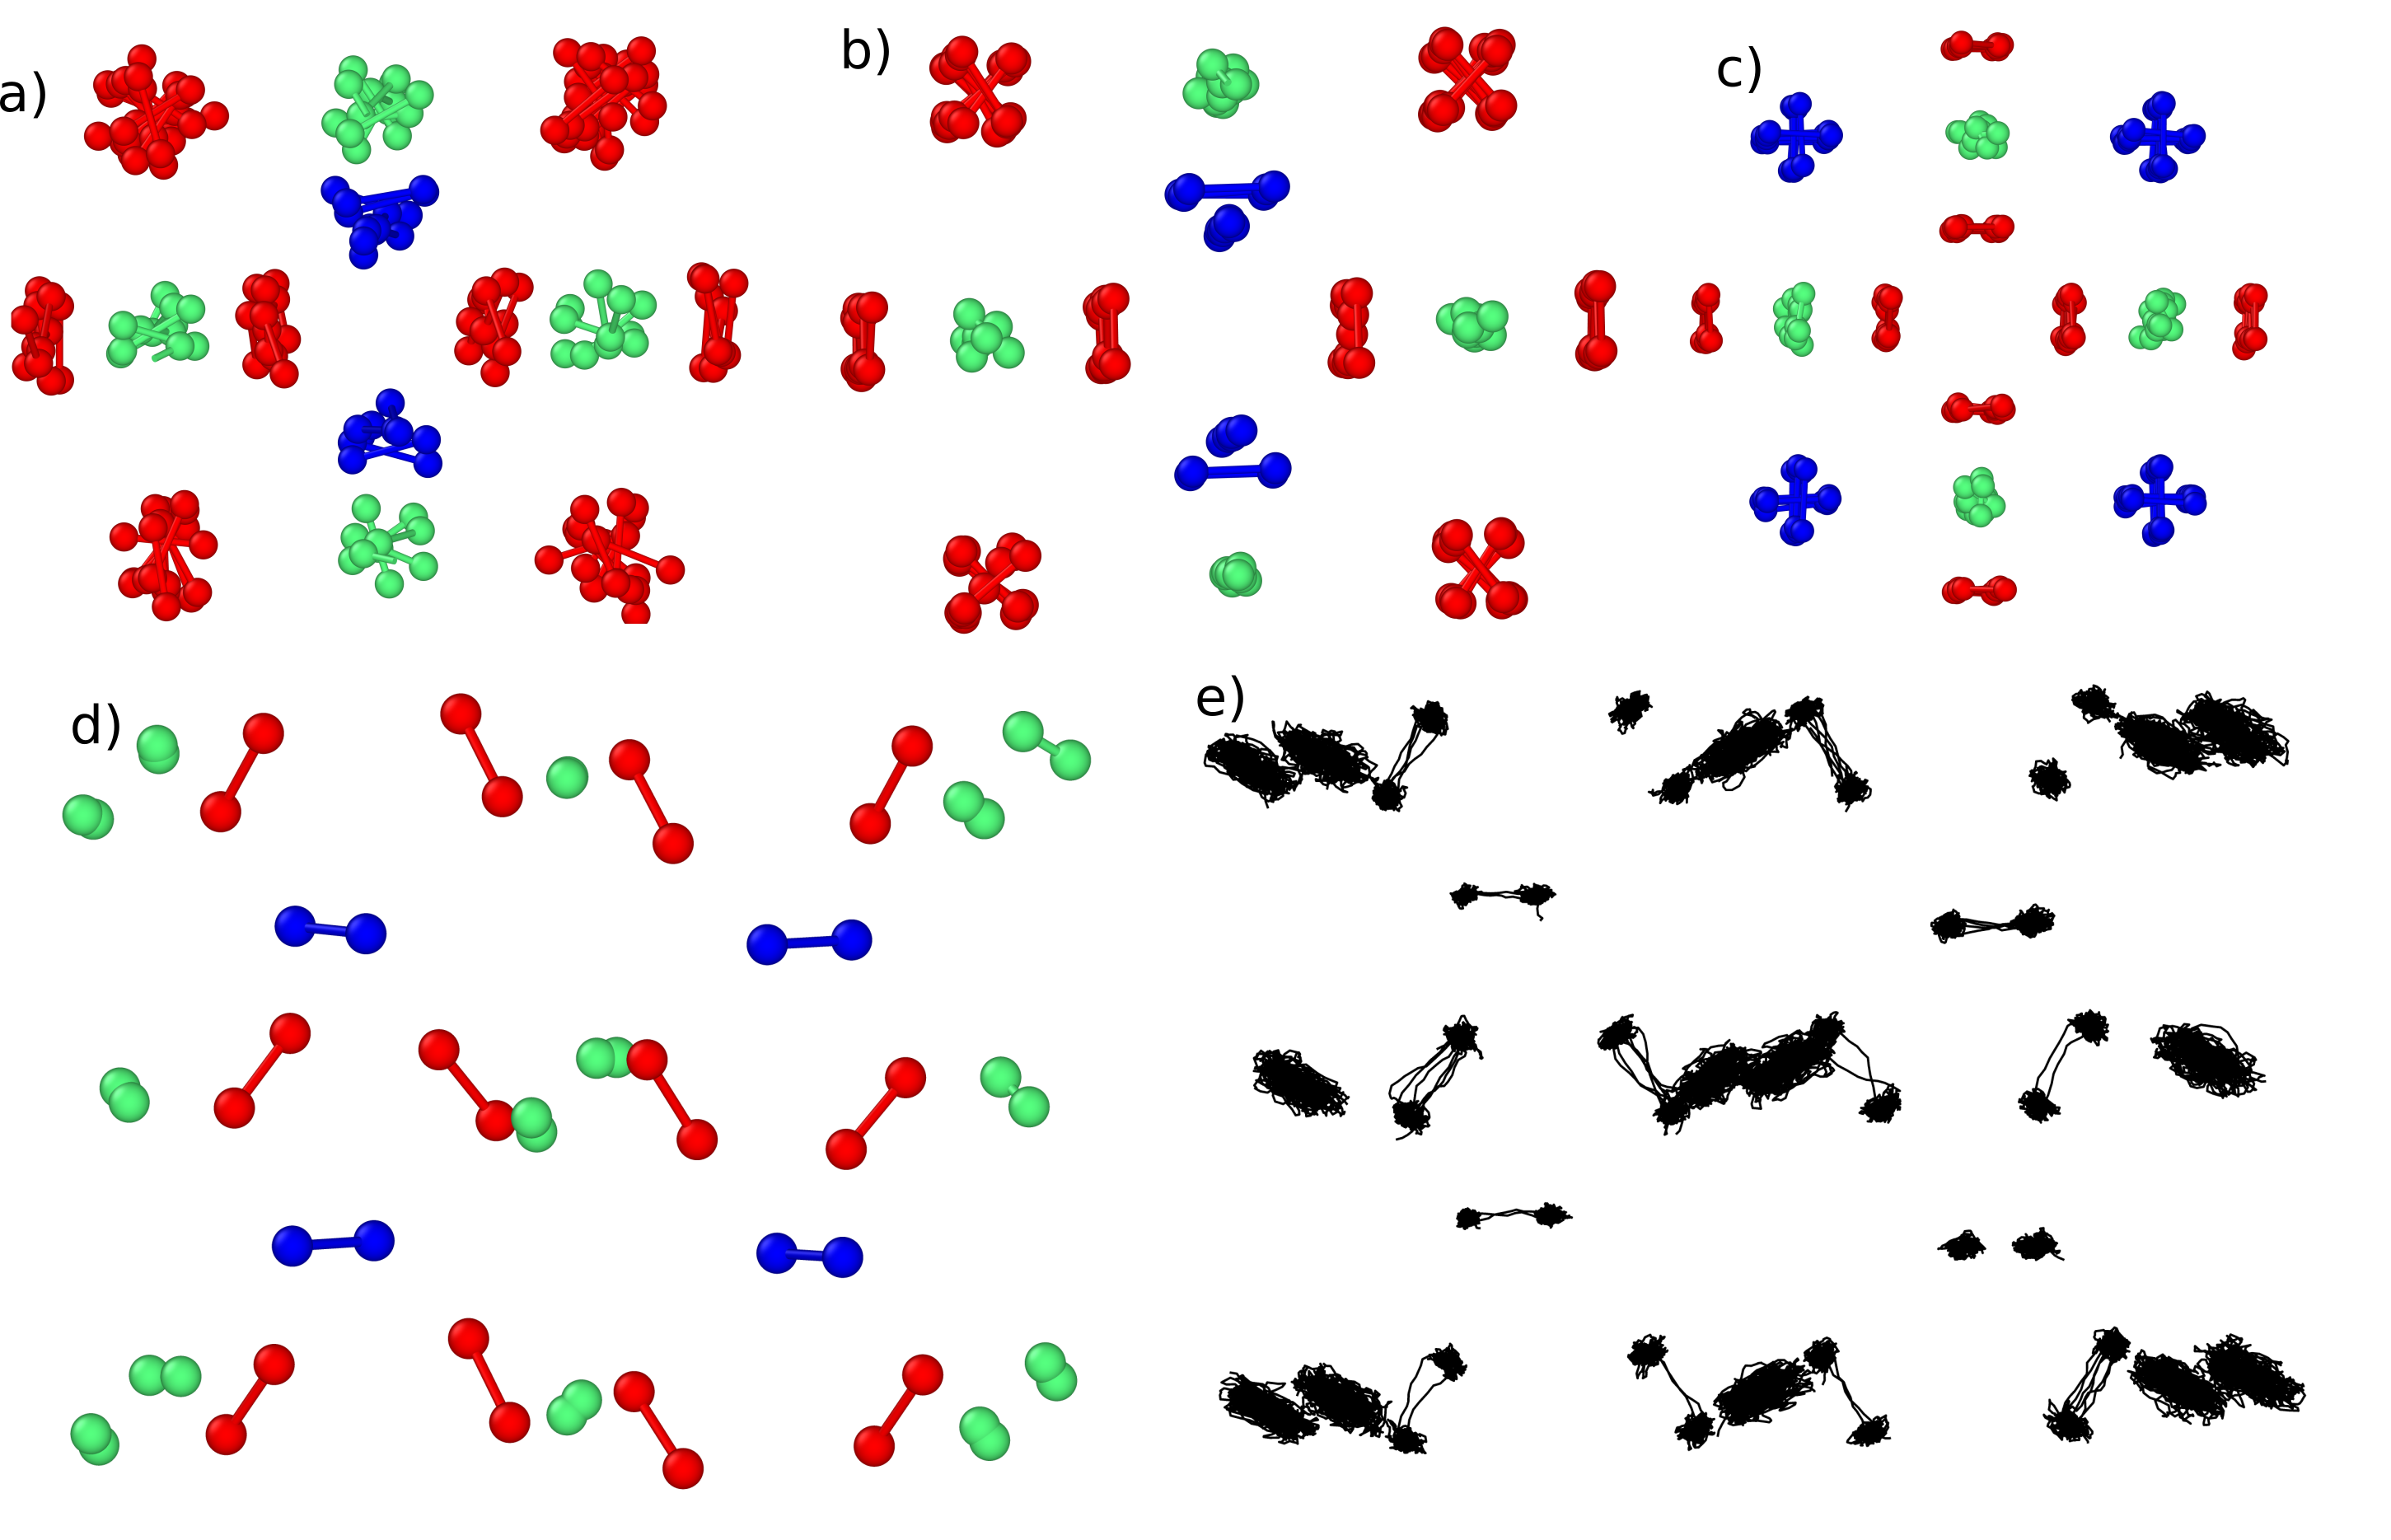
In MD simulations at {10}GPa and {200}K -\ceN2 simulation box is tetragonal with molecular centres remaining on sites, however the rotations are significantly reduced relative to -\ceN2. The explanation for why this is beneficial, is as follows. Along a line of ex-disc molecules which previously rotated about a z-axis (blue in Fig. 4) the molecules now point alternately along (110) and , with adjacent "chains" alternating (i.e. and (110)). This freezing-in and period doubling alone would cause a cubic-tetragonal transition, to space group
The former-spherical rotors now rotate in 2D, about an axis with no obvious crystallographic direction, and its mirror image. The rotating molecule is tilted away from the fixed direction of the ex--disc molecules The tetragonal symmetry breaking means that the ex-discs rotation around and (red in Fig. 4) remain symmetry equivalent. Curiously, these lock into orientations roughly with a fourfold AABB repeat. These molecules reorient through 180 on a picosecond timescale, significantly more often than the ex--discs. But, they are essentially librating and there is no sign of static disorder. All these observations are consistent with the X-ray data [stinton2009crystal].
Thus, we can envisage the -\ceN2 phase as due to the ex--disc molecules ceasing to rotate and forming a favourable ABAB chain with molecules at 90 to their neighbours. This lock-in causes the ex-spheres to rotate preferentially about an axis which avoids the locked-in ex--disc. Finally, the ex--disc molecules also stop rotating, in directions so as to avoid the ex-spheres, which requires an AABB repeat.
The heating of -\ceN2 increases symmetry to cubic structure (-\ceN2) while cooling results in a distorted tetragonal lattice. The high rate of quenching in MD simulations (approx. {100}K/ns) results in a synthesis of crystals with a number of different molecular orientations, similar to -\ceN2 but not always identical. We propose that there is a strong reduction in energy from orienting the molecules along one of several preferred directions, but only a weak additional energy gain from choosing the particular set of orientations associated with -\ceN2. By comparison to the nanosecond timescale of the MD, in experimental settings involving disordered phases the sample is first annealed at high temperature before cooling it down at the slow rate of {10}K/hr [stinton2009crystal].
At {200}K and {10}GPa the lattice parameters obtained from MD simulations are and giving c/a ratio of which is slightly below the expected from the cubic crystal. Such a small distortion from to is expected for this phase at relatively low pressure [Hanfland1998] given the phase transition between -\ceN2 and -\ceN2 appears to be second order.
IV.6 Epsilon phase (-\ceN2)
The rhombohedral -\ceN2 phase is the orientationally ordered version of the cubic -\ceN2 phase distorted along direction - the resulting angle between axes is around [mills1986structures]. The molecular center positions are slightly displaced as compared with the -\ceN2. The rhombohedral unit cell contains eight ordered molecules. -\ceN2 remains stable at low T in approximately 2 to {25}GPa range [mills1986structures, Schiferl1985]. The similarity between -\ceN2, -\ceN2 and -\ceN2 is apparent from their respective Raman stretching-mode spectra [Schiferl1985] each containing two distinct branches - intense lower frequency peak and less pronounced higher frequency peak, which can be associated with the 2(a) and 6(d) sites in -\ceN2 and their subsequent distortions. The -\ceN2 phase can either be obtained by compressing -\ceN2 phase at low temperature or -\ceN2 phase at room temperature [Olijnyk1990]. It is also possible to obtain it by slowly cooling -\ceN2 or -\ceN2 phases which results in ordering of molecules. However such an experiment is difficult to reproduce using limited timescale in MD simulations. The MD hexagonal unit cell at {10}GPa and {80}K has dimensions and . The unit cell and the increase in c/a ratio with pressure and agree well with the experimental values [mills1986structures, Olijnyk1990].
IV.7 Lambda phase (-\ceN2)
The -\ceN2 phase [frost2016novel] has been suggested as having sheets of nitrogen molecules and symmetry. A low energy DFT structure with symmetry has been found with 4 atoms per unit cell, located on the 4e Wyckoff positions [pickard2009high]. This phase is a good fit to the experimental X-ray pattern, but its two-molecule unit cell appears incompatible with the three vibrons observed in Raman spectroscopy. The -\ceN2 phase can be considered as a distortion from the tetragonal -\ceN2 phase. The phase transition can be realised by gradually tilting -\ceN2 molecules along the tetragonal c-direction. This implies a low (or zero) energy barrier on compression from the -\ceN2 phase as there is no reshuffling of molecular centres. The description of the structure as “Layered” is highly misleading: molecular centers lie close to an fcc lattice, with each molecule having 12 nearest neighbours. With our potential, the zero-temperature structure relaxation favours the -\ceN2 phase over -\ceN2, however the molecular rotation away from the (110)-direction is much smaller as compared with the DFT structure [pickard2009high]. Our constant-stress NPT MD simulations in the experimental region where the -\ceN2 phase has been observed started with this initial structure, but spontaneously transform the the -\ceN2 phase. Still, the -\ceN2 phase can be simulated with MLIP using an isobaric ensemble with fixed c/a ratio.
Experimentally, the transformations between ordered phases -\ceN2--\ceN2--\ceN2 have considerable hysteresis and are sensitive to details of the sample history. Our calculations reflect this, showing that even at fixed temperature and pressure, one can drive the transitions by applied strain.
IV.8 Iota phase (-\ceN2)
The -\ceN2 phase[turnbull2018unusually] was reported to be a 96-atom unit cell molecular nitrogen structure, with bondlengths ranging from 0.88 to 1.13Å. The MLIP cannot describe this variation in bondlength, and DFT simulation gives an -\ceN2 structure with nearly equal bondlengths. A simulation with the experimental cell and molecular orientations, but using the MLIP fixed bondlength, suggests that the -\ceN2 structure is metastable and has low energy, but is not the most stable phase.
V Validation via Ground state energies from DFT
Although we do not use it for training here, Density Functional Theory (DFT) has become the standard method for producing data for machine-learned potential. Since no solid-phase data was used in the fitting, the DFT ground state energy of the crystal structures is a good test of transferability. However, DFT is not a unique theory: results depend on the choice of exchange-correlation functional, and it does not give especially accurate results for systems with weak dispersion interactions.
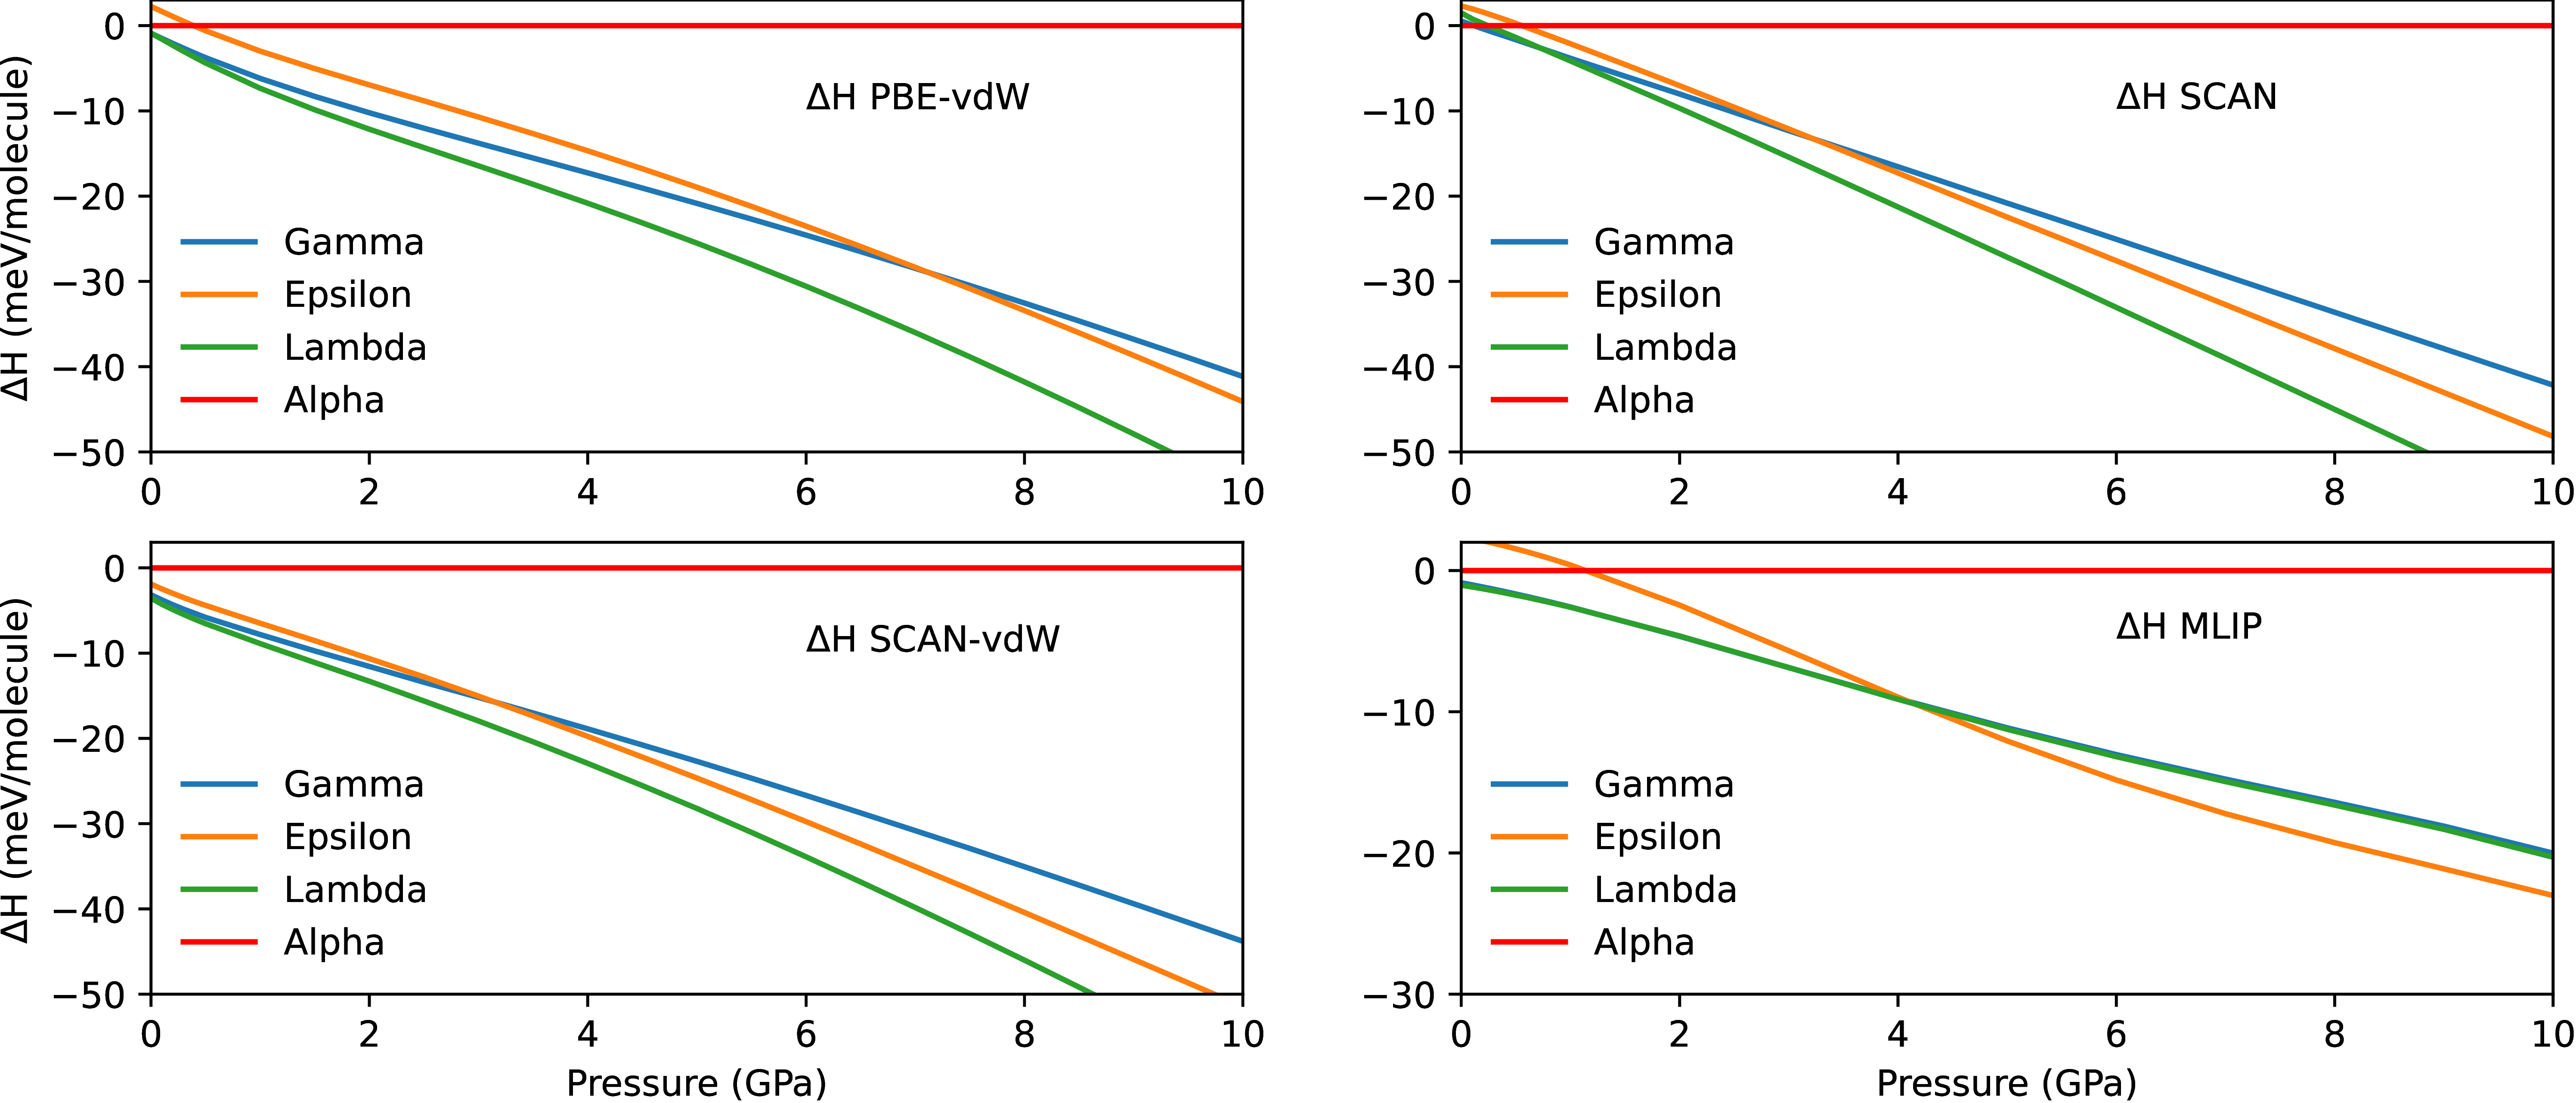
Unfortunately the situation with DFT is not clear: according to Materials Project [MatProj], the -\ceN2 is unstable against a distortion which was first proposed more than 60 years ago [jordan1964single] but not proven in subsequent work [schuch1970crystal]. We calculated this structure, as well as the other ground states (-\ceN2, -\ceN2 and -\ceN2) with three different exchange-correlation functionals and MLIP. In Fig. 5 we see that the overall theory picture for is similar, with pressure favouring -\ceN2 over the remaining crystal structures. At very low P -\ceN2 is the most stable phase for SCAN with the transition pressure of {0.1}GPa. However, the transition pressure is highly sensitive to choice of functional, with this transition even shifting to negative pressures for PBE-vdW, SCAN-vdW and MLIP.
Our potential also reproduces the correct sequence with increasing pressure, but like PBE it has -\ceN2 as the stable phase at zero pressure. The MLIP predicts a transition to the -\ceN2 phase at {4.1}GPa which agrees with early measurements [Schiferl1985, mills1986structures] but contrasts with recent experiment [frost2016novel, turnbull2018unusually] where -\ceN2 or -\ceN2 is expected to be the most stable phase.
| Method | |||
|---|---|---|---|
| PBE-vdW | -0.1 | 7.1 | 0.0 |
| SCAN | 0.1 | 3.2 | 0.7 |
| SCAN-vdW | -0.4 | 3.1 | -0.1 |
| Expt. | 0.35 | 1.9 | 2.0 |
| MLIP | -0.6 | 4.1 | - |
This can be seen in Fig. 6 where different choices of functional give some 10% variation in density at a fixed pressure. Our potential falls within the uncertainty of these DFT calculations. Similarly with the sequence of phase transformation under static relaxation (Fig. 5).
All functionals show that the sequence with increasing pressure is , although the transition pressures are functional dependent. In some cases the required pressure at T=0K is negative for the transition to happen: this is unphysical, but the implied densities can be reached through thermal expansion. However the enthalpy differences are very small, so thermal and zero-point effects may be significant.
The -\ceN2 phase[turnbull2018unusually] was reported to be a 96-atom unit cell molecular nitrogen structure which exhibits an exceptional range of intramolecular separations between 0.88 and {1.13}Å . The MLIP cannot describe this variation in bondlength, and our DFT calculations, set up in the experimental structure, relax to equalise the bonds at a conventional length, around {1.08}Å . These relaxed structures are metastable, but the wide range of bondlengths, reported for this structure cannot be understood with either DFT or MLIP.
The MLIP gives similar qualitative behaviour, with EoS and transition pressures within the uncertainty of DFT functionals. For the present study, this is the best possible DFT-based validation of the MLIP.
VI Face Centred Structures
One could consider the three phases -\ceN2, -\ceN2 and -\ceN2 as decorations of molecules on a face-centred cubic/tetragonal lattice. In each case, the symmetry-breaking to , , and is fully determined by the orientation of the diatomic molecule centred on an fcc lattice. The relaxation of the lattice to tetragonal or monoclinic does not introduce any further change in symmetry.
The fact that these lattice relaxations are small is concealed by the choice of unit cell reported. In fact, the tetragonal distortion of the -\ceN2 phase is only 3% in and , and 6% in away from cubic. In -\ceN2 at {5}GPa our SCAN-DFT calculations give , , , . Compared to conventional fcc, these axes map to , and , giving a distortion from fcc of 1.3%, 1.5% and {7}.
These phases are thereby linked through martensitic transformations. If post-transformation structures are examined via single-crystal diffraction, strain relaxation will result in twinned microstructures[bhattacharya]. We have seen this in simulations, where the transformations in NPT molecular dynamics give twinning, but the transition can be realised by applying strain (varying the c/a ratio).
These structures have molecules oriented in different directions, and can be mapped to an antiferromagnetic fcc lattice, the decoration of which remains a contentious issue [ehteshami2020phase, ackland2023existence]. Quadrupole interactions do not favour alignment, and are reasonably long ranged. The Pa arrangement is the most favourable decoration of an fcc lattice with quadrupoles, but it is unstable against lattice distortions[van2020quadrupole]. In early work[NoseKlein1986], it was thought that -\ceN2 might also be fcc with rotating molecules, and indeed such a structure can be generated in MD by heating -\ceN2. In fact -\ceN2 is based on hcp, but the simulations show that the molecular orientations become (dis)ordered far faster than the molecular centers can rearrange. So, heating transformations pass through a metastable intermediate fcc rotor phase, while cooling transformations pass through a metastable intermediate state of quadrupole ordering in hcp, which has multiple competing states and is very prone to domain formation[van2020quadrupole]. Such domains are likely to result in heavily twinned crystals, and complex diffraction patterns which can be challenging to solve.
VII \ceN2 Phase Diagram from MD
We build the phase diagram in stages. Firstly we calculate the melt curve for both hcp -\ceN2 and cubic -\ceN2 phases as well as a hypothetical fcc phase with 3D rotors. The crystal phase with the higher melting temperature has lowest free energy, and is stable, and the intercept is the - - liquid triple point.
Since we know the latent heat and the density difference between the phases, we can also use the Clausius-Clapeyron equation to determine the initial direction of the -\ceN2 and -\ceN2 phase line away from the triple point.
Along the zero-Kelvin line, we can use enthalpy calculations to locate the - - intercepts, and the Third Law to determine that the initial phase boundary is vertical. We also run simulations across the phase boundary which allows the Bain transition to be mapped, albeit with hysteresis.
Several of the phase transformations involve a transition from fixed orientation to rotation of the molecules. We can model this with simulations, gradually heating the sample until the rotation starts. The phase line can be crossed in both directions.
The ordered crystal phases can be unambiguously identified by time averaging NPT trajectory and analysing obtained crystal with symmetry analysis package such as spglib [spglib2018]. For the rotor phases we repeat the procedure using molecular centres of mass, and use probability density plots (e.g. Fig.3) to determine rotations.
VII.1 The Melting Curve

We used phase coexistence calculations to track the melt curve of the relevant phases. The total of 25 coexistence calculations at 10 different pressure points were performed to obtain smooth melt lines as shown in Fig. 7.
The simulation box for both the -\ceN2 phase and the hypothetical fcc phase with rotors contains 28800 molecules on the hcp and fcc lattices respectively. The molecular orientations are initially assigned at random and show full spherical disorder/rotation throughout the simulation.
The initial structure for -\ceN2 has space group . The cell is constructed with 29952 molecules. The molecular orientations where randomly assigned: disclike for Wyckoff and spherical disordered for .
The calculated melting temperatures under various pressures are shown in table 2. The obtained melt curve is in a very good agreement with the experimental one from Fig. 1.
In addition to determining the melt curve, these calculations pinpoint the triple point: it is at the pressure at which -\ceN2 and -\ceN2 have the same melting point, {8}GPa and {457}K. The fcc structure with rotors has lower melting temperature and is therefore energetically unfavourable across the measured pressure range.
| P (GPa) | T (K) | T (K) |
|---|---|---|
| 0.1 | 83 | - |
| 0.3 | 112 | - |
| 0.5 | 142 | - |
| 1.0 | 185 | - |
| 2.45 | 297 | - |
| 5.0 | 389 | 365 |
| 7.0 | 440 | 433 |
| 8.0 | 457 | 458 |
| 9.0 | 467 | 474 |
| 10.0 | 488 | 496 |
VII.2 Solid-solid Phase Boundaries
alpha/gamma beta
The phase boundary between and is represented on the phase diagram in Fig. LABEL:fig:Phase_Diagram_MD as a solid black line with an increasing positive slope with pressure. The phase boundary has been estimated based on the following observations.
For the transformation, the molecular centers are completely different, and the transition is sluggish such that on heating we see a transformation from ordered fcc -\ceN2 to a metastable free rotor fcc. Alternatively, on cooling from rotating hcp -\ceN2, we obtain a metastable ordered hcp. These two transitions bound the true transition line. Near the experimental boundary it is observed that during the molecular dynamics simulations across the boundary, molecules in the -\ceN2 phase begin to rotate or equivalently -\ceN2 rotors cease their motion. This behaviour is only observed in the narrow temperature zone, and we take it as indicating the position of the phase boundary between librating and rotating molecules. If we consider the static hcp and rotating fcc phases to be metastable, then the -\ceN2 heating simulations give an upper bound on the true phase line, while the -\ceN2 cooling calculations give a lower bound: these are close enough to determine the phase boundary with small errors.
Although a rotationlibration transition is observed in both fcc (-\ceN2) and hcp (-\ceN2) on heating and on cooling, we note that no direct phase transition is obtained from fcc to hcp or vice versa in any simulation. The molecular centers in simulations started in the -\ceN2 phase remain hexagonal even after rotation ceases; similarly the molecular centres of -\ceN2 remain close to fcc. In both cases, the rotation ceases at similar T,P conditions.
The fact that the transition does not occur on a nanosecond timescale is consistent with the experimental observation that the transformation is sluggish. This is understandable as even for an atomic system fcc/hcp phase transition is complex and difficult to realise in molecular dynamics simulation. For example, the hcp to fcc transition in titanium is a process which involves slip of planes dislocations, adjustment of interplanar spacing followed by the volume expansion [Yang2018]. To best of our knowledge the mechanism of the fcc/hcp phase transition for \ceN2 (or any other) dimers is unknown.
beta gamma