A dusty rain falls on the nova V959 Monocerotis
Abstract
We present archival and ground-based infrared observations of the -ray-emitting nova V959 Mon, covering the period 100–4205 days after the 2012 eruption. We use these data to determine that the secondary in the nova system is a G5 main sequence star. Data from the NEOWISE survey reveal a significant increase in the emission at 3.4m and 4.6m at late ( days) times, which we interpret as emission by dust. Other interpretations are considered but cannot be reconciled with the data. The presence of such late dust emission, and in particular its variation with time, are unprecedented in the context of novae. The behaviour of the dust emission suggests a qualitative interpretation in which ejecta from the 2012 eruption encounter denser pre-eruption circumbinary material, giving rise to Rayleigh-Taylor instabilities that cause clumps of dust-bearing material to fall back towards the central binary, the dust undergoing destruction by chemisputtering as it does so. The observed rise in the dust temperature, the decline in the nova-dust distance and in the dust mass, are consistent with this interpretation. Not all novae are expected to show this behaviour, but inspection of resources such as NEOWISE might reveal other novae post-eruption that do.
keywords:
novae, cataclysmic variables — circumstellar matter — stars: individual: V959 Mon — infrared: stars1 Introduction
Classical Novae (CNe) occur in semi-detached binary systems consisting of a white dwarf (WD) primary and a Roche-lobe-filling secondary, usually a main sequence dwarf (Bode & Evans, 2012; Saikia & Anupama, 2012; Woudt & Ribeiro, 2014). Material from the secondary spills onto the surface of the WD via an accretion disc. In time the base of the accreted layer becomes degenerate, and a thermonuclear runaway (TNR) occurs. This is seen as a nova eruption, in which of material, enriched in metals up to Ca as a result of the TNR, is ejected at several 100s to several 1000s of km s-1. The WD in CN systems may be of CO type, or the more massive ONe type (Chomiuk, Metzger & Shen, 2020)
With a Galactic CN rate of year-1, (De et al., 2021), it is likely that CNe are a major source of 13C, 15N and 17O in the Galaxy (see, e.g., Bode & Evans, 2012). Historically, CNe have not been considered as major contributors to the interstellar dust population (see, e.g., Gehrz, 1989) but a reanalysis by Yates et al. (2024) suggests that the CN contribution may have been significantly underestimated.
2 V959 Mon
V959 Mon was discovered visually by S. Fujikawa on 2012 Aug 9.81. However, a -ray transient was detected by Fermi LAT (Fermi J0639+0548) on three consecutive days (2012 June 22–24 (MJD 56100–56102); Cheung et al., 2012a), which was subsequently associated with V959 Mon by Cheung et al. (2012b). We take the date of eruption and the time origin to be MJD 56100.
V959 Mon was observed with the Neil Gehrels Swift observatory (Gehrels et al., 2004) shortly after optical discovery (Nelson et al., 2012a). An observation on 2012 November 18 showed that the nova had entered the super-soft phase, with estimated temperature K (Nelson et al., 2012b). Further Swift observations followed the onset of the super-soft phase; the soft X-ray flux increased substantially, although it was extremely variable (Osborne, Beardmore & Page, 2012). Osborne et al. also reported a probable 7.1 hour periodicity in the ultraviolet emission; this periodicity was confirmed using optical photometry by Wagner, Woodward & Starrfield (2013). The soft X-ray count rate peaked around 2013 January 10 (day 153), and rapidly declined thereafter. By day 247 the super-soft phase had essentially ended (Page et al., 2013a).
Munari et al. (2013) reported photometry of the eruption, including the narrow-band Stromgren and bands. They concluded that the (unobserved) visual maximum had . They too found the 7.1 hour periodicity, which they ascribed to orbital modulation arising from a combination of ellipsoidal variations and irradiation of the secondary by the still-hot WD. Using their optical photometry and data from the Two Micron All Sky Survey (2MASS; Skrutskie et al., 2006), and assuming a distance 1.5 kpc and reddening , Munari et al. determined that the secondary is an early K main sequence star. Such a star would fill its Roche lobe for a 7.1 hour orbital period and an ONe WD.
Extensive optical spectroscopy of V959 Mon was reported by Shore et al. (2013). They found that the ejecta had axisymmetric conical/bipolar geometry, the inclination of the axis to the line of sight, , lying in the range . The half-width at zero intensity of the emission lines was km s-1. They deduced that the reddening to the nova is . They too concluded that V959 Mon was an ONe CN, with similarites to other ONe novae like V1974 Cyg and V382 Vel. They determined an ejecta mass . They also suggested that -ray emission could be a feature of all ONe novae, possibly even of all CNe.
Ribeiro, Munari & Valisa (2013) used the [O iii] 4959, 5007Å lines to investigate the morphology of the ejecta. They determined that the ejecta had bipolar structure with inclination angle of and had maximum expansion velocity km s-1 on day 130. V959 Mon was imaged with WFC3 on the Hubble Space telescope 882 and 1256 days into the eruption (Sokoloski et al., 2016). These observations confirmed the bipolar structure, which had major axis 105 on day 882, consistent with the morphology deduced by Ribeiro et al..
Near infrared (NIR) spectra obtained by Banerjee, Ashok & Venkataraman (2012) on 2012 November 1–2 showed the presence of the coronal lines [S ix] 1.252m, [Si vi] 1.964m, [Al ix] 2.040m, with other coronal lines suspected.
Radio observations of V959 Mon have been described by Healy et al. (2017) and Linford et al. (2015). Healy et al. found that, while the source was initially elongated E–W, it later became elongated N–S. Linford et al. also monitored the evolution of the ejecta morphology. They combined the expansion of the radio remnant with optical spectroscopy to estimate a distance in the range kpc to kpc, with a most probable value of kpc, consistent with the Munari et al. (2013) value. The Gaia3 geometric distance is kpc, the photo-geometric distance is 3.0 kpc (Bailer Jones et al., 2021). Using the [3D] Galactic extinction map based on Gaia parallaxes (Green et al., 2019), the reddening is for the lower distance, and for the higher.
In this paper we present ground-based and archival infrared (IR) data on the CN V959 Mon. We take 3 kpc for the distance. Assuming that (Schlafly & Finkbeiner, 2011), the corresponding reddening is , which we also assume. The data have been dereddened using the reddening law given by Cardelli, Clayton & Mathis (1989),
3 The data
3.1 Near infrared photometry

| UT Date | UT | MJD | Days past | Filter | Magnitude | Magnitude |
|---|---|---|---|---|---|---|
| yyyymmdd | hh:mm:ss | eruption | error (1) | |||
| 20120929 | 14:31:29 | 56199.60520 | 99.60520 | 7.350 | 0.005 | |
| 20120929 | 14:34:03 | 56199.60698 | 99.60698 | 8.127 | 0.003 | |
| 20120929 | 14:36:32 | 56199.60870 | 99.60870 | 8.166 | 0.008 | |
| 20120929 | 14:39:02 | 56199.61044 | 99.61044 | 8.508 | 0.010 | |
| 20120929 | 14:41:45 | 56199.61233 | 99.61233 | 8.904 | 0.014 | |
| 20120930 | 13:17:45 | 56200.55399 | 100.55399 | 7.384 | 0.012 | |
| 20120930 | 13:20:38 | 56200.55600 | 100.55600 | 8.125 | 0.017 | |
| 20120930 | 13:23:14 | 56200.55780 | 100.55780 | 8.165 | 0.007 | |
| 20120930 | 13:25:51 | 56200.55962 | 100.55962 | 8.562 | 0.029 | |
| 20120930 | 13:28:33 | 56200.56149 | 100.56149 | 8.948 | 0.013 | |
| 20121001 | 13:21:48 | 56201.55681 | 101.55681 | 7.404 | 0.019 | |
| 20121001 | 13:24:18 | 56201.55854 | 101.55854 | 8.151 | 0.013 | |
| 20121001 | 13:26:55 | 56201.56036 | 101.56036 | 8.174 | 0.012 | |
| 20121001 | 13:29:25 | 56201.56209 | 101.56209 | 8.536 | 0.011 | |
| 20121001 | 13:32:07 | 56201.56397 | 101.56397 | 8.942 | 0.011 | |
| 20121004 | 14:35:28 | 56204.60796 | 104.60796 | 7.427 | 0.029 | |
| 20121004 | 14:36:28 | 56204.60866 | 104.60866 | 8.190 | 0.009 | |
| 20121004 | 14:37:33 | 56204.60941 | 104.60941 | 8.248 | 0.018 | |
| 20121004 | 14:38:33 | 56204.61010 | 104.61010 | 8.600 | 0.013 | |
| 20121004 | 14:39:33 | 56204.61080 | 104.61080 | 9.035 | 0.015 | |
| 20121016 | 15:22:05 | 56216.64034 | 116.64034 | 7.658 | 0.022 | |
| 20121016 | 15:23:04 | 56216.64102 | 116.64102 | 8.475 | 0.018 | |
| 20121016 | 15:24:03 | 56216.64170 | 116.64170 | 8.520 | 0.011 | |
| 20121016 | 15:25:04 | 56216.64241 | 116.64241 | 8.855 | 0.012 | |
| 20121016 | 15:26:03 | 56216.64309 | 116.64309 | 9.336 | 0.006 | |
| 20121019 | 13:19:43 | 56219.55536 | 119.55536 | 7.758 | 0.018 | |
| 20121019 | 13:20:44 | 56219.55606 | 119.55606 | 8.523 | 0.013 | |
| 20121019 | 13:21:43 | 56219.55675 | 119.55675 | 8.614 | 0.007 | |
| 20121019 | 13:22:42 | 56219.55743 | 119.55743 | 8.949 | 0.014 | |
| 20121019 | 13:23:43 | 56219.55814 | 119.55814 | 9.462 | 0.013 | |
| Continued online. | ||||||
Observations of V959 Mon were obtained with the 3.8-m United Kingdom Infrared Telescope (UKIRT) and the Wide Field Camera (WFCAM; Casali et al., 2007), using the near-IR MKO filters and (effective wavelengths: 0.88, 1.03, 1.25, 1.63 and 2.20m respectively). WFCAM has a pixel scale of /pix and employs four HgCdTe Hawai’iII arrays. Each array has a field of view of . Observations were performed by locating the object in one of the four arrays and by dithering to five points separated by a few arcseconds. For all but the very first three epochs (for which the exposure per filter was 40 seconds), the total on-chip exposure was 10 seconds per filter. The data were reduced by the Cambridge Astronomical Survey Unit (CASU); the archiving and distribution of the data are carried out by the Wide Field Astronomy Unit (WFAU).
The monitoring observations of the nova were carried out as a backup program, so the observations were sometimes obtained in the presence of clouds. The magnitudes of the nova from observations during the period up to the end of 2013 were calculated using the average of the zero points for a set of eight isolated point sources present in all dithered frames around the nova, and using their magnitudes measured on nights when the sky was photometric. The errors listed in Table 1 are the 1- of the zero point estimates for these objects. Most of these observations were obtained with the telescope kept out of focus to avoid saturation, so we have used a -diameter aperture for photometry. Photometry was perfomed using the Starlink task “Autophotom”. The observations from 2014, when the source became faint, were carried out with the telescope in focus. The magnitudes reported are extracted from the catalogues produced by the data processing by CASU, with the zero points estimated from isolated point sources in the field.
NIR photometry from 2012 September 29 to October 26, and from 2012 November 8 to 2013 May 5, were reported by Varricatt et al. (2012a, b) and are included in this paper for completeness. The magnitudes for the first twenty days of observation, and the UT and MJD of mid-observation, are given in Table 1. The complete dataset, which covers the period from 100 to 4206 days after the 2012 eruption, is available online.
The UKIRT photometry is shown, along with and data from the AAVSO111https://www.aavso.org/ database, in Fig. 1. This figure shows UKIRT data only to day 1000 after the eruption, when the AAVSO data are available.
3.2 WISE and NEOWISE
The Wide-field Infrared Survey Explorer (WISE; Wright et al., 2010) conducted an all-sky survey in wavebands centred on 3.4m (W1), 4.6m (W2), 12m (W3), and 22m (W4). V959 Mon was detected in WISE bands W1 and W2 in 2010 March/October with mean fluxes mJy and mJy respectively (Evans et al., 2014).
The prime science driver of the Near-Earth Object + WISE (NEOWISE; Mainzer et al., 2011, 2014) surveys was the identification of moving (solar system) objects detected in the WISE survey. The NEOWISE Reactivation Mission (Mainzer et al., 2014) provided data in WISE bands W1 and W2 only.
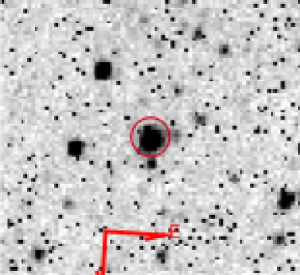
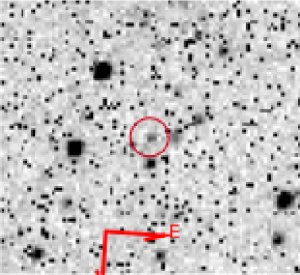
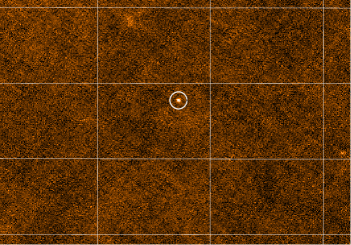
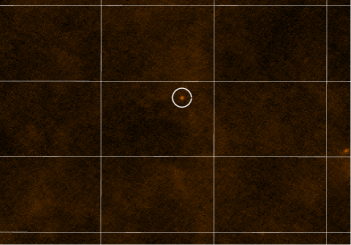
We have trawled the NEOWISE data for V959 Mon and it is clearly detected in bands W1 and W2 at fluxes that far exceed the pre-outburst values given in Evans et al. (2014) (see Fig. 2). The positions of the NEOWISE sources agree with that of V959 Mon within the spatial resolution of the survey. Moreover, the variation of the NEOWISE source makes the identification with the nova certain.
The nature of the NEOWISE survey means that the data consist of closely-spaced “blocks” of several observations (typically covering days), obtained within a very short time of each other. These data have been averaged to provide a mean value for the block and are given in Table 2. The W1 and W2 light curves are shown in Fig. 3.
| Days past eruption | W1 | W2 |
|---|---|---|
| (MJD–56100∗) | (3.4m) | (4.6m) |
| 644.2827 | ||
| 835.8767 | ||
| 1003.2360 | ||
| 1199.0230 | ||
| 1363.8035 | ||
| 1564.8266 | ||
| 1726.6757 | ||
| 1929.0897 | ||
| 2086.4785 | ||
| 2295.1683 | ||
| 2450.6840 | ||
| 2660.2145 | ||
| 2817.7376 | ||
| 3025.0720 | ||
| 3181.8622 | ||
| 3391.6794 | ||
| 3546.4362 | ||
| 3755.7894 | ||
| ∗Mean MJD after averaging over a block, as described in text. | ||
| Spread in mean JD is in the range days. | ||


3.3 Herschel
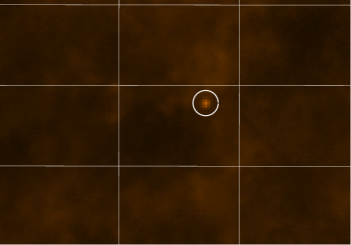
We have also trawled the data in the Photodetector Array Camera and Spectrometer (PACS; Poglitsch et al., 2010) and Spectral and Photometric Imaging REceiver (SPIRE Griffin et al., 2010) instruments on the Herschel Space Observatory (Pilbratt, 2003; Pilbratt et al., 2010). The region around V959 Mon was observed on 12 October 2012 (MJD 56212), on day 112 of the eruption and the data clearly show that V959 Mon was detected. As with the NEOWISE data, the position of the Herschel source agrees, within the spatial resolution, with that of V959 Mon. Images from the Herschel archive are shown in Fig. 4 and the fluxes are given in Table 3.
| (m) | (mJy) | Instrument |
|---|---|---|
| 70 | PACS | |
| 160 | PACS | |
| 250 | SPIRE PSC | |
| 350 | SPIRE PSC | |
| 500 | SPIRE PSC |


4 Interpreting the data
4.1 The progenitor
The WISE data were obtained before the 2012 eruption of V959 Mon, and have been combined with pre-eruption data from the 2MASS survey. The dereddened data are shown in Fig. 5. We use these data to determine the nature of the progenitor.

The data are fitted by a black body with temperature K. This black body has W m-2, or at 3 kpc. These properties are consistent with a G5 main sequence star. Munari et al. (2013) concluded that the secondary is a K3 main sequence star, based on reddening and distance 1.5 kpc. The greater reddening assumed here leads to a higher effective temperature than that found by Munari et al..
4.2 The Herschel data
The Herschel photometry is plotted in Fig. 6. There are UKIRT WFCAM data a few days on either side of the Herschel observation. These have been interpolated to the time of the Herschel observation, and are also plotted in Fig. 6. The dependence of on at the longest (Herschel) wavelengths suggests that we have optically thin free-free emission, for which the luminosity is (see, e.g., Cox, 2000)
| (1) |
Here “Const.” is a combination of fundamental constants, is the plasma temperature, is the ionic charge, are the electron and ion densities respectively, is the emitting volume and is the free-free gaunt factor (Karzas & Latter, 1961). In addition to the dependence for optically thin free-free emission, the dependence of on arises primarily from the gaunt factor , which over the wavelength range and likely temperature range of interest here has the approximate form (from fitting data in Karzas & Latter, 1961). We therefore fit the data using , with K and K, to give (for in m)
| (for K) | ||||
These fits are shown in Fig. 6. At short wavelengths the continuum for the K case starts to turn down as a result of the term. It is evident that the free-free emission makes negligible contribution to the emission at the shorter (UKIRT ) wavelengths. It is also evident that the plasma temperature is not well constrained.

From the fit we can determine the emitting mass, assuming pure hydrogen (). We find
| (2) |
where const for the K case, and const for the K case. For higher (lower) values of , the turn down shifts to shorter (longer) wavelengths. The [Si vi] 1.96m line (critical density cm-3 at K, cm-3 at K) was observed within days of the Herschel observation (Banerjee et al., 2012). If the [Si vi] line and free-free emission both arose in the same region of the ejecta, the electron density in the [Si vi]-emitting region was less than these values on 2012 October 12. The emitting mass is then ( ) for K ( K). So irrespective of the value of .
An alternative estimate for the electron density is given by Shore et al. (2013), who used the [O iii] 4636Å line to conclude that cm-3 on 2012 November 21 (day 152, 40 days later than the Herschel observation), for electron temperature K. Assuming that the density declines as , the electron density on day 112 would have been cm-3, leading to .
These estimates of are significantly larger than the ejecta mass determined by Shore et al. (2013) ( ), and indeed greater than the mass ejected in CN eruptions in general. We are led to conclude that the free-free-emitting material is unconnected with the 2012 eruption. This conclusion is consistent with the fact that the free-free emission is significantly lower than the NIR emission (see Fig. 6), which must originate from the 2012 ejecta.
4.3 NEOWISE data


The pre-eruption W1 and W2 fluxes have been subtracted from the NEOWISE data to give the 3.4m and 4.6m fluxes from the ejecta. These excess fluxes have been dereddened by . The variation of the dereddened flux excesses in NEOWISE bands W1 and W2 is also shown in Fig. 3, as is the variation of the corresponding flux ratio W2/W1. We consider possible origins of the excess flux.
4.3.1 Emission lines
The NEOWISE W1/W2 excess fluxes are unlikely to arise from coronal (or other emission) lines. Likely lines222We take these to be those lines that lie between the 10% levels of the W1/2 responses. in the NEOWISE bands are [Al v] 2.905m, [Mg viii] 3.028m, [Ca iv] 3.207m, [Al vi] 3.660m, [Al viii] 3.690m (W1) and Br 4.052m and [Mg iv] 4.487m (W2) (see Figure 1 of Evans et al., 2014). The line fluxes (and their variations) are determined by (i) the electron temperature and density and their variations, and possible abundance (and velocity) gradients in the ejecta, and (ii) the critical electron densities, above which the upper levels of coronal transitions are collisionally rather than radiatively de-excited. All these factors would have to combine in such a way that they mimic the monotonic increase in black body temperature we observe. It is highly unlikely that these would conspire to give the variations seen.
4.3.2 Free-free emission
The flux ratio is such that flux(W1) flux(W2) up to day 1700. Given the presence of optically thin free-free emission at wavelengths m (see Section 4.2), we consider whether the NEOWISE data might be consistent with free-free emission. We fit equation (1) to the excess fluxes in the NEOWISE data. However in general the derived plasma temperatures are K, with sporadic outliers K. We conclude that the excess fluxes in the NEOWISE data are not due to free-free emission.
4.3.3 Dust
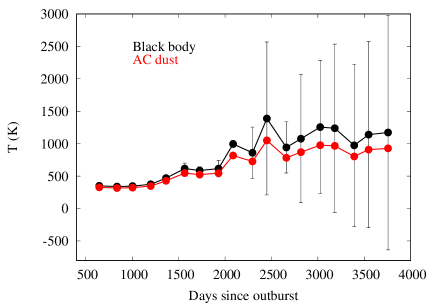
We next consider whether the excess flux might be due to dust emission. A simple black body
has been fitted to the flux excesses to give a black body temperature ; here is a scaling factor and . The variation in is shown in Fig. 7. Since we are determining two parameters ( and ) from just two data points, the uncertainties in and were estimated by fitting black bodies to the maximum and minimum fluxes consistent with the uncertainties in the flux excess; these uncertainties are included in Fig. 7. The temperature uncertainties become very large days from eruption because (a) the values of the W1 and W2 fluxes approach the faint quiescent values and (b) of the way in which they have been calculated. The bottom panel of Fig. 3, in which the uncertainties in W2/W1 are estimated from the uncertainties in the individual fluxes, suggests that (a) the temperature does indeed attain K at the latest times, (b) the dust temperature increases monotonically and (c) the short-term variations in after days are not real. Also included in the bottom panel of Fig. 3 is the flux ratio in the Rayleigh-Jeans limit (). The fact that some of the observed ratios at later times are consistent with this limit indicates that the latest temperatures should likely be regarded as lower limits. The temperature rises from K to K over the period of the NEOWISE data. Dust emission therefore seems to be the most reasonable interpretation of the excess fluxes.
Having established that the excess flux is due to emission by dust, we can place our interpretation of the data on a more robust footing by assuming a specific grain type. We assume amorphous carbon (AC), for which the Planck mean absorption efficiency has the particularly simple form , where for grain radius in cm (we take m), and (Evans et al., 2017). The resulting AC dust temperatures are also included in Fig. 7.
We estimate the mass of emitting dust using the formulae in Evans et al. (2017). The decline in the dust flux, and that of the corresponding dust mass (again assuming AC dust), is shown in Fig. 7. The mass of dust declines from an initial value to at later times, although values later than day should be regarded as upper limits. The initial mass may have been higher, but there are no NEOWISE data before day 644 to investigate this possibility. Note that the observed flux and its variation, together with that of the deduced dust mass, are independent of the location of the dust in the V959 Mon system.
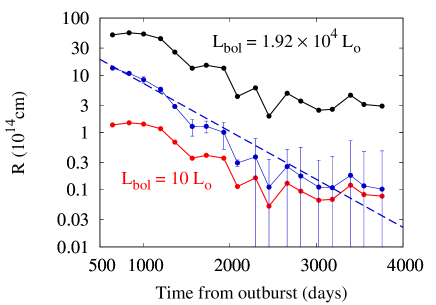
The star–dust distance may be estimated from
| (3) |
where is the Stefan-Boltzmann constant. During eruption, CNe essentially maintain constant bolometric luminosity, but in the case of V959 Mon, the super-soft phase, which traces the TNR and the constant bolometric luminosity phase, started to decline on day 200 (Page et al., 2013b) and had essentially “shut down” by day 247 (Page et al., 2013a). In Fig. 7, we first show for two extreme cases: (a) the constant bolometric luminosity displayed by V959 Mon during the super-soft phase, which we take to be ( ; based on the day 152 value from Shore et al., 2013, scaled to 3 kpc) and (b) , appropriate for a CN in its post-eruption phase. The actual luminosity must lie between these two extremes.
We can disregard the post-eruption luminosity ( ) case, for which the initial (day 644) radius is cm, eventually declining to cm. This range is well within the ejecta radius as determined by Shore et al. (2013). The ejecta would have reached this material only days after eruption; this would surely have had observable consequences.
To explore the declining bolometric luminosity case, we presume that it declines as described by Prialnik (1986), who found that, after the constant bolometric luminosity phase, the bolometric luminosity (for the case of a CO WD) varies approximately as . For V959 Mon, we suppose that varies as
where W and days marks the end of the super-soft phase.
The resultant variation of is shown as the blue curve in Fig. 7. The decline in with time is again evident, and is reasonably described by
| (4) |
where cm) and day-1; note that, while this gives a reasonable description of the behaviour of , there is no physical basis for the exponential dependence). Note also that the light travel time across the dust shell, days, so “infrared echo” effects are negligible over the timescale of the NEOWISE data ( days).
At days, cm, which corresponds to an angular diameter of at 3 kpc; ejecta moving at 2000 km s-1 would encounter this material days after the eruption.
This suggests that the dust is heated by the stellar remnant as its bolometric luminosity declined after the 2012 eruption, and is located at the distance shown by the blue curve in Fig. 7. The dust-bearing material is clearly unconnected with the 2012 eruption, and must predate this event. This pre-existing material may coincide with the “waist” of the structure identified in the day 882 HST image of V959 Mon (Sokoloski et al., 2016). If this pre-existing dust were heated by the pre-nova binary, its temperature would have been K, and would have had W m-2 if the nova progenitor had bolometric luminosity 10 . It would have been undetectable in the WISE or NEOWISE surveys, which, as discussed above, revealed only the secondary star. On the other hand, 0.1m AC grains at cm from a source of radiation that declines as discussed above would have temperature K on day 644, comparable with that observed in the earliest NEOWISE data (see Fig. 7).
The decline in grain mass (which, as already noted, occurs independently of the location of the dust) presumably arises because the dust is destroyed. This could occur by (a) the destruction of “static” pre-exiting dust, at constant distance from the star, or (b) dust that falls towards the star and is destroyed as it does so. To explore (a), we rearrange Equation (3) to obtain
where we have used the value of at 200 days as the fiducial and the Prialnik (1986) form for the decline in bolometric luminosity. We find that the grain radius becomes less than the dimensions of a C2 molecule around day . However there is obvious dust emission at least until day 2500, rendering this scenario unlikely. The implication is that the dust must be falling towards the central binary. The velocity with which it does so is (from equation (4))
where is in days. This greatly exceeds the free-fall velocity at , which is km s-1.
5 Origin of the dust
The dust interpretation of the flux excess is not straight-forward. The temperature increase in particular is counter-intuitive. It is inconsistent with grain formation, in which the starting temperature would be K, monotonically declining thereafter. Note that dust formation and subsequent cooling, as normally occurs in a dust-forming CN, would result in W2/W1 increasing with time, contrary to what is observed (see Fig. 3).
Furthermore, had V959 Mon undergone an episode of dust formation (see, e.g., Evans & Rawlings, 2012, for grain formation in CNe), its speed class would lead us to expect that it would have done so days after the 2012 eruption (see Figure 2 of Williams et al., 2013).
Moreover, clear evidence that we are not seeing freshly-formed dust comes by combining AAVSO and UKIRT WFCAM data obtained nearly contemporaneously with NEOWISE data. There is sufficient overlap between these datasets around days 636 and 848 (see Fig. 8; there are a few days’ offset between the NEOWISE, WFCAM and AAVSO data). Any freshly-formed dust would be visible in the WFCAM bands, particularly . Moreover, inspection of Fig. 1 shows that there was never an upturn in the -band light curve (see, e.g., Banerjee et al., 2016; Raj et al., 2017, for an illustration of the rise in the flux when dust forms in CNe). There is clearly no hot dust.
An IR echo is a possibility, if the echo from more distant (from the nova, i.e., cooler) dust reaches the observer before that from nearer (to the nova, i.e., hotter) dust. A suitable dust geometry could give rise to (a) the cool dust being seen first, followed (gradually) by the hotter dust, and (b) the apparent decline in . A dust density gradient such that the dust density increases with increasing distance from the nova would account for the apparent decline in . However such a scenario seems somewhat contrived.


A more plausible interpretation is that there was a dust shell around the V959 Mon system that pre-dated the 2012 eruption. There are two possible origins for such pre-existing circumbinary material:
-
1.
material left over from the common envelope phase through which the CN progenitor evolved. Numerical simulations (see, e.g., González-Bolívar et al., 2022) suggest that the common envelope ejected during this phase would have mass ;
-
2.
Williams et al. (2008) have argued that the transient heavy element absorption (THEA) systems seen in many CNe around maximum light indicate the presence of circumbinary gas that precedes the nova eruption. This material, which likely arises as a result of mass ejection from the secondary before the eruption, would have a mass , and be located AU ( cm) from the central binary.
In both cases the material would expected to be concentrated largely in the binary plane. However the material expected on the THEA system interpretation is expected to be much closer to the binary than the cm observed, so the common envelope seems the most likely interpretation.
The mass of the free-free-emitting gas detected in the Herschel data is given by equation (2). This gas, located in the circumbinary envelope, was flash-ionised by the 2012 eruption. We suggest that both the gas identified with the Herschel free-free emission, and the dust detected in the NEOWISE data, are associated with this pre-exisiting circumbinary material.
The mass of the common envelope is . From equation (2), the implied electron density for K is cm-3, and cm-3 for K. At K and K, the recombination time-scale is days and days respectively, so the ionisation is presumably maintained by the hot WD. These values of , together with the common envelope mass, yields an emitting volume cm3 for K, and cm3 for K, assuming solar composition. If the common envelope is in the form of a torus with major radius cm and minor radius , the volume is cm3. Given the approximations made, these estimates for the envelope volume are sufficiently close to suggest that this is a plausible interpretation. Further, if the (initial) of dust is uniformly distributed throughout the torus, there are 0.1m AC grains cm-3, which leads to an optical depth in the visual through the thickest part of the torus. The dust in the torus has essentially no extinction effect, even if its axis is perpendicular to the line of sight.
6 A possible interpretation
We propose a qualitative interpretation in which the ejecta from the 2012 eruption encounter the pre-exisiting circumbinary material ejected during the nova progenitor’s common envelope phase. We suggest that, in V959 Mon, the density of the latter exceeds that of the former where the two materials interact. We recall our estimate that the 2012 ejecta would reach the pre-exisiting dust shell in days which, given (a) the approximate nature of our estimates and (b) the fact that there are no NEOWISE data prior to day 644, is consistent with the time that the IR excess is first seen in the NEOWISE data. This interaction causes the ejecta to decelerate, producing conditions that are conducive to the formation of Rayleigh-Taylor instabilities. As a result the denser (dust-containing) material from the circumbinary material forms “blobs” and falls “downwards” towards the central binary, while the less dense ejecta accelerate into, and penetrate, the circumbinary material. The amount of dust seen in V959 Mon ( ) is orders of magnitude less than that expected to have formed in a common envelope ( ; see, e.g., Iaconi et al., 2020). As discussed in Section 4.3.3, the dust falls at velocity km s-1 ( in days), greatly in excess of the free-fall velocity at the distance of the torus. The free-fall timescale would be years rather than the days observed. We speculate that the dust may be carried inwards by a reverse shock, similar to that seen in the supernova remnant Cassiopeia A (Vink, Patnaude & Castro, 2022).
As the dust falls, its temperature increases even as the bolometric luminosity of the central source declines, as observed (see Fig. 7). The declining dust mass must be due to destruction of the dust. This can not be due to evaporation, as the observed temperatures start at K and remain well below the evaporation temperature for AC ( K; Ebel, 2000).
“Physical” sputtering, in which atoms are removed from the grain surface by the impact of a gas atom or ion, can not be important, because the threshold for removing an atom from the grain surface is eV, greater than the typical thermal energy of a gas atom/ion at K, eV.
Chemisputtering, in which the impacting atom/ion bonds with a surface atom and removes it, essentially has no threshold. We propose that, as the dust is exposed to the ejecta, it is subject to erosion, by chemisputtering (see Mitchell & Evans, 1984, for an application to CNe). The rate of erosion is given by
where is the hydrogen number density in the gas, is the chemisputtering yield, and , are the masses of the C and H atoms respectively.
The chemisputtering yield for atomic hydrogen on amorphous hydrogenated carbon, covering the surface temperature range of interest here, has been measured in the laboratory by Salonen et al. (2001). The yield at K is , rising to a peak of at 900 K, then falling back to at K. Assuming that the gas number density at cm was cm-3 (Shore et al., 2013), and that the density declines as , the hydrogen density at cm (see above) was cm-3.
For gas temperature K, a 350 K AC grain erodes at m day-1, while a 900 K grain erodes at m day-1. From Figs 3 and 7, we see that an AC grain in the environment of V959 Mon had temperature K after day 2000. During this time chemical erosion would have been at its most potent. The lifetime of a 0.1m grain at the start of the NEOWISE observations would have been days, falling to days as the grains became hotter. Chemisputtering is able to all but destroy the grains by the end of the NEOWISE observations, and is more than adequate to account for the decline of dust mass. Moreover, as the grains decrease in size, the effects of (by this time diminishing; see Page et al., 2013a) X-ray and ultra-violet radiation on the dust (e.g., by grain charging and subsequent destruction by electrostatic stress; Fruchter, Krolik & Rhoads, 2001) might come into play, thus accelerating the destruction process.
Whether or not this phenomenon occurs in CN eruption in general depends on the relative densities of the ejecta and the common envelope material they encounter. Also, if the grains in this material were silicate rather than AC, they would not be subject to the destructive effects of chemisputtering. We propose that the NEOWISE archive be interrogated for similar behaviour in the aftermath of future CNe eruptions.
7 Conclusion
NEOWISE data for V959 Mon suggest that dust was present in the nova system prior to the 2012 eruption. As the ejecta from the eruption encountered the pre-existing dust-bearing material, Rayleigh-Taylor instabilities gave rise to dust clumps which rained down onto the central binary. The relative densities of the pre-existing material and ejecta determine whether this phenomenon occurs in nova eruptions in general.
Acknowledgements
We thank the referee, Professor Bob Gehrz, for his very helpful comments on an earlier version of this paper.
This publication makes use of data products from the Wide-field Infrared Survey Explorer, which is a joint project of the University of California, Los Angeles, and the Jet Propulsion Laboratory/California Institute of Technology, funded by the National Aeronautics and Space Administration. It also makes use of data products from NEOWISE, which is a project of the Jet Propulsion Laboratory/California Institute of Technology, funded by the Planetary Science Division of the National Aeronautics and Space Administration.
This work has made use of data from the European Space Agency (ESA) mission Gaia (https://www.cosmos.esa.int/gaia), processed by the Gaia Data Processing and Analysis Consortium (DPAC, https://www.cosmos.esa.int/web/gaia/dpac/consortium). Funding for the DPAC has been provided by national institutions, in particular the institutions participating in the Gaia Multilateral Agreement.
UKIRT is currently owned by the University of Hawai’i (UH) and operated by the UH Institute for Astronomy. Over the period 2014–2017, UKIRT was supported by NASA and operated under an agreement among the UH, the University of Arizona, and Lockheed Martin Advanced Technology Center; operations were enabled through the co-operation of the East Asian Observatory. During the period of the earlier observations, UKIRT was operated by the Joint Astronomy Centre on behalf of the Science and Technology Facilities Council of the UK. We thank the UKIRT staff for carrying out the observations and the Cambridge Astronomy Survey Unit for processing the data.
PACS has been developed by a consortium of institutes led by MPE (Germany) and including UVIE (Austria); KU Leuven, CSL, IMEC (Belgium); CEA, LAM (France); MPIA (Germany); INAF-IFSI/OAA/OAP/OAT, LENS, SISSA (Italy); IAC (Spain). This development has been supported by the funding agencies BMVIT (Austria), ESA-PRODEX (Belgium), CEA/CNES (France), DLR (Germany), ASI/INAF (Italy), and CICYT/MCYT (Spain).
This paper also makes use of data products from the Two Micron All Sky Survey, which is a joint project of the University of Massachusetts and the Infrared Processing and Analysis Center/California Institute of Technology, funded by the National Aeronautics and Space Administration and the National Science Foundation.
We acknowledge with thanks the variable star observations from the AAVSO International Database contributed by observers worldwide and used in this research.
Data availability
The data used in this paper are available as follows:
WISE and NEOWISE: https://irsa.ipac.caltech.edu/
cgi-bin/Gator/nph-scan?submit=Select&projshort=WISE
Herschel: https://irsa.ipac.caltech.edu/applications/Herschel/
The UKIRT data are available on-line.
References
- Bailer Jones et al. (2021) Bailer Jones C. A. L., et al., 2021, AJ, 161, 147
- Banerjee et al. (2012) Banerjee D. P. K., Ashok N. M., Venkataraman V., 2012, ATel#4542
- Banerjee et al. (2016) Banerjee D. P. K., 2016, Srivastava M. K., Ashok N. M., Venkataraman V., 2016, MNRAS, 455, L109
- Bode & Evans (2012) Bode M. F., Evans A., eds Classical Novae, second edition, Cambridge University Press, Cambridge
- Cardelli et al. (1989) Cardelli J. A., Clayton G. C., Mathis J. S., 1989, ApJ, 345, 245
- Casali et al. (2007) Casali M., et al., 2007, A&A, 467, 777
- Cheung et al. (2012a) Cheung C. C., 2012a, ATel#4224
- Cheung et al. (2012b) Cheung C. C., 2012b, ATel#4310
- Chomiuk et al. (2020) Chomiuk L., Metzger B. D., Shen K. J, 2020, ARAA, 59, 391
- Cox (2000) Cox A. N., 2000, Allen’s Astrophysical Quantities, 4th ed. Publisher: New York: AIP Press; Springer.
- De et al. (2021) De K., et al., 2021, ApJ, 912, 19
- Ebel (2000) Ebel D. S., 2000, J. Geophys. Res., 105, 10363
- Evans & Rawlings (2012) Evans A., Rawlings J. M. C., 2012, in Classical Novae, eds M. F. Bode, A. Evans, second edition, Cambridge University Press, Cambridge
- Evans et al. (2014) Evans A., et al., 2014, MNRAS, 444, 1683
- Evans et al. (2017) Evans A., et al., 2017, MNRAS, 466, 4221
- Fruchter et al. (2001) Fruchter A., Krolik J. H., Rhoads J. E., 2001, ApJ, 563, 597
- Gaia Collaboration (2023) Gaia Collaboration, 2023, A&A, 674, A1
- Gehrels et al. (2004) Gehrels N.,et al., 2004, ApJ, 611, 1005
- Gehrz (1989) Gehrz R. D., 1989, in Interstellar Dust, proceedings of IAU Symposium 135, eds L. J. Allamandola, A. G. G. M. Tielens, Kluwer Academic Publishers, Dordrecht, p.445
- González-Bolívar et al. (2022) González-Bolívar M., De Marco O., Lau M. Y. M., Hirai R., Price D. J., 2022, MNRAS, 517, 3181
- Green et al. (2019) Green G. M., et al., 2019, ApJ, 887, 93
- Griffin et al. (2010) Griffin M. J., et al., 2010, A&A, 518, L3
- Healy et al. (2017) Healy F., O’Brien T. J., Beswick R., Avison A., Argo M. K., 2017, MNRAS, 469, 3976
- Iaconi et al. (2020) Iaconi R., Maeda K., Nozawa T., De Marco O., Reichardt T., 2020, MNRAS, 497, 3166
- Karzas & Latter (1961) Karzas W. J., Latter R., 1961, ApJS, 6, 167
- Linford et al. (2015) Linford J. D., et al., 2015, ApJ, 805, 136
- Mainzer et al. (2011) Mainzer A., et al., 2011, ApJ, 731, 53
- Mainzer et al. (2014) Mainzer A., et al., 2014, ApJ, 792, 30
- Mitchell & Evans (1984) Mitchell R. M., Evans A., 1984, MNRAS, 209, 945
- Munari et al. (2013) Munari U., Dallaporta S. Castellani F., Valisa P., Frigo A., Chomiuk L., Ribeiro V. A. R. M., 2013, MNRAS, 435, 771
- Nelson et al. (2012a) Nelson T., Mukai K., Chomiuk L., Sokoloski J., Weston J., Rupen M., Mioduszewski A., Roy N., 2012a, ATel #4321
- Nelson et al. (2012b) Nelson T., Mukai K., Sokoloski J., Chomiuk L., Rupen M., Mioduszewski A., Page K. L, Osborne J., 2012b, ATel #4590
- Nelson et al. (2021) Nelson T., et al., 2021, MNRAS, 500, 2798
- Osborne et al. (2012) Osborne J., Beardmore A. P., Page K. L., 2012 ATel #4727
- Page et al. (2013a) Page K. L., et al., 2013a, ATel #4845
- Page et al. (2013b) Page K. L., et al., 2013b, ApJ, 768, L26
- Pilbratt (2003) Pilbratt G. L., 2003, Proc. SPIE, 4850, 586
- Pilbratt et al. (2010) Pilbratt G. L. et al., 2010, A&A, 518, L1
- Poglitsch et al. (2010) Poglitsch A. et al., 2010, A&A, 518, 2
- Prialnik (1986) Prialnik D., 1986, ApJ, 310, 222
- Raj et al. (2017) Raj A., Das R. K., Walter F. M., 2017, ApJ, 835, 274
- Ribeiro et al. (2013) Ribeiro V. A. R. M., Munari U., Valisa P., 2013, ApJ, 768 49
- Saikia & Anupama (2012) Saikia D. J., Anupama G. C., 2012, Eds, Novae from radio to gamma rays, special edition of the Bulletin of the Astronomical Society of India, vol. 40
- Salonen et al. (2001) Salonen E., Nordlund K., Keinonen J., Wu C. H., 2001, Phys. Rev. B, 63, 195415
- Schlafly & Finkbeiner (2011) Schlafly E. F., Finkbeiner D. P., 2011, ApJ, 737, 103
- Shore et al. (2013) Shore S. N., De Gennaro Aquino I., Schwarz G. J., Augusteijn T., Cheung C. C., Walter F. M., Starrfield S., 2013, A&A, 553, A123
- Sokoloski et al. (2016) Sokoloski J. L., Lawrence S., Crotts A. P. S., Mukai K., 2016, in Accretion Processes in Cosmic Sources, Proceedings of Science, available online at http://pos.sissa.it/cgi-bin/reader/conf.cgi?confid=288, id.21
- Skrutskie et al. (2006) Skrutskie M. F., et al., 2006, AJ, 131, 1163
- Varricatt et al. (2012a) Varricatt W. P., Ehle J., Wold T., Banerjee D. P. K., Ashok N. M., 2012a, ATel #4572
- Varricatt et al. (2012b) Varricatt W. P., Ehle J., Wold T., Banerjee D. P. K., Ashok N. M., 2012b, ATel #4907
- Vink et al. (2022) Vink J., Patnaude D. J., Castro D., 2022, ApJ, 929, 57
- Wagner et al. (2013) Wagner R. M., Woodward C. E., Starrfield S., 2013, ATel #4737
- Williams et al. (2008) Williams R. E., Mason E., Della Valle M., Ederoclite A., 2008, ApJ, 685, 451
- Williams et al. (2013) Williams S. C., Bode M. F., Darnley M. J., Evans A., Zubko V., Shafter A. W., 2013, ApJL, 777, L32
- Woudt & Ribeiro (2014) Woudt P. A., Ribeiro V. A. R. M., 2014, eds Stella Novae: Past and Future Decades, Astronomical Society of the Pacific Conference Series, Volume 490
- Wright et al. (2010) Wright E. L., et al., 2010, AJ, 140, 1868
- Yates et al. (2024) Yates R. M., Hendriks D., Vijayan A. P., Izzard R. G., Thomas P. A., Das P., 2024, MNRAS, 527, 6292