![[Uncaptioned image]](/html/2405.04818/assets/fig/emoji/acorn.png) Acorn: Aspect-wise Commonsense Reasoning
Acorn: Aspect-wise Commonsense Reasoning
Explanation Evaluation
Abstract
Evaluating free-text explanations is a multifaceted, subjective, and labor-intensive task. Large language models (LLMs) present an appealing alternative due to their potential for consistency, scalability, and cost-efficiency.
In this work, we present ![]() Acorn, a new dataset of 3,500 free-text explanations and aspect-wise quality ratings, and use it to gain insights into how LLMs evaluate explanations.
We observed that replacing one of the human ratings sometimes maintained, but more often lowered the inter-annotator agreement across different settings and quality aspects, suggesting that their judgments are not always consistent with human raters.
We further quantified this difference by comparing the correlation between LLM-generated ratings with majority-voted human ratings across different quality aspects.
With the best system, Spearman’s rank correlation ranged between 0.53 to 0.95, averaging 0.72 across aspects, indicating moderately high but imperfect alignment.
Finally, we considered the alternative of using an LLM as an additional rater when human raters are scarce, and measured the correlation between majority-voted labels with a limited human pool and LLMs as an additional rater, compared to the original gold labels. While GPT-4 improved the outcome when there were only two human raters, in all other observed cases, LLMs were neutral to detrimental when there were three or more human raters.
We publicly release the dataset to support future improvements in LLM-in-the-loop evaluation.111https://github.com/a-brassard/ACORN
Acorn, a new dataset of 3,500 free-text explanations and aspect-wise quality ratings, and use it to gain insights into how LLMs evaluate explanations.
We observed that replacing one of the human ratings sometimes maintained, but more often lowered the inter-annotator agreement across different settings and quality aspects, suggesting that their judgments are not always consistent with human raters.
We further quantified this difference by comparing the correlation between LLM-generated ratings with majority-voted human ratings across different quality aspects.
With the best system, Spearman’s rank correlation ranged between 0.53 to 0.95, averaging 0.72 across aspects, indicating moderately high but imperfect alignment.
Finally, we considered the alternative of using an LLM as an additional rater when human raters are scarce, and measured the correlation between majority-voted labels with a limited human pool and LLMs as an additional rater, compared to the original gold labels. While GPT-4 improved the outcome when there were only two human raters, in all other observed cases, LLMs were neutral to detrimental when there were three or more human raters.
We publicly release the dataset to support future improvements in LLM-in-the-loop evaluation.111https://github.com/a-brassard/ACORN
1 Introduction
Natural language processing systems that not only generate correct output, but also provide an explanation (Miller, 2017) of why that particular output is correct, are desirable for several reasons, such as increasing trustworthiness (Floridi, 2019), compliance with “right to explanation” laws (e.g., European Parliament and Council of the European Union, ), increasing interpretability (Jacovi and Goldberg, 2020, but cf. Lipton, 2018), as well as system improvement and knowledge discovery (Adadi and Berrada, 2018). However, this immediately raises the question of how to evaluate system-generated explanations in an efficient and effective manner.
Since explanations are typically free-form text, automatic evaluation of explanations suffers the well-known, but as of yet unresolved, weaknesses of automatic evaluation measures (Celikyilmaz et al., 2021), while human evaluation is characterized by low scalability, high costs, subjectivity, and inconsistency (Hartmann and Sonntag, 2022). LLM-based evaluation presents an appealing alternative due to its potential high scalability, low cost, and consistency.
Here, we investigate whether LLMs (Brown et al., 2020; OpenAI, 2023, i.a.) can serve as a viable alternative approach to automatically evaluate system-generated explanations.
To verify the feasibility of this approach, we created ![]() Acorn, a new dataset of 3,500 textual explanations with aspect-wise human ratings of their quality, a first of its kind, and used it to evaluate whether LLMs are aligned with human judgments (Figure 1).
Acorn, a new dataset of 3,500 textual explanations with aspect-wise human ratings of their quality, a first of its kind, and used it to evaluate whether LLMs are aligned with human judgments (Figure 1).
Specifically, we first considered whether LLMs’ labels deviate from what would be expected from human raters. We compared inter-annotator agreement between all-human annotation (five raters) and when one of the raters is replaced by an LLM. We found that most LLMs reduced the agreement, indicating that their judgments skew outside of expected human rating.
GPT-4, however, had consistently less impact on the agreement, suggesting that it may still have potential as a replacement for human judgments. To verify this, we considered two scenarios: one where the LLM replaces the full human evaluation, and one where it is used only as an additional rater. In other words, we compared LLMs to humans collectively and individually.
With the best-performing model, Spearman’s rank correlation between majority-voted gold labels and LLM-generated ones ranged between 0.52 and 0.95, depending on the aspect, averaging 0.72. This indicates that the LLM’s labels are not entirely in line with human judgments, but they are not entirely random either, and their usefulness may depend on the specific evaluation criteria and usage case.
As for using the LLM as a single rater, we considered whether, in a limited-budget scenario, it would be beneficial to use an LLM as an additional rater. Specifically, we compared whether the majority-voted labels of a reduced set of raters and with an added LLM had a higher correlation with the original majority-voted labels. In most cases, the addition of LLMs either had no effect or was detrimental, suggesting that they are not a reliable replacement for human raters. One exception was GPT-4, which improved correlation in a scenario with only two human raters. However, the resulting labels are still less reliable than those from three or more human raters.
In summary, we quantified the consequences of using LLMs as a replacement or addition to human evaluation, concluding that most have rating biases that diverge from human consensus, leading to different outcomes. GPT-4 had a beneficial effect when there were only two other human raters, but did not compensate as much as an additional human rater did. We release ![]() Acorn as a benchmark for future research on automatic evaluation of explanations.
Acorn as a benchmark for future research on automatic evaluation of explanations.

2 Building Acorn: Evaluation Criteria and Data Sources
In a typical commonsense reasoning test, a model selects the most plausible answer for a multiple-choice question. In a predict-and-explain setting, the model additionally generates an explanation to justify the selected answer, where we encounter the challenge of evaluating these explanations. Thus, we first define a set of rating criteria (§2.1) and collect human ratings for a selection of existing and newly collected textual explanations (§2.2, §2.3).
2.1 Rating Criteria
| Criterion | Description | Label Choices |
| \titlecapSupports | Which answer does it justify? | a), b), …, none |
| \titlecapOverall | How good is the given explanation, overall? | 1 to 5 stars |
| \titlecapWell-Written | Coherent, grammatically correct, fluent? | Yes, No |
| \titlecapRelated | Relevant to the Q and A? | Yes, No |
| \titlecapFactual | Stated facts are generally true? | Yes, No, N/A |
| \titlecapNew Information | How much new information to support the ans.? | None, Some, Sufficient, Ample |
| \titlecapUnnecessary Info. | Any unnecessary statements? | Yes, No |
| \titlecapContrastive | Clearly shows the difference between the ans.? | Yes, No |
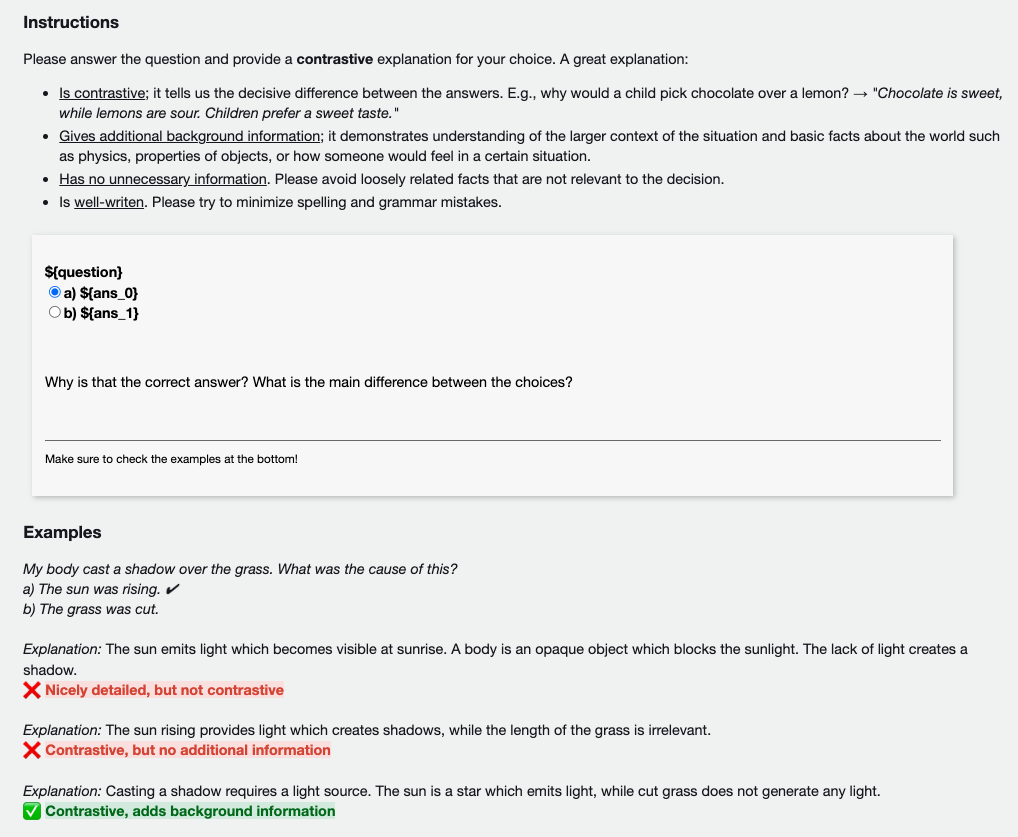
As of now, there is no consensus on which criteria to use when evaluating explanations. Our selection was informed by the following. Explanation evaluation falls under the umbrella of natural language generation (NLG) evaluation. We boiled down commonly used criteria (Howcroft et al., 2020) to two overarching aspects: surface-level criteria and information/content-level criteria, namely fluency and information sufficiency or minimality. Additionally, we introduced criteria informed by known challenges of free-text explanations: an LLM-generated explanation is not necessarily faithful to a model’s inner workings (faithfulness; Lipton, 2018), and can include hallucinated untrue facts (factuality; Rawte et al., 2023). Finally, inspired by Miller (2017), we add a criterion aligned with an ideal explanation’s structure (contrastiveness) and a retain a non-specific overall rating intended to capture potentially informative or useful aspects that we have not explicitly covered. Our resulting criteria are summarized in Table 1. During crowdsourcing, workers were given detailed guidelines and examples to ensure a consistent understanding of these criteria (Appendix B).
2.2 Source Datasets
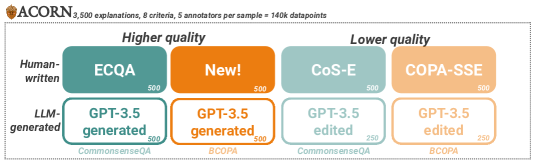
Acorn contains ratings for a diverse set of existing, newly-collected, and generated explanations. Our choice covers two commonsense reasoning benchmarks, and their respective explanation datasets of varying qualities (Figure 2). From each, we selected a random subset of 500 explanations for rating, as well as an additional 500 samples of fluency-improved versions, resulting in a total of 3,500 explanations. With five raters and eight criteria per sample, this amounts to 140k ratings in total.
Specifically, as the target commonsense reasoning benchmarks, we selected BCOPA (Kavumba et al., 2019)222Balanced COPA; a superset of COPA (Gordon et al., 2012) with added “mirrored” questions that flip the correct label, i.e., the originally incorrect choice becomes correct.and CommonsenseQA (Talmor et al., 2019) based on the simplicity of their tasks and availability of large-scale explanation datasets (Wiegreffe and Marasović, 2021). Below are the respective datasets we used to source candidate explanations.
CoS-E
(Rajani et al., 2019) A widely-used explanation dataset for CommonsenseQA, albeit notoriously uninformative to humans (Nauta et al., 2023). A subset is processed through GPT-3.5333A now deprecated version of text-davinci-003. for fluency improvement, providing negative samples for higher-level issues like lack of contrastiveness or adequate information. (500 random samples + 250 fluency-improved versions)
ECQA
(Aggarwal et al., 2021) An improved version of explanations for CommonsenseQA, aligning with our criteria for well-formed explanations. (500 random samples)
Generated explanations for CommonsenseQA.
Additional high-quality explanations generated by prompting GPT-3.5 to solve a subset of CommonsenseQA, though potential issues like irrelevant information were noted. (500 samples)
COPA-SSE
(Brassard et al., 2022) Explanations for BCOPA with a subset processed through GPT-3.5 for fluency improvement. Since COPA-SSE already contains overall quality ratings, we selected a random sample of 250 questions and used each question’s top-rated and bottom-rated explanation. (500 samples + 250 fluency-improved versions) through gpt-3.5
Crowdsourced explanations for BCOPA.
ECQA’s counterpart for BCOPA; a new set of hand-written explanations, carefully crafted for contrastiveness and thoroughness. (500 samples)
Generated explanations for BCOPA.
Similarly to CoS-E, we prompted GPT-3.5 to solve BCOPA questions. (500 samples)
2.3 Rating Collection
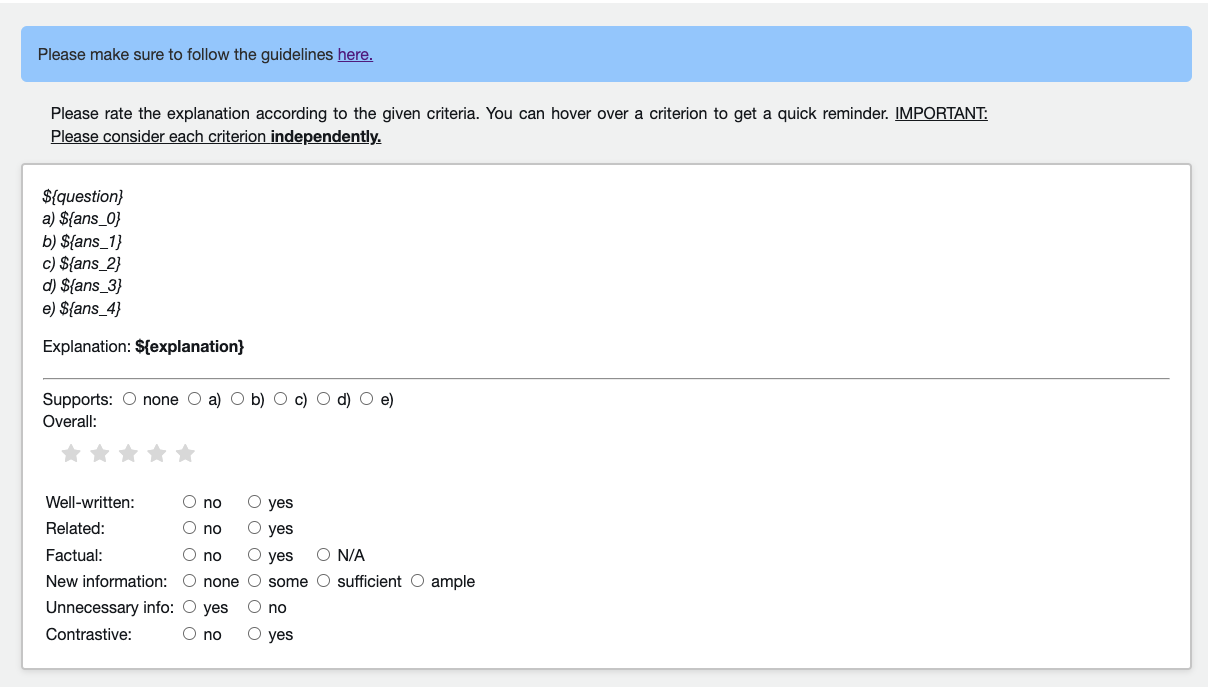
We crowdsourced ratings for the explanations in ![]() Acorn using Amazon Mechanical Turk (AMT). Each rater was required to pass a qualification test, after which they were asked to participate in trial rounds, during which we addressed several clarity issues in the guidelines. The final pool was hand-picked based on their responses, resulting in 28 participants. More details on the crowdsourcing protocol are available in Appendix B.
In experiments which use aggregated labels, they were produced with a majority-vote mechanism, with ties broken using the better label.
Acorn using Amazon Mechanical Turk (AMT). Each rater was required to pass a qualification test, after which they were asked to participate in trial rounds, during which we addressed several clarity issues in the guidelines. The final pool was hand-picked based on their responses, resulting in 28 participants. More details on the crowdsourcing protocol are available in Appendix B.
In experiments which use aggregated labels, they were produced with a majority-vote mechanism, with ties broken using the better label.
3 Can LLMs Replace Human Raters?
We answer this question in three steps: we first measure LLMs’ divergence from expected human label variance (§3.2), then observe the results when using it to completely replace human evaluation (§3.3), and when using it as an additional rater instead (§3.4). All experiments follow the settings described in Section 3.1.
3.1 Experimental Settings
Models.
We compared four contemporary API-enabled LLMs, namely GPT-3.5, GPT-4, PALM 2, and Gemini. Each have reported high performance in diverse tasks including text-based reasoning. We used the gpt-3.5-turbo-0613 and gpt-4-0613 snapshots of OpenAI’s GPT-3.5 and GPT-4 models (Brown et al., 2020; OpenAI, 2023), and the text-bison-001 and gemini-1.0-pro versions of Google’s PALM 2 and Gemini models (Google, 2023; Gemini Team, 2023). In all experiments, temperature is set to 0.0 with 256 output tokens at most, with all other parameters left at their default values.
Prompting Strategy.
LLMs are notoriously oversensitive to prompt format (Wadhwa et al., 2023). For the purpose of our analyses, we explored several prompting strategies and retained the most successful one for each model, as measured by correlation with majority-voted human ratings. In short, all models worked best with verbatim prompts, which corresponds to a word-by-word copy of the guidelines given to humans. The models responded with a structured list of criteria and their assigned labels for the given target explanation (in most cases). See Appendix C for a detailed overview of alternative strategies that were considered.
Label Extraction.
Using free-text generation models for a classification task introduces the problem of extracting said ratings, and presents an information extraction challenge in itself. This phenomenon, inherent to generative approaches (Wadhwa et al., 2023), is a source of additional noise that affects all evaluation pipelines necessitating a non-trivial solution in real applications. In our experiments, we used a rule-based extraction method, backed up with LLM-based extraction in case of failure. Finally, we manually confirmed the remaining failures,444Due to complete failure to follow the given task, exceeding the output token limit with overly verbose responses, refusal to answer due to “a lack of explanation,” or triggering content filters. and counted them as incorrect predictions. With verbatim prompts, the extraction failure rate was <0.1% for all models but Gemini (1.74%).
3.2 Inter-annotator Agreement
In subjective tasks, some degree of label variance is expected, resulting in lower inter-annotator agreement. This disagreement is not necessarily noise, but a feature of the data, as it can reflect the diversity of human opinions (Aroyo and Welty, 2015). In this context, regardless of absolute agreement, a successful LLM-based rater should be harmonious with the range of human labels rather than deviate from it.
To measure this, we compared the inter-annotator agreement (Krippendorff’s ) between human raters and when a random rater is replaced by an LLM. There are three possible outcomes: (i) agreement decreases, indicating that the LLM deviates from human judgments; (ii) agreement remains the same, indicating that it is harmonious with human judgments; or (iii) agreement increases, meaning that the LLM is both harmonious and biased towards a majority.555The latter may be desirable in use cases that rely on majority-voted labels as the ground truth, but comes with the trade-off of losing potentially useful label diversity.
Results.
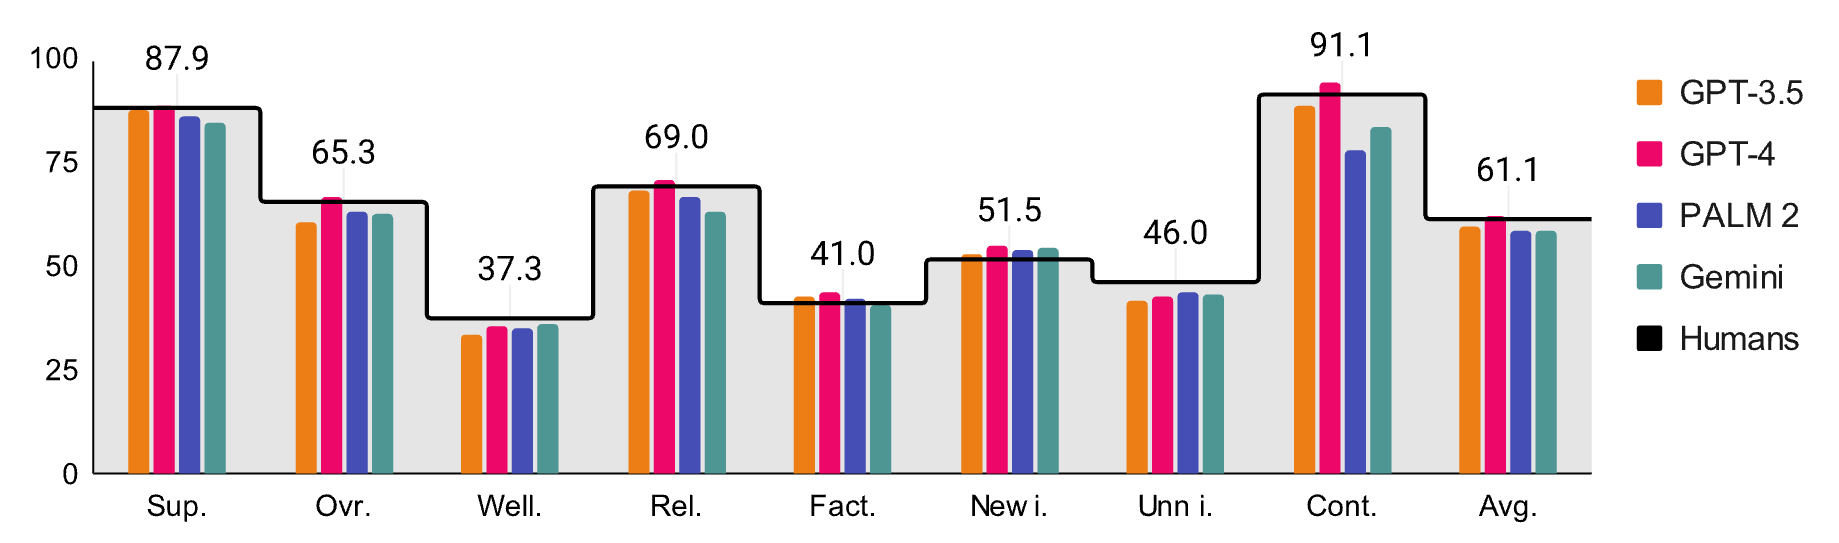
In Figure 3, the shaded area shows the agreement between human raters, while the bars show the agreement when the respective LLM’s ratings replace a random human rater. All values are averaged over twenty iterations. In most cases, agreement decreased, indicating that the LLMs generated labels that conflicted with human ones, and therefore cannot be considered suitable replacements. A notable exception is GPT-4, which maintained or improved agreement in all criteria but well-written and unnecessary information.
3.3 LLMs As A Replacement for Human Evaluation
GPT-4 maintained or improved inter-annotator in most criteria, suggesting that it does not deviate from an expected range of human ratings. Here, we ask if it can then be used as a replacement for human evaluation. Specifically, we investigated the degree to which GPT-4’s predictions align with majority-voted human labels, measured with Spearman’s rank correlation.
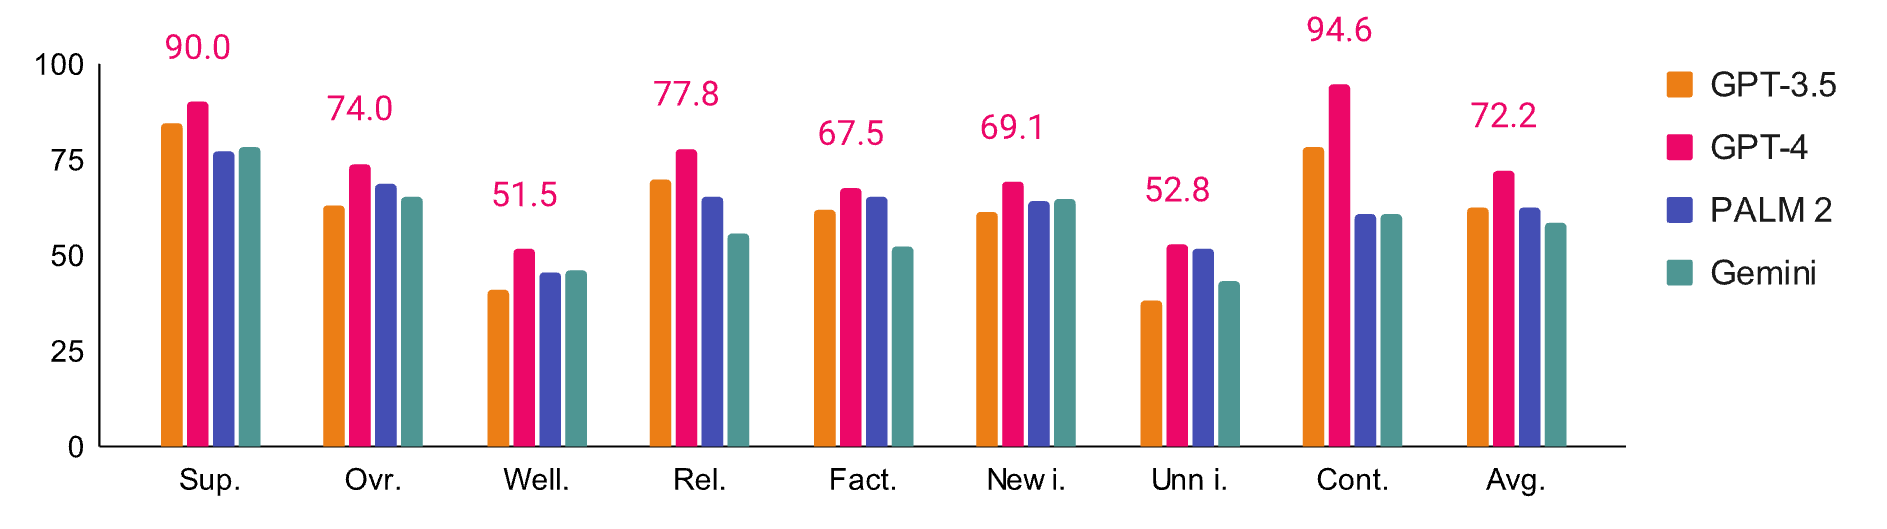
Results.
Figure 4 shows Spearman’s ranking correlation (*100 for legibility) between aggregated human labels and LLM predictions. GPT-4 results are annotated, with others shown for comparison. All values are positive, indicating a positive correlation with the ratings. The correlations in supports and contrastive were particularly strong, with values of 0.90 and 0.95, respectively. Others ranged from 0.52 to 0.78, indicating a moderately high correlation. However, the model is clearly not a perfect replacement for human raters. Instead, considering the small change in inter-annotator agreement (§3.2), the model could potentially be used as an additional rater when human annotation is scarce, which we explore in the next section.
3.4 LLMs As An Additional Rater
The results so far hinted towards GPT-4 acting similarly to an average human rater. Thus, it may seem appealing as an additional data point when human raters are scarce or expensive. Here, we verified this potential by measuring whether using GPT-4 as an additional rater improved the outcome over having fewer human raters, i.e., whether the majority-voted labels became more aligned with the original ones when the LLM is added as a rater.
Specifically, we compared Spearman’s rank correlation between the majority-voted labels with all available raters and in two alternative scenarios: one where GPT-4 is added as an additional rater and one where it is not. If the correlation increases when GPT-4 is added, it suggests that its predictions are in line with the original majority-voted labels, and it is useful as an additional rater. Otherwise, it would indicate a harmful or negligible effect, and thus its inclusion should be avoided. We repeated this comparison for scenarios with four, three, and two random human raters, respectively. All other models are also included for comparison.
Results.
Figure 5 shows Spearman’s rank correlation with the original gold ratings obtained by aggregating the labels of all five raters. Humans only denotes the correlation between human majority-voted labels only, and others when including the respective LLM as an additional rater.
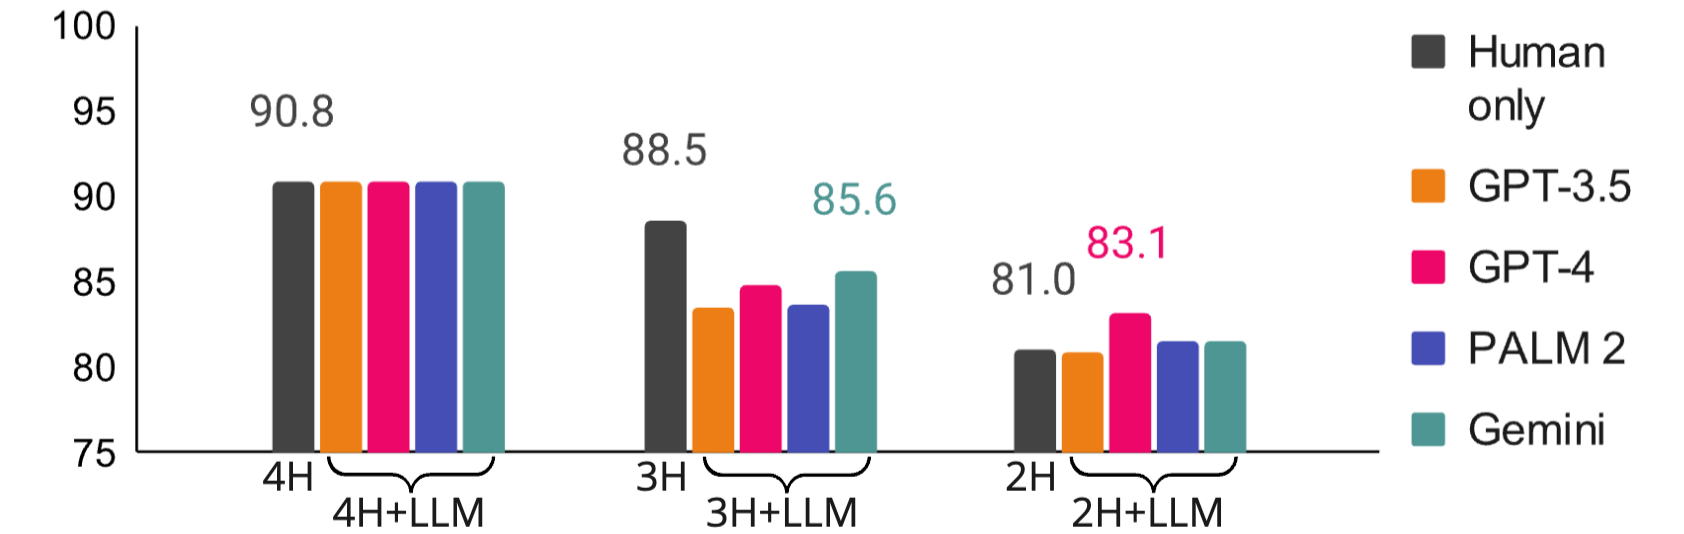
The leftmost cluster compares majority-voted labels between four human raters (4H) and four raters with an LLM added (4H+LLM). All correlations stayed the same (0.91), indicating that the LLMs did not compensate for the difference caused by a missing human rater. In this case, there was no harm nor benefit to including an LLM.
In the center, we observe the effect when the human raters are reduced to three (3H), with the influence of the LLM becoming stronger (3H+LLM). Human-only correlation with the original gold labels dropped to 0.86, and all LLMs decreased the correlation further. In this case, including an LLM was detrimental, bringing the majority labels further from the original human consensus.
Finally, the rightmost cluster shows the case of two human raters (2H) and adding the respective LLMs (2H+LLM). This represents the minimum possible ratio of humans to LLMs where humans still retain a majority. Interestingly, while overall correlation yet again decreased, GPT-4 improved the correlation (0.81 to 0.83).
Overall, we conclude that when there is already a large pool of workers (four+), there is no benefit to adding an LLM as a judge. GPT-4 can be a useful addition if there are only two human raters, but the resulting labels are still less reliable than those from three or more human raters.
4 Discussion
From our results, we conclude that most models we tested are not suitable for replacing human raters based on their divergence from human rater’s distributions. The best-performing model, GPT-4, generated labels that were particularly correlated (>0.90) with human majorities in supports and contrastive criteria but less so in others (0.52-0.78). Acting as an additional rater, GPT-4 did not affect the outcome over having one less human rater, harmed the outcome when there were three human raters, and improved the outcome when there were only two human raters. This suggests that GPT-4 may only be useful as an additional rater when human raters are particularly scarce.
From this, we concluded that LLMs are not a reliable replacement for human raters, except in isolated cases. However, in this work, we operated under the assumption that majority-voted labels are the ground truth. In practice, this may not always be the case, and the reliability of LLMs may vary depending on what information is desired in a given scenario. This opens up a new avenue for future work, where LLMs can be applied in a more nuanced manner, considering the context of the task and the intended use of the labels.
Overall, as a balanced approach, we recommend using LLMs in configurations that end with targeted human involvement, such as extensively using LLMs in development or filtering stages and experts for final testing or evaluation.
5 Related Work
LLM-based Evaluation
LLMs as data labelers, and more broadly humans-and-LLMs-in-the-loop settings, are an emerging direction in data collection and labeling. E.g., Wiegreffe et al. (2022) developed a predict-and-explain pipeline that combines GPT-3 with a supervised filter trained on binary acceptability judgments from humans. More recently, Chiang and Lee (2023) proposed using LLMs to evaluate text, closely in line with our work. They, however, found the models successful in their setting. In contrast, we focus on explanation rating with more complex fine-grained criteria, and closely scrutinize potential weaknesses; Previous works brought into question the reliability of LLMs’ predictions, especially in prompting setups. E.g., Webson and Pavlick (2022) found that instruction-tuned models often produced good predictions with irrelevant or misleading prompts, bringing into question their real “understanding” of the task. Others reported unreliability of LLMs as labelers in various settings (Albrecht et al., 2022; Shen et al., 2023; Hada et al., 2023, i.a.), a line of work which we join with findings in the context of explanation evaluation.
Explanation Evaluation
For explanations in the form of textual justifications, previous works often defined their own criteria for evaluation. Automatic evaluation borrowed from machine learning and measures overlap with “gold standard” text using (a) word-overlap metrics, e.g., BLEU, METEOR and ROUGE; and (b) embedding-based metrics, e.g., BERTScore and BLEURT (Clinciu et al., 2021). In contrast, human-tagged measures are more diverse and explanation-specific. For example, Clinciu et al. (2021) measured Informativeness and Clarity; Wiegreffe et al. (2022), inspired by social sciences, measured Acceptability, Generality, Factuality, Grammar, New Info, Supports Label, and Amount of Information; while Aggarwal et al. (2021) defined the criteria of Refutation, Complete, Comprehensive, Minimal, and Coherent. A recent study instead focused on the utility of explanations, i.e., their helpfulness in answering a question from a human point of view (Joshi et al., 2023). In our work, we largely followed these existing criteria, with the addition of a “supports” criterion indicating which answer the explanation attempts to justify.
Explain-and-Predict
Explanations are often generated in predict-and-explain settings, where models provide justifications for their answers in QA-based benchmarks (e.g., Clinciu et al., 2021), or an elaborate-then-predict setting, where models output a prediction guided by its intermediate outputs such as knowledge statements or reasoning chains (e.g., Marasovic et al., 2022; Wang et al., 2023). In this work, we evaluate the capabilities of LLMs to evaluate explanations in an explain-and-predict setting, where models provide justifications for their answers in commonsense reasoning benchmarks. The following sections provide background on each aspect.
6 Conclusions
Using a newly-built dataset of free-text explanations and crowdsourced aspect-wise quality ratings, we analyzed the viability of LLMs as explanation evaluators. We found that LLMs decrease inter-annotator agreement when replacing human ratings, and that their ratings are moderately to highly correlated with human ratings, depending on the quality aspect. In a scenario where LLMs are used as additional raters instead, we found that they can improve the outcome when there are only two human raters, but are neutral to detrimental when there are three or more human raters. We conclude that while LLMs can provide ratings moderately consistent with an average crowdworker, they are not yet reliable enough for complete replacement.
Limitations
Explanation evaluation is inherently subjective, and the majority-voted gold label is not necessarily the “correct” answer. Subjectivity-informed scoring is a complex task, and we leave its exploration to future work. Furthermore, criteria may change depending on the intended use. Here, we limited our analysis to a researcher’s point of view, where explanations are increasingly used as a diagnostic tool, and aligned our criteria to a list of general explanatory competencies. While our insights on LLMs’ performance may potentially be applicable to different evaluation tasks, it should not be assumed to be universally true.
LLMs are known to be sensitive to prompt format. We somewhat compensated for this by comparing a prompt-averaged setting, and our focus is not to search for the optimal setting but rather investigate potential fundamental issues with LLM-based evaluation. However, for practical applications, we acknowledge that there is a wealth of tweaks that may improve the performance. Nevertheless, our findings highlight the need for caution when using LLMs for explanation evaluation, and we hope that our work will inspire further research in this direction.
Ethics Statement
Some of the datasets used in our research have been found to contain biases that can be further perpetuated through explanations supporting them. As such, this data should not be used in any downstream applications without first controlling for potentially harmful samples. Some of the commercial LLMs we used have built-in filters for potentially harmful content, which were triggered during several of our experiments.
Crowdworkers play a vital role in dataset creation. We prioritized fair compensation, transparency in data usage, and respect for their rights and privacy. Workers were informed on their work’s intended usage and of our identity as requesters. We did not collect any personal information.
Acknowledgements
This work was supported by JST CREST Grant No. JPMJCR20D2 and JSPS KAKENHI Grant No. 15H01702 and 21K17814. We extend sincere thanks to all the crowdworkers who helped realize this project with their diligent work in labeling the dataset. A big thanks to Tatsuki Kuribayashi and Jonas F. Lotz for their detailed feedback on the paper.
This work was written with the help of LLM-powered writing and coding assistants, however, all ideas and opinions presented in this work are solely those of the authors.
References
- Adadi and Berrada (2018) Amina Adadi and Mohammed Berrada. 2018. Peeking inside the black-box: A survey on explainable artificial intelligence (xai). IEEE Access, 6:52138–52160.
- Aggarwal et al. (2021) Shourya Aggarwal, Divyanshu Mandowara, Vishwajeet Agrawal, Dinesh Khandelwal, Parag Singla, and Dinesh Garg. 2021. Explanations for CommonsenseQA: New Dataset and Models. In Proceedings of the 59th Annual Meeting of the Association for Computational Linguistics and the 11th International Joint Conference on Natural Language Processing (Volume 1: Long Papers), pages 3050–3065, Online. Association for Computational Linguistics.
- Albrecht et al. (2022) Joshua Albrecht, Ellie Kitanidis, and Abraham J Fetterman. 2022. Despite "super-human" performance, current LLMs are unsuited for decisions about ethics and safety.
- Aroyo and Welty (2015) Lora Aroyo and Chris Welty. 2015. Truth is a lie: Crowd truth and the seven myths of human annotation. AI Mag., 36(1):15–24.
- Brassard et al. (2022) Ana Brassard, Benjamin Heinzerling, Pride Kavumba, and Kentaro Inui. 2022. COPA-SSE: Semi-structured Explanations for Commonsense Reasoning. In Proceedings of the Thirteenth Language Resources and Evaluation Conference, pages 3994–4000, Marseille, France. European Language Resources Association.
- Brown et al. (2020) Tom B Brown, Benjamin Mann, Nick Ryder, Melanie Subbiah, Jared Kaplan, Prafulla Dhariwal, Arvind Neelakantan, Pranav Shyam, Girish Sastry, Amanda Askell, Sandhini Agarwal, Ariel Herbert-Voss, Gretchen Krueger, Tom Henighan, Rewon Child, Aditya Ramesh, Daniel M Ziegler, Jeffrey Wu, Clemens Winter, Christopher Hesse, Mark Chen, Eric Sigler, Mateusz Litwin, Scott Gray, Benjamin Chess, Jack Clark, Christopher Berner, Sam McCandlish, Alec Radford, Ilya Sutskever, and Dario Amodei. 2020. Language Models are Few-Shot Learners. pages 1877–1901.
- Celikyilmaz et al. (2021) Asli Celikyilmaz, Elizabeth Clark, and Jianfeng Gao. 2021. Evaluation of text generation: A survey.
- Chiang and Lee (2023) Cheng-Han Chiang and Hung-Yi Lee. 2023. Can large language models be an alternative to human evaluations? In Proceedings of the 61st Annual Meeting of the Association for Computational Linguistics (Volume 1: Long Papers), pages 15607–15631, Stroudsburg, PA, USA. Association for Computational Linguistics.
- Clinciu et al. (2021) Miruna-Adriana Clinciu, Arash Eshghi, and Helen Hastie. 2021. A study of automatic metrics for the evaluation of natural language explanations. In Proceedings of the 16th Conference of the European Chapter of the Association for Computational Linguistics: Main Volume, Stroudsburg, PA, USA. Association for Computational Linguistics.
- (10) European Parliament and Council of the European Union. Regulation (EU) 2016/679 of the European Parliament and of the Council.
- Floridi (2019) Luciano Floridi. 2019. Establishing the rules for building trustworthy ai. Nature Machine Intelligence, 1(6):261–262.
- Gemini Team (2023) Gemini Team. 2023. Gemini: A Family of Highly Capable Multimodal Models.
- Google (2023) Google. 2023. PaLM 2 Technical Report.
- Gordon et al. (2012) Andrew Gordon, Zornitsa Kozareva, and Melissa Roemmele. 2012. SemEval-2012 Task 7: Choice of Plausible Alternatives: An Evaluation of Commonsense Causal Reasoning. In *SEM 2012: The First Joint Conference on Lexical and Computational Semantics – Volume 1: Proceedings of the main conference and the shared task, and Volume 2: Proceedings of the Sixth International Workshop on Semantic Evaluation (SemEval 2012), pages 394–398, Montréal, Canada. Association for Computational Linguistics.
- Hada et al. (2023) Rishav Hada, Varun Gumma, Adrian de Wynter, Harshita Diddee, Mohamed Ahmed, Monojit Choudhury, Kalika Bali, and Sunayana Sitaram. 2023. Are Large Language Model-based Evaluators the Solution to Scaling Up Multilingual Evaluation?
- Hartmann and Sonntag (2022) Mareike Hartmann and Daniel Sonntag. 2022. A survey on improving NLP models with human explanations. In Proceedings of the First Workshop on Learning with Natural Language Supervision, pages 40–47, Dublin, Ireland. Association for Computational Linguistics.
- Howcroft et al. (2020) David M Howcroft, Anya Belz, Miruna-Adriana Clinciu, Dimitra Gkatzia, Sadid A Hasan, Saad Mahamood, Simon Mille, Emiel van Miltenburg, Sashank Santhanam, and Verena Rieser. 2020. Twenty Years of Confusion in Human Evaluation: NLG Needs Evaluation Sheets and Standardised Definitions. In Proceedings of the 13th International Conference on Natural Language Generation, pages 169–182, Dublin, Ireland. Association for Computational Linguistics.
- Jacovi and Goldberg (2020) Alon Jacovi and Yoav Goldberg. 2020. Towards faithfully interpretable NLP systems: How should we define and evaluate faithfulness? In Proceedings of the 58th Annual Meeting of the Association for Computational Linguistics, pages 4198–4205, Online. Association for Computational Linguistics.
- Joshi et al. (2023) Brihi Joshi, Ziyi Liu, Sahana Ramnath, Aaron Chan, Zhewei Tong, Shaoliang Nie, Qifan Wang, Yejin Choi, and Xiang Ren. 2023. Are machine rationales (not) useful to humans? Measuring and improving human utility of free-text rationales. Annual Meeting of the Association for Computational Linguistics.
- Kavumba et al. (2019) Pride Kavumba, Naoya Inoue, Benjamin Heinzerling, Keshav Singh, Paul Reisert, and Kentaro Inui. 2019. When Choosing Plausible Alternatives, Clever Hans can be Clever. In Proceedings of the First Workshop on Commonsense Inference in Natural Language Processing, pages 33–42, Hong Kong, China. Association for Computational Linguistics.
- Lipton (2018) Zachary C Lipton. 2018. The Mythos of Model Interpretability: In machine learning, the concept of interpretability is both important and slippery. Queueing Syst., 16(3):31–57.
- Marasovic et al. (2022) Ana Marasovic, Iz Beltagy, Doug Downey, and Matthew Peters. 2022. Few-Shot Self-Rationalization with Natural Language Prompts. In Findings of the Association for Computational Linguistics: NAACL 2022, pages 410–424, Seattle, United States. Association for Computational Linguistics.
- Miller (2017) Tim Miller. 2017. Explanation in Artificial Intelligence: Insights from the Social Sciences.
- Nauta et al. (2023) Meike Nauta, Jan Trienes, Shreyasi Pathak, Elisa Nguyen, Michelle Peters, Yasmin Schmitt, Jörg Schlötterer, Maurice van Keulen, and Christin Seifert. 2023. From Anecdotal Evidence to Quantitative Evaluation Methods: A Systematic Review on Evaluating Explainable AI. ACM Comput. Surv., 55(13s):1–42.
- OpenAI (2023) OpenAI. 2023. GPT-4 Technical Report.
- Rajani et al. (2019) Nazneen Fatema Rajani, Bryan McCann, Caiming Xiong, and Richard Socher. 2019. Explain yourself! Leveraging language models for commonsense reasoning. In Proceedings of the 57th Annual Meeting of the Association for Computational Linguistics, Stroudsburg, PA, USA. Association for Computational Linguistics.
- Rawte et al. (2023) Vipula Rawte, Amit Sheth, and Amitava Das. 2023. A survey of hallucination in Large Foundation Models.
- Shen et al. (2023) Chenhui Shen, Liying Cheng, Xuan-Phi Nguyen, Yang You, and Lidong Bing. 2023. Large Language Models are Not Yet Human-Level Evaluators for Abstractive Summarization. In Findings of the Association for Computational Linguistics: EMNLP 2023, pages 4215–4233, Singapore. Association for Computational Linguistics.
- Talmor et al. (2019) Alon Talmor, Jonathan Herzig, Nicholas Lourie, and Jonathan Berant. 2019. CommonsenseQA: A Question Answering Challenge Targeting Commonsense Knowledge. In Proceedings of the 2019 Conference of the North American Chapter of the Association for Computational Linguistics: Human Language Technologies, Volume 1 (Long and Short Papers), pages 4149–4158, Minneapolis, Minnesota. Association for Computational Linguistics.
- Wadhwa et al. (2023) Somin Wadhwa, Silvio Amir, and Byron C Wallace. 2023. Revisiting Relation Extraction in the era of Large Language Models.
- Wang et al. (2023) Wenya Wang, Vivek Srikumar, Hannaneh Hajishirzi, and Noah A Smith. 2023. Elaboration-Generating Commonsense Question Answering at Scale. In Proceedings of the 61st Annual Meeting of the Association for Computational Linguistics (Volume 1: Long Papers), pages 1619–1635, Toronto, Canada. Association for Computational Linguistics.
- Webson and Pavlick (2022) Albert Webson and Ellie Pavlick. 2022. Do Prompt-Based Models Really Understand the Meaning of Their Prompts? In Proceedings of the 2022 Conference of the North American Chapter of the Association for Computational Linguistics: Human Language Technologies, pages 2300–2344, Seattle, United States. Association for Computational Linguistics.
- Wiegreffe et al. (2022) Sarah Wiegreffe, Jack Hessel, Swabha Swayamdipta, Mark Riedl, and Yejin Choi. 2022. Reframing Human-AI Collaboration for Generating Free-Text Explanations. In Proceedings of the 2022 Conference of the North American Chapter of the Association for Computational Linguistics: Human Language Technologies, pages 632–658, Seattle, United States. Association for Computational Linguistics.
- Wiegreffe and Marasović (2021) Sarah Wiegreffe and Ana Marasović. 2021. Teach Me to Explain: A Review of Datasets for Explainable Natural Language Processing.
Appendix A Dataset Statistics
A.1 Data Sources
Table 2 shows a breakdown of the samples in the test set per source dataset as described in Section 2.2.
| Dataset | #samples |
| COPA-SSE (best & worst) | 250 + 250 |
| + fluency fix | 250 |
| Generated (BCOPA) | 500 |
| Crowdsourced (BCOPA) | 500 |
| CoS-E | 500 |
| + fluency fix | 250 |
| Generated (CommonsenseQA) | 500 |
| ECQA | 500 |
| Total | 3,500 |
A.2 Data Examples
A.3 Label Distributions
| -1 | 0 | 1 | 2 | 3 | 4 | 5 | |
| Supp. | 11% | 32% | 31% | 8% | 9% | 8% | |
| Ovr. | 11% | 14% | 30% | 35% | 10% | ||
| Well-wr. | 28% | 72% | |||||
| Rel. | 7% | 93% | |||||
| Fact. | 12% | 4% | 85% | ||||
| New i. | 19% | 46% | 33% | 2% | |||
| Unn. i. | 17% | 83% | |||||
| Contr. | 58% | 42% |
Table 3 shows the label distributions of each criterion in our test set. Scalar aspects (overall rating, new information) are bucketed. ‘-1’ labels represent None for supports and N/A for factual.
Appendix B Explanation Rating Annotation
Our crowdsourcing protocol for label collection consisted of three phases: qualification rounds, trial rounds, and main collection rounds. We provided detailed guidelines showing general instructions, detailed information on each criterion and their respective labels, three examples, and a FAQ section based on questions we received from workers. The full document is available upon request to the first author.
Qualifications
In the qualification rounds, we curated a question set of 6 explanations and manually tagged them with "acceptable" answers, focusing on overall alignment rather than exact matches. We included a dummy question with strict instructions for filtering. Out of 700 participants, the top 201 workers, with a match percentage of 59% or higher, proceeded to trial rounds. We addressed any concerns or clarifications through email or form feedback. We hand-picked a final group of 28 workers. Qualifications were open to workers with a HIT approval rate of 99% or more and 5,000 or more approved HITs. Note that the location requirement was removed as it was an unnecessary barrier for highly skilled and motivated workers.
Main Rounds
Payment Information
For qualifications, each worker was compensated $0.15 per HIT. For the main rounds, the fee was increased to $0.25 per HIT, roughly matching a payment of $20.00 per hour.
Appendix C Preliminary Experiment: Prompting Strategies
We compared single and compound calling, where the former prompts the model for a single criterion at a time, and the latter prompts the model for all criteria at once. We also compared default, averaged, and verbatim prompt formats, corresponding to a simple prompt with the explanation and the rating criteria, a voting mechanism over several prompt variants (described in Appendix D), and input identical to the human annotation guidelines, respectively. For single verbatim calls, only the relevant sections (guidelines and examples) for the target criterion were included. Default and averaged prompts were further compared in zero-shot and three-shot settings, where the latter contained the same examples as shown in the human guidelines.
All models were most successful with verbatim compound prompting, corresponding to the same guidelines as those shown to humans. Unless otherwise stated, all results presented in the main text are based on this setting.
Appendix D Prompt Variant Examples
This section shows the prompt variants used for prompt-averaged settings. Parts identical to the simple prompt are omitted and marked with ‘...’ for brevity. In few-shot settings, the initial guidelines are only shown once, followed by examples with a simple corresponding answer format, unless otherwise specified. E.g., for the simple prompt:
QUESTION: <question>
a) <answer choice>
b) <answer choice>

EXPLANATION: <explanation>

1. a
2. 2
3. no
4. yes
5. yes
6. sufficient
7. no
8. yes
D.1 Simple Prompt
A straightforward prompt outlining the evaluation criteria.
Evaluate the given explanation according to
    the following criteria:

1. Which answer does it support? (a, b, c, d, e, none)
2. Overall rating? (1, 2, 3, 4, 5)
3. Is it well-written? (no, yes)
4. Is the explanation related to the question and answers? (no, yes)
5. Are all contained facts correct? (N/A, no, yes)
6. How much new information is given? (none, some, sufficient, ample)
7. Any unnecessary information? (no, yes)
8. Is it contrastive? (no, yes)

QUESTION: <question>
a) <answer choice>
b) <answer choice>

EXPLANATION: <explanation>
D.2 Shuffled Criteria Prompt
This prompt uses the same wording as the simple prompt but asks for ratings in a shuffled order.
Evaluate the given ...

1. How much new information is given? (none, some, sufficient, ample)
2. Is it contrastive? (no, yes)
3. Is the explanation related to the question and answers? (no, yes)
4. Is it well-written? (no, yes)
5. Overall rating? (1, 2, 3, 4, 5)
6. Which answer does it support? (a, b, c, d, e, none)
7. Are all contained facts correct? (N/A, no, yes)
8. Any unnecessary information? (no, yes)

QUESTION: ...
D.3 Slightly Paraphrased Prompt
This prompt slightly differs from the simple prompt in wording choice.
Evaluate the given explanation based on these criteria:

1. Which answer does it support? (a, b, c, d, e, none)
2. Rate the overall explanation (1, 2, 3, 4, 5)
3. Is it well-written? (no, yes)
4. Is the explanation relevant to the question and answers?  (no, yes)
5. Are all provided facts accurate? (N/A, no, yes)
6. How much new information is given? (none, some, sufficient, ample)
7. Does it contain unnecessary information? (no, yes)
8. Is it contrastive? (no, yes)

QUESTION: ...
D.4 Verbose Prompt
Here, the rating questions are more elaborated, but without adding more information compared to the other prompts.
Evaluate the explanation provided based on the following criteria:

1. Which answer choice does the explanation support? (a, b, c, d, e, none)
2. Rate the overall quality of the explanation. (1, 2, 3, 4, 5)
3. Is the explanation well-written? (no, yes)
4. Is the explanation related to the question and answer choices? (no, yes)
5. Verify the accuracy of all facts, if any, mentioned in the explanation. (N/A, no, yes)
6. How much new information is given in the explanation? (none, some, sufficient, ample)
7. Does the explanation contain any unnecessary information? (no, yes)
8. Is the explanation contrastive? (no, yes)

QUESTION: ...
D.5 Repeated Instructions Prompt
This prompt is identical to the simple prompt except for the example formatting. Instead of showing simple successions of questions, explanations, and ratings, the full instructions are repeated every time.
D.6 Swapped Instructions Prompt
The wording is the same as the simple prompt, but the order in which the instructions are presented is swapped. I.e., the example is shown first, then the general instruction text, followed by the rating questions. Similarly to the repeated instructions prompt (§D.5), the full instructions are repeated every time.
QUESTION: ...

EXPLANATION: ...

Evaluate the given explanation according to the following criteria:

1. Which answer does ...
Appendix E Crowdsourced Explanations for BCOPA
As a supplement to COPA-SSE, We collected 3,000 hand-written, detailed, and contrastive explanations for BCOPA. All crowdsourcing was conducted on the Amazon Mechanical Turk platform.666https://requester.mturk.com/ Generally, we found that strict qualifications, hand-picking the final worker pool, and maintaining open communication led to a significant increase in data quality.
Qualifications
In the qualification rounds, workers were asked to write three explanations for an explanation, its mirrored sample,777With the same answer choices but a different question that makes the alternative correct. and another random explanation. 397 workers were hand-picked and whitelisted for further rounds based on the quality of their responses. We limited participation in this qualification to workers with a HIT approval rate of 99% or more, 1,000 or more approved HITs, and located in Great Britain or the United States.
Main Rounds
The workers were explicitly instructed to write contrastive explanations which “focus on what the key difference between the options is, and how it leads to it being the correct choice in one case and not in the other.” This instruction was inspired by insights from Miller (2017). Figure 6 shows the crowdsourcing form. We collected two explanations per BCOPA question, totaling 3,000 explanations. Out of these, a random sample of 500 explanations was rated and included in our test set. Example explanations can be seen in Appendix A.2.
Payment Information
For qualifications, each participating worker was compensated $0.10 per HIT. For the main rounds, the fee was increased to $0.89 per HIT, roughly matching a payment of $20.00 per hour.
| CoS-E (best) Which effect of stress could cause death if not treated immediately? a) age grieving person b) heart attacks c) depression d) hair loss e) headache Explanation: heart attacks can stop your heart from properly pumping blood, thus leading to death. | Overall: | 4.4 | Well-written: | Yes |
| Supports: | b) | Related: | Yes | |
| Factual: | Yes | |||
| New info: | 1.8 | |||
| Unn. info: | No | |||
| Contrastive: | No | |||
| CoS-E (worst) The college kids weren’t known for their apartment decor choices, they used a folding chair inside their what? a) bathroom b) closet c) school d) room e) church Explanation: after years of being held captive in an isolated | Overall: | 1.0 | Well-written: | No |
| Supports: | none | Related: | No | |
| Factual: | N/A | |||
| New info: | 0.2 | |||
| Unn. info: | Yes | |||
| Contrastive: | No | |||
| CoS-E + fluency fixed (best) What kind of driving leads to accidents? a) stressful b) dangerous c) fun d) illegal e) deadly Explanation: Driving dangerously creates accidents. | Overall: | 4.0 | Well-written: | Yes |
| Supports: | b) | Related: | Yes | |
| Factual: | Yes | |||
| New info: | 0.6 | |||
| Unn. info: | No | |||
| Contrastive: | No | |||
| CoS-E + fluency fixed (worst) What is a grumpy person likely to have? a) headache b) understand themselves c) compliments d) own house e) happiness Explanation: A peculiar person. | Overall: | 1.0 | Well-written: | No |
| Supports: | None | Related: | No | |
| Factual: | N/A | |||
| New info: | 0.2 | |||
| Unn. info: | Yes | |||
| Contrastive: | No | |||
| Generated (best) The cloth’s are not yet placed where they belong, where should we put them? a) linen closet b) kitchen c) on the space heater d) fabric store e) bedroom Explanation: linen closets are typically used to store items such as cloths. | Overall: | 4.8 | Well-written: | Yes |
| Supports: | a) | Related: | Yes | |
| Factual: | Yes | |||
| New info: | 1.4 | |||
| Unn. info: | No | |||
| Contrastive: | No | |||
| Generated (worst) Sarah opened his chest and found a second heart. Her patient might not be what? a) istanbul b) animal c) antique shop d) human being e) bedroom Explanation: a human being is the only creature known to have two hearts. | Overall: | 1.2 | Well-written: | Yes |
| Supports: | d) | Related: | Yes | |
| Factual: | No | |||
| New info: | 0.8 | |||
| Unn. info: | No | |||
| Contrastive: | No | |||
| ECQA (best) Where would one find a captive monkey? a) rain forest b) tree tops c) toy store d) zoological gardens e) great outdoors Explanation: A monkey can be kept captive at a zoological garden as many animals are kept there for people to see. All the other options are incorrect as they do not have captive monkeys. | Overall: | 4.6 | Well-written: | Yes |
| Supports: | c) | Related: | Yes | |
| Factual: | Yes | |||
| New info: | 1.8 | |||
| Unn. info: | No | |||
| Contrastive: | Yes | |||
| ECQA (worst) Where are there lots of seats placed in rows surrounding a court? a) show b) auditorium c) movies d) soccer stadium e) hockey game Explanation: In auditorium, there are lots of seats placed in rows. Auditorium seats are surrounding a court. In show, there are no surrounding court placement of seats. Movies is not a place. In soccer stadium, seats are not placed in rows. In hockey game, there are no proper seats. | Overall: | 1.6 | Well-written: | No |
| Supports: | b) | Related: | Yes | |
| Factual: | No | |||
| New info: | 1.0 | |||
| Unn. info: | No | |||
| Contrastive: | Yes |
|
COPA-SSE (best)
The vehicles travelled slowly. What was the cause of this? a) It was foggy.
b) It was cloudy. Explanation: Fog is a thick mist which prevents you from driving quickly as you cannot see far in front of your vehicle. Driving slow through is motivated by the desire not to crash. |
Overall: | 4.8 | Well-written: | Yes |
| Supports: | a) | Related: | Yes | |
| Factual: | Yes | |||
| New info: | 2.0 | |||
| Unn. info: | No | |||
| Contrastive: | No | |||
|
COPA-SSE (worst)
The boy found the television show interesting. What happened as a result? a) He shut it off.
b) He recorded it. Explanation: The result causes the record shut off. |
Overall: | 1.0 | Well-written: | No |
| Supports: | None | Related: | Yes | |
| Factual: | N/A | |||
| New info: | 0.4 | |||
| Unn. info: | Yes | |||
| Contrastive: | No | |||
|
COPA-SSE + Fluency fixed (best)
The woman tolerated her friend’s difficult behavior. What was the cause of this? a) The woman knew her friend was going through a hard time.
b) The woman felt that her friend took advantage of her kindness. Explanation: Going through a hard time can cause people to act in a difficult way. A friend can be motivated to support their friend when they’re having a tough time. |
Overall: | 4.8 | Well-written: | Yes |
| Supports: | a) | Related: | Yes | |
| Factual: | Yes | |||
| New info: | 2.2 | |||
| Unn. info: | No | |||
| Contrastive: | No | |||
|
COPA-SSE + Fluency fixed (worst)
The shirt did not have a hole anymore. What was the cause of this? a) I patched the shirt.
b) I bleached the shirt. Explanation: I desire to look good. |
Overall: | 1.0 | Well-written: | No |
| Supports: | None | Related: | No | |
| Factual: | N/A | |||
| New info: | 0.2 | |||
| Unn. info: | Yes | |||
| Contrastive: | No | |||
|
Generated (best)
The boy was struggling to fall asleep. What was the cause of this? a) He turned on his nightlight.
b) He watched a horror movie. Explanation: Watching a horror movie can create fear and anxiety that can make it difficult for someone to fall asleep. The nightlight is not likely to be the cause since it is meant to help someone sleep. |
Overall: | 5.0 | Well-written: | Yes |
| Supports: | b) | Related: | Yes | |
| Factual: | Yes | |||
| New info: | 2.4 | |||
| Unn. info: | No | |||
| Contrastive: | Yes | |||
|
Generated (worst)
The woman awakened. What was the cause of this? a) She took sleeping pills.
b) Her husband was snoring. Explanation: Taking sleeping pills is a direct cause of awakening, whereas a husband snoring is an indirect cause. |
Overall: | 1.6 | Well-written: | Yes |
| Supports: | a) | Related: | Yes | |
| Factual: | No | |||
| New info: | 1.4 | |||
| Unn. info: | No | |||
| Contrastive: | Yes | |||
|
Crowdsourced (best)
The man was bitten by mosquitoes. What was the cause of this? a) He fell asleep on his couch.
b) He went camping in the woods. Explanation: Sleeping on a couch would mean you are indoors where there are rarely mosquitoes. Mosquitoes are prevalent in wooded areas, so the man would be more likely to be camping in the woods if he was bit by mosquitoes. |
Overall: | 5.0 | Well-written: | Yes |
| Supports: | b) | Related: | Yes | |
| Factual: | Yes | |||
| New info: | 3.0 | |||
| Unn. info: | No | |||
| Contrastive: | Yes | |||
|
Crowdsourced (worst)
I refilled my water bottle. What was the cause of this? a) I drank all the water in it.
b) I kept it in the fridge. Explanation: If you kept your water in the fridge, it would not need to be refilled. |
Overall: | 2.2 | Well-written: | Yes |
| Supports: | a) | Related: | Yes | |
| Factual: | Yes | |||
| New info: | 1.0 | |||
| Unn. info: | No | |||
| Contrastive: | Yes |