Stellar Population near NGC 2021: Procession of Star Formation in the South Rim of Supergiant Shell LMC 4
Abstract
Supergiant shells (SGSs) are the largest interstellar structures where heated and enriched gas flows into the host galaxy’s halo. The SGSs in the Large Magellanic Cloud (LMC) are so close that their stars can be resolved with ground-based telescopes to allow studies of star formation history. Aiming to study the star formation history and energy budget of LMC 4, we have conducted a pilot study of the cluster NGC 2021 and the OB associations in its vicinity near the south rim of LMC 4. We use the Magellanic Cloud Photometric Survey data of the LMC to establish a methodology to examine the stellar population and assess the massive star formation history. We find a radial procession of massive star formation from the northwest part of the OB association LH79 through NGC 2021 to the OB association LH78 in the south. Using the stellar content of NGC 2021 and the assumption of Salpeter’s initial mass function, we estimate that 4 supernovae have occurred in NGC 2021, injecting at least ergs of kinetic energy into the interior of LMC 4.
1 Introduction
Supergiant shells (SGSs) are the largest interstellar structures excavated by stellar energy feedback in a galaxy. Their sizes, 1000 pc, are usually greater than the scale height of the gaseous disk of a galaxy; thus, SGSs are sites where energies and enriched material can escape to the galactic halo. As SGSs play an important role in the global evolution of the interstellar medium (ISM), their formation mechanism and in particular their star formation history (SFH) are of great interest.
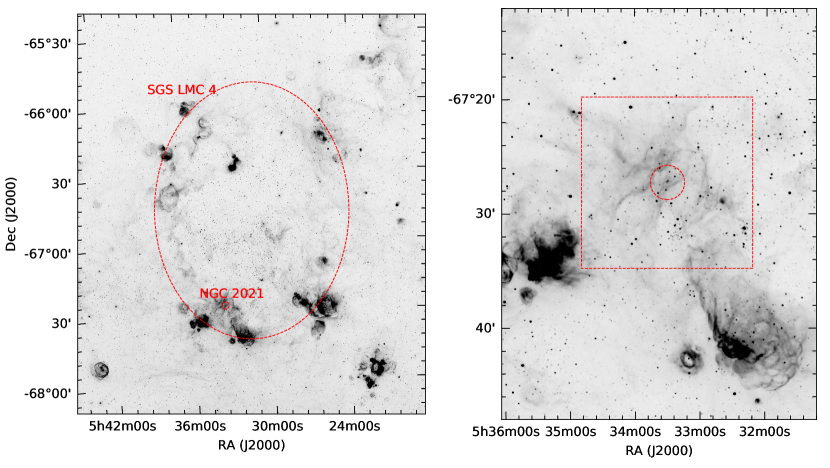
Nine SGSs in the Large Magellanic Cloud (LMC) have been identified in H images (Meaburn, 1980), although two of them may not be physical shells (Book et al., 2008). Among these SGSs, LMC 4 is the largest, with a dimension of 1400 pc 1000 pc (see Fig. 1). The SFH in the SGS LMC 4 is complex. Numerous clusters and OB associations are projected within LMC 4, and on-going star formation is seen in luminous H II regions along the periphery of LMC 4. The stellar populations of selected regions in LMC 4 have been studied by various investigators, for example, Shapley Constellation III (Dolphin & Hunter, 1998; Harris & Zaritsky, 2008), OB associations along the rim (Gouliermis et al., 2002) or in the interior (Olsen et al., 2001) of LMC 4. It has been suggested that stochastic self-propagating star formation in Shapley Constellation III from the center outwards is responsible for the formation of LMC 4 (Feitzinger et al., 1981; Dopita et al., 1985); however, the youngest stellar populations along the semi-major and near the semi-minor axes do not show any age gradient (Braun et al., 1997), challenging the self-propagating star formation history (Kamaya, 1998). To comprehensively investigate the origin and SFH of the SGS LMC 4, one needs to examine the stellar population inside and outside the entire LMC 4, which is made possible by the Magellanic Cloud Photometric Survey (MCPS; Zaritsky et al., 2004) and the Survey of the MAgellanic Stellar History (SMASH; Nidever et al., 2017).
The star formation history of the LMC has been studied using the ages of star clusters determined from the MCPS data (Glatt et al., 2010), Optical Gravitational Lensing Experiment II (OGLE II Udalski et al., 1997) data (Nayak et al., 2016), or Strömgren , , and images obtained with the Southern Astrophysical Research (SOAR) Telescope (Narloch et al., 2022). These studies investigated the formation history of star clusters, but did not include the field OB stars and thus did not provide a complete picture of star formation for stellar energy feedback studies.
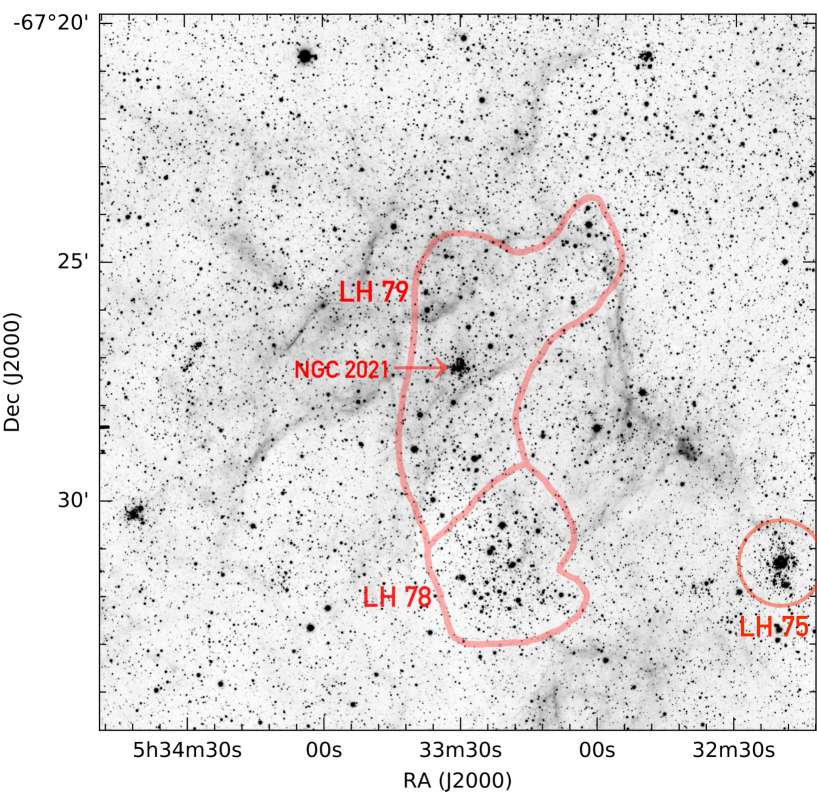
Before embarking on a thorough investigation of the SFH for the entire LMC 4, including both star clusters and field OB stars, we conduct a pilot study of the cluster NGC 2021, which is projected near the southeast rim of LMC 4 (see Fig. 1), in order to establish a methodology and assess its limitations. As shown in Figure 2, NGC 2021 is in the central region of the OB association LH79 that abuts the OB association LH78 (Lucke & Hodge, 1970). We have examined the stellar population not only in NGC 2021, LH79, and LH78, but also in the entire 15′15′ (225 pc 225 pc) field in Figure 2, and analyzed the star formation history. This paper reports our results. Section 2 describes the data and methodology we used, Section 3 reports the stellar population in NGC 2021, LH78, LH79, and the field, and Section 4 discusses the star formation history and stellar energy feedback in the region we studied.
2 Available Archival Data and Methodology
The images used in this paper include H images from the Magellanic Cloud Emission-Line Survey (MCELS; Smith & MCELS Team, 1999), and H, [S II] 6716, 6731, and band images taken with the Blanco 4m Telescope and the MOSAIC camera at Cerro Tololo Inter-American Observatory (CTIO).
The MCPS provides magnitudes of stars in the Magellanic Clouds (MCs), and the limiting magnitudes for completeness are , , , and (Zaritsky et al., 2004). As we use massive stars to diagnose star formation history and the band is more sensitive to massive stars, we use the MCPS data to make versus () color-magnitude diagrams (CMDs). We initially considered using the SMASH photometric data of stars in the LMC; however, the SMASH band photometry had not been accurately calibrated, thus we gave up the SMASH data.
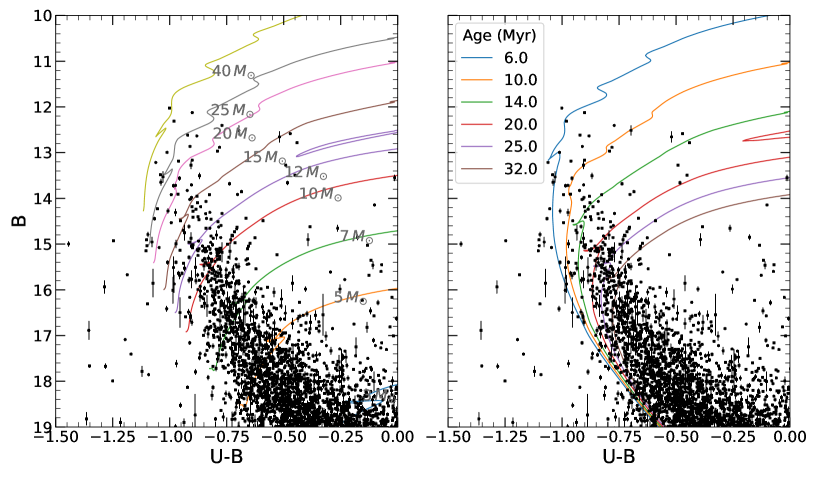
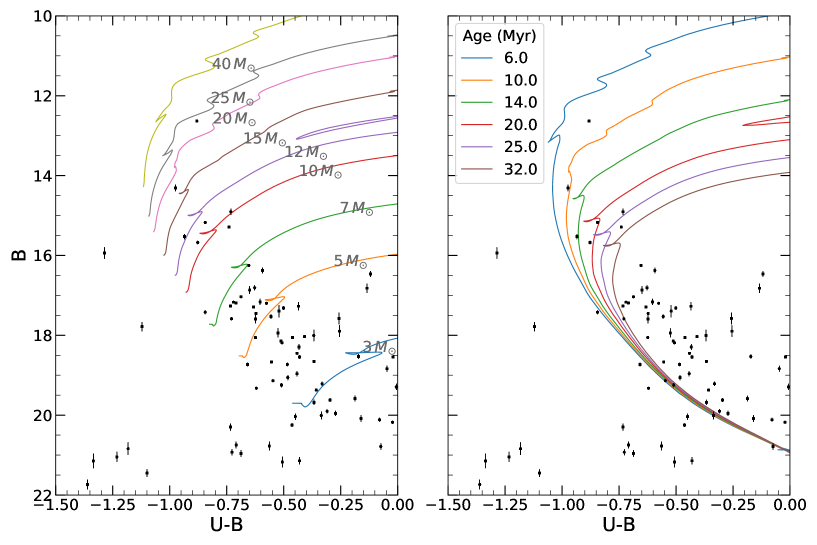
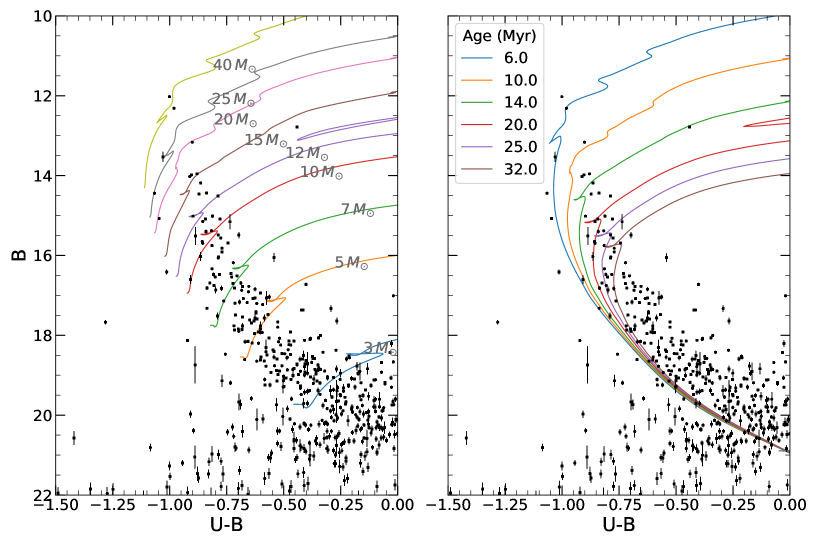
To assess the masses and ages of stars, we plot stellar evolutionary tracks and isochrones in the CMDs and compare them with the locations of stars. The stellar evolutionary tracks and isochrones are retrieved from the MESA Isochrones and Stellar Tracks project (MIST; Dotter, 2016; Choi et al., 2016). We use the rotating star models with an initial angular velocity to critical angular velocity ratio of 0.4 by default. The metallicity is set at [Fe/H] = 0.37 dex according to the average metallicity of the LMC derived from the MCPS data (Choudhury et al., 2016). The extinction of each star provided by the MCPS online extinction estimator111https://www.as.arizona.edu/~dennis/lmcext.html (Zaritsky et al., 2004) may have a large error. Thus, instead of dereddening each star, we adopt the average extinction of stars within the 15′15′ field centered on NGC 2021, , and apply it to the evolutionary tracks and isochrones. The reddened stellar evolutionary tracks of 3, 5, 7, 10, 12, 15, 20, 25, and 40 and reddened isochrones for ages of 6, 10, 14, 20, 25, and 32 Myr are plotted in the CMDs.
We use the evolutionary tracks to diagnose massive main-sequence (MS) stars. As the photometry is not sensitive to the very massive stars, we only use the evolutionary tracks to coarsely classify stars into 3–5, 5–7, 7–10, 10–12, 12–15, 15–20, 20–25, and 25 bins and count the MS stars in these bins. Assuming a Salpeter initial mass function (Salpeter, 1955), we use the star counts to estimate the expected number of massive stars that have exploded as supernovae and to assess the stellar energy feedback. We also use the isochrones to assess a lower limit on the stellar populations’ ages.
The regions we have analyzed include:
(1) NGC 2021 inside a circular region of 05 radius centered at
RA = 05h33m30.12s,
Dec = 67∘27′12.9′′;
(2) an annular background region for NGC 2021 with the same center and inner and outer radii of 05 to 15;
(3) a 15-radius region in LH79 to the northwest of NGC 2021 for comparison;
(4) a 15-radius region centered on LH78; and
(5) the entire 15′15′ region of Figure 2.
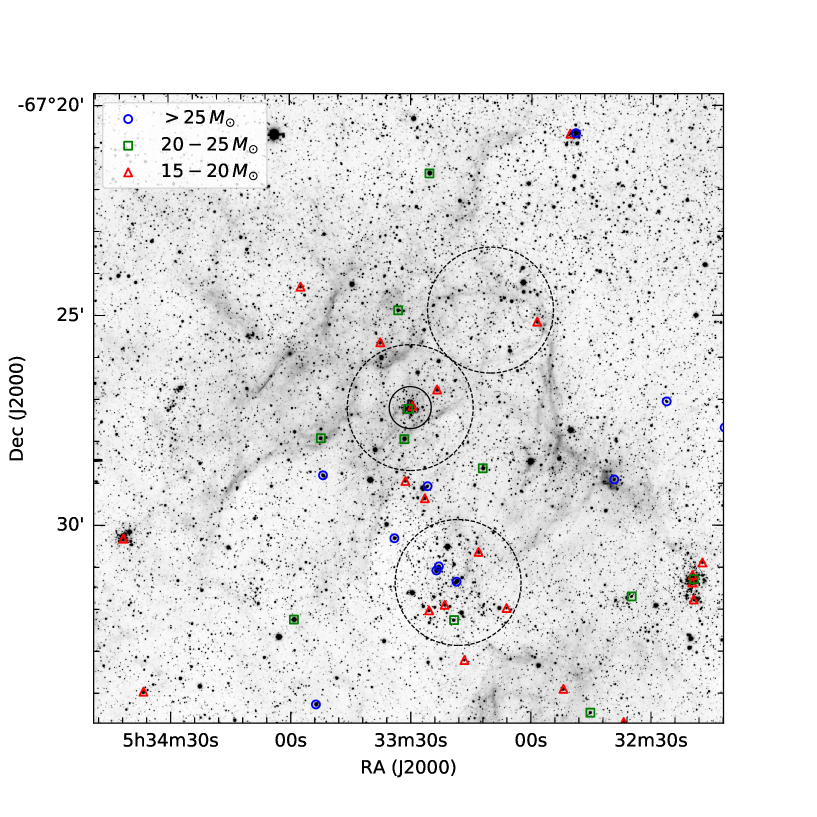
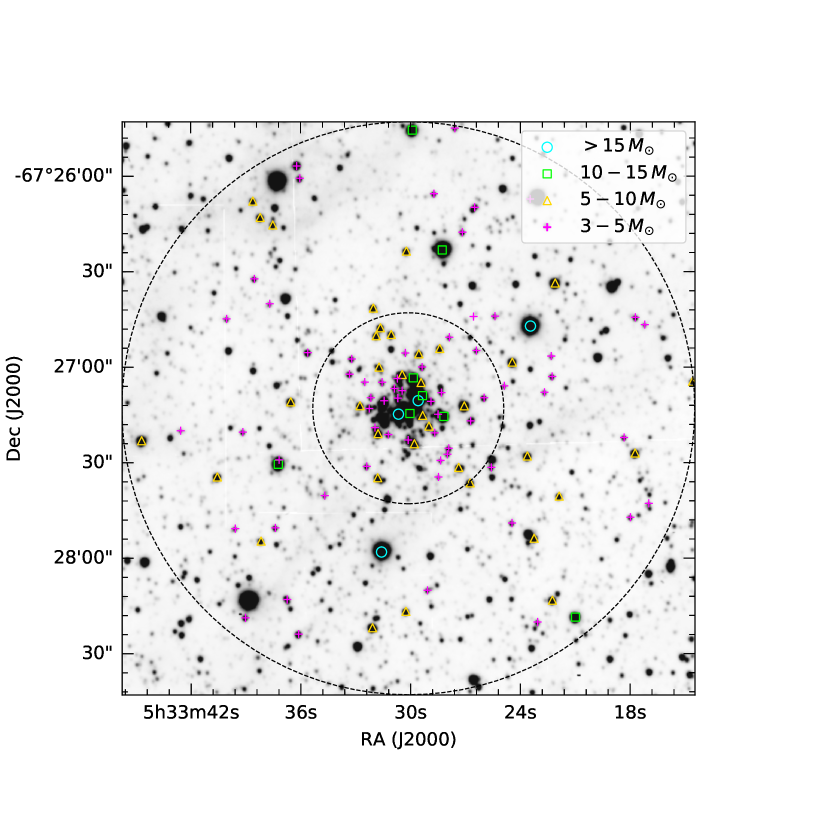
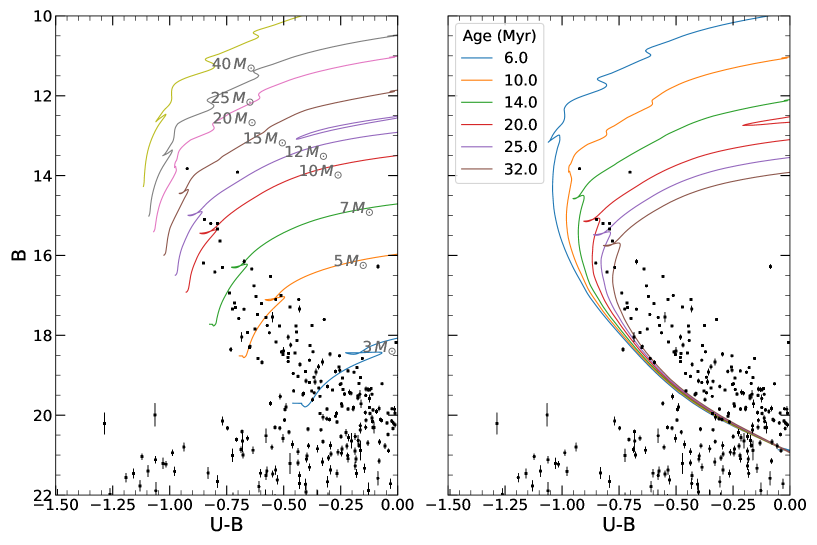
For illustration, in Figure 3 we present the CMD for Region (5), the entire 15′15′ field around NGC 2021. Comparisons between the locations of stars and the reddened stellar evolutionary tracks indicate that no MS stars more massive than 40 are present in this field. Furthermore, comparisons between stars and the reddened isochrones indicate that no burst of star formation occurred in the past 6 Myr. The MS stars identified to have masses are marked on the CTIO 4m MOSAIC [S II] image in Figure 4.
3 Stellar Population in and near NGC 2021
As shown in Figure 2, NGC 2021 is part of the OB association LH79, which is in juxtaposition to the OB association LH78. We will examine the stellar population in NGC 2021 and compare it with that of the northwest portion of LH79. We then examine LH78 and compare it with LH79, and further compare them with the 15′15′ field.
3.1 NGC 2021
To analyze the stellar population in NGC 2021, we use a circular region of 05 radius for the cluster and a concentric annular background region with radii of 05 – 15, as marked in Figure 4. The versus () CMDs of stellar population in these two regions are presented in Figures 5 and 6, respectively. The reddened stellar evolutionary tracks are overplotted in the left panel and the reddened isochrones in the right panel. The CMD of NGC 2021 does not show any MS stars with initial masses 25 ; furthermore, comparisons with the isochrones indicate that NGC 2021 is older than 6 Myr, but not much older than 10 Myr. The CMD of the background region shows a similar behavior, and thus a similar age. These results are consistent with the determination of 0-10 Myr age group for NGC 2021 based on integrated photometry (Bica et al., 1996).
To determine the mass function of NGC 2021, we use the stellar evolutionary tracks to guide the star counts in stellar mass bins of 3–5, 5–7, 7–10, 10–12, and 12 . The star counts in the annular background region are scaled by a factor of 0.52/(1.52-0.52) to account for the surface area difference and subtracted from the star counts in the cluster region to produce the background-subtracted cluster mass function in Table 1.
Stars with initial mass estimates are marked in Figure 7.
3.2 LH79-NW
The stellar population in the northwest part of LH79 is sampled within a 15-radius region, as marked in Figure 4. The CMDs of LH79-NW overlaid with reddened stellar evolutionary tracks and isochrones are presented in Figure 8. No stars with masses 20 are seen, and comparisons with the isochrones indicate the massive stars are older than 15 Myr, with an uncertainty of a few Myr.
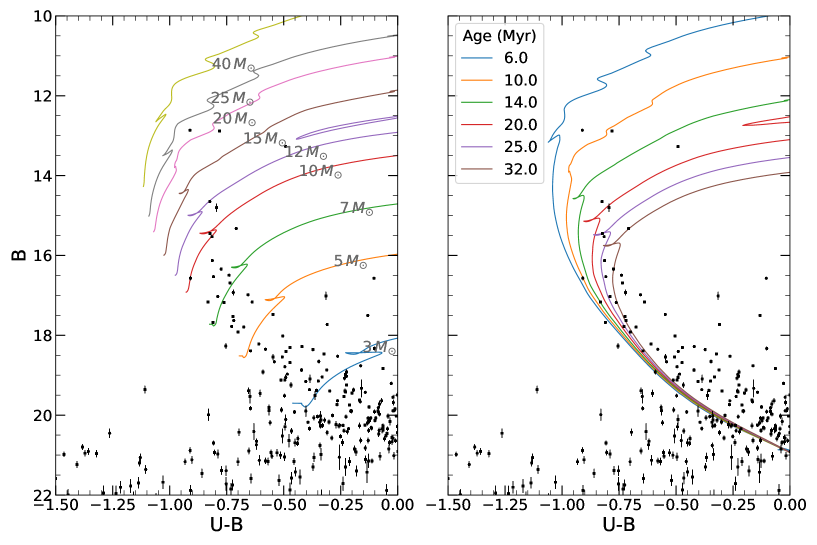
3.3 LH78
The stars in LH78 are also sampled within a 15-radius region, as marked in Figure 4. The CMDs of LH78 overlaid with reddened stellar evolutionary tracks and isochrones are presented in Figure 9. LH78 has many bright stars, and its CMD shows a MS populated up to 25 and even evolved higher-mass stars may be present. Comparisons with isochrones indicate that the massive stars are younger than 6 Myr.
4 Discussions
4.1 Procession of Star Formation near NGC 2021
The final goal of this work is to probe the formation mechanism of the SGS LMC 4, and the specific process tested here is whether star formation has proceeded radially outward. The star formation history analyzed in Section 3 show that the massive stars in LH79-NW are older than 15 Myr, NGC 2021 6–10 Myr old, and LH78 younger than 6 Myr. The sequence of LH79-NW NGC 2021 LH78 is not only an age sequence from old to young, but also a radially outward positional sequence. Over this length span of about 120 pc, recent star formation does seem to have proceeded radially outward.
To examine the distribution of massive stars in a larger field around NGC 2021, we have selected the most massive stars ( ) from the CMD of the 15′15′ field (Fig. 3) and marked them in the image in Figure 4. It is apparent that stars more massive than 25 are absent in LH79-NW and NGC 2021, but are present in the south end of LH79 and continue into LH78. The locations of these massive stars are consistent with the procession of star formation southward, roughly in the radial direction near the south rim of LMC-4.
4.2 Stellar Energy Injected by NGC 2021 into the SGS LMC 4
The mechanical energy injected by NGC 2021 into the interior of SGS LMC 4 can be assessed from its stellar content. The background-subtracted star counts in different mass ranges listed in Table 1 represent the present-day mass function (PDMF). We assume the Salpeter (1955) initial mass function (IMF) , where is the initial stellar mass and is a scaling factor. This scaling factor can be determined from the unevolved low-mass stars in the PDMF. The difference between the number of stars with initial masses 10 observed in the PDMF and that expected from the IMF is the number of massive stars that have exploded as supernovae.
First we test whether the numbers of low-mass stars follow the Salpeter IMF. Denoting the star counts in the initial mass range to as , the Salpeter IMF requires the ratio of star counts in the – and – ranges to be . The observed number ratio of and stars from the observed PDMF is 0.543, which is only off the ratio 0.612 expected from the Salpeter IMF. We consider these are in reasonable agreement. Then we use the number of stars and the Salpeter IMF to scale the numbers of massive stars (> ). As a result, the expected number of stars with initial masses is 9.3, which is 4.05 larger than the number 5.25 derived from the observed data. This result implies that 4 massive stars in NGC 2021 have exploded as supernovae. Assuming a canonical explosion energy of 1051 ergs, NGC 2021 has injected ergs of mechanical energy into the SGS LMC 4. The energy may double, if the mechanical energy of the fast stellar winds are included.
| Initial mass () | |||
|---|---|---|---|
| 3-5 | 29 | 35 | 24.625 |
| 5-7 | 14 | 10 | 12.75 |
| 7-10 | 2 | 11 | 0.625 |
| 10-12 | 3 | 3 | 2.625 |
| 12 | 3 | 3 | 2.625 |
Note. — represents the numbers of stars in the cluster NGC 2021 with a radius of 05. represents the numbers of stars in the annular background region between radii of 05 and 15. represents the background-subtracted star counts.
5 Summary and Future Plan
Interstellar gas structures with diameters approaching 1000 pc are called SGSs. As their sizes are larger than the host galaxy’s gas disk scale height, they are sites where the heated and enriched gas escapes into the galactic halo. Recent JWST images reveal that SGSs commonly exist in disk galaxies (e.g., Barnes et al., 2023).
The LMC is the only galaxy where the stars in SGSs can be resolved and analyzed with ground-based observations. The largest SGS in the LMC is LMC 4, and we intend to map its star formation history and quantitatively assess its energy budget. As a pilot study, we use the MCPS photometric data of stars in the cluster NGC 2021 and its vicinity near the south rim of LMC 4 to establish a methodology to examine the star formation history and stellar energy feedback.
NGC 2021 is in the OB association LH79. We have made CMDs and compared the locations of stars with stellar evolutionary tracks and isochrones. We find an age gradient in the massive stars consistent with a radial procession of star formation from the north end of LH79 through NGC 2021 to the OB association LH78.
Our future plan is to recruit high school teachers and students to follow the methodology we have established and analyze the massive star formation history over the entire SGS LMC 4.
References
- Barnes et al. (2023) Barnes, A. T., Watkins, E. J., Meidt, S. E., et al. 2023, ApJ, 944, L22. doi:10.3847/2041-8213/aca7b9
- Bica et al. (1996) Bica, E., Claria, J. J., Dottori, H., et al. 1996, ApJS, 102, 57. doi:10.1086/192251
- Book et al. (2008) Book, L. G., Chu, Y.-H., & Gruendl, R. A. 2008, ApJS, 175, 165. doi:10.1086/523897
- Braun et al. (1997) Braun, J. M., Bomans, D. J., Will, J.-M., et al. 1997, A&A, 328, 167
- Choi et al. (2016) Choi, J., Dotter, A., Conroy, C., et al. 2016, ApJ, 823, 102. doi:10.3847/0004-637X/823/2/102
- Choudhury et al. (2016) Choudhury, S., Subramaniam, A., & Cole, A. A. 2016, MNRAS, 455, 1855. doi:10.1093/mnras/stv2414
- Dolphin & Hunter (1998) Dolphin, A. E. & Hunter, D. A. 1998, AJ, 116, 1275. doi:10.1086/300493
- Dopita et al. (1985) Dopita, M. A., Mathewson, D. S., & Ford, V. L. 1985, ApJ, 297, 599. doi:10.1086/163556
- Dotter (2016) Dotter, A. 2016, ApJS, 222, 8. doi:10.3847/0067-0049/222/1/8
- Feitzinger et al. (1981) Feitzinger, J. V., Glassgold, A. E., Gerola, H., et al. 1981, A&A, 98, 371
- Glatt et al. (2010) Glatt, K., Grebel, E. K., & Koch, A. 2010, A&A, 517, A50. doi:10.1051/0004-6361/201014187
- Gouliermis et al. (2002) Gouliermis, D., Keller, S. C., de Boer, K. S., et al. 2002, A&A, 381, 862. doi:10.1051/0004-6361:20011469
- Harris & Zaritsky (2008) Harris, J. & Zaritsky, D. 2008, PASA, 25, 116. doi:10.1071/AS07037
- Kamaya (1998) Kamaya, H. 1998, AJ, 116, 1719. doi:10.1086/300543
- Lucke (1972) Lucke, P. B. 1972, Ph.D. Thesis
- Lucke & Hodge (1970) Lucke, P. B. & Hodge, P. W. 1970, AJ, 75, 171. doi:10.1086/110959
- Meaburn (1980) Meaburn, J. 1980, MNRAS, 192, 365. doi:10.1093/mnras/192.3.365
- Narloch et al. (2022) Narloch, W., Pietrzyński, G., Gieren, W., et al. 2022, A&A, 666, A80. doi:10.1051/0004-6361/202243378
- Nayak et al. (2016) Nayak, P. K., Subramaniam, A., Choudhury, S., et al. 2016, MNRAS, 463, 1446. doi:10.1093/mnras/stw2043
- Nidever et al. (2017) Nidever, D. L., Olsen, K., Walker, A. R., et al. 2017, AJ, 154, 199. doi:10.3847/1538-3881/aa8d1c
- Olsen et al. (2001) Olsen, K. A. G., Kim, S., & Buss, J. F. 2001, AJ, 121, 3075. doi:10.1086/321092
- Salpeter (1955) Salpeter, E. E. 1955, ApJ, 121, 161. doi:10.1086/145971
- Smith & MCELS Team (1999) Smith, R. C. & MCELS Team 1999, New Views of the Magellanic Clouds, 190, 28
- Udalski et al. (1997) Udalski, A., Kubiak, M., & Szymanski, M. 1997, Acta Astron., 47, 319. doi:10.48550/arXiv.astro-ph/9710091
- Zaritsky et al. (2004) Zaritsky, D., Harris, J., Thompson, I. B., et al. 2004, AJ, 128, 1606. doi:10.1086/423910