High Fidelity Artificial Quantum Thermal State Generation using Encoded Coherent States
Abstract
Quantum steganography is a powerful method for information security where communications between a sender and receiver are disguised as naturally occurring noise in a channel. We encoded the phase and amplitude of weak coherent laser states such that a third party monitoring the communications channel, measuring the flow of optical states through the channel, would see an amalgamation of states indistinguishable from thermal noise light. Using quantum state tomography, we experimentally reconstructed the density matrices for artificially engineered thermal states and spontaneous emission from an optical amplifier and verified a state fidelity when compared with theoretical thermal states.
1 Introduction
High fidelity quantum states are essential resources for quantum computing, communications, and sensing, as the performance of any quantum protocol or algorithm relies heavily on the capability to prepare the quantum state required for the protocol with high precision. An exciting topic in the field of optical communications has emerged understanding the fundamental quantum limits to the covertness of a communications or sensing channel when a third-party eavesdropper possesses the capabilities of quantum measurement and uses them as resources to discover whether or not communications or sensing is occurring on channel[4, 2]. Low Probability of Detect (LPD) communications involve a transmitter and receiver communicating over a channel monitored by a third party tasked with identifying the presence of communications. The objective of the transmitter and receiver is to mask the physical encoding of the communications signal such that it appears innocuous on the channel, mimicking as closely as possible the original channel statistics presented to the passive channel monitor by the noise in the channel.
Key results from quantum-based analyses of LPD communications have shown two distinct operating cases. When the sender and receiver are communicating through a channel with naturally occurring noise, equally random to all three parties, uses of a channel with additive white Gaussian noise (AWGN) results in a number of bits proportional to that can be communicated covertly. This result was proven theoretically in [4] and validated experimentally in [3]. In this case a finite number of bits can be successfully transmitted with a bounded covertness, while hte asymptotic communication rate is 0. Alternatively, when the sender and receiver are communicating through a channel with noise that can either be modulated by the sender, or the statistics of which are well known to the sender and receiver, then provably covert positive-rate communications can occur[11].
As steganography is a technique to achieve covert communications by hiding messages within seemingly benign larger messages [10], quantum steganography was originally proposed for disguising communication symbols as incoherent errors on qubits on a quantum channel [9]. Congruent with the analyses in [4] and [11] analyses for quantum steganography were conducted in a channel with and without environmental noise [12, 13]. Recently, these results were adapted to implementations using quantum states in an optical channel [1].
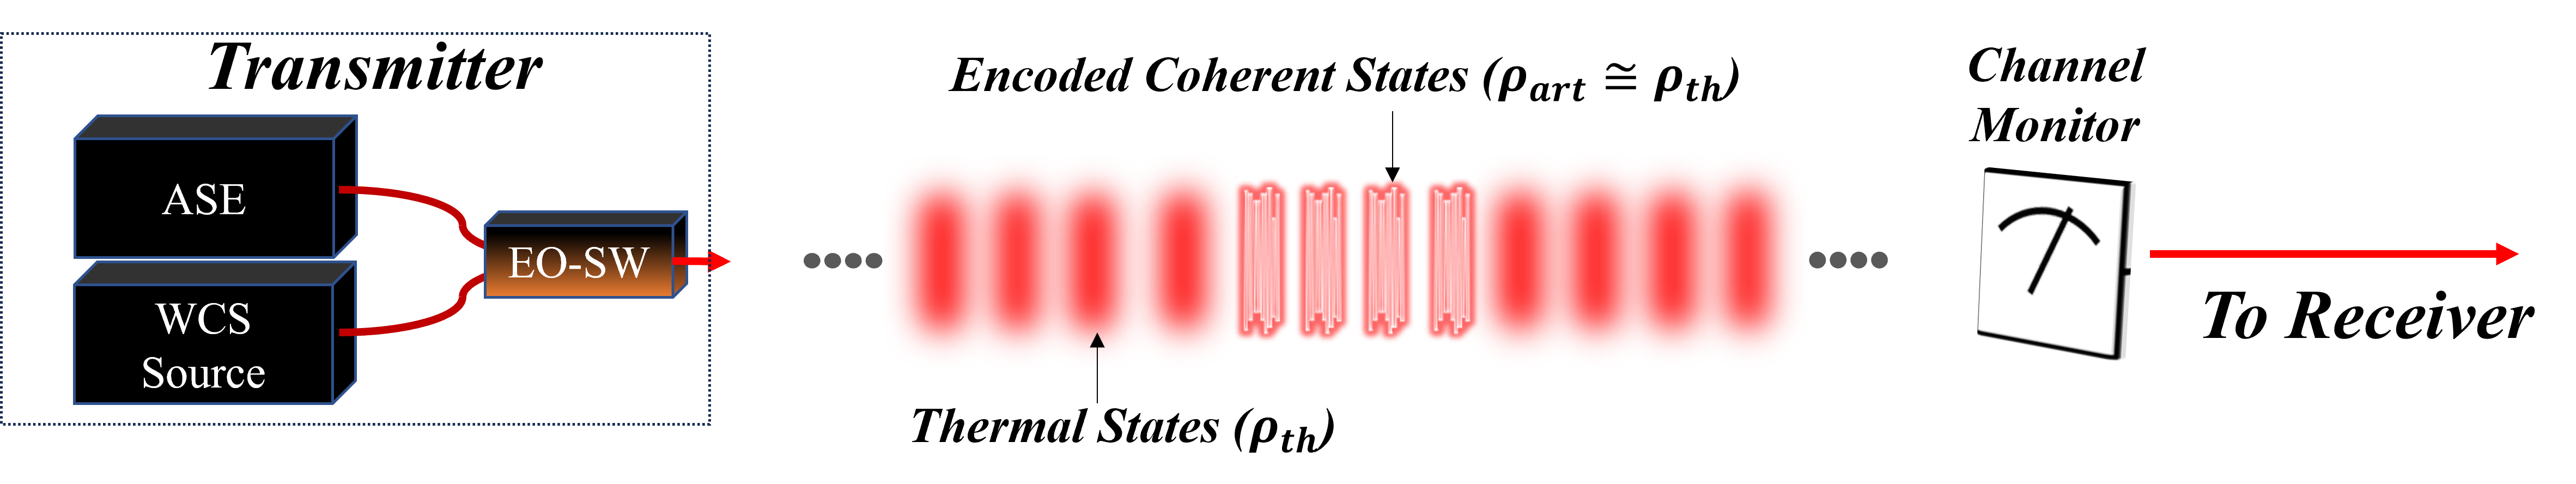
Lasers and optical amplifiers are essential ingredients in optical communications transmitters but bring the burden of broadband, amplified spontaneous emission (ASE) noise to the channel. A quantum steganography protocol for covert communications can leverage this ever-present noise by hiding a communication transmission in the noise so that, to a third-party monitoring the channel, the ASE and the communications signal are indistinguishable. In [14] authors demonstrate an optical steganography experiment where ASE noise is used as a carrier for covert information. Instead of adding a small amount of additional noise on top of already occuring noise, we propose taking a narrow band of ASE noise and fully mimicking its quantum state using coherent encoding; this process is shown in Fig. 1. This method would prevent even eavesdropper with quantum measurement capabilities from detecting communications. This band can be selected out of band from strong active laser signals, and when communications commence this narrow band ASE is filtered out of the channel and replaced with information-carrying coherent state light with coding in amplitude and phase such that the third party monitor is not alerted to any disruption in the channel, but a receiver, aware of the codebook and the arrival time of the message, can successfully decoded the information from the transmitter. The third-party channel monitor can make quantum measurements on the states passing through the channel. As these are low intensity states, however, quantum mechanics limits the amount of information that can be extracted with a single measurement or measurements over many copies of a quantum state, quantified by the Helstrom bound and the quantum Chernoff bound, respectively. In the following sections we describe our approach to tailoring optical communications symbols in coherent state amplitude and phase, following the prescription in [1], such that a sequence of measurements on the states is indistinguishable from measurements on thermal states.
In this paper, using optical fiber-based components, we report a demonstration creating a statistical mixture of weak coherent laser states closely mimicking a quantum mechanical thermal state: a maximally mixed state with Bose-Einstein distributed photon number statistics. These states were engineered to match quantum thermal states with a mean photon number photon per temporal mode from a narrow-band selection of ASE from an erbium-doped fiber amplifier. To quantitatively measure the quantum state fidelity () between our artificial thermal state () and the naturally generated thermal state () we implemented a quantum state tomography measurement system to experimentally reconstruct the density matrices ( and ) from our quantum state generator. The measurements resulted in reconstruction fidelity .
2 Theory and Numerical Results
Lasers emit quantum mechanical pure coherent states , that can be encoded with a prescribed distribution of amplitudes and phases . As shown in [1], the thermal state can be described in this phase space as in the Glauber Representation. Additionally, the coherent state basis is over-complete, so the existence of a coherent-state representation is guaranteed [7]. This is shown by the following representation of the thermal state:
| (1) |
In eq. 1 is the Fock basis, is the mean photon number in a single mode of the field and . This representation shows the thermal state can be mimicked by a coherent state with uniformly distributed , and Rayleigh distributed :
| (2) |
In practice we will be developing this mixture via a set of coherent states. These states will be sent in a filtered out section of bandwidth, previously containing real thermal states caused by spontaneous emission from a laser carrying an innocent cover message. The coherent states that make up this mixture, will have a discrete set of randomly chosen combinations of amplitudes and phases. The set of amplitudes: have elements and phases: have elements. The total discrete set will have elements. In this case our artificial quantum thermal state for each element will be represented as follows in the fock basis:
| (3) |
This leads to the resulting, mixed density matrix:
| (4) |
where is the probability of each state. In our case any combination of states will be equally probable. Meaning .
To calculate how accurately this mixture represents a thermal state we can calculate the Fidelity:
| (5) |
where denotes the trace operator and and are the reconstructed density matrices for the artificial thermal state and the actual thermal state, respectively. This number quantifies the closeness of the two matrices, with indicating the matrices are identical.
Another measure of closeness between two density matrices is given by the trace distance. The trace distance provides a quantitative measure of the distinguishability of quantum states:
| (6) |
where denotes the trace norm. The trace norm is also used to calculate the Helstrom Bound. The Helstrom Bound defines an upper bound on the minimum probability of error achievable with any measurement strategy:
| (7) |
In order to decide how many samples, , is necessary for a high fidelity reconstruction we numerically calculated Eq. 5 for different values of . In these calculations we assumed the number of discrete intensity samples, , and phase samples, , were equal. This leads to the following relationship: .
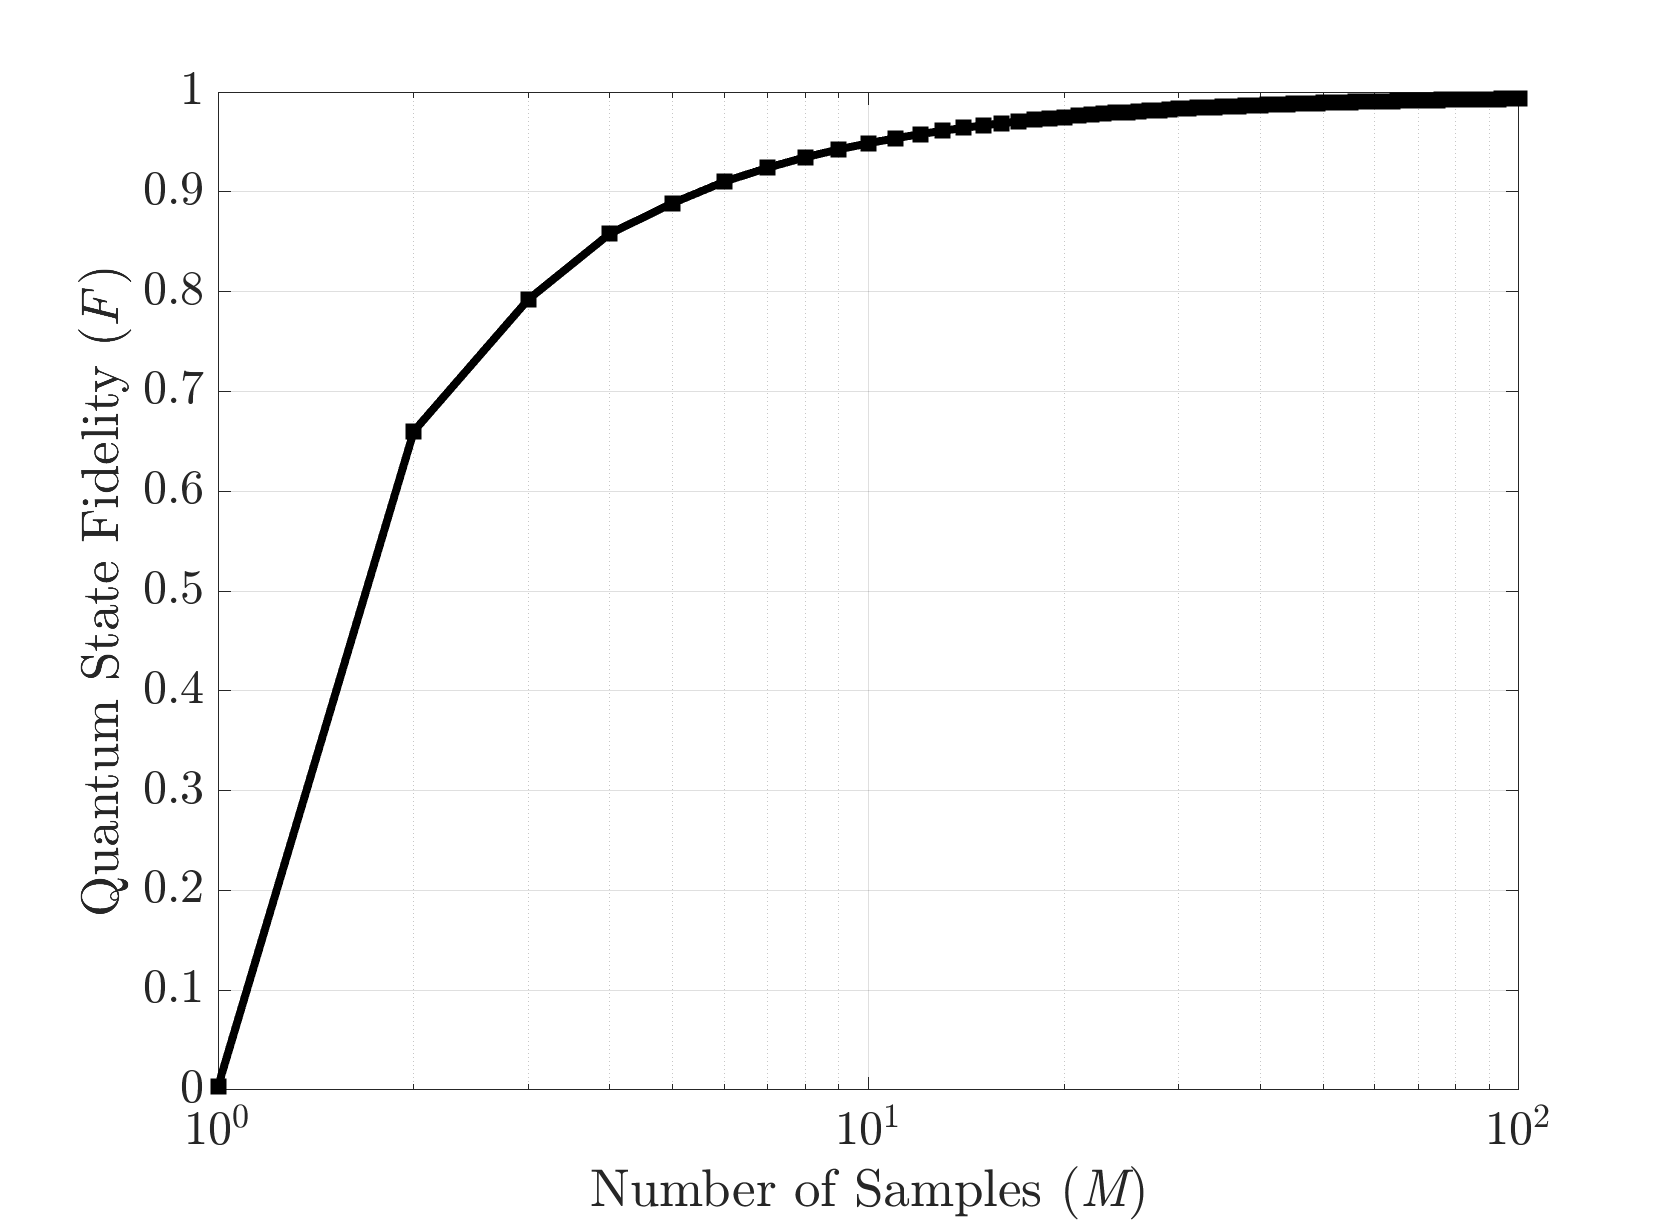
As shown in Fig. 3, a number of samples greater than 50 will yield a which has a . For this experiment we selected a number far above this. Different levels of covertness, and different communication scenarios could call for a different number of samples.
3 Experimental Design
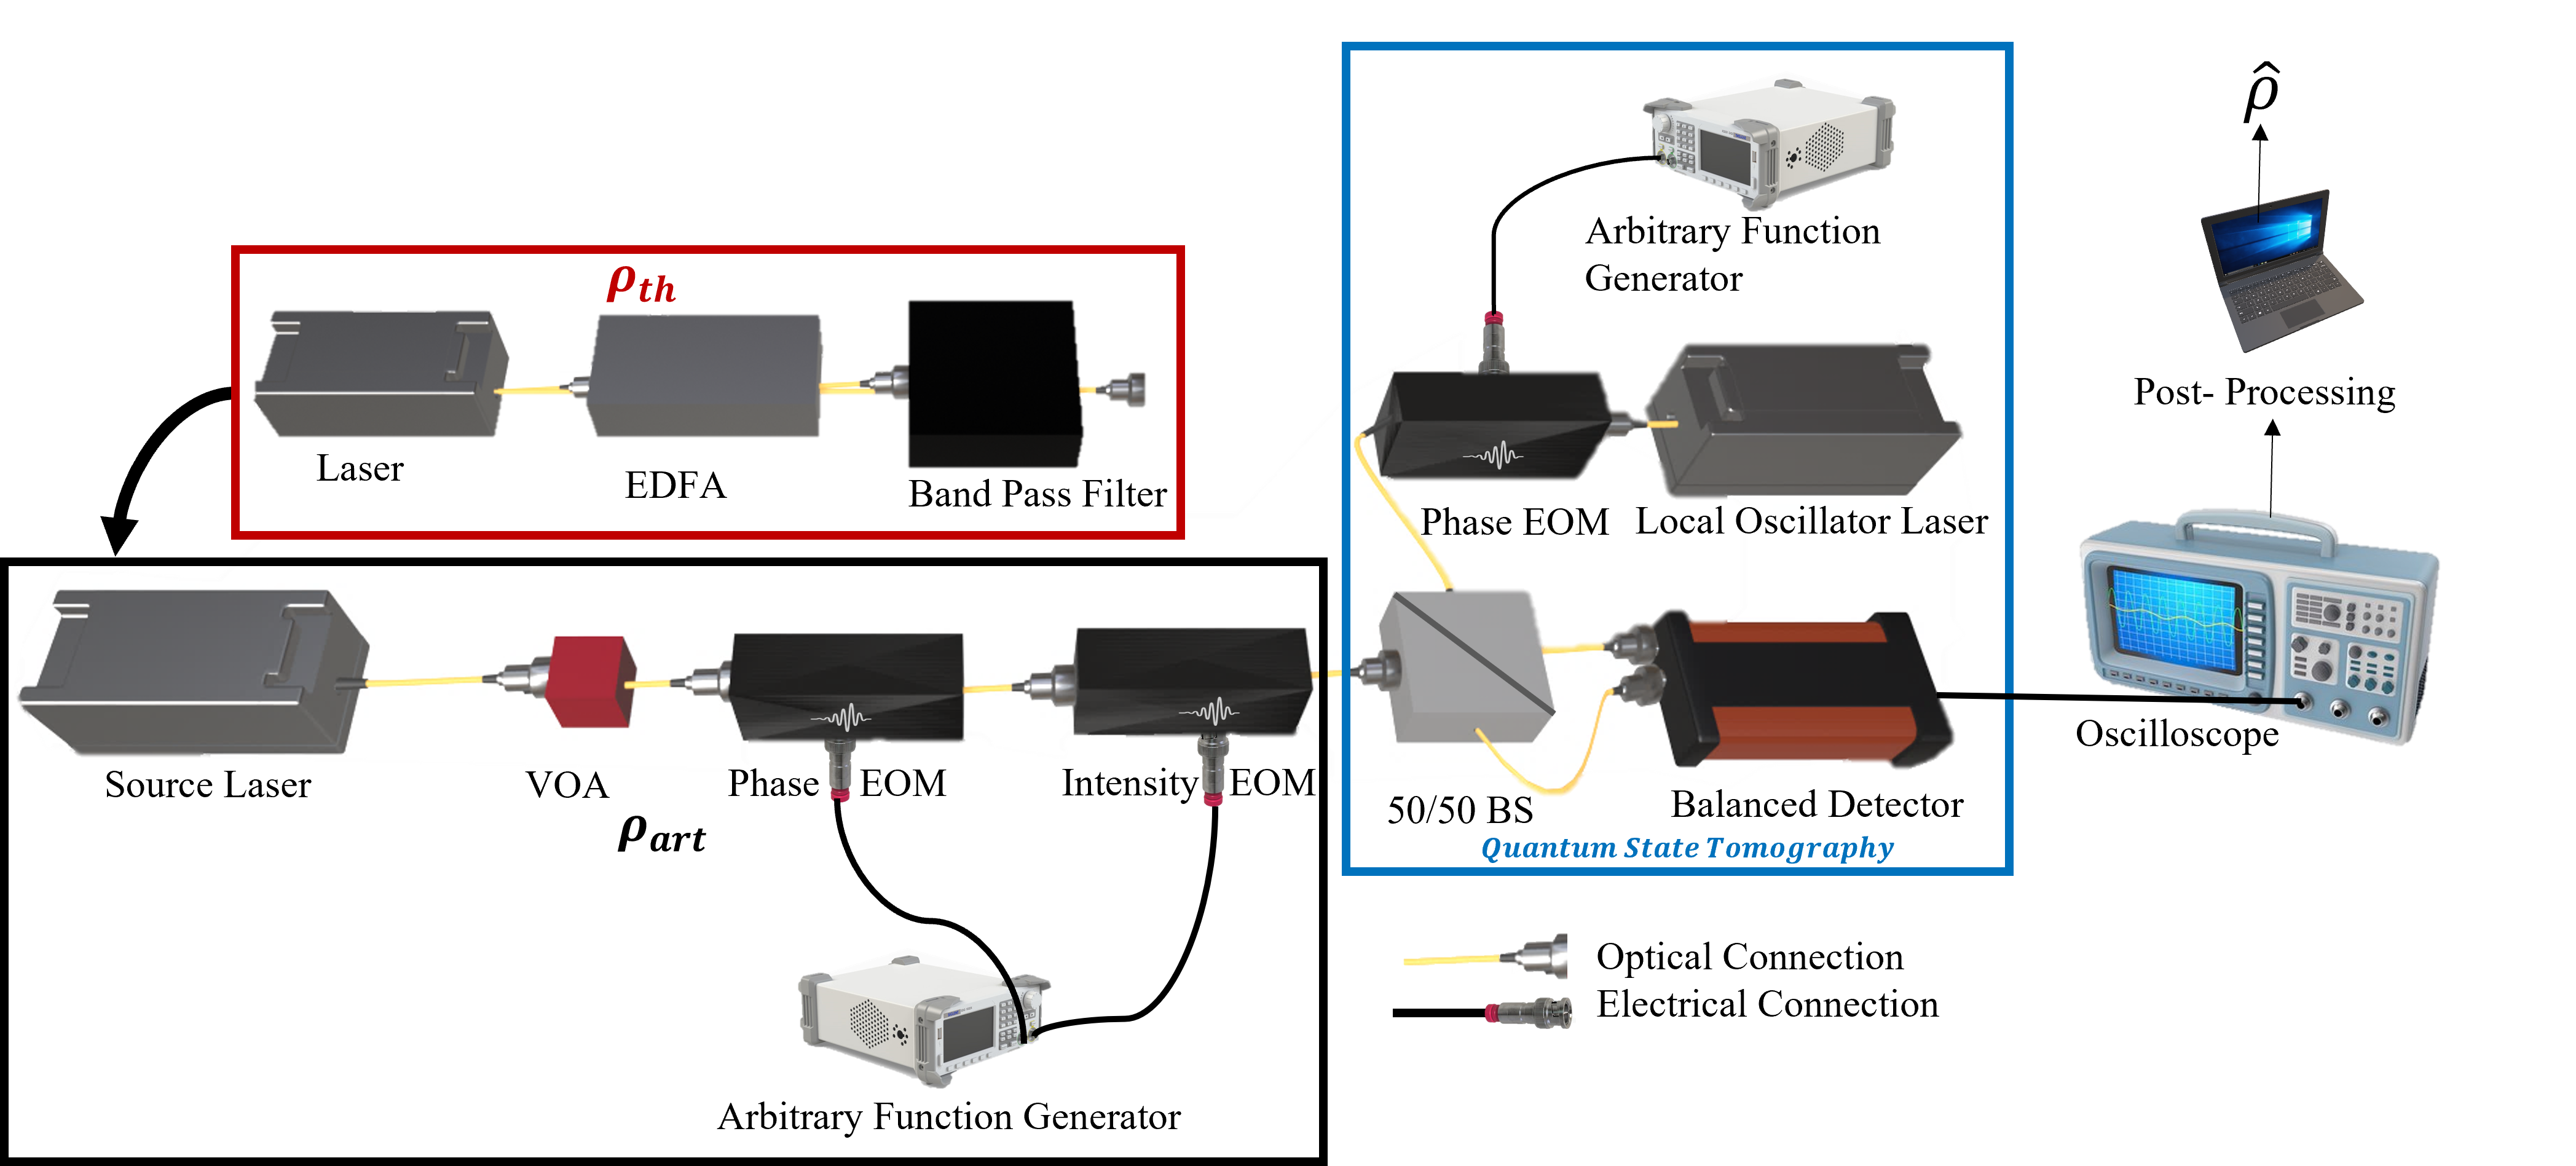
To generate the artificial thermal states, we must generate then engineer the photostatistics of coherent states. To generate the coherent states, we use a shot noise limited, low linewidth laser, the RIO Orion module at 1560.625 nm. We attenuate the laser using a manual variable optical attenuator (VOA) from Agiltron so that the mean photon number mimics the mean photon number of the desired thermal state. To engineer the photostatistics of the coherent states, electro-optic modulators (EOM) are used to impose an intensity and phase. Both EOMs are purchased from Thorlabs. The intensity EOM, part number LN81S-FC has a bandwidth of 10 GHz. This intensity EOM has a measured optical extinction ratio of 25 dB. To ensure this was enough dynamic range, we converted the discretized photon number values() shown in Fig. 3 to desired output power, , values within a 13 ns temporal mode () using Planck’s constant () and the optical frequency ():
| (8) |
We found the range of powers was well within the 25 dB dynamic range of the intensity EOM. The phase EOM, part number, LNP4216 has an operational bandwidth up to 40 GHz. This phase EOM has a low value so that within the specifications of the EOM we can take advantage of the entire 0 to 2 dynamic range. Both modulators are driven by an Arbitrary Function Generator, the Siglent SDG6052X, with a maximum operable bandwidth of 500 MHz. The phase and intensity are modulated well within these specifications. In practice, we modulate the phase and intensity at the same bandwidth of our detector, 75 MHz, in order to remain in one temporal mode. This setup is highlighted in a black box and depicted in Fig. 2. Ultimately, these intensity and phase values will be used to create a communications codebook.
To generate real thermal states, another laser with a slightly different center wavelength, also in the C-Band (1530-1565nm), is amplified by an EDFA. The laser is a diode laser from Thorlabs, part number LPS-1550-FC, and the EDFA is single mode booster from Agiltron, part number EDFA-1C2111333. A tunable bandpass filter from Newport, part number TBF-1550-1.0-FCAPC, carves out 100 GHz of thermal noise caused by ASE around the center frequency of the local oscillator as shown in Fig.2.
To perform quantum state tomography on either the real or artificial thermal states, the phase of a strong local oscillator is swept from 0 to 2 and is used to perform balanced homodyne detection. The local oscillator is generated by the same laser as the artificial thermal state. When measuring the artificial thermal state, a small portion of this laser is split off via a beamsplitter to use as the signal source. The signal source is approximately 8 orders of magnitude smaller than the local oscillator at the detector. The phase of the local oscillator is then modulated via another LNP4216, low , phase EOM. A Tektronix AFG1062 drives the phase EOM to 50 different phases between 0 and 2 for 1 ms at each phase. Quantum state tomography is implemented experimentally when the signal (real or artificial) and phase modulated local oscillator is ported through a 50/50 beamsplitter, the light is detected by two photodiodes and the resultant difference current from these photodiodes is amplified and detected by a Thorlabs PDB425C balanced detector.
The balanced detectors radio frequency output is measured at a Tektronix MDO34 oscilloscope, leading to a dataset of voltages and the corresponding phase of the local oscillator when that voltage was measured: (, ). These measurements are transformed into the measured state’s quadrature probability function by normalizing the detected variance and amplitude to a measured vacuum state, as introduced in [6]:
| (9) |
where and are the measured voltage and standard deviation when the signal input is a vacuum state. The variance of a vacuum state in balanced homodyne detection operating at the shot noise limit is , leading to the scaling factor in Eq. 9. Using the Maximum Likelihood Estimator shown in [5], we recreate the Fock basis density matrices from the measured quadrature probability functions.The likelihood function to maximize is the product of the probability density functions for each quadrature measurement given the input local oscillator phase:
| (10) |
Where is the hermite polynomial of variable of the order and is the cutoff photon number.
4 Results and Discussion
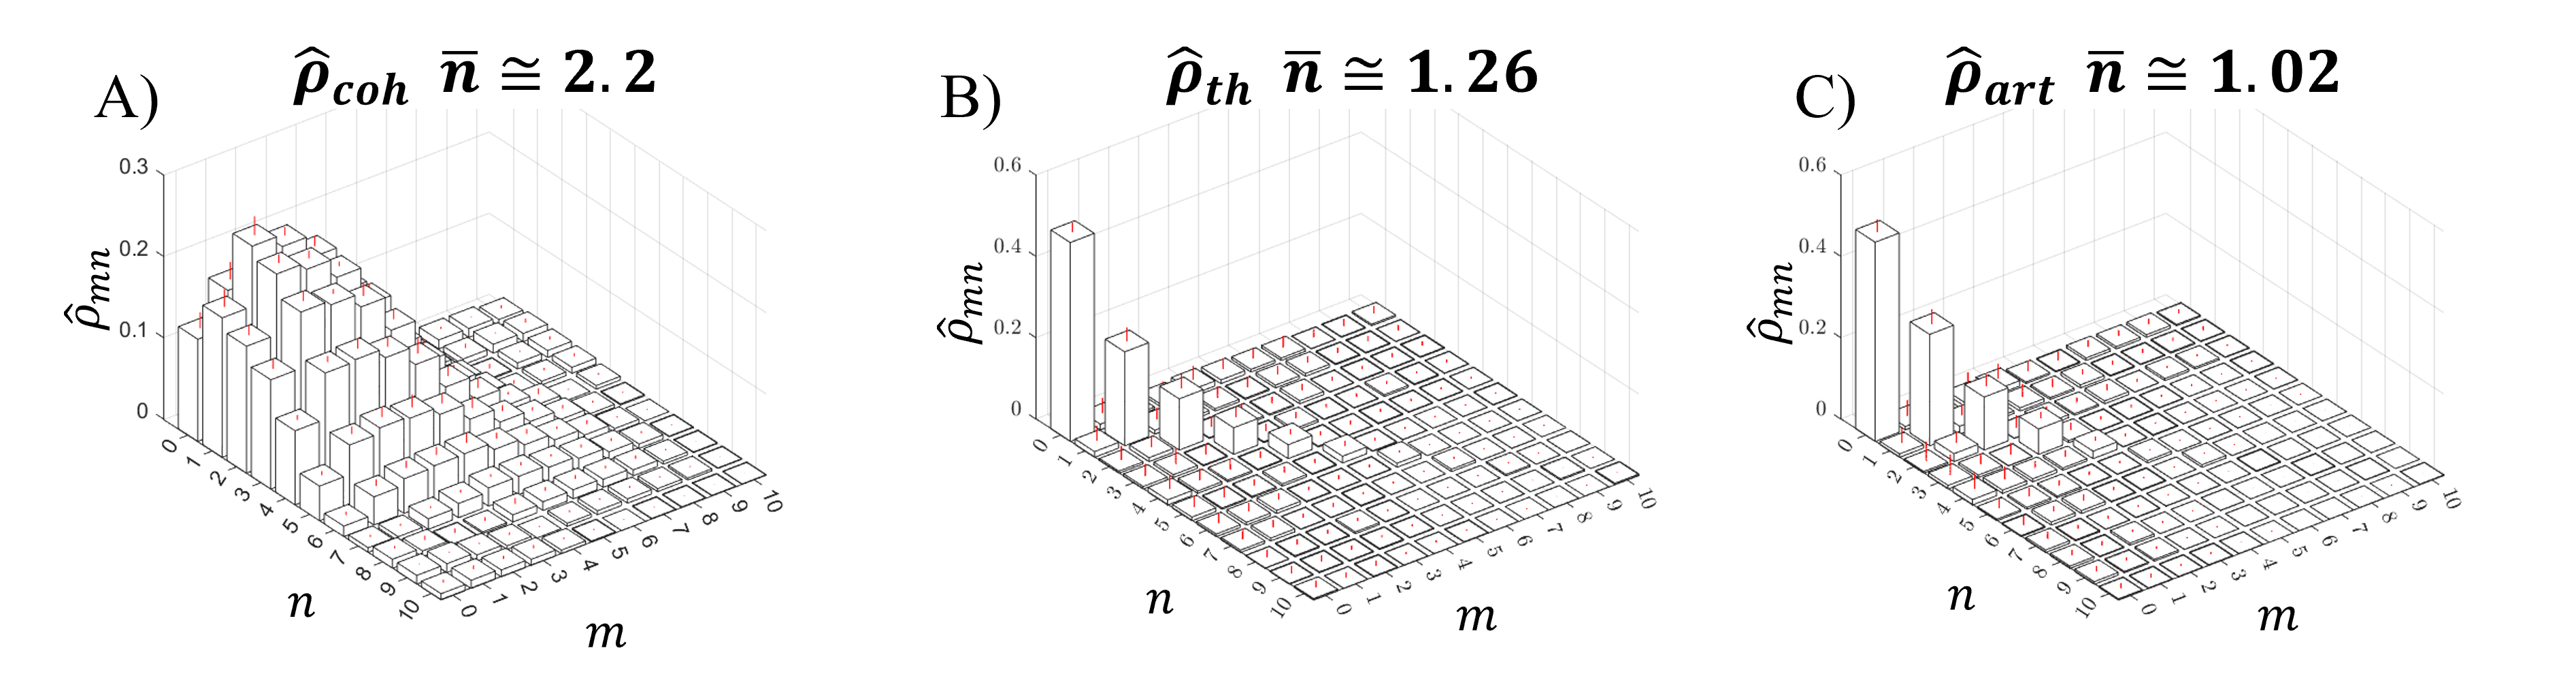
We reconstructed the coherent states(Fig. 4A), the artificially generated thermal states(Fig. 4C ) and the actual thermal states from the EDFA (Fig. 4B). Using Eq. 9 we calculated 1500 quadrature elements. Then, we averaged over 10 density matrices and plotted the resultant estimated density matrix with error bars equal to one standard deviation from these 10 density matrices. Then, we calculated the fidelity of each density matrix vs. the theoretical thermal state density matrix. The measured thermal noise and artificial thermal noise both yielded a high Fidelity:
| (11) |
We do not calculate the fidelity between the measured thermal and artificial noise states; fidelity between two reconstructed states is not reliable, since statistical noise in the measurements can produce unphysical results. Trace distance (discussed below) is more robust to such imperfections. While one can calculate a lower bound on fidelity from the trace distance, this bound is loose and hence not very informative.
Environmental fluctuations such as temperature affect the absorption and scattering of light in single mode silica based fiber optics. This can cause small fluctuations in attenuation. We measured the mean photon number within 50 microseconds for both real and artificial thermal states. We found this fluctuates for states by up to 0.5 photons. We calculated an eavesdropper ability to discriminate between two ideal thermal states when there are these small mean photon number deviations, which are expected in real world scenarios. Our measured thermal () and artificial thermal state() had a mean photon number 1.02 and 1.26 photons respectively. We calculated a trace distance and Helstrom Bound for discriminating between two ideal thermal states with the given photon numbers. We then calculated the trace distance from and for discriminating between our two measured density matrices: and . Our measured trace distance is only .011 higher for the measured density matrix vs. two ideal density matrices, and the Helstrom Probability of Errors are within .5%. This probability of error far exceeds the reported =0.14 in [8] for discriminating between thermal and laser states and is equivalent to the theoretical probability of error for discriminating between ideal thermal states with this mean photon number detuning. By interleaving real noise and engineering a feedback loop to ensure matched mean photon numbers we can approach perfect indistinguishability ().
5 Funding
This material is based upon work supported by the Defense Advanced Research Projects Agency (DARPA) under Contract No. HR001124C0403 and NSF Grants 1719778, 1911089 and 2316713.
6 Acknowledgments
The authors are grateful to Dr. Joseph Chapman and team for their willingness to share their insights and expertise.
7 Disclosures
The authors declare no conflicts of interest. Any opinions, findings and conclusions or recommendations expressed in this material are those of the author(s) and do not necessarily reflect the views of the Defense Advanced Research Projects Agency (DARPA).
8 Data availability
Data underlying the results presented in this paper are not publicly available at this time but may be obtained from the authors upon reasonable request.
References
- [1] Bruno Avritzer and Todd A Brun “Quantum steganography via coherent-and Fock-state encoding in an optical medium” In Physical Review A 109.3 APS, 2024, pp. 032401
- [2] Boulat A Bash, Dennis Goeckel and Don Towsley “Limits of reliable communication with low probability of detection on AWGN channels” In IEEE journal on selected areas in communications 31.9 IEEE, 2013, pp. 1921–1930
- [3] Boulat A Bash et al. “Quantum-secure covert communication on bosonic channels” In Nature communications 6.1 Nature Publishing Group UK London, 2015, pp. 8626
- [4] Boulat A. Bash, Dennis Goeckel and Don Towsley “Square root law for communication with low probability of detection on AWGN channels” In 2012 IEEE International Symposium on Information Theory Proceedings, 2012, pp. 448–452 DOI: 10.1109/ISIT.2012.6284228
- [5] T Baumgratz, A Nüßeler, M Cramer and M B Plenio “A scalable maximum likelihood method for quantum state tomography” In New Journal of Physics 125004 IOP Publishing, 2013 DOI: 10.1088/1367-2630/15/12/125004
- [6] Joseph C. Chapman et al. “Bayesian homodyne and heterodyne tomography” In Opt. Express 30.9 Optica Publishing Group, 2022, pp. 15184–15200 DOI: 10.1364/OE.456597
- [7] M. Fox “Quantum Optics: An Introduction”, Oxford Master Series in Physics OUP Oxford, 2006 URL: https://books.google.com/books?id=2_ZP-LDF9jkC
- [8] Jonathan L. Habif et al. “Quantum-limited discrimination of laser light and thermal light” In Opt. Express 29.5 Optica Publishing Group, 2021, pp. 7418–7427 DOI: 10.1364/OE.417989
- [9] Bilal A Shaw and Todd A Brun “Quantum steganography with noisy quantum channels” In Physical review A 83.2 APS, 2011, pp. 022310
- [10] Simon Singh “The code book: the science of secrecy from ancient Egypt to quantum cryptography” Anchor, 2000
- [11] Ramin Soltani et al. “Covert wireless communication with artificial noise generation” In IEEE Transactions on Wireless Communications 17.11 IEEE, 2018, pp. 7252–7267
- [12] Chris Sutherland and Todd A Brun “Quantum steganography over noiseless channels: Achievability and bounds” In Physical Review A 101.5 APS, 2020, pp. 052319
- [13] Chris Sutherland and Todd A Brun “Quantum steganography over noisy channels: Achievability and bounds” In Physical Review A 100.5 APS, 2019, pp. 052312
- [14] Ben Wu et al. “Optical steganography based on amplified spontaneous emission noise” In Opt. Express 21.2 Optica Publishing Group, 2013, pp. 2065–2071 DOI: 10.1364/OE.21.002065