Calibration of Uncertainties of the Gaia DR3 Catalog Based on Data on Wide Binary Stars of the Galaxy Field
Abstract
The catalog of wide binary stars El-Badry et al. (2021), created on the basis of Gaia EDR3 data and including more than a million pairs, was used to analyze Gaia DR3 data obtained independently for their components. It is shown that the spatial heterogeneity of the catalog reflects the Gaia scanning law. The change in the spatial density of binary stars in the catalog with increasing distance from the Sun has been studied. By comparison with the model distribution, it is shown that the catalog contains approximately 2.5 times fewer binary stars than would be expected in the absence of spatial incompleteness. It is confirmed that the radius of spatial completeness of the catalog is on average close to 200 pc and depends on the absolute magnitude of the main component. The spatial density of binary stars in the catalog depends weakly on the difference in the magnitudes of the components, and significantly depends on the physical distance between the components. The incompleteness of the catalog in relation to pairs with a distance between components less than 100 AU occurs already at a distance of 25 pc from the Sun. Comparison of the characteristics of components of the same pair independently determined within the Gaia DR3 catalog allowed us to study how the probability of a non-random combination of components is related to the similarity of their characteristics. A high correlation between the degree of agreement between the characteristics and the reliability of the pair was found for radial velocities. Qualitative agreement is observed for metallicity [Fe/H] estimates and, to a lesser extent, for absorption estimates. No agreement was found for the ages of the stars, which indicates their great uncertainty in the ensemble, consisting mainly of main sequence stars. At the same time, age estimates for pairs with evolved components show significantly better agreement than for the dataset as a whole. Using the parameters of the components of the pairs from Gaia DR3, an independent estimate of the uncertainties in the radial velocities and metallicities depending on the apparent magnitude of the sources was performed. Estimates of the probable median values of errors in the radial velocities and metallicities of Gaia DR3 sources are proposed. Depending on the apparent magnitude, they exceed the median error values given in the catalog: for radial velocities by 1.5–3 times, for metallicities [Fe/H] by 7–25 times.
I Introduction
It is known that the occurrence of binary and multiple stars in the Galaxy, as well as their properties, are determined by the characteristics of the star formation process and, to a certain extent, by the dynamic interaction of stars in groups with a common origin (Duchêne and Kraus, 2013, Marks and Kroupa, 2012, Bate, 2015). Distinguishing between the contributions of the characteristics of the emerging population and their and non-trivial task (see, for example, the discussion in [5, 6]). The statistical properties of binary stars, obtained from observations, make it possible to introduce restrictions when solving problems related to the formation and evolution of the stellar population of the Galaxy (see, for example, works by Popova et al., 1982, Vereshchagin et al., 1988, Marks and Kroupa, 2012, Marks et al., 2022, Rozner and Perets, 2023).
The publication of each new release of data from the Gaia space project (Gaia Collaboration et al., 2016) initiates the production of new results in galactic astronomy and related fields of astronomy and astrophysics. This also applies to the study of the population of binary stars in the Galaxy. Thus, Gaia data has opened up the possibility of identifying and studying a population of wide binaries that is practically undistorted by observational selection effects. Studies carried out by different authors independently demonstrated, in particular, a striking feature of the population of binary field stars —– the presence of the so-called “twin peak” in the distribution of component mass ratios (El-Badry et al., 2019, Sapozhnikov et al., 2020). Previously, such a peak (an excessive, in respect with the smooth distribution, of a number of binary stars with similar component masses) was detected for spectroscopic binary stars (Tokovinin, 2000, Moe and Di Stefano, 2017), and was presumably explained by competitive accretion onto a close binary protostar surrounded by a common envelope or accretion disk. The reliable existence of a “twin peak” for binary stars with distances between components of up to thousands of astronomical units forces discussion of possible mechanisms for increasing the distance between components after their masses became equal (El-Badry et al., 2019). This probably occurred during dynamic interactions in the host star cluster before its disintegration and the movement of the twin stars into the field. Moreover, the distance between the components of such pairs imposes restrictions on the conditions in the cluster.
Using refined astrometric observations from the Gaia Early Data Release 3 (Gaia Collaboration et al., 2021), El-Badry et al. (2021) published a list of likely members of wide binary stars within 1 kpc of the Sun, containing over a million entries. The pairs were identified as a result of the analysis of spatial and kinematic information about the probable components, considering the probability of a random coincidence in the direction of motion of the stars. In June 2022, the full Gaia Data Release 3 was published, containing, in particular, average radial velocities for 33 million stars, as well as an extensive catalog of astrophysical characteristics estimates made for large samples of stars using low- and medium-resolution Gaia spectra. In addition, a catalog of the so-called “non-single” Gaia sources was published, the solution for the motion of which assumes the presence of orbital motion due to the presence of an invisible satellite. Due to its pilot nature, the list of non-single stars has a complex selectivity function (Pourbaix et al., 2022). Moreover, it was previously shown that the possibilities of studying binary stars with Gaia with an angular distance close to the Gaia resolution limit, as well as binaries with pronounced orbital motion, are limited (Kovaleva et al., 2021, Chulkov and Malkov, 2022).
In this paper, we use Gaia DR3 data to explore and independently test a catalog of probable wide binary stars (El-Badry et al., 2021).
In Section 2, we discuss the characteristics of the wide binary star catalog and its complement with Gaia DR3 data. Section 3 compares the characteristics of the pair components published under Gaia DR3 and examines the spatial completeness of the wide pair catalog. Section 4 discusses the use of independently determined pair component parameters to independently estimate radial velocity and metallicity uncertainties in Gaia DR3. Section 5 contains suggested conclusions.
II Data
The Wide Binary Star Catalog El-Badry et al. (2021) is the largest catalog of probable binary stars and is homogeneous and well described. The catalog contains information about pairs of stars located at distances up to 1 kpc from the Sun with mutual separations from 10 AU up to 1 pc, and having consistent proper motions. In this case, the tangential component of the relative velocity of the components and the distance between the components are such that they imply a low probability of a random coincidence of velocities. The authors of the catalog chose the R_chance_alignment metric as a numerical characteristic of this probability, and for pairs considered as real, . This condition is satisfied by 1023441 pairs of stars out of 1571545 pairs in the catalog.
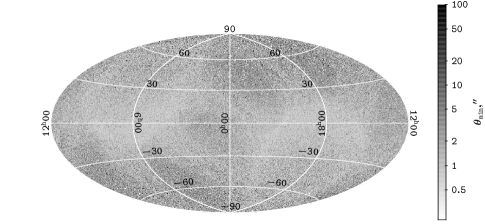
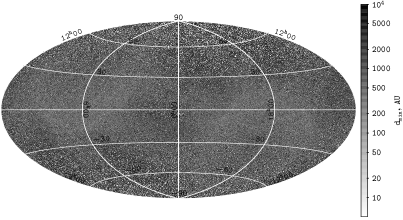
Let us discuss the selectivity function of catalog El-Badry et al. (2021) determined by the method of its creation. It is formed by the selectivity of the Gaia EDR3 source catalog, including its resolution, which depends on the brightness difference of the sources (approximately, it can be stated that sources, regardless of the brightness difference , are resolved at angular distances wider than ; at distances from , sources with a brightness difference are resolved). The boundary of the incompleteness region is blurred. This effect disrupts the completeness of the binary sample at distances up to about 200 pc from the Sun. It can be shown that the boundary of the region of incompleteness due to Gaia’s resolution depends on the scanning law, and not on the density of the stellar field, as one would expect. In the left panel, Fig. 1 shows the distribution on the celestial sphere of the minimum angular distance (in arcseconds) between the components of the pair depending on the galactic coordinates (l, b) of the first component. Traces of the preferred scanning directions are clearly visible. A similar effect remains for the tangential projection of the minimum linear distance between components (right panel of Fig. 1). We can confidently expect this effect to decrease with subsequent releases of Gaia data. It should be noted that this dependence is not related to the distribution of catalog sources over the celestial sphere, which reflects the nature of the distribution of stars in the Galaxy (El-Badry et al., 2021, see Fig. 1 in the article).
At longer distances, a different selection effect operates: pairs, one of both components of which are weaker than the limiting magnitude of Gaia, disappear from consideration. And for this area of incompleteness the boundary is not clear; for different areas of the sky the limiting value can vary within . When creating the catalog, the authors did not use filters based on the quality of the astrometric and/or photometric solution (except for the limitation on the relative error of trigonometric parallax), as these filters would have effectively filter out stars with pronounced orbital motion. However, deterioration in the quality of the astrometric solution for such stars could in itself, in some cases, lead to distortions in the values of astrometric parameters and the failure to detect a probable pair. An indirect indication of such possibility is the underestimation of the nominal parallax errors of close components discovered for catalog stars. In addition to the effects mentioned, when creating the catalog, its authors deliberately excluded from the catalog sources in resolved triple systems, moving groups and star clusters.
Thus, the completeness of the sample of binary stars presented in the catalog El-Badry et al. (2021) in parameter space is limited and affected by a number of factors. However, it has a high degree of homogeneity and is the most representative of the known lists of binary stars, making it an attractive object for study.
When creating the catalog El-Badry et al. (2021), information about the radial velocities of stars —- probable components of pairs —- was not considered in any way. Radial velocities for more than 33 million sources (Katz et al., 2022) are published as part of the main Gaia DR3 catalog; for 122003 pairs from the catalog under study, radial velocities are available for both components. We match the Gaia DR3 radial velocity information for the probable components of the pairs. The average nominal error in determining the radial velocities of individual sources for an ensemble of catalog stars is 2.6 km/s.
Within Gaia DR3, estimates of the astrophysical characteristics of Gaia sources were carried out (Creevey et al., 2022, Foley et al., 2022), based on a combination of astrometric and photometeric data with low- and, in certain cases, medium-resolution spectroscopy with models of stellar evolution, considering the model of the distribution of stars in the Galaxy. In this case, a set of astrophysical characteristics for each star was determined simultaneously in such a way as to best satisfy the observational and a priori specified parameters. The catalog of wide pairs makes it possible to externally assess the accuracy of the obtained astrophysical parameters under the assumption that the components have the same origin, similar ages, contents of chemical elements, and the interstellar absorption for them should be similar. For 161944 pairs from the catalog, age estimates are available for both components; for 666903 pairs, metallicity [Fe/H] and interstellar extinction in the G-band estimates are available. These estimates were obtained without using medium resolution spectroscopy. Within Gaia DR3, the most probable values and the lower and upper limits of the range of values corresponding to the first and third quartiles of the probability distribution are given for astrophysical characteristics. The probable range of values is asymmetric relative to the point estimate, but if we use half the difference between the largest and smallest of the boundary values as a characteristic error, then the average accuracy of age determination for catalog sources of wide pairs is million years; for metallicity estimates the average specified accuracy is , and for extinction . Metallicity values [Fe/H]S obtained based on the data from Gaia spectrograph are available for both components of just 2400 pairs. We will not discuss them within the scope of this work.
III Results
III.1 Comparison of Component Characteristics
The agreement between independently determined characteristics of the probable components of the pairs can be interpreted from two points of view. The first of these is testing the hypothesis of true binarity. The second points of view is testing assessments of independently defined characteristics. In both cases, it is assumed that the radial velocities , estimates of ages , metallicity [Fe/H], and extinction of the components of the binary star should coincide. Obviously, such an assumption may be incorrect, at least with respect to radial velocities, if there is orbital motion in the system. The maximum probable contribution of orbital motion to the radial velocities of the components of the catalog El-Badry et al. (2021) can be several times greater than the average radial velocity error and amount to tens of km/s. Such an estimate can be obtained by selecting from a list of stars with known orbits those that should be included in the catalog of wide pairs according to formal criteria (angular distance between the components and distance to the Sun), and calculating their average orbital speed. Using the catalog of astrometric orbits of binary stars (Hartkopf et al., 2001), supplemented with data from Gaia EDR3 (Chulkov and Malkov, 2022), we found that for 603 binary stars with known orbits that meet the selection criteria of the catalog of wide pairs, the estimated average orbital velocities range from 0.1 to 80 km/s with a median value of 2.8 km/s.
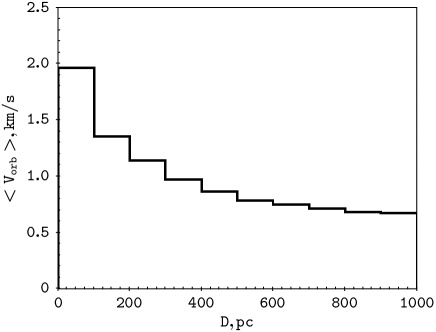
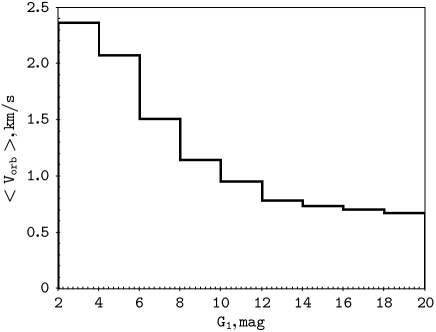
For 178453 pairs in the catalog, estimates of the masses of both components are available, and the average orbital speed can be estimated by determining the pair’s orbital period based on Kepler’s third law. Assuming a random orientation of circular orbits in space, the average projection of the physical separation between the components onto the tangential plane is , where is the semimajor axis of the orbit. The estimates of average velocities obtained in this way range from 0 to 8 km/s, their median value is 0.7 km/s, and for of pairs the obtained velocities are less than 2.7 km/s —– which is a value close to the average nominal error in determining the radial velocity in the catalog. In this case, the relation of the probable orbital speed with the distance to the system and, in connection with this, with the apparent magnitude of the main component is observed: at smaller distances from the Sun, closer systems with a shorter orbital period can be resolved. Figure 2 shows the nature of these dependencies. The histogram bars represent the median expected orbital velocity for pairs at different ranges of distances to the Sun and with different apparent magnitudes of the main component. This median value varies from about 2 km/s for the closest and brightest pairs (closer than 100 pc and/or with a main component magnitude ) to less than 1 km/s for pairs further than 300 pc and/or with a main component magnitude .
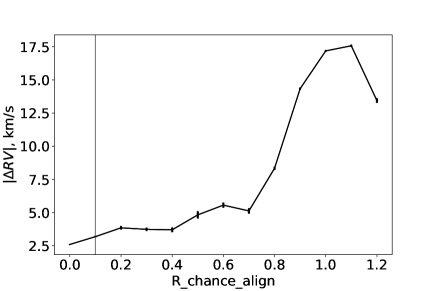
We study the distribution of the median value of the difference modules , , , with changes in . In Fig. 3, the range of values of the metric is limited to 1.1, which is sufficient to demonstrate the general trend. Pairs with can be considered as highly probably true. As a characteristic of the difference in radial velocities , the reduced difference in radial velocities of components 1, 2 is used, considering the dependence of the velocity projection on the coordinates of the source (l, b). The spatial velocities of the i-components are defined as
Then the radial velocity of one of the components (to be specific, the first) is calculated, reduced to the coordinates of component 2:
The resulting reduced radial velocity difference is free from the projection effect.
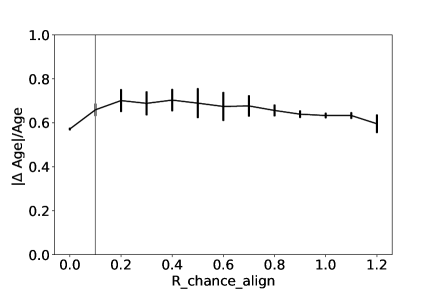
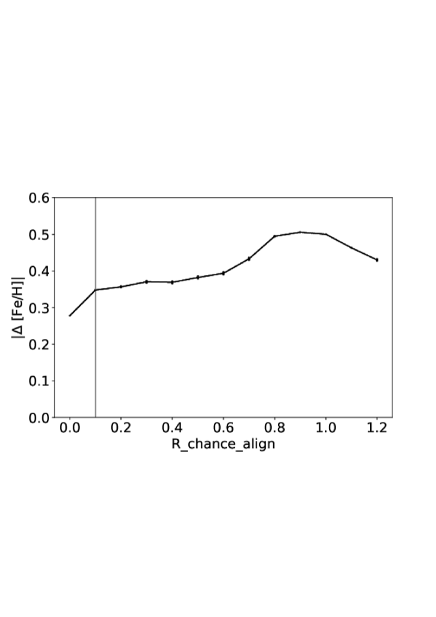
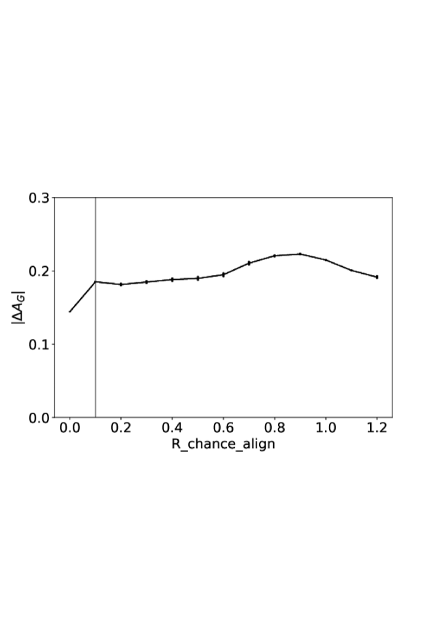
Figure 3 shows data characterizing the similarity of characteristics independently determined for the components of pairs of the catalog El-Badry et al. (2021) within the framework of Gaia DR3. The dependence of this similarity on the probability of a non-random pairing turns out to be an interesting diagnostic tool. Thus, radial velocities (top left panel of Fig. 3) demonstrate a clear connection with the metric of the probability of (non)randomness . This metric can take values greater than unity, but we limit the figures to the value , since the most interesting comparison is of pairs of stars with (“reliable” binaries) and (highly probably random ones). The median difference in reduced radial velocities for reliable pairs (and for pairs up to ) turns out to be 4–6 times lower than for random combinations of stars. Of the astrophysical characteristics, the best agreement is shown by the metallicity [Fe/H] of the components (lower left panel of Fig. 3): for reliable pairs, the median metallicity difference is two times lower than for random pairs. For the absorption (lower right panel), the difference in median differences is less significant, but noticeable. On the other hand, age estimates from Gaia DR3 show no correlation with the probability of a non-random pairing. The upper right panel shows the median relative age difference as a fraction of the age of the brighter component. The distributions of the differences in the parameters of the components (except for ages) indicate that a significant proportion of true pairs is present in the ensemble up to values .
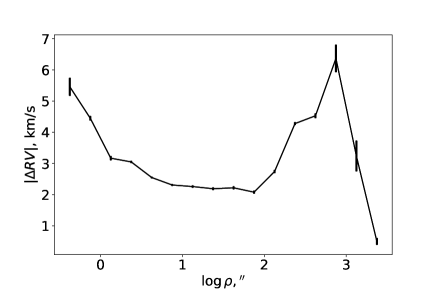
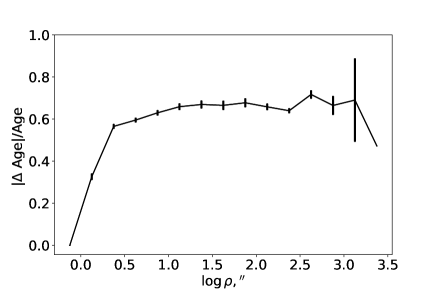
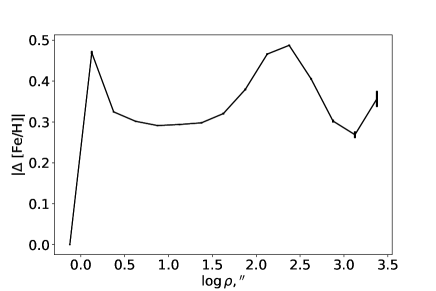
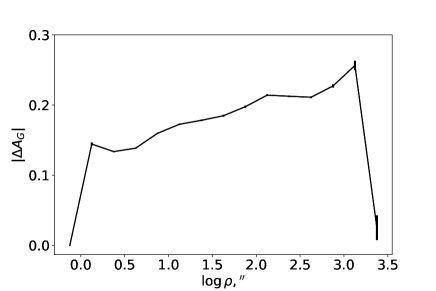
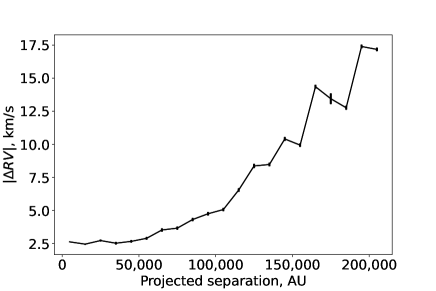
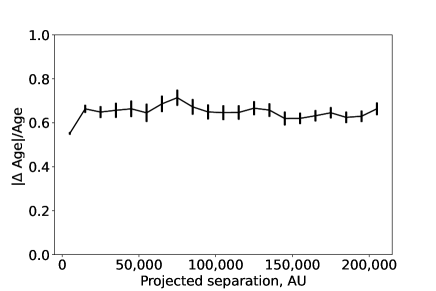
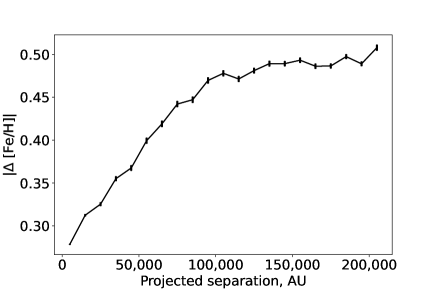
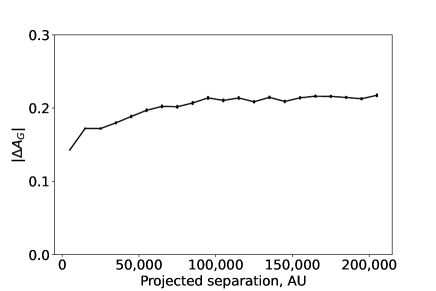
The quantity is statistical in nature and is related to the observational and physical characteristics of pairs in the catalog El-Badry et al. (2021) (the angular distance between the components and the projection of the physical distance between the components ) in non-trivial way. Let us consider the dependence of , , , for the components of the pair in Gaia DR3, on (Fig. 4), (Fig. 5). The angular distance between the components is presented in arcseconds (logarithmic scale), the projection of the linear distance between the components on the tangential plane is in AU (linear scale). This choice of scales will allow us to further discuss some interesting effects.
In Fig. 4, the increase in value of at small values of (upper left panel of the figure) does not correspond to the diagram – (upper left panel of Fig. 5) and is apparently associated with a decrease in the accuracy of determining the radial velocities due to mutual blending of closely located components. The identical characteristics [Fe/H], , при of the components at is explained by observational selection: at such angular distances, only sources with a brightness difference , the so-called “twins”, can be resolved in Gaia. Applying the same algorithm to two sources with the same observational characteristics leads to identical values of [Fe/H], , . At , however, pairs with components differing in brightness begin to be resolved, and the contribution of blending becomes noticeable, which disappears at high values of . It is interesting that the sharpness of the peak of , , associated with blending of components is the more while the dependence of the parameter difference on (Fig. 3) more pronounced: it is significant for , less pronounced for and absent for . This can be considered another independent indication of the comparative internal accuracy of the Gaia DR3 astrophysical parameter estimation method with respect to different parameters. As the angular distance between the components increases, the median values of , , predictably increase (the behavior of the dependencies for is statistically insignificant). At the same time, the median value of remains practically unchanged.
In Fig. 5, the behavior of the dependence of median values of , , , on the projection of the physical distance between the components shows a picture qualitatively similar to Fig. 3. The median difference in values increases significantly with increasing distance between the components for radial velocities and metallicities (left upper and lower panels, respectively), indicating an increase in the fraction of non-physical pairs; at the same time, the median difference (lower right panel) grows slightly, while is approximately constant. Thus, the distributions of the differences in the astrophysical parameters of the components depending on , and , indicate better agreement between the characteristics of the components for metallicities, noticeable but weak agreement for , and almost no agreement for ages. The low general accuracy of component age estimates can be attributed to the fact that for main sequence stars, the observational characteristics, considering their errors, depend very little on age. Moreover, for a subsample that includes 400 reliable pairs with components in which both components on the Hertzsprung–Russell diagram look evolved, the median value is , while the median value for the entire ensemble of reliable pairs is . It can therefore be expected that for stars leaving the main sequence and for giant stars, age estimates in Gaia DR3 are more reliable.
III.2 Study of the Spatial Completeness of the Catalog
Based on the principles of creating the catalog El-Badry et al. (2021) (excluding regions of open star clusters from consider and discusstion of the Fig. 1 in the Section II one can expect that the catalog of wide binaries does not have spatial completeness in the volume of 1 kpc. Let us investigate the connection between its spatial incompleteness and the characteristics of binary stars by modifying the method described in Kharchenko et al. (2016) for studying the dependence of the spatial completeness of an ensemble of star clusters on their integral stellar magnitude. Provided that the space around the Sun is uniformly filled with binary stars, the asymptote of the distribution describing the increase in their number with distance to the pair (on a logarithmic scale) should be a straight line . However, the catalog under study contains stars at a distance of up to 1 kpc, which is noticeably greater than the height scale of the stellar disk. We model the expected distribution of stars, distributing them uniformly in galactic rectangular coordinates (X,Y), and along the coordinate Z —– in accordance with the law with a height scale of 150 pc, characteristic of G-dwarfs (Bovy, 2017). The normalization of the distribution is such that there are 1 million stars at a distance of 1 kpc from the Sun, which approximately coincides with the number of reliable pairs in the catalog. In Figs. 6, 7, the model distribution is shown by a pale gray wide line. The distribution of all reliable () pairs in the catalog is shown in large black circles (left panel of Fig. 6, both panels of Fig. 7). In all cases, the probable geometric distance to the main component is used to estimate the distance to the pair (Bailer-Jones et al., 2021).
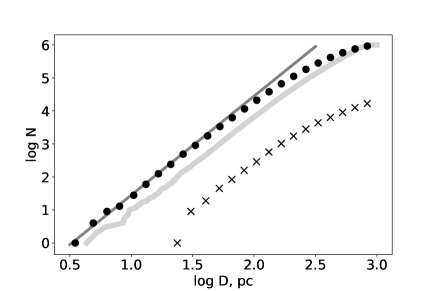
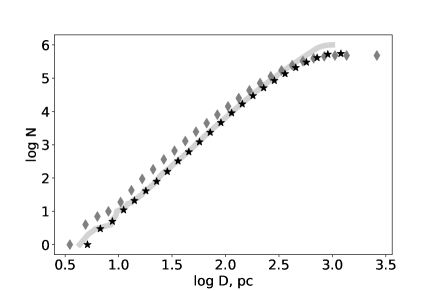

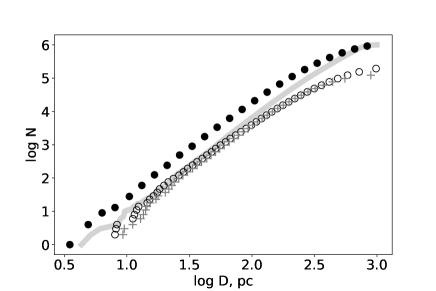
Figure 6 shows the dependence of the spatial completeness of the catalog on the absolute magnitude of the main component. The left panel shows the distribution of all stars in comparison with the model distribution and, for the support, the asymptote (thin gray line). The oblique crosses show the change with distance in the number of stars of absolute magnitude . This distribution is expectedly incomplete near the Sun (due to the Gaia limitations for bright magnitudes). Comparison of the complete distribution of reliable catalog pairs with the model one (the difference is about 0.4 dex near the Sun) allows us to estimate the probable shortage of stars in the catalog. If it were spatially complete, the expected number of pairs in a volume of 1 kpc would be about 2.5 million. The catalog becomes incomplete in the region pc from the Sun, which coincides with the authors’ own estimate, made by a different method. The right panel compares distributions for stars with absolute magnitude and . For main sequence stars corresponds to spectral class , according to https://www.pas.rochester.edu/~emamajek/EEM_dwarf_UBVIJHK_colors_Teff.txt (Pecaut and Mamajek, 2013). The more absolutely bright part of the ensemble (black dots) maintains a constant spatial density up to 400 pc, while the spatial density of the more absolutely faint pairs begins to decrease, starting from about 50 pc from the Sun. Figure 7 demonstrates the influence of pair characteristics on the change in spatial density of pairs with distance. The left panel demonstrates that there is practically no dependence on the difference in the magnitudes of the components: the change in the number of stars with high contrast (gray crosses) and stars with almost identical components (black dots) with distance is almost identical. In the immediate vicinity of the Sun, a small deficit of pairs with a brightness difference between the components may be due to the incomplete representation of bright stars in the Gaia catalog, and at distances of about 1 kpc —– to the fact that the secondary components of such pairs become too faint. In the right panel of Fig. 7, gray and black dots show the relation of the change in spatial density of pairs with distance from the Sun depending on the distance between the components. In all cases, the projection of distance onto the tangential plane is used as the distance. Gray dots indicate the spatial distribution of pairs with AU, and black dots indicate pairs with the distance between the components AU. The relative lack of “close” binaries with AU starts from about 25 pc from the Sun due to the fact that some pairs with high contrast cease to be resolved in the Gaia catalog, and beyond 125 pc there are almost no such pairs. As the distance from the Sun increases, the widest pairs begin to dominate in the ensemble.
IV DISCUSSION

| G, mag | ||||
|---|---|---|---|---|
| <10 | 0.33 | 1.6 | 1.2 | 1.1 |
| 10-12 | 0.86 | 1.7 | 0.90 | 1.5 |
| 12-13 | 1.9 | 3.0 | 0.81 | 2.9 |
| 13-14 | 3.2 | 4.8 | 0.76 | 4.7 |
| 14-15 | 5.5 | 10.5 | 0.70 | 10.5 |
| 15-16 | 6.7 | 20.1 | 0.67 | 20.1 |
The median errors are given for different ranges of magnitude : the radial velocity from Gaia DR3 (), the standard deviation of the normalized radial velocity difference between the components of a pair (), the median estimate of the possible radial velocity difference of a pair associated with orbital motion in a binary system (), and our resulting estimate of the expected characteristic radial velocity error ().
| G, mag | ||
|---|---|---|
| <10 | 0.014 | 0.35 |
| 10-12 | 0.013 | 0.25 |
| 12-13 | 0.014 | 0.17 |
| 13-14 | 0.017 | 0.27 |
| 14-15 | 0.022 | 0.24 |
| 15-16 | 0.029 | 0.28 |
| 16-17 | 0.041 | 0.36 |
| 17-18 | 0.056 | 0.39 |
The median values from Gaia DR3 and the resulting estimates of the expected values of [Fe/H] error are given (asymmetry of the errors is neglected).
A comparison of independently determined characteristics of the components allows us to estimate the scale of the errors in these quantities, similarly to how it was done in El-Badry et al. (2021) for parallax errors. We have made such estimates for the errors in radial velocities and metallicities of stars from Gaia DR3.
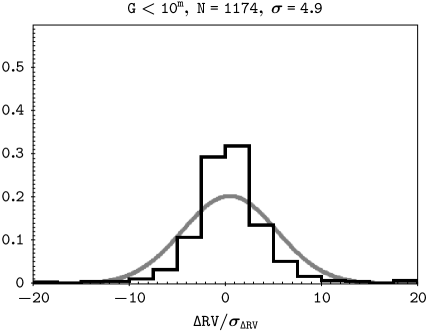
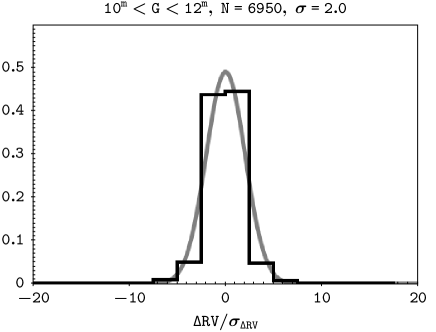
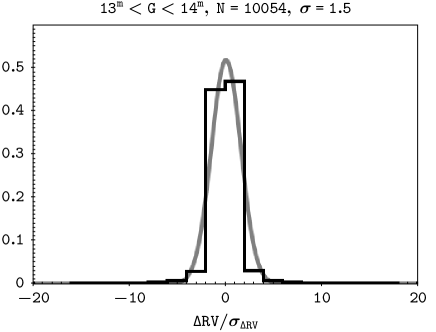
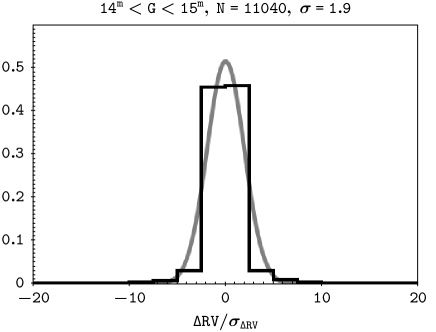
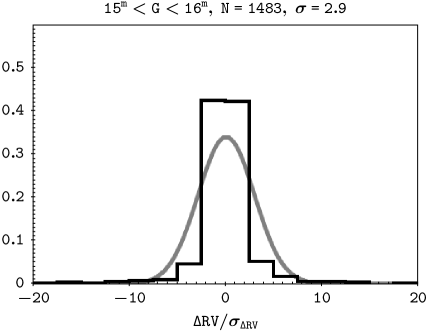
Let us consider the distribution of uncertainties observed for reliable catalog pairs , where
If the radial velocities of the components are identical and the radial velocity errors are realistic, then the distribution of will be an unbiased normal distribution with a variance close to .
At the Fig. 8 shows the error-normalized distributions of the difference in radial velocities of the components of the pair in different ranges of visible magnitude . A pair was included in range statistics only if the magnitudes of both components belonged to the corresponding range. The resulting standard deviations of the approximating Gaussian distributions are indicated above each panel. Their values vary from 1.5 to 4.9. In this case, the characteristic nominal radial velocity errors depend on the apparent magnitude of the source. In addition, as discussed in Section III, for each magnitude range a difference between the radial velocities of the components is expected due to the presence of orbital motion in the system. Upper estimates of such differences are shown in Fig. 2. We summarize the results obtained in Table 1, where we indicate for different ranges of magnitude the median radial velocity error from Gaia DR3 , the standard deviation of the normalized difference in the radial velocities of the components of the pair , the median estimate of the possible difference in the radial velocities of the pair associated with the orbital motion in the binary system , and our resulting estimate of the expected characteristic radial velocity error . A similar study was carried out to estimate metallicities [Fe/H], assuming identical metallicities for the components of a pair of stars. In the Gaia DR3 catalog, for astrophysical properties determined by Bayesian methods, the lower and upper bounds are given on the range of probable values that are asymmetrical with respect to the best estimate. Instead of the root-mean-square metallicity error, to normalize the observed distribution of differences in [Fe/H] of the components , we (generally speaking, not quite correctly) used the quantity
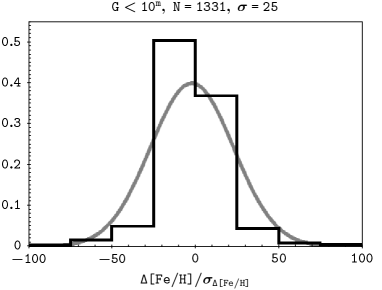
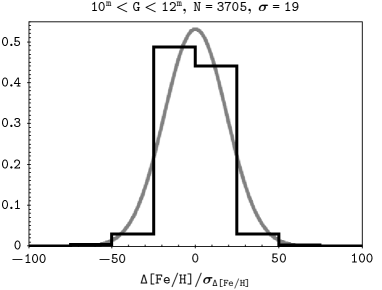
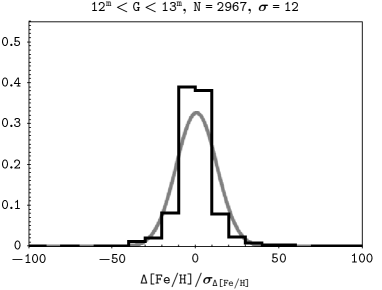
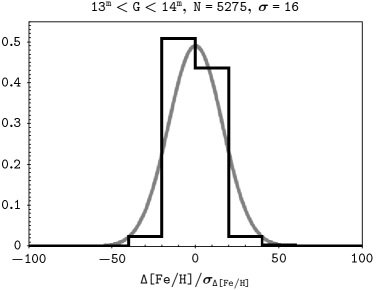
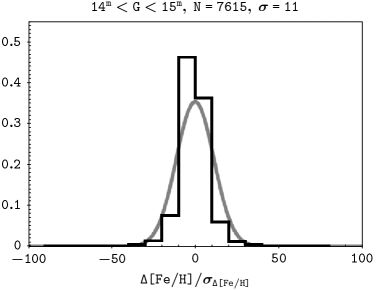
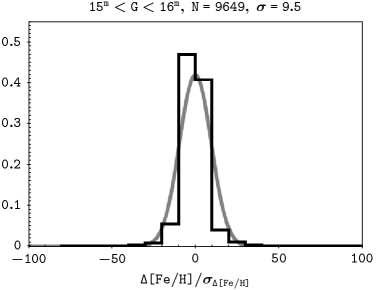
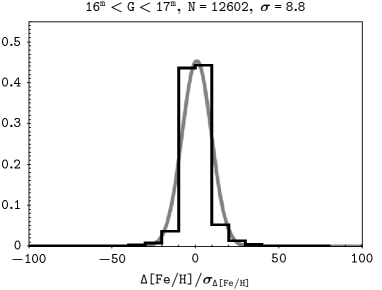
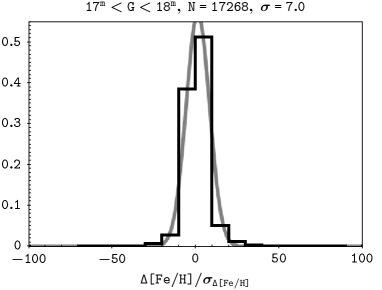
The distributions of normalized metallicity deviations are shown in Fig. 9. It was found that the indicated ranges of metallicity values in the catalog are apparently underestimated by an order of magnitude. Median values of from Gaia DR3 and the resulting estimates of the expected error values of [Fe/H] (without considering asymmetry) are given in Table 2.
Note also that a study of the statistical agreement of the characteristics of the components of reliable pairs (with ) was carried out in the original article by El-Badry et al. (2021) using LAMOST data (Cui et al., 2012). For LAMOST radial velocities, the agreement was found to be in good agreement with the errors, and the metallicity errors reported in the catalog were found to be underestimated.
V Conclusions
The catalog of wide binary stars El-Badry et al. (2021), created on the basis of Gaia EDR3 data and representing the most extensive list of binary stars, with a high degree of homogeneity and completeness was analyzed. This list represents promising material for studying the characteristics of the population of wide binary stars in the Galactic field. It was shown that the spatial heterogeneity of the catalog reflects the Gaia scanning law. This is explained by the fact that in the areas of the sky scanned the greatest number of times, the maximum limiting magnitude and angular resolution of the catalog are achieved. The change in the spatial density of binary stars in the catalog with increasing distance from the Sun has been studied. A model (expected) distribution was constructed; it is shown by comparing the observed distribution with it that the catalog contains approximately 2.5 times fewer binary stars than would be expected in the absence of spatial incompleteness (when the model distribution is normalized to the density of binary stars near the Sun). It is confirmed that the radius of spatial completeness of the catalog is on average close to 200 pc. It is shown that the radius of spatial completeness depends on the absolute magnitude of the main component. It increases for more absolutely bright stars, but at the same time for them the inner radius of the visibility zone also increases. The spatial density of binary stars in the catalog is almost independent of the difference in the magnitudes of the components, but in the near-solar and most distant regions the catalog is incomplete for pairs with large brightness differences. The spatial completeness of the catalog depends significantly on the physical distance between the components. The incompleteness of the catalog for pairs with a distance between components less than 100 AU starts already at a distance of 25 pc from the Sun.
Comparison of the characteristics of components of the same pair independently determined within the Gaia DR3 catalog allowed us to study how the probability of a non-random combination of components is related to the similarity of their characteristics. For radial velocities, it was found that the median difference magnitude for reliable pairs is 5–6 times less than the same value for random pairs. Qualitative agreement is also observed for [Fe/H] metallicity estimates and, to a lesser extent, for absorption estimates. For estimates of the ages of stars as a complete ensemble, which is dominated by main sequence stars, no agreement was found, which indicates a large uncertainty in this value. At the same time, the median agreement of age estimates for pairs with evolved components is much better and is about . Using the parameters of the pair components from Gaia DR3, an independent estimate of the uncertainties in the radial velocities and metallicities depending on the apparent magnitude of the sources was performed. When comparing the radial velocities of the components, their probable difference due to the presence of orbital motion in the binary system was considered. Estimates of the expected difference are made depending on the distance to the system and on the apparent magnitude of the main component. Estimates of the probable median values of errors in the radial velocities and metallicities of Gaia DR3 sources are proposed. Depending on the apparent magnitude, they exceed the median error values given in the catalog: for radial velocities by 1.5–3 times, for metallicities [Fe/H] by 7–25 times.
The work uses data from Gaia space mission of the European Space Agency (ESA), (https://www.cosmos.esa.int/gaia), processed by the Gaia Data Processing and Analysis Consortium (DPAC, https://www.cosmos.esa.int/web/gaia/dpac/consortium). An interactive graphical visualizer and analyzer for tabular data TOPCAT (Taylor, 2005) was used.
The author is grateful to the anonymous reviewer for stimulating comments and recommendations that made it possible to improve the work.
The author declares no conflicts of interest.
References
- Bailer-Jones et al. (2021) C. A. L. Bailer-Jones, J. Rybizki, M. Fouesneau, et al., Astron. J. 161 (3), 147 (2021).
- Bate (2015) M. R. Bate, in S. M. Rucinski, G. Torres, and M. Zejda (eds.), Living Together: Planets, Host Stars and Binaries, Astronomical Society of the Pacific Conference Series, vol. 496, p. 37 (2015).
- Bovy (2017) J. Bovy, Monthly Notices Royal Astron. Soc. 470 (2), 1360 (2017).
- Chulkov and Malkov (2022) D. Chulkov and O. Malkov, Monthly Notices Royal Astron. Soc. 517 (2), 2925 (2022).
- Creevey et al. (2022) O. L. Creevey, R. Sordo, F. Pailler, et al., arXiv e-prints arXiv:2206.05864 (2022).
- Cui et al. (2012) X.-Q. Cui, Y.-H. Zhao, Y.-Q. Chu, et al., Research in Astronomy and Astrophysics 12 (9), 1197 (2012).
- Duchêne and Kraus (2013) G. Duchêne and A. Kraus, Annual Rev. Astron. Astrophys. 51 (1), 269 (2013).
- El-Badry et al. (2021) K. El-Badry, H.-W. Rix, and T. M. Heintz, Monthly Notices Royal Astron. Soc. 506 (2), 2269 (2021).
- El-Badry et al. (2019) K. El-Badry, H.-W. Rix, H. Tian, et al., Mon. Not. R. Astron. Soc 489 (4), 5822 (2019).
- Foley et al. (2022) M. Foley, A. Goodman, C. Zucker, et al., in American Astronomical Society Meeting Abstracts, American Astronomical Society Meeting Abstracts, vol. 54, p. 333.03 (2022).
- Gaia Collaboration et al. (2021) Gaia Collaboration, A. G. A. Brown, A. Vallenari, et al., Astron. and Astrophys. 649, A1 (2021).
- Gaia Collaboration et al. (2016) Gaia Collaboration, T. Prusti, J. H. J. de Bruijne, et al., Astron. and Astrophys. 595, A1 (2016).
- Hartkopf et al. (2001) W. I. Hartkopf, B. D. Mason, and C. E. Worley, Astron. J. 122 (6), 3472 (2001).
- Katz et al. (2022) D. Katz, P. Sartoretti, A. Guerrier, et al., arXiv e-prints arXiv:2206.05902 (2022).
- Kharchenko et al. (2016) N. V. Kharchenko, A. E. Piskunov, E. Schilbach, et al., Astron. and Astrophys. 585, A101 (2016).
- Kovaleva et al. (2021) D. Kovaleva, O. Malkov, S. Sapozhnikov, et al., Communications in Computer and Information Science 1427, 125 – 133 (2021).
- Marks and Kroupa (2012) M. Marks and P. Kroupa, Astron. and Astrophys. 543, A8 (2012).
- Marks et al. (2022) M. Marks, P. Kroupa, and J. Dabringhausen, Astron. and Astrophys. 659, A96 (2022).
- Moe and Di Stefano (2017) M. Moe and R. Di Stefano, Astrophys. J. Suppl. 230 (2), 15 (2017).
- Pecaut and Mamajek (2013) M. J. Pecaut and E. E. Mamajek, Astrophys. J. Suppl. 208 (1), 9 (2013).
- Popova et al. (1982) E. I. Popova, A. V. Tutukov, and L. R. Yungelson, Astrophys. and Space Sci. 88 (1), 55 (1982).
- Pourbaix et al. (2022) D. Pourbaix, F. Arenou, P. Gavras, et al., Gaia DR3 documentation Chapter 7: Non-single stars, Gaia DR3 documentation, European Space Agency; Gaia Data Processing and Analysis Consortium. https://gea.esac.esa.int/archive/documentation/GDR3/index.html</A>, id. 7 (2022).
- Rozner and Perets (2023) M. Rozner and H. B. Perets, Born to be wide: the distribution of wide binaries in the field and soft binaries in clusters (2023).
- Sapozhnikov et al. (2020) S. A. Sapozhnikov, D. A. Kovaleva, O. Y. Malkov, and A. Y. Sytov, Astronomy Reports 64 (9), 756 (2020).
- Taylor (2005) M. B. Taylor, in P. Shopbell, M. Britton, and R. Ebert (eds.), Astronomical Data Analysis Software and Systems XIV, Astronomical Society of the Pacific Conference Series, vol. 347, p. 29 (2005).
- Tokovinin (2000) A. A. Tokovinin, Astron. and Astrophys. 360, 997 (2000).
- Vereshchagin et al. (1988) S. Vereshchagin, A. Tutukov, L. Iungelson, et al., Astrophys. and Space Sci. 142 (1-2), 245 (1988).