11email: konstantinos.kouroumpatzakis@asu.cas.cz 22institutetext: Department of Physics, University of Crete, Voutes University campus, 70013 Heraklion, Greece 33institutetext: Institute of Astrophysics, Foundation for Research and Technology-Hellas, N. Plastira 100, Vassilika Vouton, 71110 Heraklion, Greece 44institutetext: Center for Astrophysics | Harvard & Smithsonian, 60 Garden St., Cambridge, MA 02138, USA 55institutetext: Cahill Center for Astronomy and Astrophysics, California Institute of Technology, Pasadena, CA 91125, USA 66institutetext: Department of Theoretical Physics and Astrophysics, Faculty of Science, Masaryk University, Kotlářská 2, Brno, CZ-61137, Czech Republic.
Blueberry galaxies up to 200 Mpc and their optical/infrared properties
Abstract
Context. Dwarf highly star-forming galaxies (SFGs) dominated the early Universe and are considered the main driver of its reionization. However, direct observations of these distant galaxies are mainly confined to rest-frame ultraviolet and visible light, limiting our understanding of their complete properties. Therefore, it is still paramount to study their local analogs, the Green Pea (GP) and Blueberry (BB) galaxies.
Aims. This work aims to expand our knowledge of BBs by identifying new instances, particularly in closer proximity and in the southern sky. In addition to the already known, this new sample of BBs allows for a statistically significant study of their properties probed by visible and infrared (IR) light.
Methods. By utilizing the HECATE catalog, which provides optical/IR photometry and characterization of galaxies, along with data from Pan-STARSS and SDSS, this study selects and analyzes a new sample of BBs. Spectral energy distribution fitting is employed to derive homogeneous measurements of star-formation rates and stellar masses. Additionally, emission-line fluxes, including , are measured through spectral fitting.
Results. This work has identified 48 BBs, out of which 40 are new, with the nearest at 19 Mpc. 14 BBs are in the south sky. The BBs tend to be extremely IR red in both WISE and colors distinguishing them from typical SFGs. Dwarf SFGs with higher specific star-formation rates tend to have redder IR colors.
Conclusions. Blueberry galaxies stand out as the most intensely star-forming sources in the local Universe among dwarf galaxies. They exhibit unique characteristics, being intrinsically bluer in visible light and redder in the infrared, less massive, with higher specific star-formation rates and equivalent widths, lower metallicities, and possessing the most strongly ionized interstellar medium compared to typical SFGs and GPs.
Key Words.:
galaxies:general – galaxies:dwarf – galaxies:star formation – galaxies:stellar content – galaxies:ISM – galaxies: starburst1 Introduction
After the Dark Ages, the early Universe transformed from being mostly opaque to being transparent due to the reionization of its intergalactic medium (IGM) during the reionization era (see e.g., Barkana & Loeb 2001, and references therein) which took place at (e.g., Bouwens et al. 2015; Robertson et al. 2015). It is still an open question what caused this pivotal change, and which sources could produce the copious amounts of the required ionizing radiation. Dwarf highly star-forming galaxies (SFGs) are considered mainly responsible because they were numerous and capable of producing large amounts of ultraviolet (UV) and Lyman continuum (LyC) radiation due to hosting a large stellar population (SP) of massive stars (e.g., Shapiro & Giroux 1987; Loeb & Barkana 2001). Active galactic nuclei (AGN) and quasars could have also contributed substantially to the reionization of the IGM (e.g., Volonteri & Gnedin 2009).
Recently, the James Webb Space Telescope (JWST) revolutionized our view of the young Universe by allowing the direct study of the rest-frame UV and visible light of some very distant galaxies at redshifts (e.g., Harikane et al. 2023; Labbé et al. 2023). However, mainly due to their immense distances, the direct study of these early galaxies through other wavelengths (e.g., X-rays, radio) is beyond our current capabilities. Thus, their local analogs, the Green Pea (GP) and Blueberry (BB) galaxies offer the only alternative solution. In fact, recent JWST observations of high-redshift star-forming dwarf galaxies revealed that they show a remarkable resemblance to known relatively nearby GPs (Schaerer et al. 2022; Rhoads et al. 2023).
Green Peas are dwarf starburst galaxies relatively nearby at redshift (Cardamone et al. 2009). They are characterized by low stellar masses (), compact scales (), sub-solar metallicities (log(O/H)+12 8.1) and high star-formation rates (SFR ). Their distinct green color is mainly due to the strong emission lines. Moreover, GPs show significant LyC radiation escape fractions (; Jaskot & Oey 2013; Izotov et al. 2016a, b) which is not common in the low-redshift Universe. The BBs are also highly star-forming dwarfs which are smaller, have even lower metallicities (log(O/H)+12 ), are closer (), and are considered smaller counterparts to GPs (Yang et al. 2017).
Most homogeneous samples of GPs and BBs (Izotov et al. 2011; McKinney et al. 2019; Jaskot et al. 2019; Brunker et al. 2020; Liu et al. 2022; Ding et al. 2023) were based on the Sloan Digital Sky Survey (SDSS). The sample of Yang et al. (2017) was based on SDSS photometry while the rest took advantage of the spectroscopic catalogs available by SDSS. The work of Liu et al. (2022) was based on the spectroscopic coverage of LAMOST (Wang et al. 1996; Su & Cui 2004), and Keel et al. (2022) has also identified some GPs with the help of HST archival data. Overall, the vast majority of known GP and BB samples are limited to the north part of the equatorial sky and relatively large distances.
Besides the properties of these sources that are known through the visible spectrum, only a few works have studied for instance their X-ray (Svoboda et al. 2019) or radio (Sebastian & Bait 2019; Borkar et al. 2024) emission, but they were limited to a small number of sources. Near-infrared (IR) observations were used by Noeske et al. (2003) to study the photometric structure of nearby compact blue dwarf galaxies (BDGs). The WISE survey (Wright et al. 2010) has also been used for the discovery of BDGs. Griffith et al. (2011) have discovered two sources with extremely red colors in mid-IR wavelengths. Chandola et al. (2023) selected 11 blue compact galaxies with bright mid-IR emission and studied their H I emission.
The majority of the previous studies have focused on high-z samples, but local samples are needed to be able to study in more detail their properties and for multi-wavelength follow-up. An extended and relatively more nearby sample of BBs will allow the statistically significant study of the BBs’ IR and visible emission, and could also serve as a base for future observations and further investigation. This work aims to expand the sample of one of the most extreme classes of SFGs, the BBs, using the Heraklion Extragalactic Catalogue (HECATE; Kovlakas et al. 2021)111https://hecate.ia.forth.gr/. Section 2 describes the selection criteria, and Section 3 shows the resulting sample, the main results regarding their visible/IR properties, and comparisons with other samples of BDGs, GPs, and BBs. A discussion based on the results is presented in Section 4, and Section 5 concludes the article. A Planck Collaboration et al. (2016) cosmology is adopted throughout the paper (, ). Unless stated otherwise, uncertainties and confidence intervals (C.Is) refer to 68%, and the size of the histogram’s bins is based on Scott’s rule (Scott 1979).
2 Selection criteria.
In order to extend the sample of BBs beyond the footprint of SDSS, we performed a search that depended on the photometric rather than the spectroscopic properties of the sources. The selection was based on HECATE which is an all-sky catalog of 204,733 galaxies within redshift ( Mpc) with more than 50% completeness in B-band luminosity up to 170 Mpc. It offers distances, sizes, positions, SFRs, stellar masses, and metallicities, as well as morphological and nuclear activity classifications along with the galaxies’ IR and optical photometry. Thus, it is perfectly suited to selecting specific types of galaxies and examining their properties. We performed our search by using the second, enhanced version of HECATEv2.0 (Kyritsis et al. in prep) which provides additional information like optical photometry from Pan-STARRS (Chambers et al. 2016), and more robust estimations of stellar masses and SFRs that were calculated using the methods of Kouroumpatzakis et al. (2023). HECATEv2.0 provides photometry through Pan-STARRS for the majority of the sources covered by this survey, down to a declination of .
We adopted the Pan-STARRS Kron and the PSF photometry which was also used for the selection since most BBs appear to be spatially compact (Yang et al. 2017). We also adopted the SDSS cModelMag and the Petrosian photometries provided by SDSS. To avoid missing BBs, which have some of the bluest colors found in galaxies, all four aforementioned photometric systems were complementary used. This allowed us to cross-test the results since on many occasions one of the different photometries may vary for various reasons (e.g., contamination from other sources, effects like varying photometric/atmospheric conditions between the separate filter observations, etc.).
In order to quantify their differences and define the final photometric scheme for the selection of the BBs, we compared the colors of the optical photometric schemes mentioned above (Figure 1). This comparison involved all the galaxies in HECATE classified as star-forming (no AGN, composite, or LINERS) with a signal-to-noise ratio higher than three (S/N ) in the g, and r bands in all four Pan-STARRS and SDSS photometries. The best agreement is between the cModelMag and Petrosian magnitudes as SDSS provided both. The standard deviation of the difference between their colors is 0.05 dex. The Pan-STARRS Kron magnitudes show good agreement on average () and the standard deviation of their difference is dex. However, galaxies based on Pan-STARRS Kron magnitudes appear to be redder for blue galaxies and bluer for red ones concerning both cModelMag and Petrosian SDSS photometries. As expected, the Pan-STARRS PSF photometry shows the largest scatter compared to the rest of the photometries. Moreover, it shows on average magnitude bluer colors compared to Kron photometry throughout the color range. The results of the linear regression fits between the colors of the different photometries are summarized in Table 1.
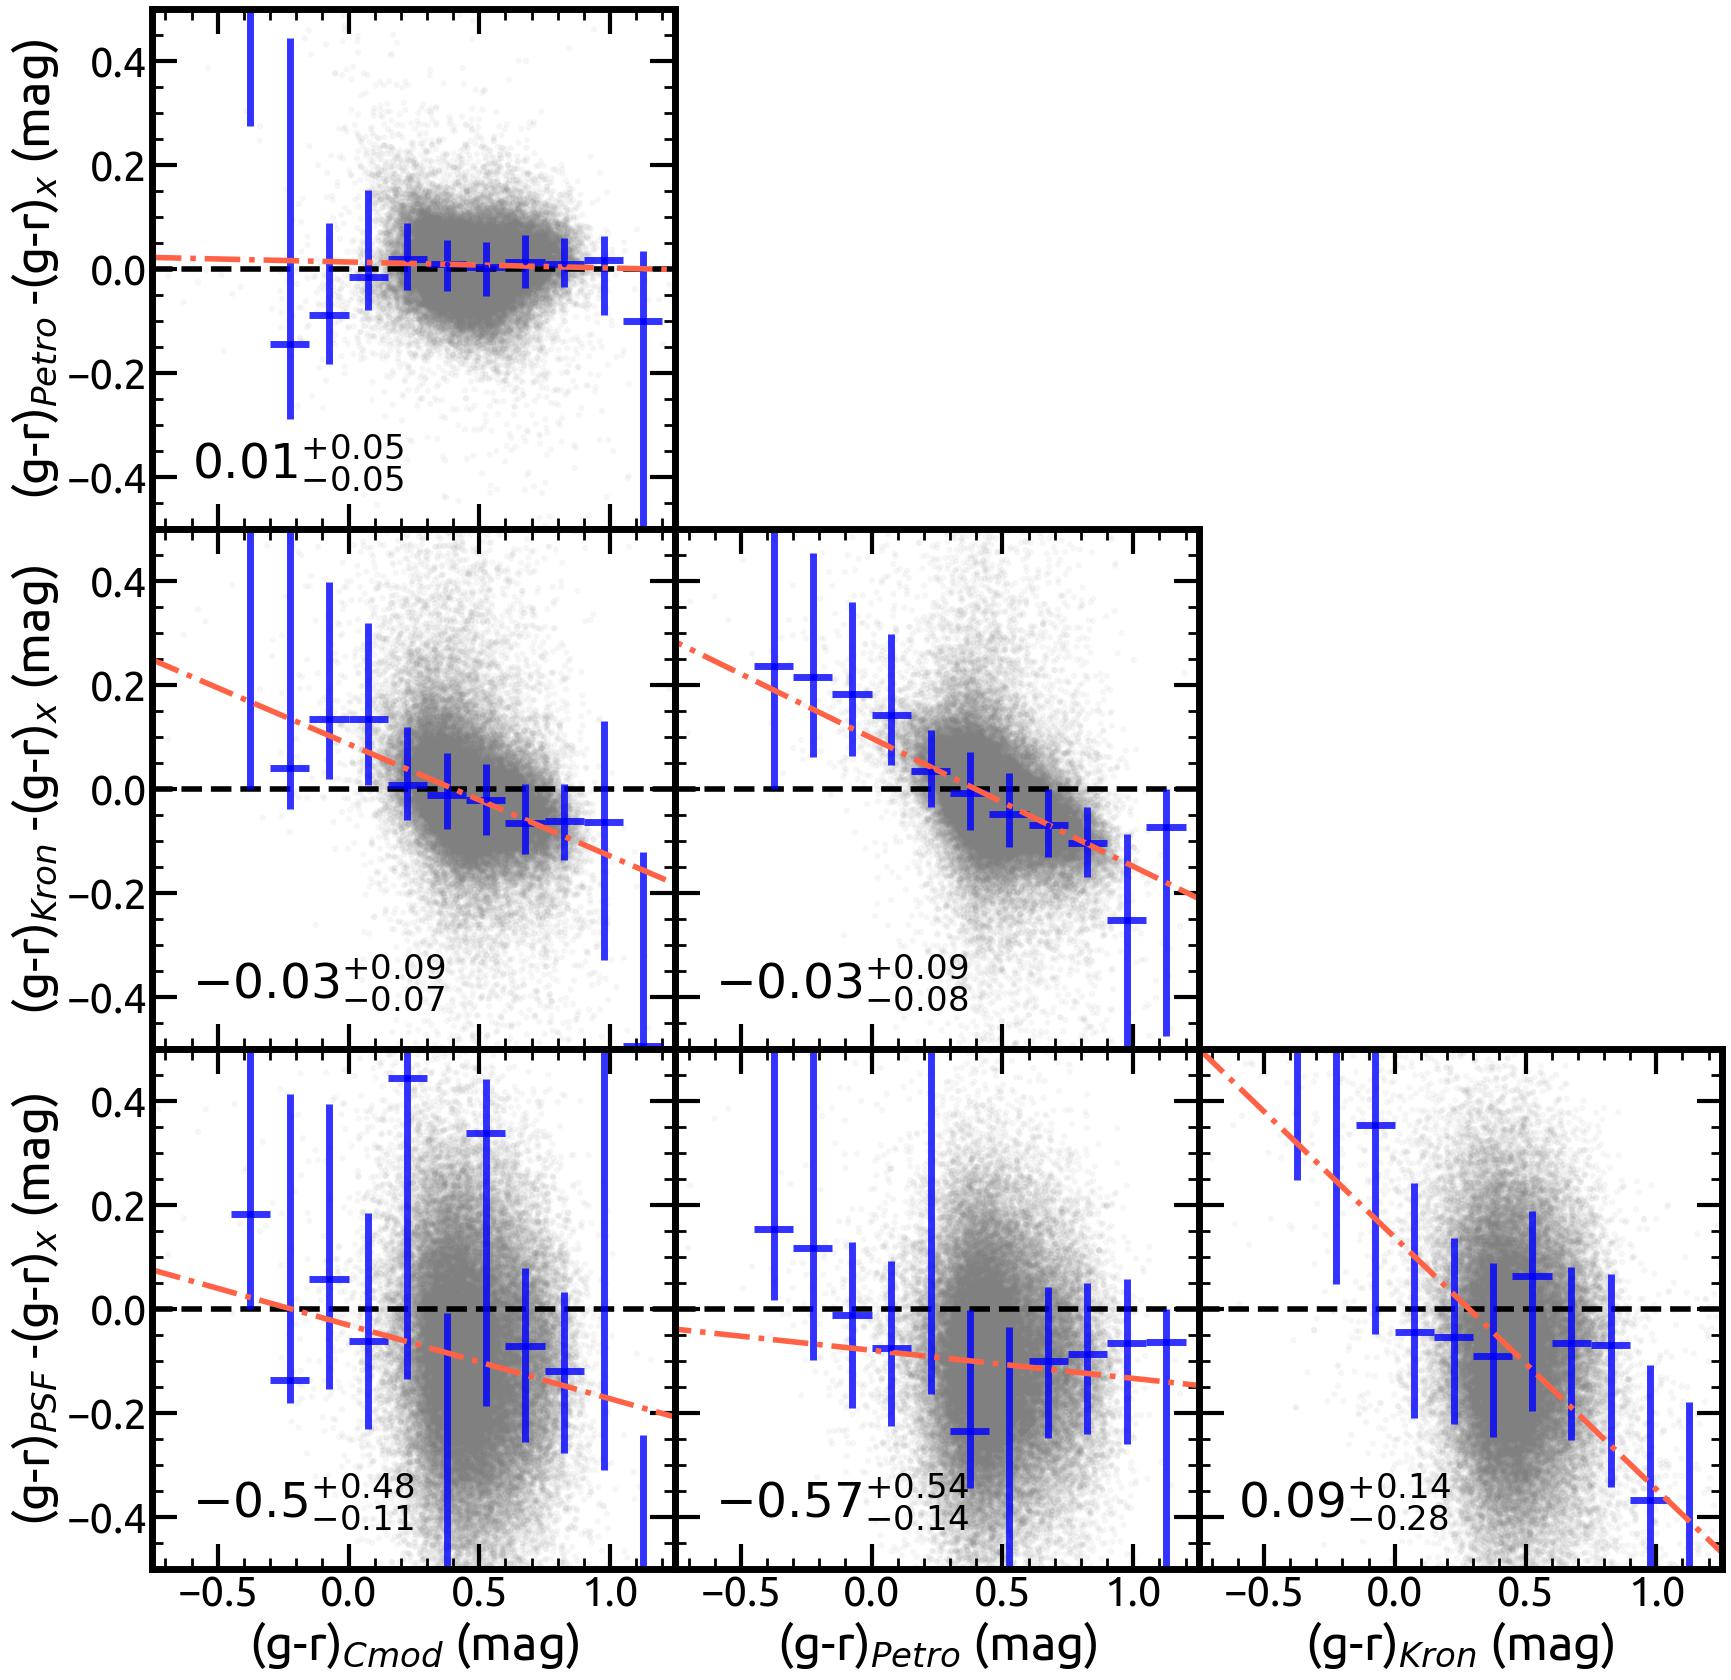
| () | () | () | |
|---|---|---|---|
| Petrosian | 0.02, 0.99 | ||
| Kron | 0.09, 0.78 | 0.1, 0.76 | |
| PSF | -0.03, 0.86 | -0.08, 0.94 | 0.07, 0.64 |
| cModelMag | Petrosian | Kron |
The cModelMag photometry corresponds to an aperture defined by a radial profile that is a linear combination of the best fit of an exponential and a de Vaucouleurs profile. Thus, because cModelMag is defined to encompass most of the light of extended sources like galaxies, it is considered the most trustworthy photometric scheme for this work and, therefore, it is used to define the selection criteria. However, to be able to expand the BB sample to parts of the sky not covered by SDSS, we also take into account sources that were measured only by Pan-STARRS.
The selection of the galaxies was based on their photometric properties following the scheme proposed by Yang et al. (2017) who, in order to find BBs, selected sources with , , , and (mag) adopting the SDSS cModelMag photometry. These criteria were defined by simulating the emission of BBs with intensive star formation and strong ionization that leads to large equivalent widths ( Å) and very young SP ages. The simulations modeled galaxies with an old SP component with age equal to 900 Myr, and one very recent starburst episode at 4 Myr with the code Starburst99 (Leitherer et al. 1999).
For this work, we allow slightly more relaxed criteria of mag which corresponds to the scatter of the comparison between the cModelMag and Kron photometries (Table 1), partially covering for photometric uncertainties, or slightly different star formation histories (SFHs) and metallicities from those assumed by Yang et al. (2017). Thus, the selection limit for the SDSS cModelMag and Petrosian photometries is (mag). Also, because Pan-STARRS Kron photometry appears redder for blue galaxies compared to SDSS (Figure 1), we further allow for mag for the selection criteria applied to Pan-STARRS photometry. This value was estimated based on the linear regression fit (Table 1) between SDSS cModelMag and Pan-STARRS Kron photometries applied to the limit (mag). We kept galaxies that fulfill these criteria simultaneously in the SDSS cModelMag and Petrosian photometries, or simultaneously in the Pan-STARRS Kron and PSF photometries. Additionally, we calculated the average colors by combining all the mentioned photometries. Sources with average colors that did not fulfill the criteria applied to Pan-STARRS photometry were removed (3 sources omitted). We also omitted sources with problematic photometry by limiting the accepted colors to and respective uncertainties . The selection criteria are summarized in Equation LABEL:eq:Selection shown in the Appendix A. This filtering process resulted in 83 sources that fulfilled the selection criteria.
Moreover, because we are interested in the IR properties of the galaxies, we omitted sources where the WISE extended source catalog flag star_contamination is true to avoid those with photometries contaminated by bright stars. This was the case for 8 sources (PGC 360, 5817, 6336, 3876, 42031, 45482, 8881, 4094118) all of which are spectroscopically confirmed stars and were removed. The final step involves visual inspection of the selected galaxies. The galaxies that were omitted through visual inspection are: PGC 46329, 48755, 4081747, 46495, 4084118, and 6723779 which are also spectroscopically confirmed stars; PGC 5060407 due to its presence in a crowded field of background and foreground sources; PGC 28757, 6741333, 6741249, 4107113, 6742056, 5059213, 6740710, 40683, and 5057032 which resemble ultra-faint galaxy candidates; PGC 5078149, 774317, 1076594, and 101538 which are blue star-forming regions that are part of significantly larger or spiral galaxies; and PGC 33553, 53905, 49767, 56870, 41771, 5082584, and 46982 which are sources that have strongly contradicting photometry between SDSS and Pan-STARRS.
3 Results
3.1 Proposed sample of Blueberry galaxies.
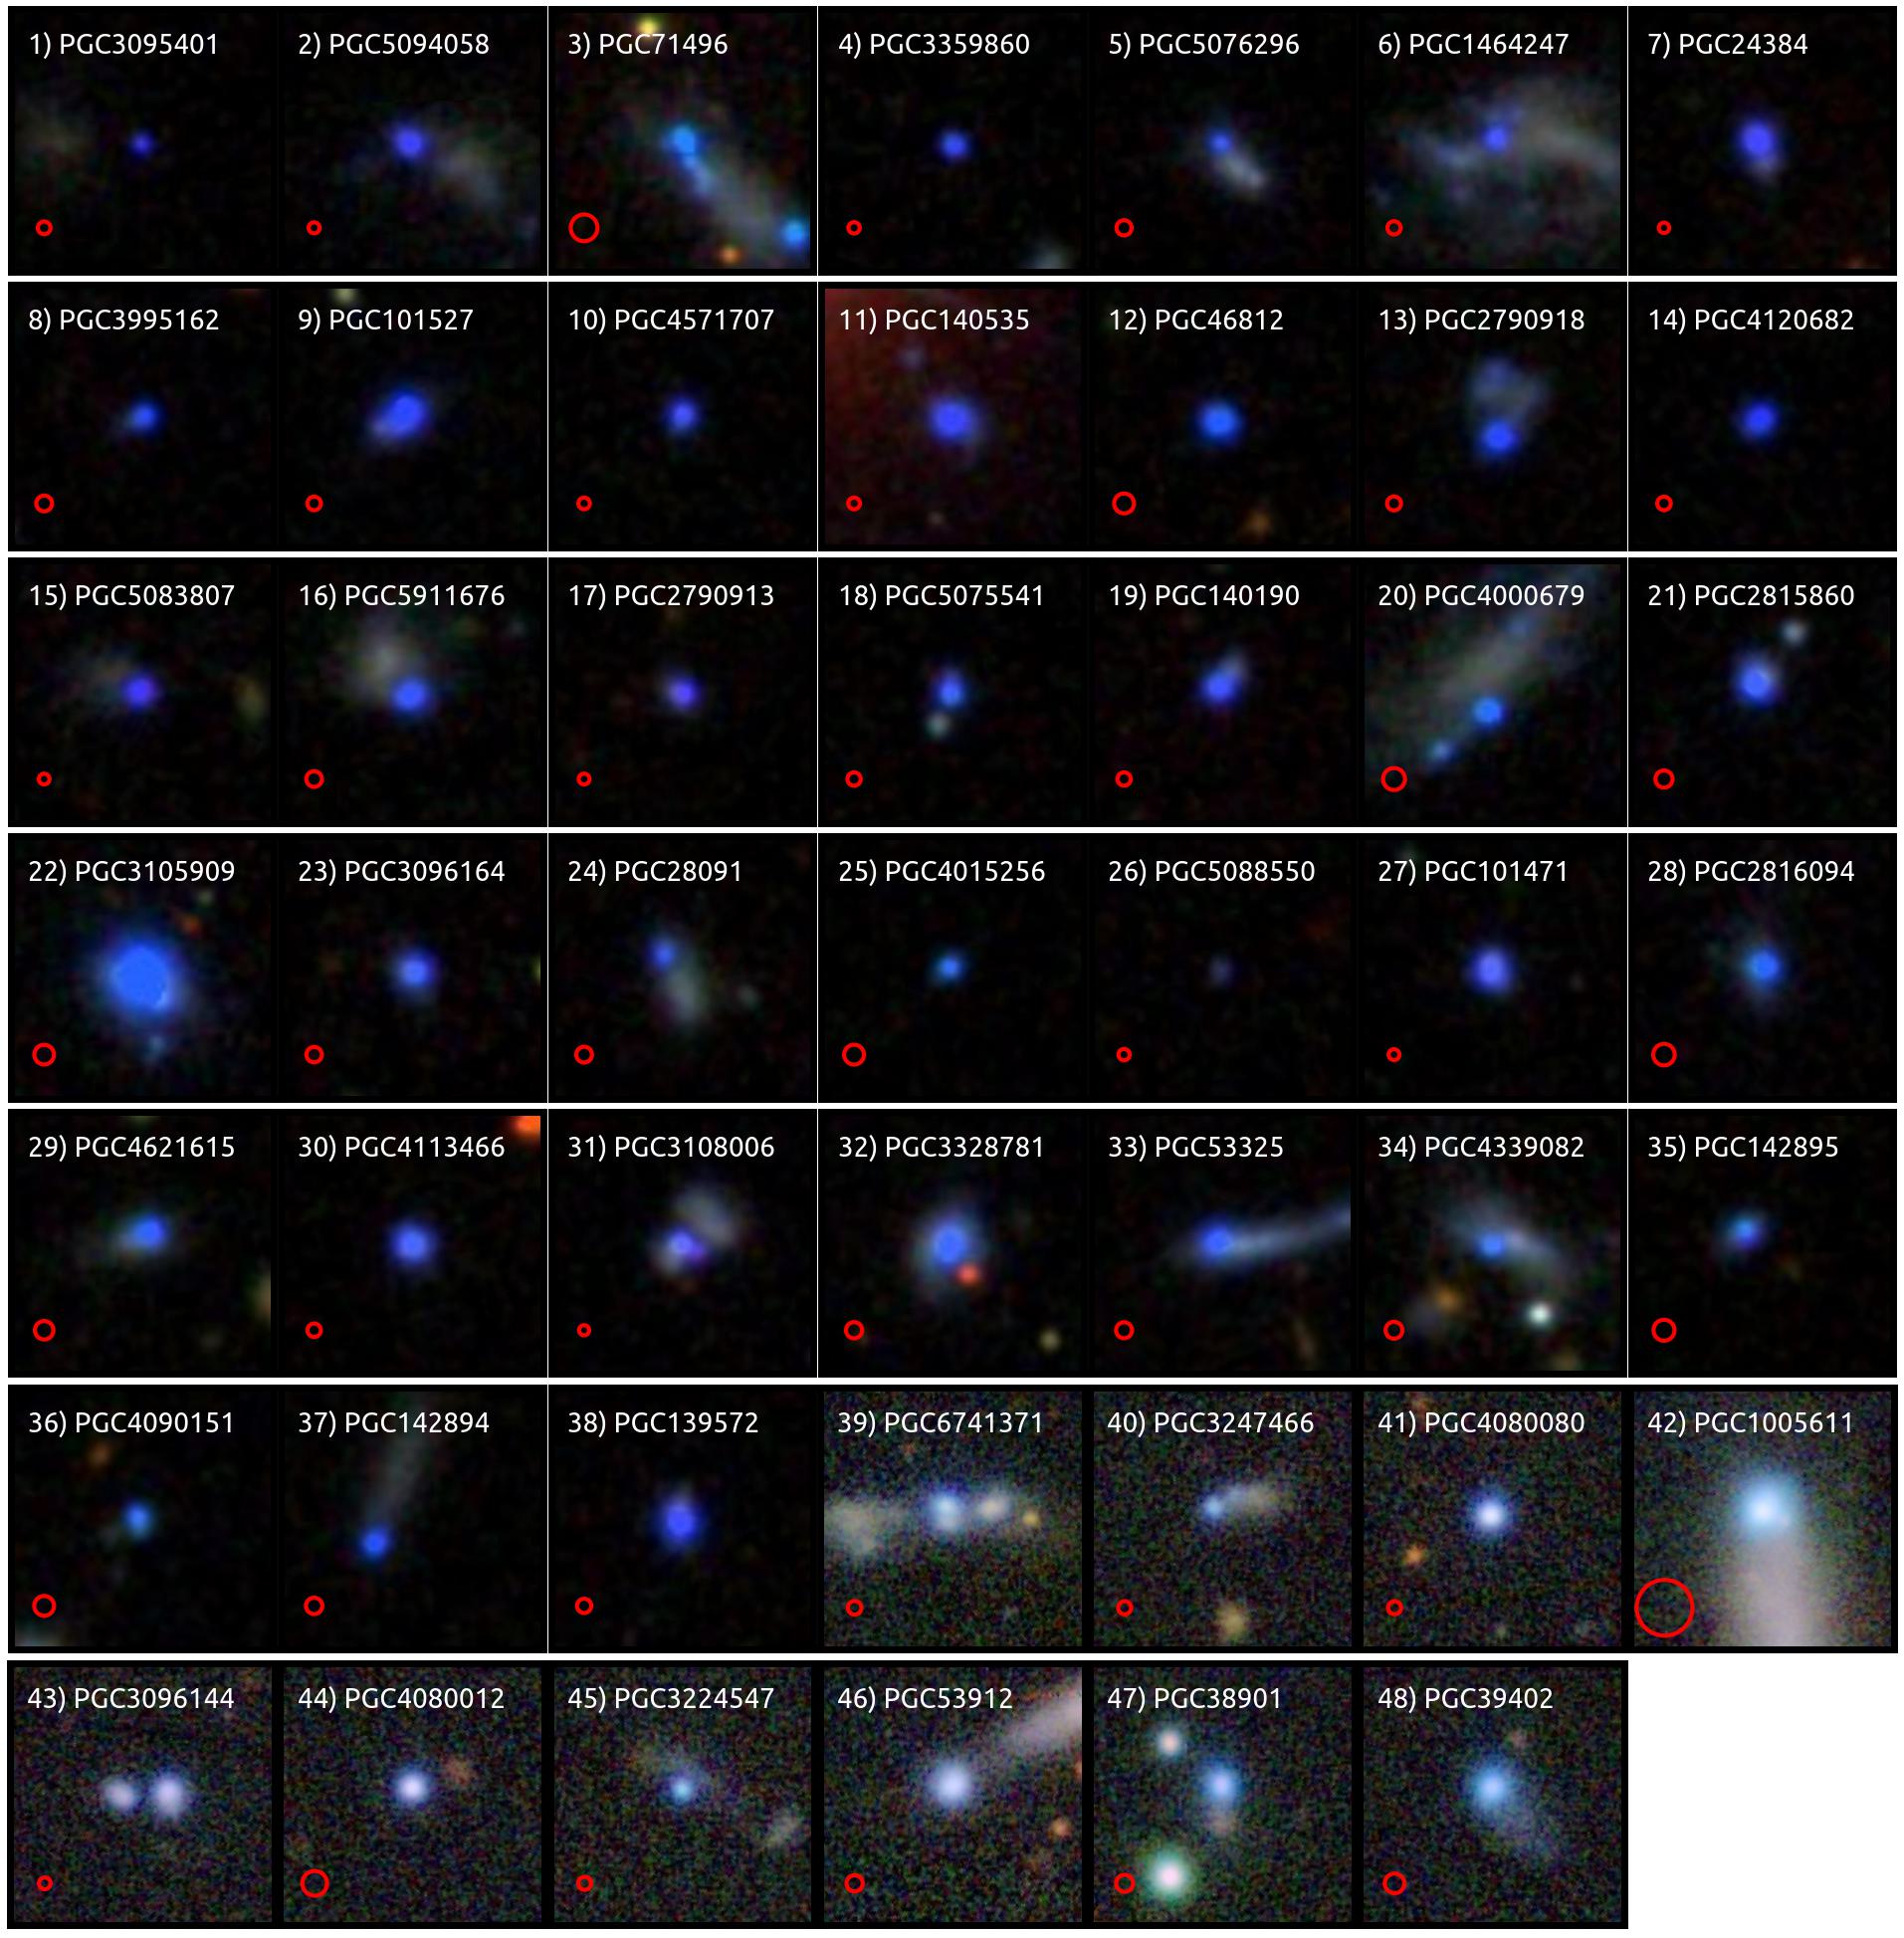
This process yielded 48 BBs, the most distant at 198 Mpc and the nearest at 19 Mpc. Table 2 reports the selected galaxies and their , and colors from the different photometries. The sources are reported in ascending order of their weighted color combining all photometries with weights equal to 1.2, 1.1, 1.0, and 0.9 for the SDSS cModelMag, SDSS Petrosian, Pan-STARRS Kron, and Pan-STARRS PSF respectively. Table 3 reports some fundamental characteristics of the galaxies like their , specific SFR (), sizes and distances, along with metallicities and EWs of the , , H, and H emission lines for sources that have spectra and were analyzed by MPA-JHU (Kauffmann et al. 2003; Brinchmann et al. 2004; Tremonti et al. 2004). Uncertainties of Tables 2 and 3 are provided in the online222Tables 2 and 3 are available in electronic form at the CDS via anonymous ftp to cdsarc.u-strasbg.fr (147.231.47.162) or via http://cdsweb.u-strasbg.fr/cgi-bin/qcat?J/A+A/ version. Figure 2 shows the optical images composed of g, r, and i-band observations of the selected sources as imaged by SDSS, or Pan-STARRS for sources not covered by SDSS.
The nearest BB found is BB 42/PGC 1005611 at 19 Mpc. The second nearest source is BB 3/PGC 71496 at 75 Mpc, and the third is BB 44/PGC 4080012 at 86 Mpc. Eight sources are common with the Yang et al. (2017) BBs. Those are the BBs PGC 3359860, 3995162, 101527, 4571707, 46812, 139572, and 4120682, 3328781 which are also part of the McKinney et al. (2019) and Jaskot et al. (2019) samples. In the following analysis, for comparisons that include Yang et al. (2017) BBs, we only consider new sources identified by this work.
Although Yang et al. (2017) reports 25 BBs at distances below 200 Mpc () 17 of them are not included in HECATE. However, 15 out of these 25 BBs have distances higher than 175 Mpc where HECATE’s completeness drops significantly. The other 8 galaxies that are included in HECATE have been successfully recognized as BBs by this selection method. The nearest BB reported by Yang et al. (2017) is at 101 Mpc while this work reports 7 galaxies below 100 Mpc. The mode of the distribution of distances of Yang et al. (2017) BBs is Mpc while the mode of the distribution of distances of BBs in this work is Mpc.
| ID | PGC | R.A. | Dec. | |||||||||
|---|---|---|---|---|---|---|---|---|---|---|---|---|
| * | cMod | Petro | Kron | PSF | cMod | Petro | Kron | PSF | ||||
| (Deg.) | (Deg.) | (mag) | (mag) | (mag) | (mag) | (mag) | (mag) | (mag) | (mag) | (mag) | ||
| 1 | 3095401 | 2.4156 | 2.5718 | 21.3 | -1.4 | -1.4 | -0.8 | -0.6 | 0.1 | 0.1 | -0.8 | -0.9 |
| 2 | 5094058 | 33.277565 | 0.936803 | 18.8 | -1.2 | -1.2 | -0.4 | -0.6 | 0.3 | 0.2 | -0.2 | -0.6 |
| 3 | 71496 | 351.935088 | -2.013199 | 18.7 | -0.7 | -0.7 | -1.2 | -0.5 | -1.1 | -1.0 | -0.2 | -0.6 |
| 4 | 3359860† | 221.172456 | 4.16165 | 20.1 | -0.9 | -0.9 | -0.5 | -0.4 | 0.0 | 0.0 | -0.5 | -0.6 |
| 5 | 5076296 | 48.250193 | 0.103381 | 20.1 | -0.7 | -0.9 | -1.3 | -0.1 | -0.4 | -1.0 | ||
| 6 | 1464247 | 229.631954 | 14.677362 | 17.2 | -1.1 | -1.1 | 0.0 | -0.6 | 0.1 | 0.1 | -0.1 | -0.5 |
| 7 | 24384 | 130.12455 | 47.119511 | 18.0 | -0.9 | -0.9 | -0.3 | -0.4 | 0.2 | 0.2 | -0.4 | -0.5 |
| 8 | 3995162† | 208.856988 | 46.86428 | 19.9 | -0.8 | -0.8 | -0.5 | -0.6 | -0.1 | -0.4 | -0.6 | -1.0 |
| 9 | 101527† | 227.392233 | 37.529368 | 17.9 | -0.8 | -0.9 | -0.5 | -0.5 | -0.1 | -0.1 | -0.5 | -0.8 |
| 10 | 4571707† | 126.418617 | 18.771452 | 19.6 | -0.8 | -0.9 | -0.5 | -0.3 | 0.0 | 0.0 | -0.4 | -0.6 |
| 11 | 140535 | 236.431458 | 8.967036 | 17.3 | -0.9 | -0.9 | -0.4 | -0.4 | 0.1 | 0.0 | -0.5 | -0.6 |
| 12 | 46812† | 200.947742 | -1.54774 | 18.9 | -0.7 | -0.7 | -0.6 | -0.6 | -0.6 | -0.7 | -0.8 | -0.8 |
| 13 | 2790918 | 172.6671 | 43.7327 | 18.8 | -0.6 | -0.9 | -0.6 | -0.5 | -0.1 | -0.2 | -0.8 | |
| 14 | 4120682†‡ | 242.043072 | 35.469386 | 19.8 | -1.1 | -1.2 | -0.2 | -0.2 | ||||
| 15 | 5083807 | 145.684329 | 41.17204 | 18.9 | -0.4 | -0.9 | -0.4 | -0.7 | 0.0 | 0.5 | -0.2 | -0.3 |
| 16 | 5911676 | 217.452528 | -1.16935 | 18.1 | -0.8 | -0.8 | -0.2 | -0.5 | -0.3 | -0.3 | -0.4 | -0.6 |
| 17 | 2790913 | 168.48495 | 44.308899 | 19.2 | -0.6 | -0.8 | -0.4 | -0.5 | 0.3 | 0.4 | -0.1 | -0.3 |
| 18 | 5075541 | 345.541623 | 0.82752 | 19.1 | -0.6 | -0.7 | -0.3 | -0.5 | -0.2 | -0.2 | -0.1 | -0.5 |
| 19 | 140190 | 203.438757 | 28.753155 | 18.6 | -0.6 | -0.7 | -0.3 | -0.4 | 0.0 | 0.0 | -0.3 | -0.6 |
| 20 | 4000679 | 169.686258 | 2.908797 | 18.8 | -0.5 | -0.6 | -0.9 | -0.6 | -0.8 | -0.5 | ||
| 21 | 2815860 | 137.78565 | 54.180801 | 17.9 | -0.6 | -0.6 | -0.3 | -0.3 | -0.1 | -0.3 | -0.4 | -0.5 |
| 22 | 3105909 | 193.27488 | -3.216273 | 15.6 | -0.5 | -0.5 | -0.3 | -0.5 | -0.6 | -0.6 | -0.5 | -0.6 |
| 23 | 3096164 | 189.189748 | 26.301151 | 18.5 | -0.5 | -0.6 | -0.3 | -0.5 | 0.0 | -0.2 | -0.3 | -0.4 |
| 24 | 28091 | 146.69415 | 55.951801 | 19.5 | -0.5 | -0.6 | -0.2 | -0.4 | -0.1 | -0.2 | -0.8 | -0.4 |
| 25 | 4015256 | 121.991636 | 34.244234 | 19.7 | -0.4 | -0.5 | -0.3 | -0.4 | -0.6 | -0.6 | -0.4 | -0.7 |
| 26 | 5088550 | 23.835057 | 20.153192 | 21.6 | -0.4 | -0.4 | -0.4 | -0.4 | 0.3 | 0.1 | 0.0 | -0.3 |
| 27 | 101471 | 186.153029 | 37.41013 | 18.2 | -0.6 | -0.6 | -0.2 | -0.2 | 0.1 | 0.1 | -0.3 | -0.4 |
| 28 | 2816094 | 215.661924 | 54.235839 | 18.1 | -0.4 | -0.5 | -0.3 | -0.5 | -0.2 | -0.6 | -0.4 | -0.7 |
| 29 | 4621615 | 202.351482 | 22.61984 | 18.1 | -0.3 | -0.5 | -0.3 | -0.5 | -0.1 | -0.3 | -0.3 | -0.7 |
| 30 | 4113466 | 215.928689 | 22.958003 | 18.2 | -0.5 | -0.5 | -0.2 | -0.2 | 0.0 | -0.1 | -0.4 | -0.5 |
| 31 | 3108006 | 222.945728 | -0.945494 | 18.0 | -0.4 | -0.5 | -0.3 | -0.3 | 0.1 | 0.1 | 0.0 | -0.1 |
| 32 | 3328781†‡ | 222.022369 | -1.182752 | 16.8 | -0.4 | -0.5 | -0.2 | -0.4 | -0.2 | -0.2 | -0.3 | -0.5 |
| 33 | 53325 | 223.775214 | 38.137962 | 17.7 | -0.4 | -0.5 | -0.2 | -0.3 | -0.1 | -0.2 | -0.2 | -0.4 |
| 34 | 4339082 | 190.908092 | 17.933047 | 17.5 | -0.4 | -0.5 | -0.1 | -0.5 | -0.4 | -0.4 | ||
| 35 | 142895 | 185.254236 | 30.62877 | 19.1 | -0.2 | -0.4 | -0.3 | -0.5 | -0.2 | -0.4 | -0.2 | -0.5 |
| 36 | 4090151 | 145.72608 | 34.069969 | 19.5 | -0.2 | -0.4 | -0.3 | -0.4 | -0.4 | -0.4 | -0.3 | -0.6 |
| 37 | 142894 | 183.752147 | 29.918301 | 19.5 | -0.7 | -0.4 | -0.7 | -0.6 | ||||
| 38 | 139572† | 170.95341 | 20.841173 | 18.0 | -0.4 | -0.8 | -0.5 | -0.4 | ||||
| 39 | 6741371 | 39.545832 | 33.939447 | 18.3 | -0.3 | -0.8 | -1.1 | -0.7 | ||||
| 40 | 3247466 | 337.71915 | -23.9214 | 19.8 | -0.3 | -0.6 | -0.6 | -0.5 | ||||
| 41 | 4080080 | 338.399053 | -26.470739 | 18.4 | -0.4 | -0.4 | -0.4 | -0.3 | ||||
| 42 | 1005611 | 42.065712 | -8.290536 | 16.9 | -0.4 | -0.4 | -0.9 | -1.0 | ||||
| 43 | 3096144 | 187.0746 | -11.5594 | 18.9 | -0.3 | -0.5 | -0.1 | -0.2 | ||||
| 44 | 4080012 | 36.612792 | -11.416837 | 18.8 | -0.4 | -0.4 | -0.3 | -0.3 | ||||
| 45 | 3224547 | 339.259787 | -28.878851 | 19.4 | -0.3 | -0.4 | -0.2 | -0.9 | ||||
| 46 | 53912 | 226.5405 | 39.178501 | 18.3 | -0.3 | -0.4 | -0.4 | -0.5 | ||||
| 47 | 38901 | 183.082966 | -28.813061 | 18.4 | -0.3 | -0.4 | -0.7 | -0.8 | ||||
| 48 | 39402 | 184.321209 | -28.042389 | 18.2 | -0.4 | -0.3 | -0.8 | -1.1 |
| ID | redshift. | Dist. | size | log | log sSFR | metallicity | log | Compact | ||||
|---|---|---|---|---|---|---|---|---|---|---|---|---|
| MPA | HEC/S | HEC | SED | SED | MPA | MPA | MPA | MPA | MPA | FADO | ||
| (Mpc) | (kpc) | (12+log(O/H)) | (Å) | (Å) | (Å) | (Å) | ||||||
| 1 | 157 | 6.9 | -7.4 | N | ||||||||
| 2 | 0.0399 | 182 | 1.9 | 7.0 | -7.0 | 8.6 | 89 | 191 | 1194 | 1000 | -15.8 | N |
| 3 | 75 | 3.9 | 6.4 | -6.8 | N | |||||||
| 4 | 0.0388 | 176 | 2.0 | 7.3 | -7.6 | 7.7 | 54 | 183 | 1186 | 841 | -16.2 | Y |
| 5 | 0.0292 | 131 | 4.1 | 5.9 | -6.3 | 7.9 | 31 | 125 | 711 | 577 | N | |
| 6 | 151 | 8.4 | 7.0 | -7.2 | N | |||||||
| 7 | 0.0421 | 192 | 5.1 | 7.6 | -6.4 | 7.8 | 49 | 202 | 1143 | 1028 | -15.3 | Y |
| 8 | 0.0281 | 127 | 2.5 | 7.2 | -7.7 | 32 | 230 | 1119 | 1038 | -16.2 | Y | |
| 9 | 0.0325 | 147 | 4.9 | 7.8 | -7.1 | 7.9 | 64 | 236 | 1583 | 1348 | -15.4 | Y |
| 10 | 0.038 | 172 | 3.2 | 6.8 | -6.5 | 7.8 | 49 | 195 | 1202 | 1283 | -15.9 | Y |
| 11 | 0.0377 | 171 | 1.8 | 8.2 | -7.5 | 7.8 | 76 | 193 | 1103 | 1086 | -15.0 | Y |
| 12 | 0.0225 | 101 | 1.4 | 6.4 | -6.9 | 7.9 | 251 | 1896 | 1460 | -15.6 | Y | |
| 13 | 143 | 7.6 | -8.4 | N | ||||||||
| 14 | 0.0327 | 148 | 1.9 | 7.3 | -7.4 | 7.9 | 36 | 289 | 2062 | 1296 | -15.8 | Y |
| 15 | 187 | 2.4 | 7.9 | -7.7 | N | |||||||
| 16 | 128 | 4.8 | 7.1 | -6.4 | N | |||||||
| 17 | 185 | 7.8 | -7.6 | Y | ||||||||
| 18 | 0.0331 | 150 | 2.0 | 7.0 | -7.1 | 7.7 | 60 | 168 | 856 | 853 | -15.7 | Y |
| 19 | 150 | 2.4 | 7.6 | -7.5 | Y | |||||||
| 20 | 0.0203 | 91 | 4.3 | 7.0 | -7.4 | 8.1 | 296 | 1893 | 1284 | -16.0 | N | |
| 21 | 116 | 2.1 | 7.1 | -6.9 | Y | |||||||
| 22 | 0.0227 | 102 | 5.4 | 8.3 | -6.6 | 237 | -14.7 | Y | ||||
| 23 | 130 | 3.3 | 7.8 | -8.1 | Y | |||||||
| 24 | 126 | 6.4 | 6.4 | -7.0 | N | |||||||
| 25 | 0.0224 | 101 | 1.6 | 6.2 | -6.9 | 7.9 | 255 | 1301 | 1279 | Y | ||
| 26 | 177 | 2.1 | 6.7 | -8.0 | Y | |||||||
| 27 | 0.0404 | 184 | 2.7 | 7.7 | -7.1 | 7.9 | 54 | 104 | 583 | 548 | -15.7 | Y |
| 28 | 93 | 3.4 | 8.1 | -8.7 | Y | |||||||
| 29 | 108 | 7.7 | -7.8 | Y | ||||||||
| 30 | 0.0328 | 148 | 2.2 | 7.4 | -7.5 | 7.8 | 50 | 129 | 638 | 743 | -15.2 | Y |
| 31 | 0.0433 | 197 | 3.4 | 7.9 | -7.1 | 8.1 | 79 | 76 | 362 | 379 | -15.7 | N |
| 32 | 0.0274 | 123 | 5.0 | 8.8 | -8.0 | 8.0 | 73 | 148 | 1005 | 792 | -15.1 | Y |
| 33 | 0.0277 | 125 | 3.5 | 7.8 | -8.0 | 8.6 | 75 | 132 | 839 | 703 | -15.6 | N |
| 34 | 0.0263 | 118 | 7.0 | 7.0 | -7.0 | 8.3 | 134 | 649 | 685 | -16.1 | N | |
| 35 | 95 | 7.4 | -8.0 | Y | ||||||||
| 36 | 0.0225 | 101 | 1.1 | 6.6 | -7.1 | 7.8 | 168 | 883 | 795 | -15.9 | Y | |
| 37 | 122 | 6.5 | -7.1 | N | ||||||||
| 38 | 140 | 2.9 | 7.7 | -6.3 | Y | |||||||
| 39 | 155 | 6.9 | -6.4 | N | ||||||||
| 40 | 161 | 4.6 | 6.6 | -7.0 | N | |||||||
| 41 | 162 | 5.4 | 7.2 | -7.2 | Y | |||||||
| 42 | 18 | 1.3 | 7.1 | -8.7 | N | |||||||
| 43 | 181 | 5.2 | 7.7 | -8.0 | N | |||||||
| 44 | 85 | 2.7 | 6.8 | -7.0 | Y | |||||||
| 45 | 162 | 4.5 | 6.7 | -6.5 | N | |||||||
| 46 | 130 | 2.1 | 7.4 | -7.6 | N | |||||||
| 47 | 124 | 1.3 | 7.3 | -7.0 | Y | |||||||
| 48 | 107 | 4.0 | 6.9 | -7.1 | N |
-
•
MPA refers to results provided by MPA-JHU, HEC to HECATE, S to spectral fitting, and SED to SED fitting.
-
•
Distances are as reported in HECATE except for objects with spectroscopic observations where distances are based on their redshift.
-
•
Y=Yes, and N=No if the BB is compact based on visual inspection.
-
•
Uncertainties are provided in the electronic form of the table.
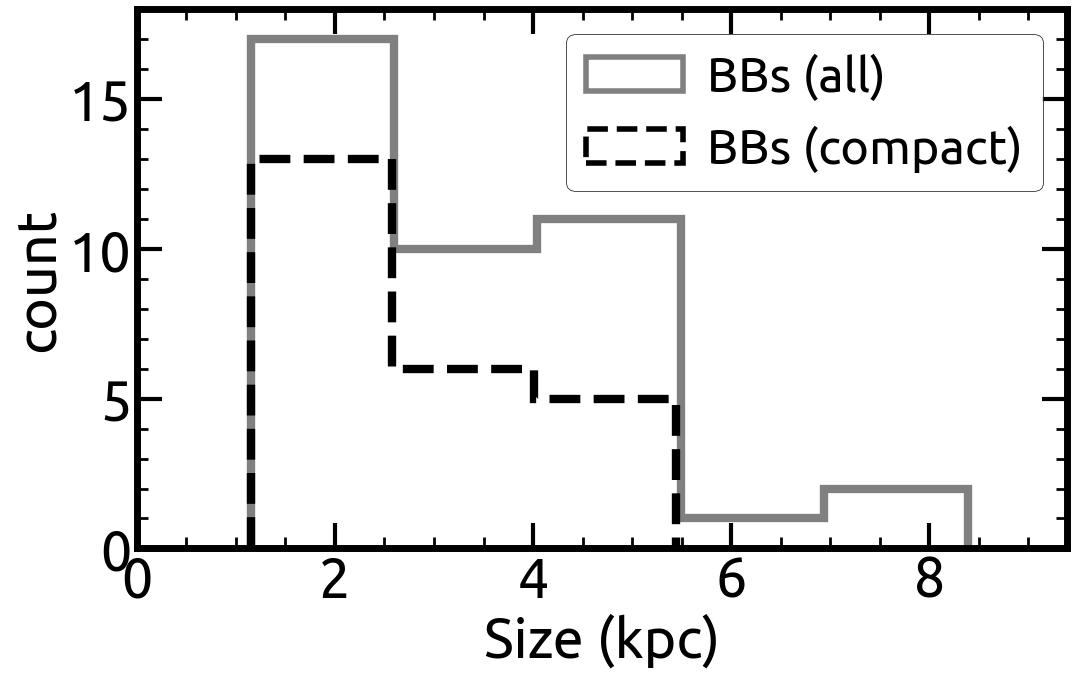
3.2 Sizes and morphology
The size distribution of the selected BBs is shown in Figure 3. The sizes were estimated based on the major axes reported in HECATE, and distances of the galaxies as reported in Table 3 The mode of their size distribution is kpc. Visual inspection of this work’s BBs (Figure 2) shows that the majority of BBs appear to be compact and isolated sources with a spherical morphology. However, some sources (BBs 1, 2, 3, 5, 6, 13, 15, 16, 20, 24, 31, 33, 34, 37, 39, 40, 42, 43, 45, 46, 48) show extended morphology. Some of these BBs may be blue star-forming regions that are part of a slightly larger galaxy where a part of it has less SFR in comparison (e.g., BBs 3, 5, 6, 33, 34, 42). For instance, this is indeed the case for BB 5 which has spectroscopic observations for the bluest ( Å; north-east), and the less-intensive ( Å; south-west) regions of the source, both of which share the same redshift. The optical and IR photometries correspond to the full extent of the galaxies, thus, these sources fulfill the selection criteria even when accounting for their less intensive regions. In some cases, nearby angular-projection sources may be background, more distant, and unrelated galaxies (e.g., possibly BB 46). Spectroscopic observations at different locations on the surface of these extended features would be required to identify whether these regions belong to these galaxies.
The mode and C.Is. of the distribution of distances for the compact BBs is (Mpc), and for the ones with extended features is (Mpc). Therefore, we do not find a strong dependence on whether the BBs appear compact due to the combination of large distances and their small overall size. However, the two nearest sources show extended morphology (BBs 3, and 42), Moreover, some recent studies have shown that some spatially resolved GP analogs show irregular morphology (e.g., Mrk 71 at 3.4 Mpc; Micheva et al. 2017) while deep HST observations also revealed extended structures in GPs (e.g., Jaskot et al. 2019).
The three largest reported BBs (6, 34, and 24) show extended features. However, among the largest are BBs 22 and 41, both having a size of 5.4 kpc, which appear as compact sources. However, these are exceptional sources as the mode of the size distribution of compact BBs is kpc. A unique source is BB 43 which appears to be a binary BB galaxy comprised of two compact sources that otherwise seem to be isolated from other nearby galaxies. Unfortunately, there are no spectra available for BB 43 while its photometry accounts for both sources.
3.3 Spectral energy distribution fitting
To homogeneously estimate stellar masses and SFRs for all the reported BBs, we performed spectral energy distribution (SED) fitting taking advantage of the multiwavelength photometric coverage of the sources. In addition to the visible SDSS, Pan-STARRS, and IR WISE the sources were cross-matched with the GALEX extended source catalog (Martin et al. 2005) in order to include UV photometry. The Blueberry galaxies BB 1, 3, 38, 42, 45, and 46 were not detected by GALEX in any of the AIS, GII, or MIS surveys.
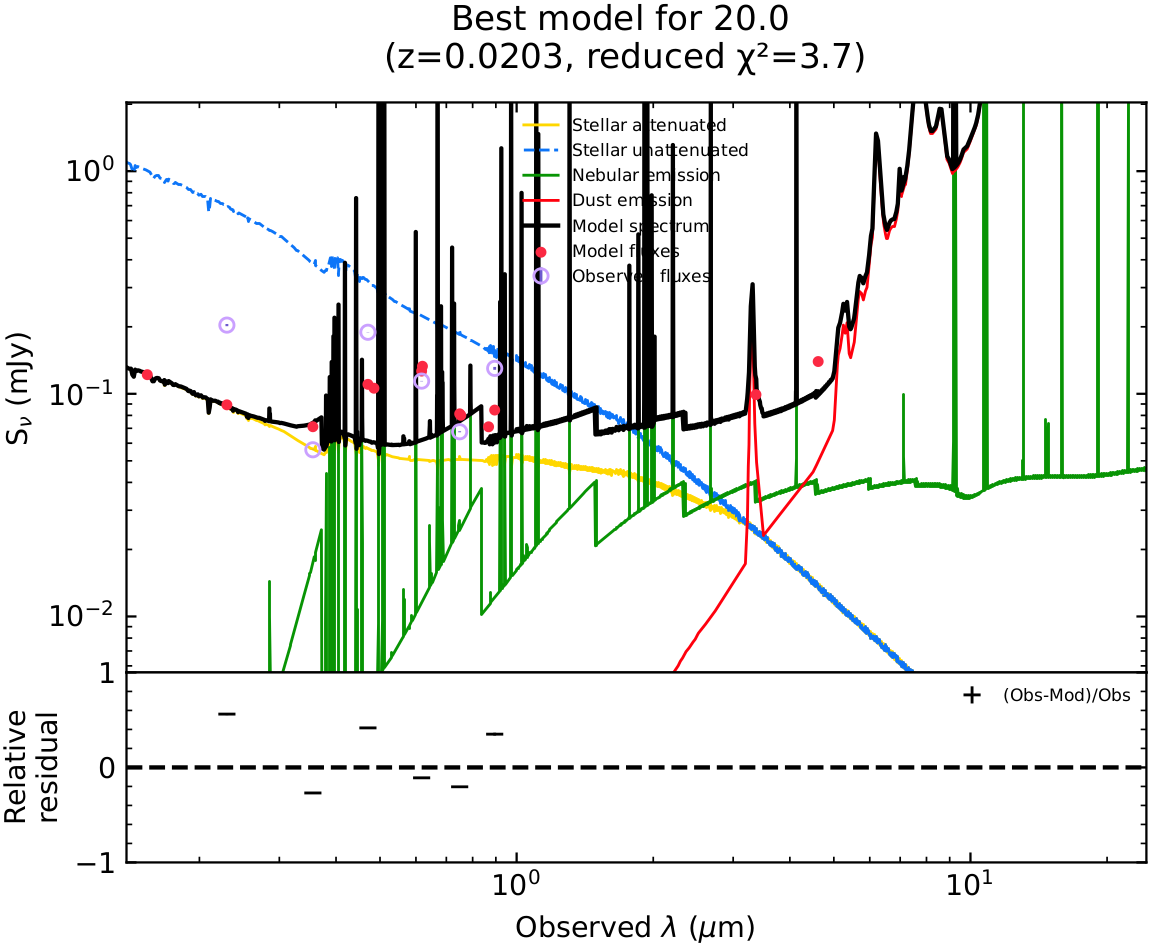
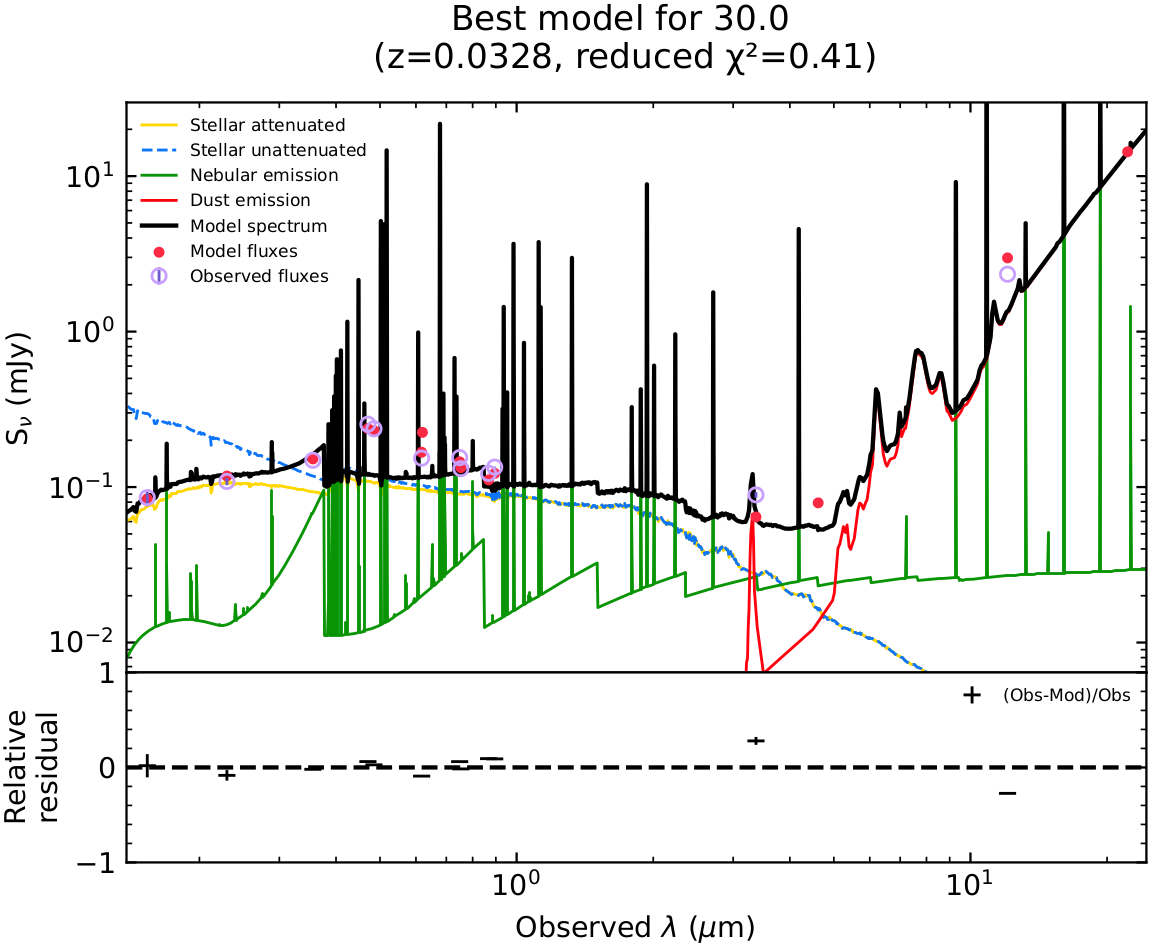
The SED fitting was performed with the updated version (Yang et al. 2022) of the widely used code CIGALE (Burgarella et al. 2005; Noll et al. 2009; Boquien et al. 2019). Particularly, we used the sfhdelayed, bc03, nebular, dustatt_modified_starburst, redshifting, and dale2014 modules covering a wide range of the parameter space. We focused the parameter grid on low-metallicity, and high sSFR galaxies, which is the case of BBs. For instance, the sfhdelayed module f_burst parameter which refers to the relative strength of the recent star-formation burst, was allowed to be even up to 0.99 and the age_burst down to 1 Myr. We also allowed for a 10% systematic uncertainty in the observed fluxes. All sources were fitted with components only related to star formation. Overall, the applied grid resulted in 5,225,472 models for each BB galaxy, and the best fit was chosen based on the minimum reduced- (). All sources had good fits with average and highest for BB 20. However, our SFR and estimations were not based on the best-fit model but on their -weighted probability density functions (PDFs). Figure 12 shows the SED plots of BB 20 and BB 30 as indicative of the SED fitting process.
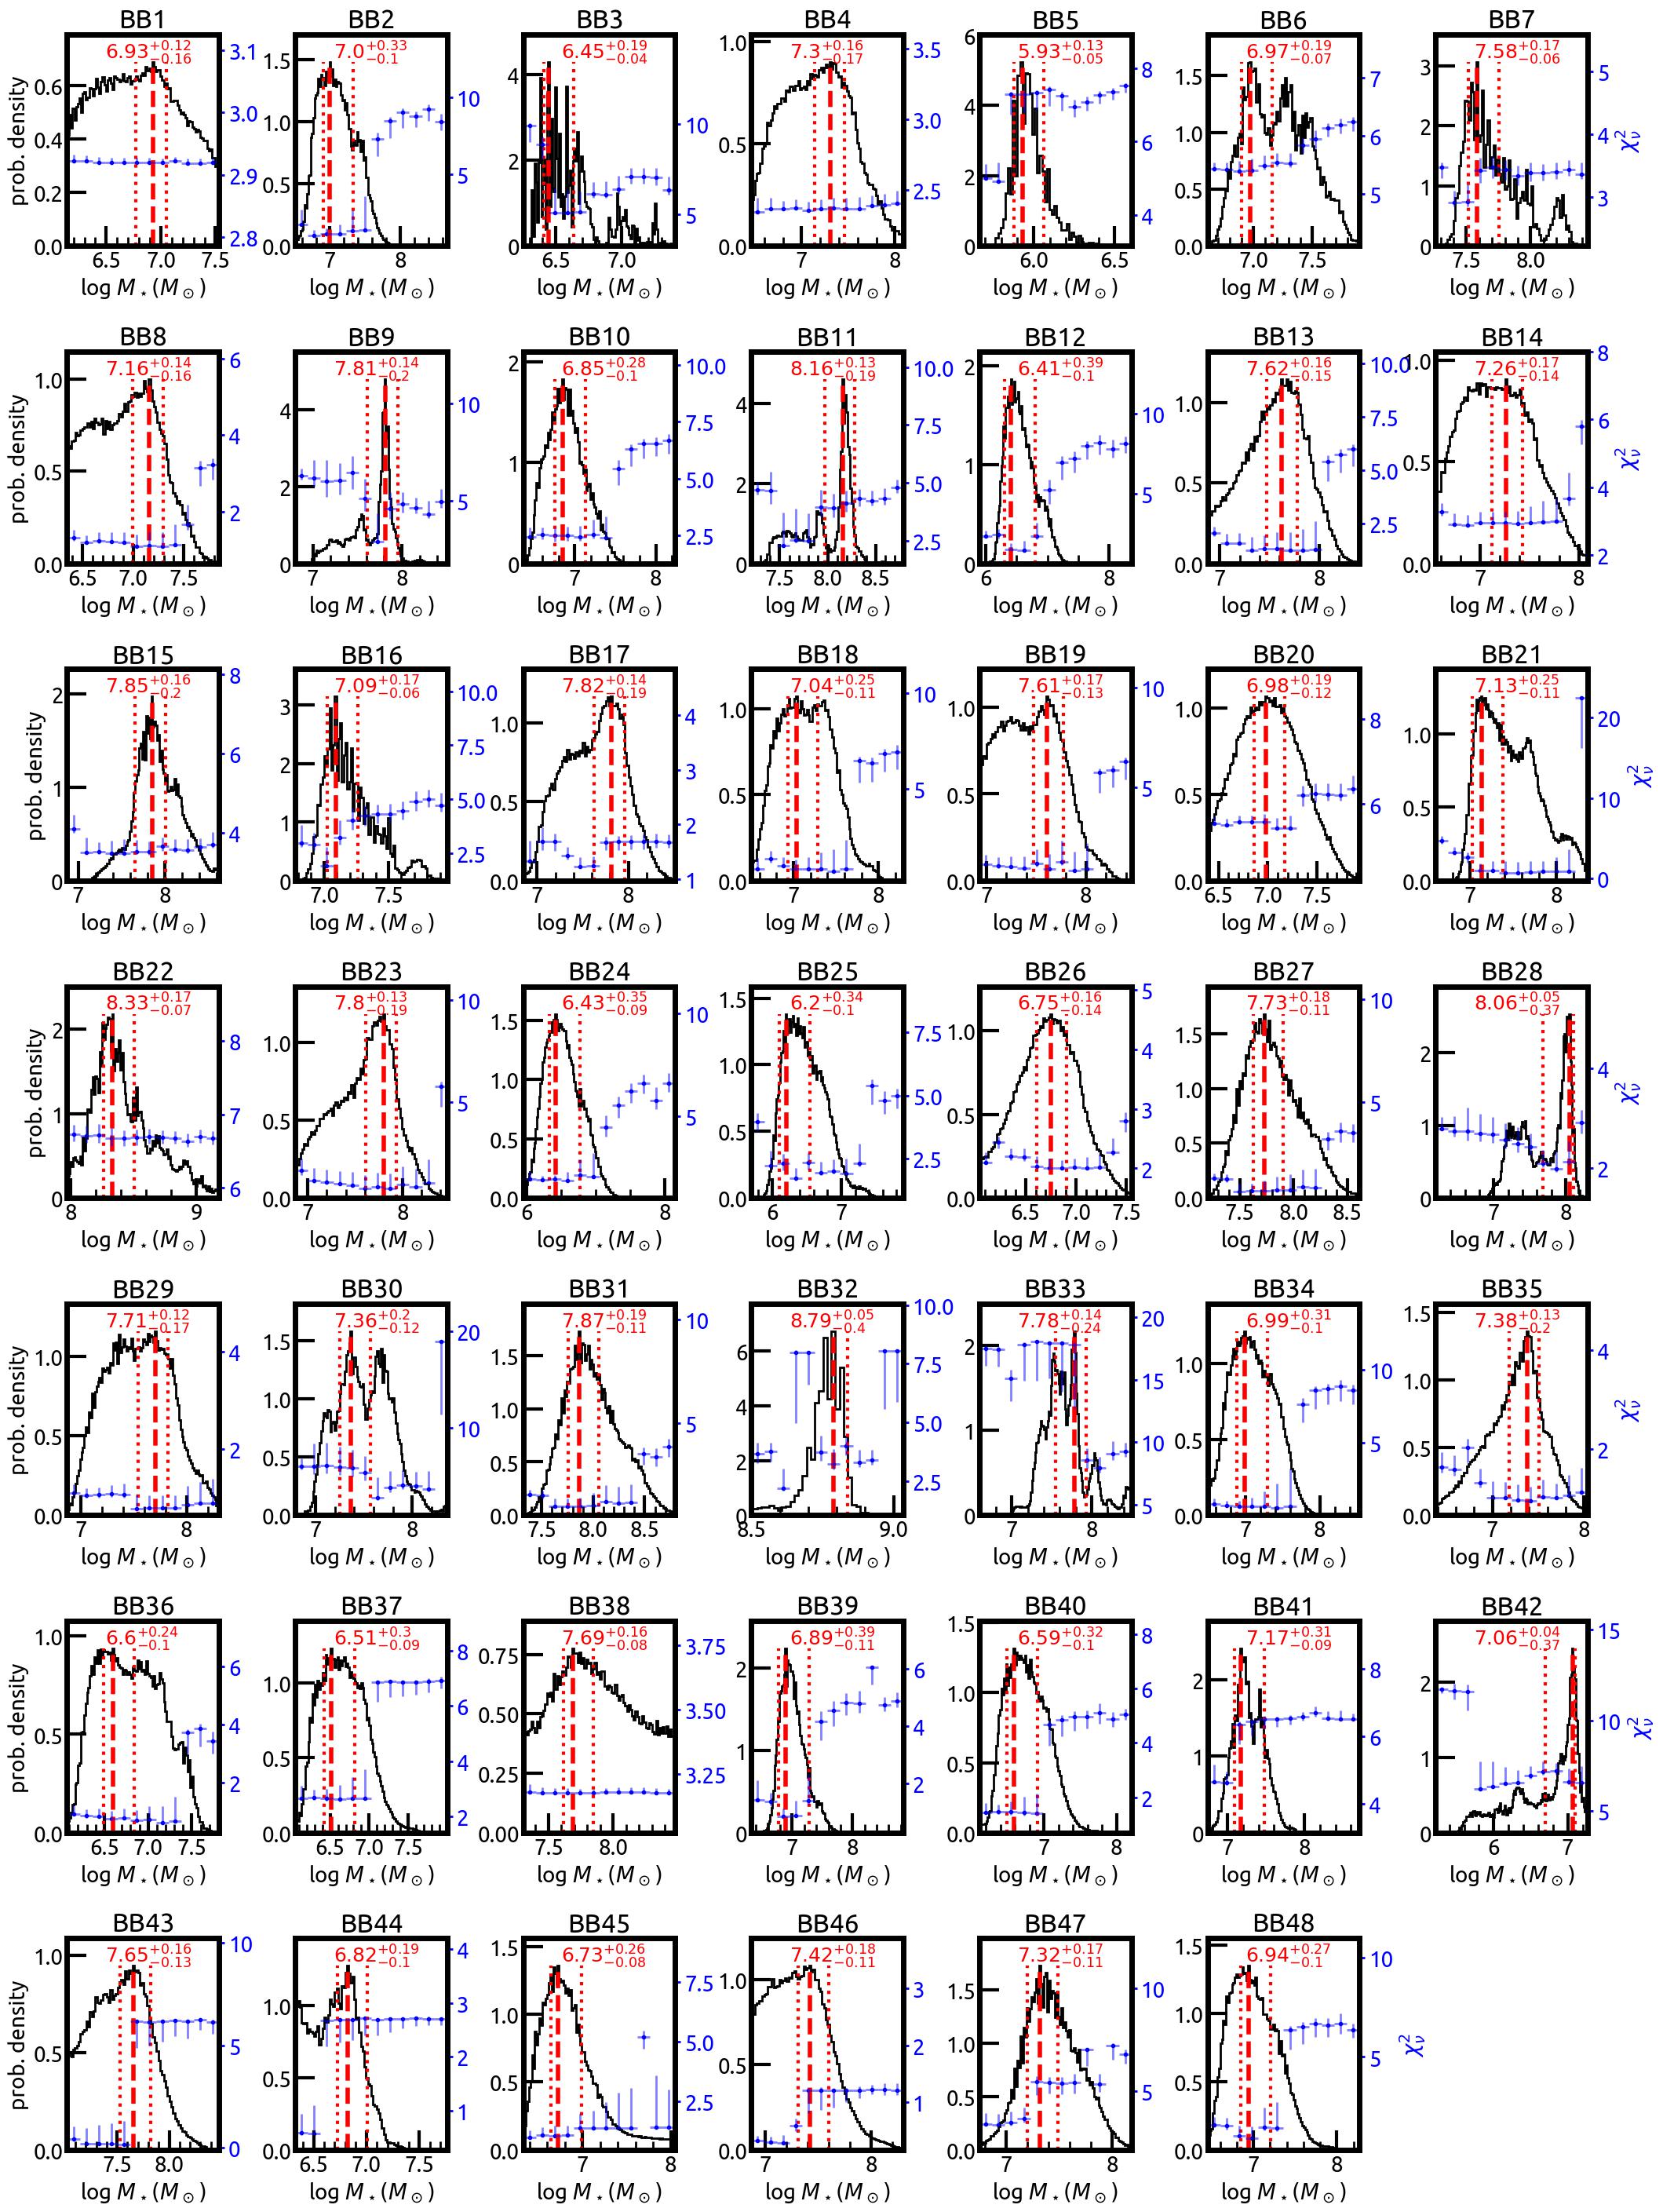
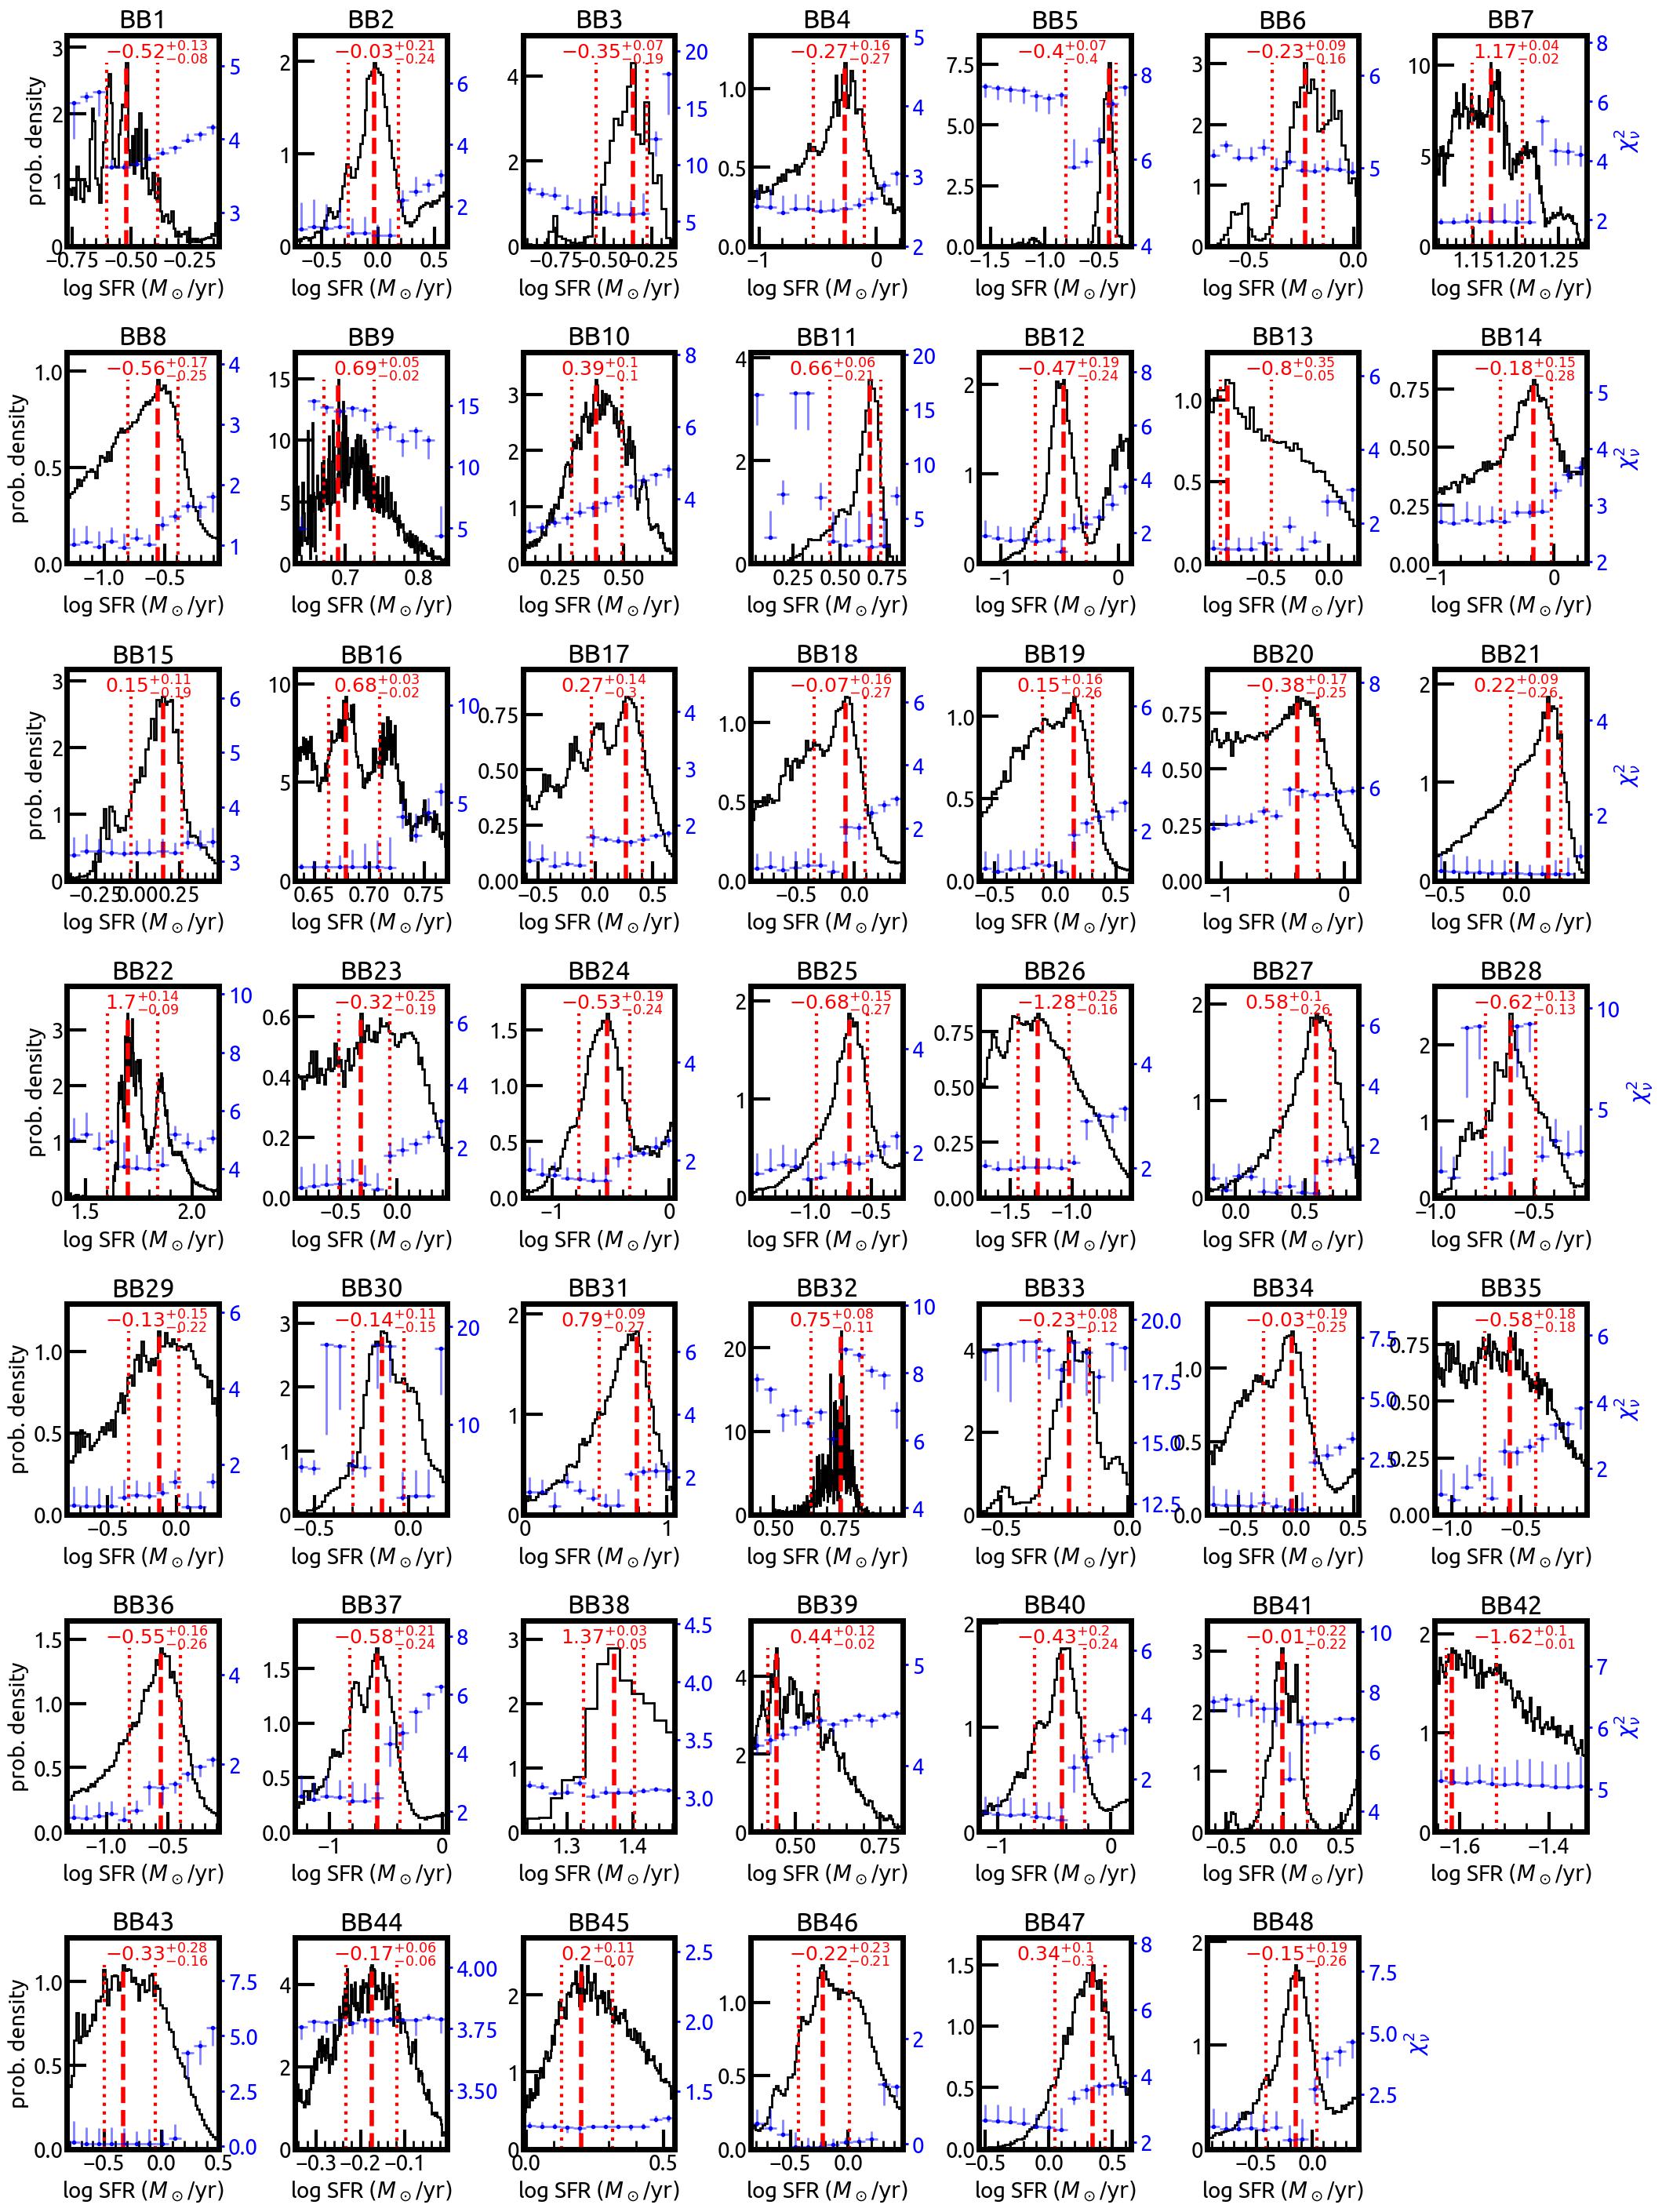
Appendix B provides the -weighted PDFs of the SFR and for each galaxy separately. These PDFs cover all the models created by CIGALE in the fitting process, and thus, this approach allows us to evaluate how much the SFR and estimations vary for the different models and obtain a more robust estimation of the parameter quantities and uncertainties. The quantity/error estimations provided by Yang et al. (2022) correspond to the average/standard deviation of these PDFs. However, because in our case most of the PDFs do not have a Gaussian form, we adopt and calculate the estimations based on the mode and 68% C.Is.
Since MPA-JHU also provides stellar masses and SFRs, we compare these estimations with our SED fitting for the 21 BBs of this work analyzed by MPA-JHU. The logarithm of the ratio of the SED fitting and MPA-JHU SFRs is . Similarly, compared to the HECATE SFRs . Thus, the SFR estimations of the SED fitting tend to give larger SFRs. The logarithmic ratio of the SED fitting and MPA-JHU stellar masses is , and . Thus, the stellar masses derived by the SED fitting tend to agree more with MPA-JHU and less with HECATE, however, there is considerable scatter.
The different methods presented here for the SFR and estimations may suffer from the same or other biases. Galaxies like the BBs may not be very well represented by the CIGALE assumption of a standard H II cloud with electron density and electron temperature K. For instance, the nearest GP analog Mrk 71 shows and K (Micheva et al. 2017). On the other hand, MPA-JHU SFRs were estimated through a combination of the emission line measurements from the fiber spectra, with aperture corrections that were applied with the method of Gallazzi et al. (2005), and the photometric measurements outside the fiber using the method of Salim et al. (2007). Only integrated photometry was used for sources with no adequate SFR estimation from the emission lines. The SFRs and stellar masses, in HECATEv2.0 are based on IR WISE photometry and combinations with optical photometry or estimations of extinction depending on availability (Kouroumpatzakis et al. 2023). It is possible that in some cases MPA-JHU may have underestimated the SFR of the BBs since they did not include UV or mid-IR emission and may not have fully accounted for extinction. Both are important given that BBs show strong UV emission. The IR-based estimations of the HECATE SFRs may underestimate the SFRs of high-sSFR and low-extinction galaxies like the BBs for the same reason (e.g., Kouroumpatzakis et al. 2023).
3.4 Blueberry galaxies with respect to the main sequence of star-forming galaxies
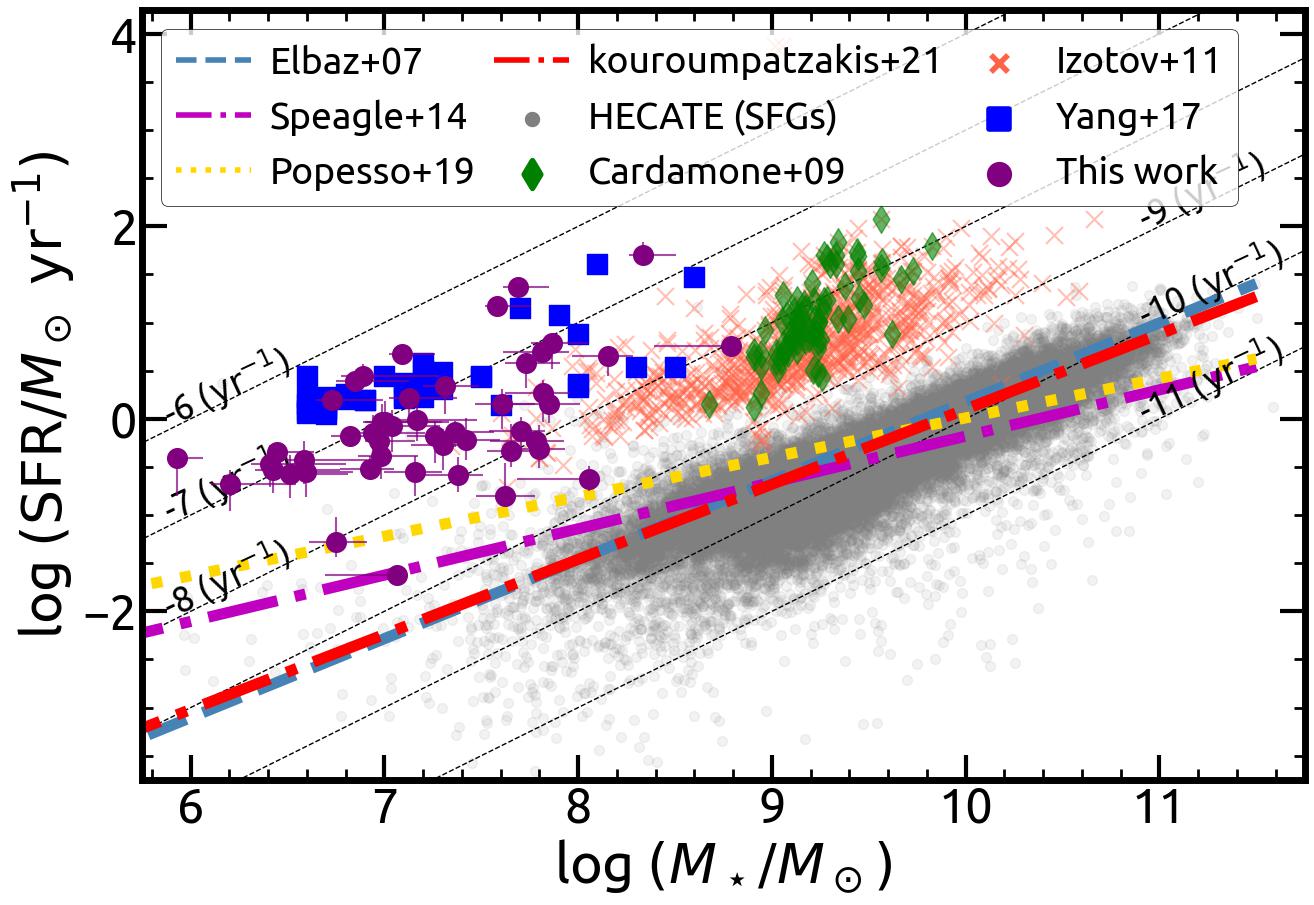
To place the proposed BBs in the context of their current star-forming conditions we plot their SFR as a function of , compared to the main sequence of SFGs. Figure 4 shows the proposed BBs, and the samples of Cardamone et al. (2009), Izotov et al. (2011), Yang et al. (2017), and all spectroscopically classified SFGs (class_sp = 0) of the HECATE catalog. The SFRs and stellar masses plotted here refer to the results of the SED fitting for the BBs of this work (Section 3.3). For the Yang et al. (2017) BBs, SFRs, and stellar masses are as reported in their work. For the HECATE catalog, and the samples of Cardamone et al. (2009), and Izotov et al. (2011), the SFRs and stellar masses are as reported in HECATEv2.0, and the MPA-JHU catalogs respectively.
All aforementioned samples of dwarf galaxies show very high values of sSFR () and are placed above the main sequence compared to HECATE galaxies which represent here the average population of SFGs in the near Universe. Moreover, BBs tend to be even more extreme compared to the Cardamone et al. (2009) GPs and Izotov et al. (2011) BDGs, with the majority being less massive and having .
3.5 Visible colors of Blueberry galaxies
Figure 5 shows the rest-frame optical color-color versus diagram for this work’s BBs, the Yang et al. (2017) BBs, the Izotov et al. (2011) BDGs, and the Cardamone et al. (2009) GPs. The HECATE galaxies classified as star-forming are also shown, representing the general population of SFGs in the nearby Universe. The colors plotted for both BB samples and the HECATE SFGs are based on SDSS cModelMag photometry. The colors of the BDGs and GPs are based on ModelMag photometry from SDSS DR12 (Alam et al. 2015). The photometry of all sources was -corrected using the conversions of Chilingarian et al. (2010) and Chilingarian & Zolotukhin (2012). Figure 5 shows that some BBs are redder than , which is the selection threshold adopted by this work for SDSS photometry. However, these sources were selected through Pan-STARRS photometry which, as discussed in Section 2, can be different compared to the cModelMag plotted here (see also Table 2). Colors reported in Table 2 refer to the observed, not the -corrected colors.
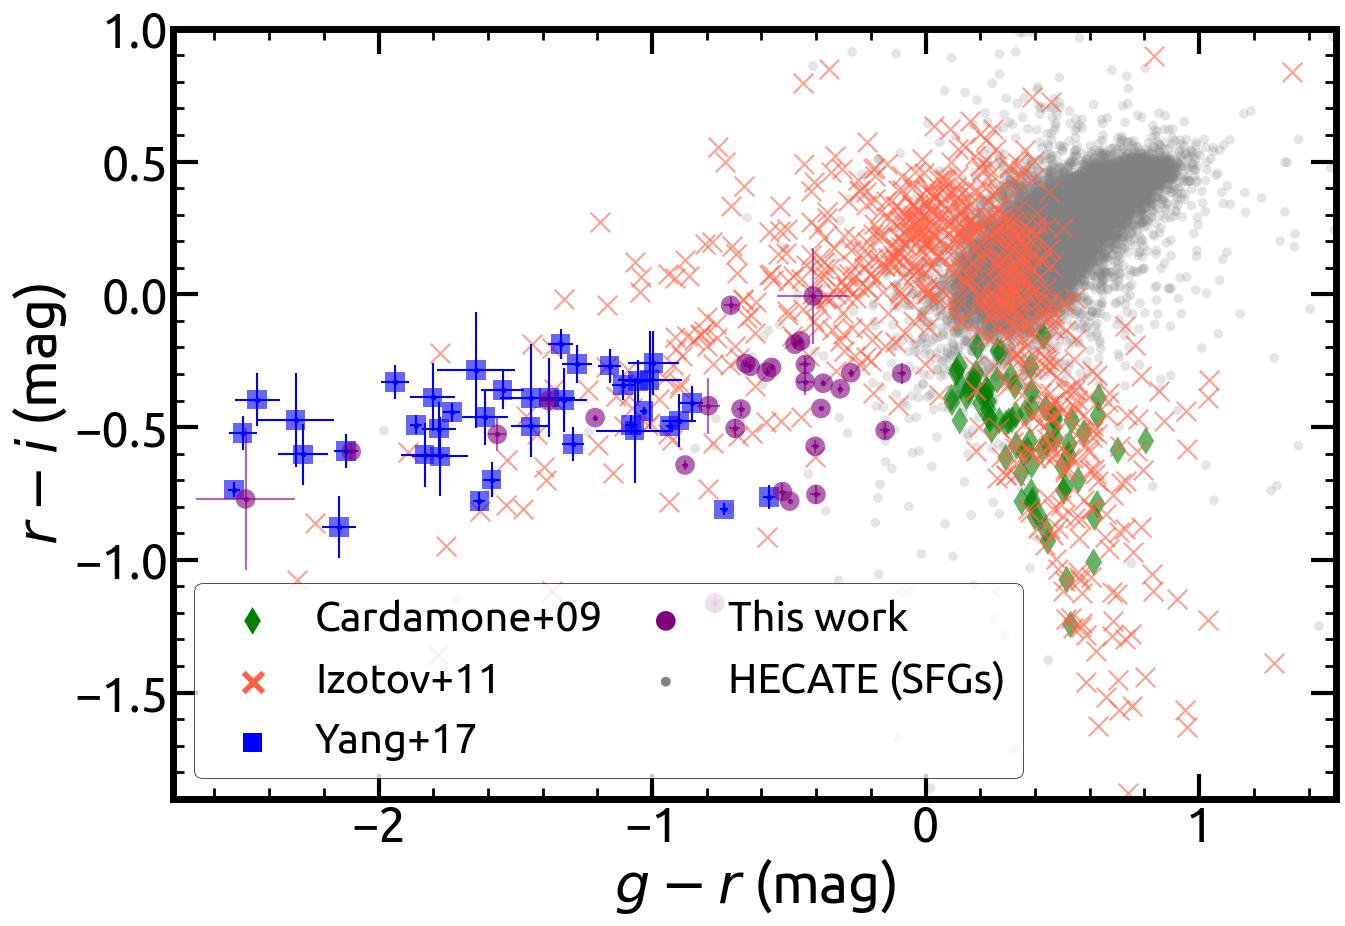
The majority of this work’s BBs tend to be slightly redder in the color compared to Yang et al. (2017) BBs but extend similarly in the color. However, there are a few sources that are located at the blue-end part of the color extending to the Yang et al. (2017) BBs. Overall, this work’s BBs tend to be located in the vs diagram between the Yang et al. (2017) BBs, and the Izotov et al. (2011) BDGs and Cardamone et al. (2009) GPs. This comparison also shows that the GPs and BDGs are on average intrinsically redder compared to BBs, although a small fraction of the large sample of Izotov et al. (2011) BDGs share similar blue colors with the BBs. Thus, the distinctive visible colors of BBs and GPs are not only different due to redshifting but are intrinsically different.
3.6 Spectroscopic properties of Blueberry galaxies.
To examine their spectroscopic properties, the BBs were cross-matched with the MPA-JHU catalog which provides robust results based on a homogeneous spectroscopic analysis. However, this analysis can only be performed for the sources covered by the MPA-JHU catalog, that is 21/48 galaxies. The EWs of the , H, , and H emission lines, and the metallicities for the spectroscopic subsample of the proposed BBs are reported in Table 3 based on the MPA-JHU catalog. The distributions of the sSFR, and the EWs of the H, , and H emission lines for the GP and BB samples are presented in Figure 6. The spectroscopically classified HECATE SFGs are also shown. Emission-line fluxes and EWs for the Cardamone et al. (2009), Izotov et al. (2011), HECATE, and BBs of this work are as provided by the MPA-JHU analysis. Spectroscopic information of the Yang et al. (2017) BBs is as reported in their work but because many of these sources were observed with MMT, with poor flat-fielding of the red part of the spectrum, their were not properly estimated and are not shown in Figure 6. Table 4 presents the modes and 68% C.Is. of these distributions summarizing the results shown in Figure 6.
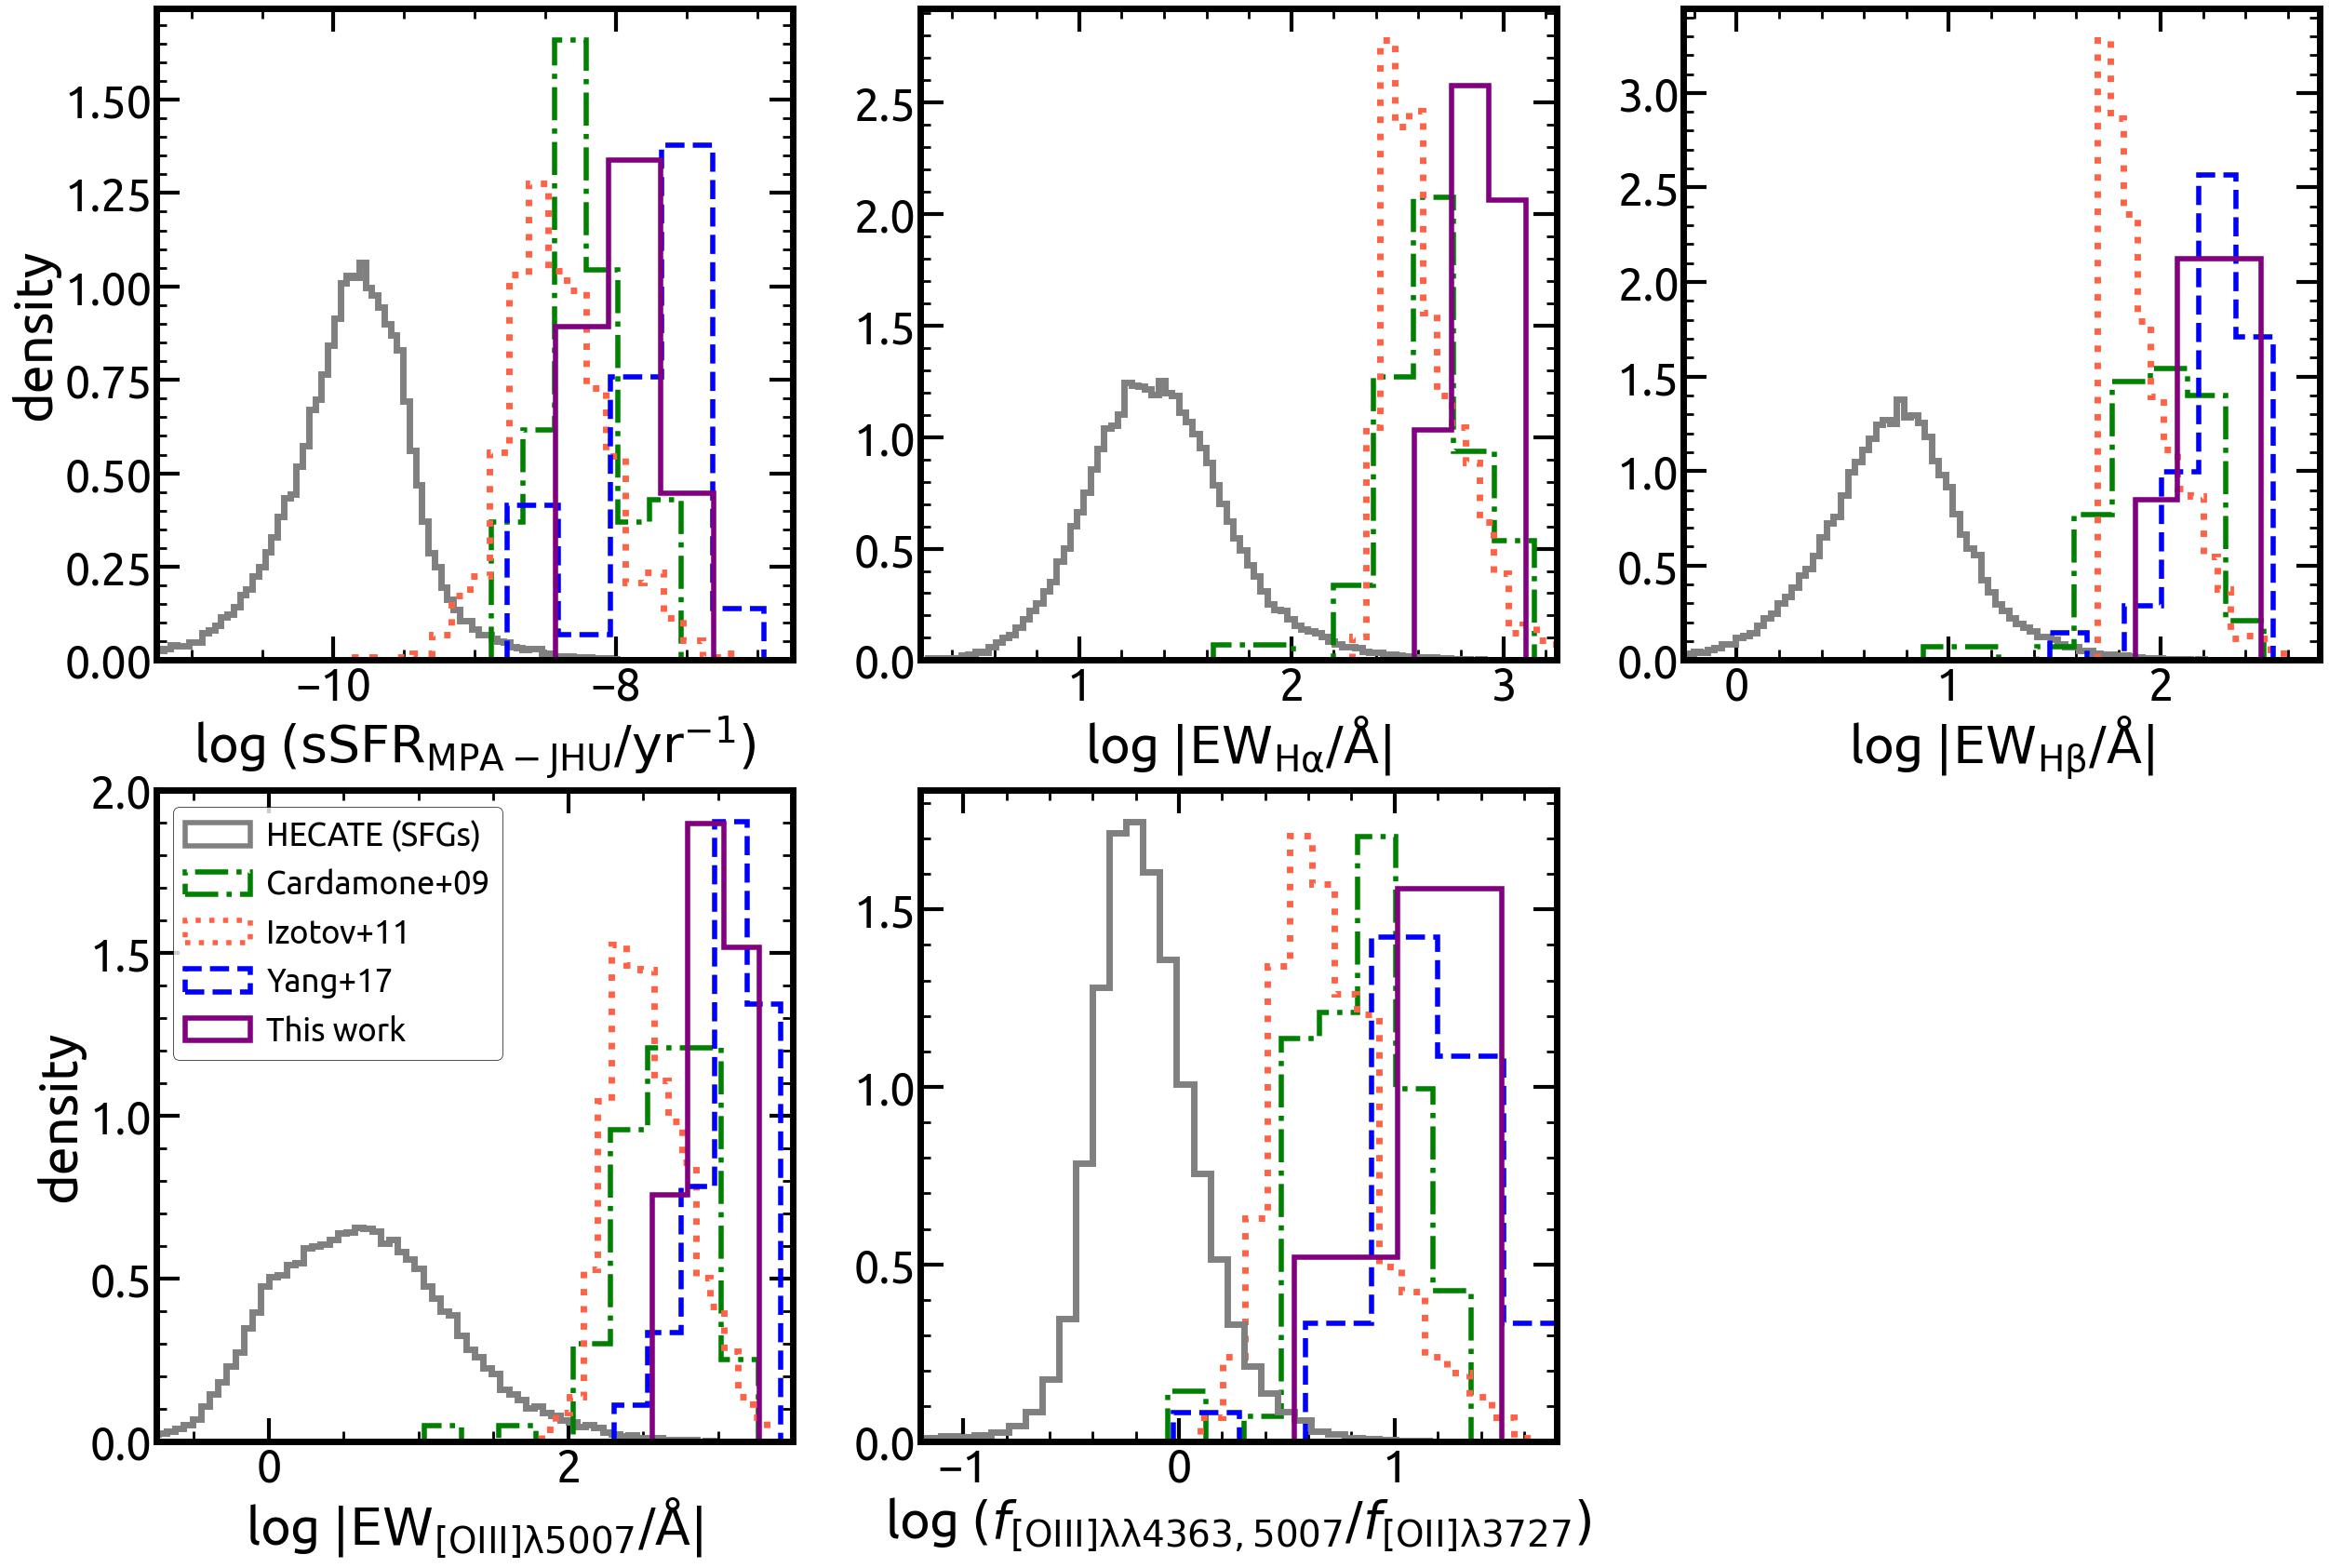
The Blueberry galaxies of this work are in agreement and show similar sSFR distribution with the BBs of Yang et al. (2017). Both samples are on the right end of the sSFR distributions showing the highest star-forming activity among the presented samples. While the Cardamone et al. (2009) GPs and Izotov et al. (2011) BDGs also show very high sSFRs () compared to the main population of SFGs, BBs show even higher star-formation intensity. The comparison of the sample’s EW distributions shows a similar behavior to the one of the sSFRs. This work’s BBs show a similar EW distribution to the Yang et al. (2017) BBs. Both samples of BBs have the highest EWs in any of the compared emission lines.
| BBs | BBs (ext.) | BBs (comp.) | BBs (Y) | GPs | BDGs | SFGs | |
| (mag) | |||||||
| (mag) | |||||||
| (mag) |
-
•
The sSFR of this work’s BBs mentioned in this table refers to the MPA-JHU estimations regarding the 21 spectroscopic sources. The modes and C.Is. of the sSFR of all 48 BBs based on the SED fitting is .
The distributions of log for the different samples are shown in Figure 6. The ratio of the different oxygen ions is a good tracer of the interstellar medium’s (ISM) ionization degree. The distributions of GPs and BDGs overlap to some extent with the BBs, but the modes of their distributions have lower ratios, thus, BBs show the most ionized ISM among the compared samples.
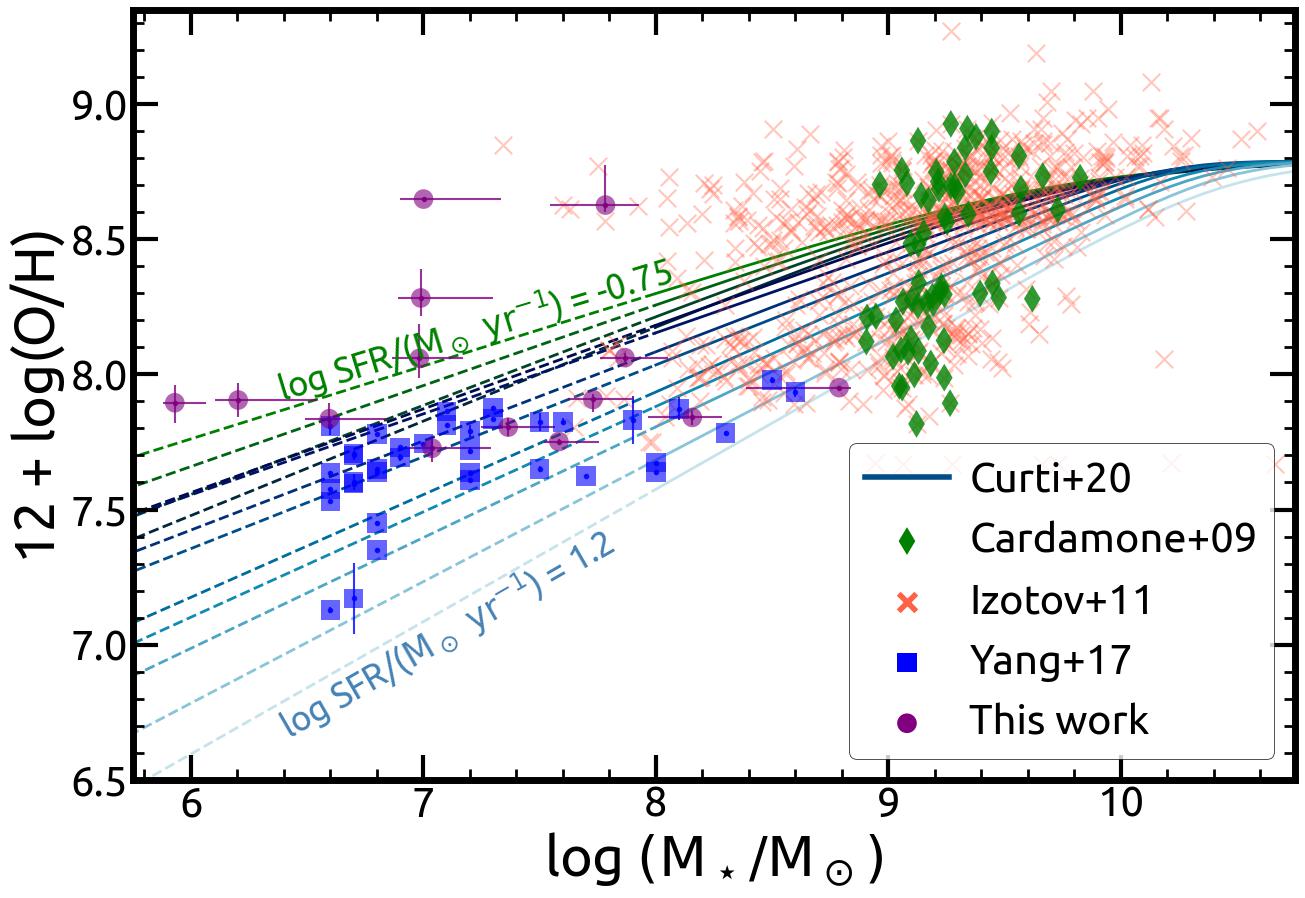
The mass–metallicity relation of BBs, GPs, and BDGs is presented in Figure 7. Metallicities and stellar masses of all samples, except the Yang et al. (2017) BBs, are as reported by the MPA-JHU analysis, where the metallicity estimation was based on the Charlot & Longhetti (2001) models. Stellar masses and metallicities of the Yang et al. (2017) BBs are as reported in their work. Most BBs show extremely low metallicities with . The mode of the metallicity distribution of the Yang et al. (2017) BBs is , and of this work’s BBs . For reference, we also plot the mass–SFR–metallicity relation by Curti et al. (2020) provided in their Equation 2. Estimations below are an extrapolation since the Curti et al. (2020) relation was a product of an analysis with more massive galaxies compared to BBs.
The highly star-forming and low-mass BBs tend to have metallicities close to what is expected from the relation accounting for their stellar mass and SFR. For instance, the mode of the SFR distribution of the plotted BBs of this work is while the minimum and maximum SFRs are , respectively. The upper line drawn from the Curti et al. (2020) relation refers to , thus the majority of BBs are below the lines that correspond to their actual SFRs. However, the comparison shows significant scatter. GPs and most BDGs are more massive galaxies and show on average higher metallicities compared to BBs.
There are also two outliers showing higher metallicity compared to the rest of the BBs (BBs 2 and 33). Both of these sources show extended features, rather than the typical compact morphology of the majority of BBs, and their spectroscopic analysis refers to these regions. This suggests that these extended features are part of the same galaxy which probably hosts older SPs and has ISM with higher metallicity.
The comparison between the metallicity and the extinction of the aforementioned samples is shown in Figure 8. The extinction here is based on the Balmer ratio and the emission-line fluxes measured by MPA-JHU for the spectroscopic subsample of the proposed BBs. The was calculated by adopting Case B recombination with (Osterbrock 1989), and the reddening law of Calzetti et al. (2000). The of sources that were found to have a Balmer ratio was set to zero. The respective extinction–metallicity relation by Kouroumpatzakis et al. (2021), which was based on a representative sample of all types of SFGs, is also drawn. Figure 8 does not show the Yang et al. (2017) sample because for some galaxies there were problems with the red part of their spectrum. While the majority of the Cardamone et al. (2009) GPs, and Izotov et al. (2011) BDGs tend to follow the relation, given the large scatter, this is not the case for the majority of BBs. Based on their metallicity, most of this work’s BBs are below the relation and show stronger extinction than expected.
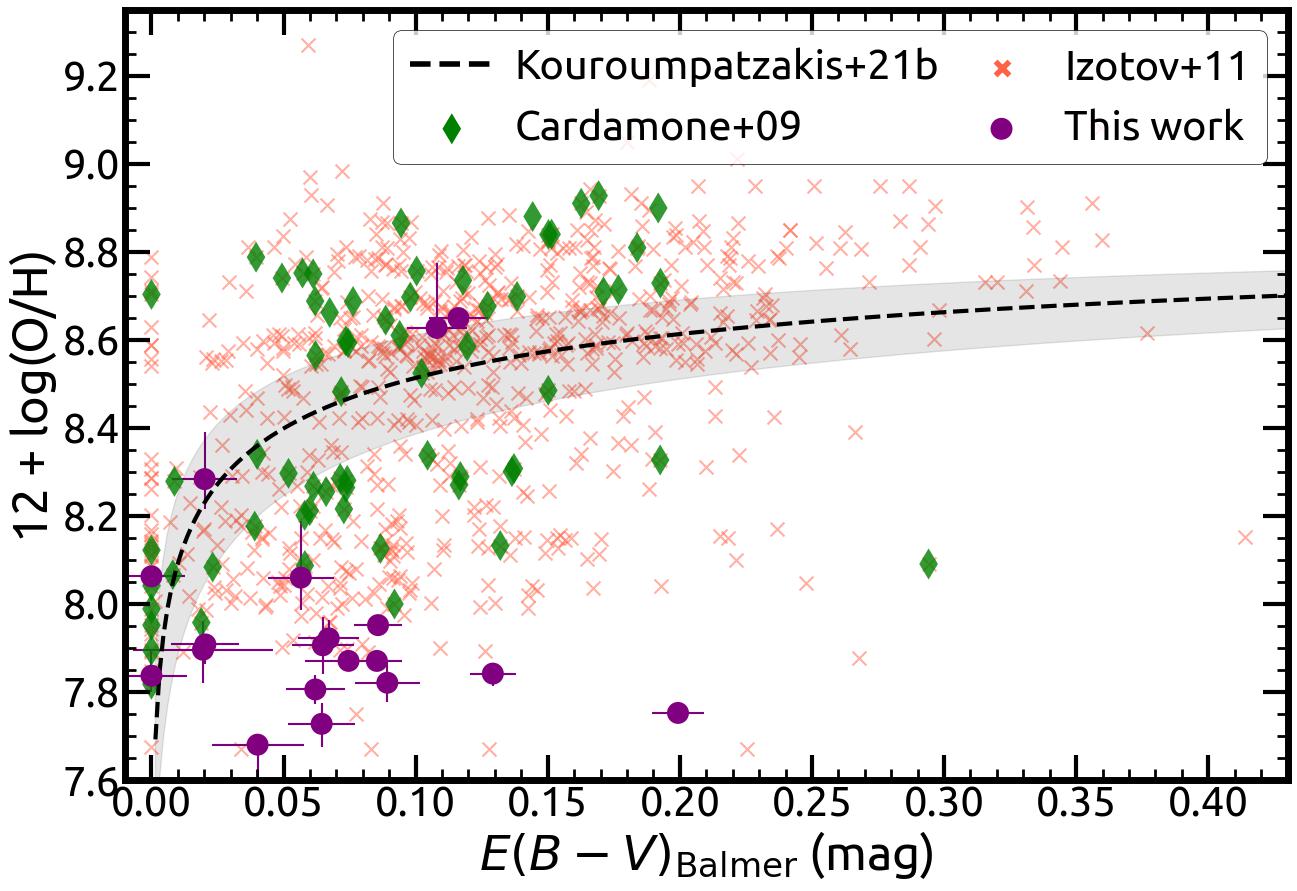
Table 4 also provides the modes and 68% C.Is. of the distributions of the quantities discussed above, separately for the morphologically compact BBs and those showing extended features. On average, the compact sources tend to form stars more actively showing slightly higher sSFR and EWs. On the other hand, compact BBs seem to have on average higher metallicities although their distributions overlap and the BB with the highest metallicity (BB 2; 12 + log(O/H) = 8.6) shows extended features. Out of the 21 spectroscopically observed BBs, only 6 sources are reported as extended and 15 as compact, thus, these results should be taken with caution due to the small and uneven size of these sub-samples.
The high ionization potential of (54.42 eV) is considered in many cases an indication of AGN activity. However, when AGN is not responsible, such high ionization levels can only be achieved by the presence of very massive stars and recent bursts of star-formation that generate SPs with ages less than 5 Myr (e.g., Bergeron et al. 1997). The emission-line fluxes were measured by Shirazi & Brinchmann (2012) for the spectra of SDSS Data Release 7. In total, 8 BBs of this work were reported by Shirazi & Brinchmann (2012) as sources with detected emission with S/N.
To homogeneously estimate the fluxes for all the BBs with spectroscopic observations we fit their SDSS spectra with the SP fitting code FADO (Gomes & Papaderos 2017). FADO fits were based on the Bruzual & Charlot (2003) simple SP template library with metallicities and . All fits used the spectral range Å while we adopted the recommended resolution for SDSS spectra of 2.3 Å and recessional velocity margins of 500 . The fluxes and EWs of all the emission lines estimated by FADO are provided in the online Table.
A comparison between the flux estimations of our analysis and MPA-JHU shows excellent agreement with , , and . The comparison of the EW estimations is , , and . Thus FADO tends to yield slightly larger EWs on average, mainly for the Balmer lines. Out of the 21 sources with spectroscopic observations, 15 were found to have emission with showing that BBs are indeed dominated by extremely young SPs. These are the BBs 2, 7, 9, 10, 11, 12, 14, 18, 20, 22, 27, 30, 31, 32, 33, and 36.
3.7 Infrared colors of blueberry galaxies
The WISE IR colors of the aforementioned samples are shown in Figure 9. This comparison involves 38 BBs of this work. Additionally, 39, 719, and 27 galaxies of the Cardamone et al. (2009), Izotov et al. (2011), and Yang et al. (2017) samples respectively that were detected with in WISE bands-1, -2, and -3 in the ALLWISE catalog (Wright et al. 2010; Mainzer et al. 2011) are also examined. The cross-matching with ALLWISE was performed with a search radius of . Additionally, all HECATE galaxies detected with in the same WISE bands, and classified as star-forming by MPA-JHU, are also shown representing the main population of SFGs.
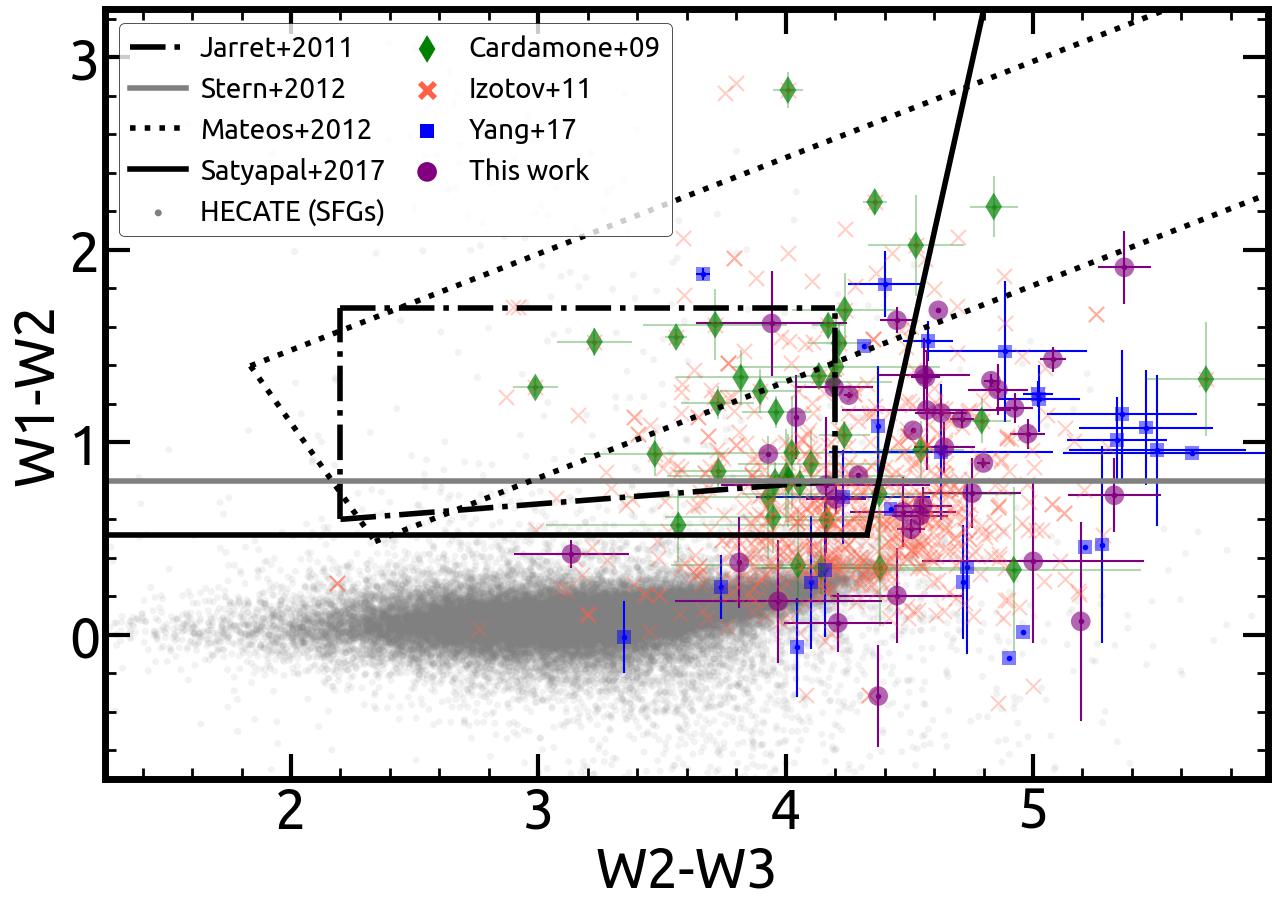
Most BDGs, GPs, and BBs deviate significantly compared to the main population of SFGs, having significantly redder colors both in and . The BBs of this work have , and . Similarly, the Yang et al. (2017) BBs were found to have , and . The majority of all BBs have and . Compared to other dwarf SFGs, BBs show the reddest IR colors, as red as the much dustier and more massive, (ultra) luminous IR galaxies (U-LIRGS; Jarrett et al. 2011). The comparison between the BBs with extended photometry (17 sources with S/N) and compact BBs (17 sources with S/N) shows that the latter have slightly redder IR colors indicating more intense activity (Table 4). However, their IR color distributions overlap significantly.
The BDGs of the larger Izotov et al. (2011) sample are spread over a broad area of the diagram with some reaching extremely red IR color (e.g., ) with most, however, placed in-between the BBs and the typical SFGs. The Cardamone et al. (2009) GPs have similar colors to BBs, however, they show relatively bluer colors.
The dependence of the IR colors of BBs and BDGs on their star-forming intensity is examined in Figure 10. This comparison involves 28, 19, 576, and 27 galaxies of this work, the Cardamone et al. (2009), the Izotov et al. (2011), and the Yang et al. (2017) samples respectively with in the WISE bands-1, -2, and -3. Here, the sSFR is as reported in MPA-JHU for the Cardamone et al. (2009), and Izotov et al. (2011) samples, while for the BBs of this work, the sSFR estimations come from the SED fitting (Section 3.3). The sSFRs of the Yang et al. (2017) BBs are as reported in the same work.

As the color coding reveals, BDGs with higher sSFR tend to have redder IR colors. The population of BDGs shows a stronger color gradient with the color rather than with the color. The majority of BDGs having are galaxies with increased star-forming intensity (log ), however, there are a few high-sSFR, but low-mass BBs, that have .
4 Discussion
4.1 Classification of the Blueberry galaxies
The optical emission-line diagram (BPT; Baldwin et al. 1981; Veilleux & Osterbrock 1987; Kewley et al. 2001; Kauffmann et al. 2003) analysis of this sample classifies all the proposed BBs as purely star-forming galaxies. Similarly, the 4D classification scheme of Stampoulis et al. (2019), which takes into account simultaneously all four emission-line ratios of the traditional BPT diagram, classifies as star-forming with probability all 21 spectroscopically classifiable BBs.
Additionally, to characterize the activity of all the sources of this sample, we apply the scheme proposed by Daoutis et al. (2023) which is based on their photometric IR , , and the visible colors. This method also returns the probability of each source belonging to any of the classes. Again, based on this independent method, all 48 BBs are classified as SFGs. However, only one galaxy, BB 5, was classified with probability to be a SFG which is considered as a secure estimation, while the rest have . Galaxy BB 31/PGC 3108006 has the highest probability of being classified as AGN with but is still considered as a SFG with a much higher probability ().
Although most of the GPs and BBs are above the Stern et al. (2012) color limit all these galaxies are classified as purely star-forming based on the BPT diagram and the IR diagnostics of Daoutis et al. (2023). Additionally, a rather small fraction of the Izotov et al. (2011) BDGs and a larger fraction of the Cardamone et al. (2009) GPs are placed inside the Jarrett et al. (2011) and Satyapal et al. (2018) wedges of AGN galaxies. The Satyapal et al. (2018) criteria were particularly defined to separate the IR colors of BDGs and AGN. To do so, they modeled with Starburst99 BDGs with a continuous starburst at 5 Myrs and a very strong radiation field, and then modeled the nebular and dust emission with Cloudy (Ferland et al. 2013). However still, a small fraction of IR-detected Izotov et al. (2011) BDGs and the majority of Cardamone et al. (2009) GPs fulfill these color criteria, possibly due to complex SFHs and the presence of both old and young SPs whose combined emission can soften the color.
Harish et al. (2023) studied the IR variability of the BPT-star-forming GPs falling within the Jarrett et al. (2011) criteria. Two sources showed variability in their IR emission which is a strong indication of the presence of an AGN. Out of all BBs studied here, only BB 2/PGC 5094058 falls within the Jarrett et al. (2011) wedge, close to its upper limit. Overall, the majority of GPs, and BBs are above the Stern et al. (2012) limit, but most Izotov et al. (2011) BDGs are below. Only a fraction of the BDGs, GPs, and BBs enter the Mateos et al. (2012) wedge. Moreover, while the Jarrett et al. (2011) and Satyapal et al. (2018) color criteria work well for the majority of BBs, they tend to misclassify GP galaxies.
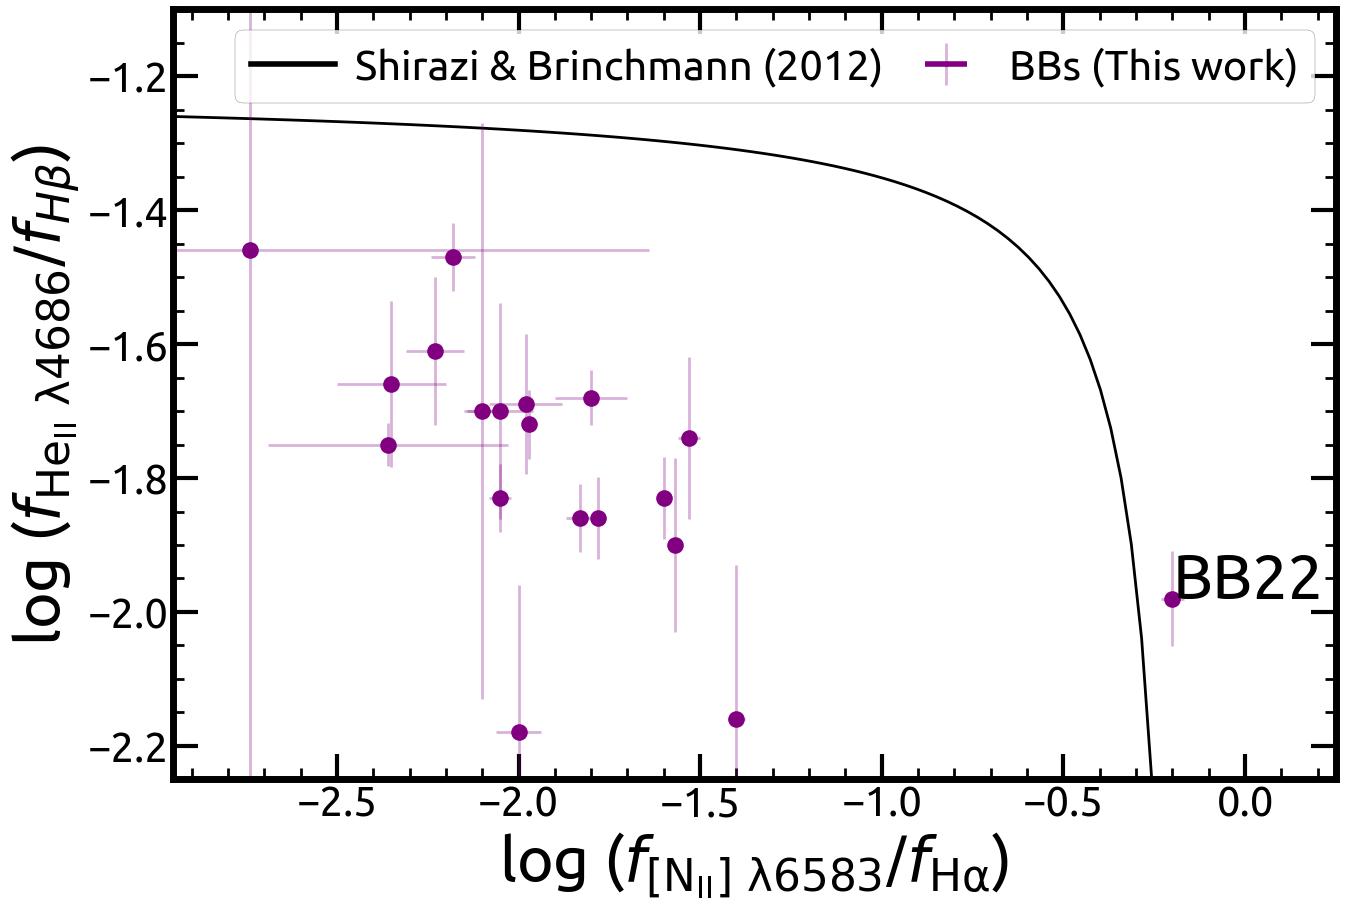
Blueberries BB 22 and BB 7 were reported as AGN galaxies by Shirazi & Brinchmann (2012). These sources were most likely classified as AGN because they show slightly broader emission lines. However, visual inspection of their spectra shows that both permitted and forbidden emission lines show broad features which is a characteristic of outflows related to star-forming activity (e.g., supernovae, stellar winds, superbubbles) rather than an AGN. Using our emission-line flux measurements (Section 3.6), we plot in Figure 11 the – diagram for the BBs of this work. BB 22 is the only source located in the AGN region of the diagram while the rest of BBs are clearly below the Shirazi & Brinchmann (2012) relation.
In order to further examine the classification of the proposed BBs, we performed an archival search of their radio footprints. While the majority of the sources were not observed by LOFAR DR2 (White et al. 1997; Shimwell et al. 2022), which covers part (27%) of the northern sky in low 120–168 MHz frequencies, it successfully detected BBs 7, 8, 9, 21, 27, and 33 but BB 22 was not observed. Among all BBs identified by this work, BB 22 is the only source with detectable radio emission in the radio surveys NRAO VLA Sky Survey (NVSS; Condon et al. 1998), Very Large Array Sky Survey (VLASS; Gordon et al. 2021), and the Rapid ASKAP Continuum Survey (RACS; Hale et al. 2021) that operate in higher radio frequencies. All other BBs were not detected or were not observed from the aforementioned radio surveys even though some should have been detected based on the general SFR–radio relation. However, it has been shown that low-mass galaxies do not follow closely the general SFR-radio relations and are usually underluminous (e.g., Kouroumpatzakis et al. 2021; Borkar et al. 2024). Thus, the radio-detected BB 22 is an exception.
In case BB 22 hosts an AGN we estimate the mass of its central massive black hole (BH). Assuming the typical BH-mass to stellar-mass ratio found in the local Universe (–; e.g., Marconi & Hunt 2003; Kormendy & Ho 2013), the BH mass of BB 22 is estimated to be around – which would place it near the range of intermediate-mass black holes. However, the velocity dispersion of BB 22 was found to be , and based on the M– relation (Tremaine et al. 2002) the BH mass is estimated to be .
4.2 Stellar populations and interstellar medium of Blueberry galaxies
The majority of BBs have lower metallicities compared to the expected based on their and SFR (Figure 7). A possible explanation could be the very rapid growth of their overall low stellar mass, driven by strong and recent star-formation bursts. Considering that BBs are the most highly star-forming dwarf galaxies in the local Universe, having also very low stellar masses (; Figure 4), a recent star-formation burst could generate a relatively large fraction of their total number of stars. Having very recent and strong starbursts could explain the very low metalicities of BBs, considering the time needed for metals to be distributed in the ISM after the star-formation episodes.
Additionally, most of this work’s BBs show stronger extinction compared to the expected by their metallicity and are overall below the average relation (Figure 8). This result also suggests that these galaxies had very recent starburst episodes. Recent and ongoing star-formation events produce dust. However, because these are very young galaxies with very low stellar mass, dominated by a recent star-formation episode, there were not many cycles of star formation that would allow the dispersion of metals in the ISM. Moreover, these sources must have had very recent star-formation episodes since more than a few Myrs in such strong ionizing radiation fields would lead to the destruction of the dust (e.g., Nozawa et al. 2006; Murata et al. 2014).
The analysis of the BB’s IR photometry is complimentary to this interpretation. The red IR colors of these BBs could be explained based on the galaxies having very recent star-formation episodes. The dominant SPs in BBs are young and massive stars and their strong UV emission is absorbed by the dust which is present in the birth clouds and the ISM, leading to strong emission in the mid-IR part of the spectrum. In contrast, the near-IR which traces the thermal emission of low-mass/older stars is relatively suppressed due to the absence of a strong population of older stars in BBs. Because BBs are galaxies with very low metallicities, we do not expect a relatively high fraction of small dust grains and polycyclic aromatic hydrocarbons (PAHs) to be present (e.g., Draine et al. 2007; Engelbracht et al. 2008; see also the IR spectrum of the low-metallicity BDG UGCA 219 by Brown et al. (2014)), which could otherwise contribute to the mid-IR emission. Thus, the progressively redder IR colors of BBs can be mainly attributed to dust that is stochastically heated by the strong radiation field of their young SPs.
It is known that the spectra of dwarf SFGs tend to have increased intensity in the mid-IR wavelengths (e.g., Brown et al. 2014) while some BDGs can even mimic the IR colors of AGN galaxies (e.g., Satyapal et al. 2014; Hainline et al. 2016; Daoutis et al. 2023). The sources that are placed in the Jarrett et al. (2011), and Satyapal et al. (2018) wedges are mainly BDGs with very high sSFR which are also among the most massive BDGs with similar levels of sSFR. This indicates that the presence of a relatively stronger population of older stars, in combination with the ongoing star formation, could be the reason for the softer that leads BDGs to mimic the IR colors of AGN. The fact that the sSFR of the BDGs correlates more strongly with rather than with (Figure 10) indicates that the intensity of the radiation field may also affect the overall shape of their IR spectrum. In contrast to the more massive BDGs, the very-low mass BBs tend to have a more stochastic behavior but most of them are placed in the upper right part of the diagram and do not enter the Jarrett et al. (2011), and Satyapal et al. (2018) wedges.
4.3 Comparison between Blueberry and Green Pea galaxies.
Blueberry galaxies are considered the lower-mass and nearby analogs of GPs. Although generally, BBs are smaller and less massive, they also show lower metallicities compared to GPs (Figure 7) and have on average about an order of magnitude higher sSFR (Figures 4, 6). Moreover, the BBs’ higher values of EWs in all the compared emission lines indicate that they are forming stars even faster and their underlying population of older stars is smaller. It has been shown that there is a tight correlation between the and sSFR of galaxies (e.g., Belfiore et al. 2018). The EW takes into account the emission line component over the continuum at the specific wavelength of each line. As the continuum traces the stellar emission of low-mass SPs, and the emission lines trace the ionizing radiation of the massive stars, the EW is also a tracer of the relative star-forming activity over the stellar component of galaxies.
The comparison of the samples’ spectroscopic properties reveals that on average BBs show stronger levels of ionization (Figure 6). Additionally, most of the spectroscopically observed BBs of this work show in emission, a high ionization emission line that, in the absence of AGN, requires the presence of many very massive and young stars. The comparison of the IR colors of the two populations is complementary to this conclusion since BBs show on average redder IR colors, mainly in the color (Figure 9).
Although the GPs selection process followed by Cardamone et al. (2009) was not restrictive on how blue the galaxies’ colors could be, their selected sources were limited to the redshift range . This led to the exclusion of BB-like sources because BBs, although bluer, are less luminous compared to the more massive GPs. For instance, the brightest source of this sample, BB 22 (with observed mag), would be marginally detectable ( mag), and the second brightest source, BB 32 (with observed mag), would be completely undetectable ( mag) by SDSS if they were placed at Mpc (z=0.3), a distance representative of most GPs. Thus, although BBs and GPs are part of the larger population of BDGs, the particular samples have intrinsic differences with the first being smaller and overall more extreme.
5 Conclusions
In order to identify Blueberry galaxies and study their properties probed by infrared and visible light, this study utilized the HECATE catalog, the Pan-STARRS and SDSS photometries, the MPA-JHU spectroscopic analysis, and the ALLWISE photometry. In summary this work:
-
•
has identified 48 BBs, 40 of which are newly discovered. Most are closer compared to the previously known and 14 are in the south equatorial sky;
-
•
has reported the distribution of the BB’s physical size and showed that BBs have lower metallicities and stronger extinction compared to the expected when accounting for their and SFR;
-
•
has shown that BBs are at the extreme end of dwarf SFGs. Compared to GPs, BBs are on average less massive, and form stars more intensively, showing more strongly ionized ISM, lower metallicities, intrinsically bluer visible colors, and redder IR colors;
-
•
showed that BDGs with higher specific SFR tend to have redder IR colors with the correlation being stronger with the color.
Acknowledgements.
The authors thank the anonymous referee for providing comments and suggestions that improved the clarity of this work. This work was supported by the Czech Science Foundation project No.22-22643S. This project has received funding from the European Union’s Horizon 2020 research and innovation programme under the Marie Sklodowska-Curie RISE action, grant agreements No 691164 (ASTROSTAT), and No 873089 (ASTROSTAT-II). This research made use of the “K-corrections calculator” service available at http://kcor.sai.msu.ru/. This research has made use of: (a) software provided by the CXC in the application packages DS9; (b) data products from the Wide-field Infrared Survey Explorer (WISE), which is a joint project of the University of California, Los Angeles, and JPL, California Institute of Technology, funded by NASA; (c) observations made with the Spitzer Space Telescope, which was operated by JPL, California Institute of Technology under a contract with NASA; (d) the NASA/IPAC Extragalactic Database (NED), which is operated by the Jet Propulsion Laboratory (JPL), California Institute of Technology, under contract with NASA; (e) the NASA/IPAC Infrared Science Archive (IRSA), which is funded by NASA and operated by the California Institute of Technology; Funding for the SDSS and SDSS-II has been provided by the Alfred P. Sloan Foundation, the Participating Institutions, the National Science Foundation, the U.S. Department of Energy, the National Aeronautics and Space Administration, the Japanese Monbukagakusho, the Max Planck Society, and the Higher Education Funding Council for England. The SDSS Web Site is http://www.sdss.org/. The SDSS is managed by the Astrophysical Research Consortium for the Participating Institutions. The Participating Institutions are the American Museum of Natural History, Astrophysical Institute Potsdam, University of Basel, University of Cambridge, Case Western Reserve University, University of Chicago, Drexel University, Fermilab, the Institute for Advanced Study, the Japan Participation Group, Johns Hopkins University, the Joint Institute for Nuclear Astrophysics, the Kavli Institute for Particle Astrophysics and Cosmology, the Korean Scientist Group, the Chinese Academy of Sciences (LAMOST), Los Alamos National Laboratory, the Max-Planck-Institute for Astronomy (MPIA), the Max-Planck-Institute for Astrophysics (MPA), New Mexico State University, Ohio State University, University of Pittsburgh, University of Portsmouth, Princeton University, the United States Naval Observatory, and the University of Washington. This research made use of the Digitized Sky Surveys (DSS). The Digitized Sky Surveys were produced at the Space Telescope Science Institute under U.S. Government grant NAG W-2166. The images of these surveys are based on photographic data obtained using the Oschin Schmidt Telescope on Palomar Mountain and the UK Schmidt Telescope. The plates were processed into the present compressed digital form with the permission of these institutions. The National Geographic Society - Palomar Observatory Sky Atlas (POSS-I) was made by the California Institute of Technology with grants from the National Geographic Society. The Second Palomar Observatory Sky Survey (POSS-II) was made by the California Institute of Technology with funds from the National Science Foundation, the National Geographic Society, the Sloan Foundation, the Samuel Oschin Foundation, and the Eastman Kodak Corporation. The Oschin Schmidt Telescope is operated by the California Institute of Technology and Palomar Observatory. The UK Schmidt Telescope was operated by the Royal Observatory Edinburgh, with funding from the UK Science and Engineering Research Council (later the UK Particle Physics and Astronomy Research Council), until 1988 June, and thereafter by the Anglo-Australian Observatory. The blue plates of the southern Sky Atlas and its Equatorial Extension (together known as the SERC-J), as well as the Equatorial Red (ER), and the Second Epoch [red] Survey (SES) were all taken with the UK Schmidt. All data are subject to the copyright given in the copyright summary. Copyright information specific to individual plates is provided in the downloaded FITS headers. Supplemental funding for sky-survey work at the ST ScI is provided by the European Southern Observatory.References
- Alam et al. (2015) Alam, S., Albareti, F. D., Allende Prieto, C., et al. 2015, ApJS, 219, 12
- Baldwin et al. (1981) Baldwin, J. A., Phillips, M. M., & Terlevich, R. 1981, PASP, 93, 5
- Barkana & Loeb (2001) Barkana, R. & Loeb, A. 2001, Phys. Rep, 349, 125
- Belfiore et al. (2018) Belfiore, F., Maiolino, R., Bundy, K., et al. 2018, MNRAS, 477, 3014
- Bergeron et al. (1997) Bergeron, P., Ruiz, M. T., & Leggett, S. K. 1997, ApJS, 108, 339
- Boquien et al. (2019) Boquien, M., Burgarella, D., Roehlly, Y., et al. 2019, A&A, 622, A103
- Borkar et al. (2024) Borkar, A., Grossová, R., Svoboda, J., et al. 2024, arXiv e-prints, arXiv:2403.19635
- Bouwens et al. (2015) Bouwens, R. J., Illingworth, G. D., Oesch, P. A., et al. 2015, ApJ, 811, 140
- Brinchmann et al. (2004) Brinchmann, J., Charlot, S., White, S. D. M., et al. 2004, Monthly Notices of the Royal Astronomical Society, 351, 1151
- Brown et al. (2014) Brown, M. J. I., Moustakas, J., Smith, J. D. T., et al. 2014, ApJS, 212, 18
- Brunker et al. (2020) Brunker, S. W., Salzer, J. J., Janowiecki, S., Finn, R. A., & Helou, G. 2020, ApJ, 898, 68
- Bruzual & Charlot (2003) Bruzual, G. & Charlot, S. 2003, MNRAS, 344, 1000
- Burgarella et al. (2005) Burgarella, D., Buat, V., & Iglesias-Páramo, J. 2005, MNRAS, 360, 1413
- Calzetti et al. (2000) Calzetti, D., Armus, L., Bohlin, R. C., et al. 2000, ApJ, 533, 682
- Cardamone et al. (2009) Cardamone, C., Schawinski, K., Sarzi, M., et al. 2009, MNRAS, 399, 1191
- Chambers et al. (2016) Chambers, K. C., Magnier, E. A., Metcalfe, N., et al. 2016, arXiv e-prints, arXiv:1612.05560
- Chandola et al. (2023) Chandola, Y., Li, D., Tsai, C.-W., et al. 2023, H I content of selected mid-infrared bright, starburst blue compact dwarf galaxies
- Charlot & Longhetti (2001) Charlot, S. & Longhetti, M. 2001, Monthly Notices of the Royal Astronomical Society, 323, 887
- Chilingarian et al. (2010) Chilingarian, I. V., Melchior, A.-L., & Zolotukhin, I. Y. 2010, MNRAS, 405, 1409
- Chilingarian & Zolotukhin (2012) Chilingarian, I. V. & Zolotukhin, I. Y. 2012, MNRAS, 419, 1727
- Condon et al. (1998) Condon, J. J., Cotton, W. D., Greisen, E. W., et al. 1998, AJ, 115, 1693
- Curti et al. (2020) Curti, M., Mannucci, F., Cresci, G., & Maiolino, R. 2020, MNRAS, 491, 944
- Daoutis et al. (2023) Daoutis, C., Kyritsis, E., Kouroumpatzakis, K., & Zezas, A. 2023, A&A, 679, A76
- Ding et al. (2023) Ding, W., Zou, H., Kong, X., et al. 2023, AJ, 166, 133
- Draine et al. (2007) Draine, B. T., Dale, D. A., Bendo, G., et al. 2007, ApJ, 663, 866
- Elbaz et al. (2007) Elbaz, D., Daddi, E., Le Borgne, D., et al. 2007, A&A, 468, 33
- Engelbracht et al. (2008) Engelbracht, C. W., Rieke, G. H., Gordon, K. D., et al. 2008, ApJ, 678, 804
- Ferland et al. (2013) Ferland, G. J., Porter, R. L., van Hoof, P. A. M., et al. 2013, Rev. Mexicana Astron. Astrofis., 49, 137
- Gallazzi et al. (2005) Gallazzi, A., Charlot, S., Brinchmann, J., White, S. D. M., & Tremonti, C. A. 2005, MNRAS, 362, 41
- Gomes & Papaderos (2017) Gomes, J. M. & Papaderos, P. 2017, A&A, 603, A63
- Gordon et al. (2021) Gordon, Y. A., Boyce, M. M., O’Dea, C. P., et al. 2021, ApJS, 255, 30
- Griffith et al. (2011) Griffith, R. L., Tsai, C.-W., Stern, D., et al. 2011, ApJ, 736, L22
- Hainline et al. (2016) Hainline, K. N., Reines, A. E., Greene, J. E., & Stern, D. 2016, ApJ, 832, 119
- Hale et al. (2021) Hale, C. L., McConnell, D., Thomson, A. J. M., et al. 2021, PASA, 38, e058
- Harikane et al. (2023) Harikane, Y., Ouchi, M., Oguri, M., et al. 2023, ApJS, 265, 5
- Harish et al. (2023) Harish, S., Malhotra, S., Rhoads, J. E., et al. 2023, ApJ, 945, 157
- Izotov et al. (2011) Izotov, Y. I., Guseva, N. G., & Thuan, T. X. 2011, ApJ, 728, 161
- Izotov et al. (2016a) Izotov, Y. I., Orlitová, I., Schaerer, D., et al. 2016a, Nature, 529, 178
- Izotov et al. (2016b) Izotov, Y. I., Schaerer, D., Thuan, T. X., et al. 2016b, MNRAS, 461, 3683
- Jarrett et al. (2011) Jarrett, T. H., Cohen, M., Masci, F., et al. 2011, ApJ, 735, 112
- Jaskot et al. (2019) Jaskot, A. E., Dowd, T., Oey, M. S., Scarlata, C., & McKinney, J. 2019, ApJ, 885, 96
- Jaskot & Oey (2013) Jaskot, A. E. & Oey, M. S. 2013, ApJ, 766, 91
- Kauffmann et al. (2003) Kauffmann, G., Heckman, T. M., Tremonti, C., et al. 2003, MNRAS, 346, 1055
- Kauffmann et al. (2003) Kauffmann, G., Heckman, T. M., Tremonti, C., et al. 2003, Monthly Notices of the Royal Astronomical Society, 346, 1055
- Keel et al. (2022) Keel, W. C., Tate, J., Wong, O. I., et al. 2022, AJ, 163, 150
- Kewley et al. (2001) Kewley, L. J., Dopita, M. A., Sutherland, R. S., Heisler, C. A., & Trevena, J. 2001, ApJ, 556, 121
- Kormendy & Ho (2013) Kormendy, J. & Ho, L. C. 2013, ARA&A, 51, 511
- Kouroumpatzakis et al. (2023) Kouroumpatzakis, K., Zezas, A., Kyritsis, E., Salim, S., & Svoboda, J. 2023, A&A, 673, A16
- Kouroumpatzakis et al. (2021) Kouroumpatzakis, K., Zezas, A., Maragkoudakis, A., et al. 2021, MNRAS, 506, 3079
- Kovlakas et al. (2021) Kovlakas, K., Zezas, A., Andrews, J. J., et al. 2021, MNRAS, 506, 1896
- Labbé et al. (2023) Labbé, I., van Dokkum, P., Nelson, E., et al. 2023, Nature, 616, 266
- Leitherer et al. (1999) Leitherer, C., Schaerer, D., Goldader, J. D., et al. 1999, ApJS, 123, 3
- Liu et al. (2022) Liu, S., Luo, A. L., Yang, H., et al. 2022, ApJ, 927, 57
- Loeb & Barkana (2001) Loeb, A. & Barkana, R. 2001, ARA&A, 39, 19
- Mainzer et al. (2011) Mainzer, A., Bauer, J., Grav, T., et al. 2011, ApJ, 731, 53
- Marconi & Hunt (2003) Marconi, A. & Hunt, L. K. 2003, ApJ, 589, L21
- Martin et al. (2005) Martin, D. C., Fanson, J., Schiminovich, D., et al. 2005, ApJ, 619, L1
- Mateos et al. (2012) Mateos, S., Alonso-Herrero, A., Carrera, F. J., et al. 2012, MNRAS, 426, 3271
- McKinney et al. (2019) McKinney, J. H., Jaskot, A. E., Oey, M. S., et al. 2019, ApJ, 874, 52
- Micheva et al. (2017) Micheva, G., Oey, M. S., Jaskot, A. E., & James, B. L. 2017, ApJ, 845, 165
- Murata et al. (2014) Murata, K., Matsuhara, H., Inami, H., et al. 2014, A&A, 566, A136
- Noeske et al. (2003) Noeske, K. G., Papaderos, P., Cairós, L. M., & Fricke, K. J. 2003, A&A, 410, 481
- Noll et al. (2009) Noll, S., Burgarella, D., Giovannoli, E., et al. 2009, A&A, 507, 1793
- Nozawa et al. (2006) Nozawa, T., Kozasa, T., & Habe, A. 2006, ApJ, 648, 435
- Osterbrock (1989) Osterbrock, D. E. 1989, Astrophysics of gaseous nebulae and active galactic nuclei (University Science Books)
- Planck Collaboration et al. (2016) Planck Collaboration, Ade, P. A. R., Aghanim, N., et al. 2016, A&A, 594, A13
- Popesso et al. (2019) Popesso, P., Concas, A., Morselli, L., et al. 2019, MNRAS, 483, 3213
- Rhoads et al. (2023) Rhoads, J. E., Wold, I. G. B., Harish, S., et al. 2023, ApJ, 942, L14
- Robertson et al. (2015) Robertson, B. E., Ellis, R. S., Furlanetto, S. R., & Dunlop, J. S. 2015, ApJ, 802, L19
- Salim et al. (2007) Salim, S., Rich, R. M., Charlot, S., et al. 2007, ApJS, 173, 267
- Satyapal et al. (2018) Satyapal, S., Abel, N. P., & Secrest, N. J. 2018, ApJ, 858, 38
- Satyapal et al. (2014) Satyapal, S., Secrest, N. J., McAlpine, W., et al. 2014, ApJ, 784, 113
- Schaerer et al. (2022) Schaerer, D., Marques-Chaves, R., Barrufet, L., et al. 2022, A&A, 665, L4
- Scott (1979) Scott, D. W. 1979, Biometrika, 66, 605
- Sebastian & Bait (2019) Sebastian, B. & Bait, O. 2019, ApJ, 882, L19
- Shapiro & Giroux (1987) Shapiro, P. R. & Giroux, M. L. 1987, ApJ, 321, L107
- Shimwell et al. (2022) Shimwell, T. W., Hardcastle, M. J., Tasse, C., et al. 2022, A&A, 659, A1
- Shirazi & Brinchmann (2012) Shirazi, M. & Brinchmann, J. 2012, MNRAS, 421, 1043
- Speagle et al. (2014) Speagle, J. S., Steinhardt, C. L., Capak, P. L., & Silverman, J. D. 2014, ApJS, 214, 15
- Stampoulis et al. (2019) Stampoulis, V., van Dyk, D. A., Kashyap, V. L., & Zezas, A. 2019, MNRAS, 485, 1085
- Stern et al. (2012) Stern, D., Assef, R. J., Benford, D. J., et al. 2012, ApJ, 753, 30
- Su & Cui (2004) Su, D.-Q. & Cui, X.-Q. 2004, Chinese J. Astron. Astrophys., 4, 1
- Svoboda et al. (2019) Svoboda, J., Douna, V., Orlitová, I., & Ehle, M. 2019, ApJ, 880, 144
- Tremaine et al. (2002) Tremaine, S., Gebhardt, K., Bender, R., et al. 2002, ApJ, 574, 740
- Tremonti et al. (2004) Tremonti, C. A., Heckman, T. M., Kauffmann, G., et al. 2004, The Astrophysical Journal, 613, 898
- Veilleux & Osterbrock (1987) Veilleux, S. & Osterbrock, D. E. 1987, ApJS, 63, 295
- Volonteri & Gnedin (2009) Volonteri, M. & Gnedin, N. Y. 2009, ApJ, 703, 2113
- Wang et al. (1996) Wang, S.-G., Su, D.-Q., Chu, Y.-Q., Cui, X., & Wang, Y.-N. 1996, Appl. Opt., 35, 5155
- White et al. (1997) White, R. L., Becker, R. H., Helfand, D. J., & Gregg, M. D. 1997, ApJ, 475, 479
- Wright et al. (2010) Wright, E. L., Eisenhardt, P. R. M., Mainzer, A. K., et al. 2010, AJ, 140, 1868
- Yang et al. (2022) Yang, G., Boquien, M., Brandt, W. N., et al. 2022, ApJ, 927, 192
- Yang et al. (2017) Yang, H., Malhotra, S., Rhoads, J. E., & Wang, J. 2017, ApJ, 847, 38
Appendix A The selection algorithm
The following Equation LABEL:eq:Selection shows the algorithm used for the selection of Blueberry galaxies, as described in Section 2.
| (A1) | |||
Appendix B The SED fitting process
Figure 12 shows two representative SED fits performed with CIGALE, the worst (BB 20) and one of the best (BB 30) based on . Figures 13, and 14 show the -weighted probability densities, accounting all fitted models, of the , and SFR respectively for the 48 BBs of this work. The SFR and quantities were estimated based on the modes and 68% C.Is. of these distributions.