Molecular dynamics simulations of the defect evolution in tungsten on successive collision cascades
Abstract
Molecular dynamics (MD) simulations of successive collision cascades within the same simulation domain were performed using two different inter-atomic potentials (IAP) in tungsten, one EAM based and the other a ‘quantum accurate’ machine learning potential, SNAP. The micro-structural changes are analyzed as a function of displacements per atom (dpa) up-to irradiation dose of 3 dpa. Five simulations are carried out at primary knock-on atom (PKA) energies of 20 keV and 50 keV for observing stochastic differences in the evolution of damage. Results for the variation of the number of defects, number of defect clusters, their size and morphology distribution are compared for the two energies and two IAPs, up-to irradiation doses of 1-3 dpa.
It is seen that for a given IAP, the number density of defect clusters as a function of dpa does not depend on the energy of the PKA used in the simulations implying that, like dpa, it could be a good measure of material property changes in irradiated materials. In contrast, the defect sizes depend strongly on the energy of the PKA. It is also seen that the micro-structure resulting from the EAM potential was mostly composed of \hkl¡1 1 1¿ and \hkl¡1 0 0¿ dislocations, while that from the SNAP potential was mostly composed of small, sessile, C15 ring like structures with a smattering of smaller \hkl¡1 1 1¿ dislocations and very few \hkl¡1 0 0¿ dislocations. The significant disagreement between the two IAPs with regard to defect morphology can be used for validation by comparing against the experimental results of dislocation types, density and size distributions.
keywords:
collision cascades , irradiation , defects , defect clusters , molecular dynamics (MD) , LAMMPS , Tungsten1 Introduction
Irradiation induced changes in materials have been studied at multiple scales
for several decades ([1, 2, 3, 4] and references therein). The main focus of these studies have
been on understanding the change in micro-structure of the materials due to
irradiation. Primary damage at the atomistic scales due to collision cascades
has been extensively studied ([5, 6, 7]). The number of defects, their in-cascade clustering, defect
morphologies, cascade properties, etc., are being studied from MD collision
cascade databases [8, 9, 10, 11, 12, 13]. More recently the effect of
IAP used on the primary damage is being explored [14, 15, 7, 16, 17, 18]. The
evolution of the micro-structure is being studied using kinetic Monte Carlo
(KMC) methods [19, 20] and mean field rate
theoretical (MFRT) methods [4]. The KMC methods
use approximations for the migration energies of diffusion and morphological
transitions, and interactions of defects with different morphologies and sizes.
KMC methods are also limited in their scale since only small regions of the
order of microns can be simulated up-to small doses (fraction of a dpa)
[19]. The MFRT methods average over the spatial and temporal
variations of the defect distribution and is less exact than the KMC methods,
but can handle large regions for high doses [4]. It is
important to study the stability of the defect clusters
[21, 22] their transport, their interactions with
each other in order to understand the evolution of the micro-structure due to
irradiation.
Another approach used to quantify the irradiation exposure of materials is to
define a unit that is physically related to the damage mechanism called
”displacements per atom” (dpa) [23]. dpa contains
information about both the fluence and the energy of the irradiating particle
and is therefore a much better measure than the fluence (fig.1 of
[24]). A simple formula, called the NRT-DPA, based on the
available energy per primary knock-on atom (PKA) and accounting for the
displacement efficiency, electronic stopping and the displacement energy
required to create a Frenkel Pair, was developed as a standard for evaluating
dpa [25]. The NRT-DPA, which is the current standard for
quantifying energetic particle damage to materials for the past four decades,
has several shortcomings like (i) over-estimating the number of Frenkel pairs
produced and (ii) under-estimating the number of atoms replaced in the lattice
[26]. Therefore newer, more accurate models, have been
proposed [27, 28, 26].
The studies at multiple scales mentioned in the first paragraph have yielded
insights into irradiation induced damage. However, a
lot more work on the stability, transport and interactions of defects have to
be carried out using MD to be able to model micro-structure evolution due to
irradiation accurately with higher scale models. A recent approach to straddle over this shortcoming is
based on the fact that the material properties show a good correlation with
dpa. Several researchers have created dpa at the atomic level by a combination
of random Monte Carlo moves of atoms followed by a conjugate gradient
relaxation of the atomic positions called the creation relaxation algorithm
(CRA) [29, 30]. Mason et al. have got better results by
introducing a molecular dynamics collision cascade cascade in-between several
Monte Carlo steps [30]. Byggmästar et al., have studied the
effect of IAP on the evolution of defects at high doses by carrying out
successive MD simulations of collision cascades [14].
In this paper we carry out MD simulations of successive collision cascades (SCC) at two different PKA energies and using two different IAP to study the creation and evolution of defect clusters and their morphologies in a dpa range 0-3 dpa. By successive collision cascades we imply that each successive PKA is launched onto the damaged lattice structure due to the previous PKAs. We explore the various defect properties as a function of DPA such as the number of defects, distribution of fractions and sizes of defect morphologies for different IAPs and energies. We look for the deviations from the perfect match in these parameters depending on IAPs or PKA energy at the same DPA. The deviation is most significant in the defect morphologies being produced by the two IAPs, giving rise to other differences such as of defect sizes. We also seek to find a micro-structural parameter which is measurable experimentally and correlates directly with dpa, despite being created with different PKA energies / IAP. In the next section we describe the simulations and methods. This is followed by the section describing our results. Finally the conclusions are presented.
2 MD Simulations of Successive Collision Cascades
MD simulations of successive collision cascades were carried out at PKA energies of 20 keV and 50 keV in a simulation domain consisting of unit cells of tungsten using two different IAP. One of the potentials is an embedded atom method (EAM) based potential called the DND-BN potential [31], and the other is a machine learning (ML) based quantum accurate potential called the SNAP potential [32]. Both the potentials take care that the pair interactions when the atoms in the solid come close to each other are treated by the universal ZBL potential [33]. The simulation region is first equilibrated at zero pressure and 300 K temperature using a NPT ensemble, with periodic boundary conditions (PBC) along all the three directions. After equilibration, a randomly selected PKA is launched in a random direction. The random directions are chosen by identifying uniformly distributed points on a random sphere centered at the position of the PKA. PBC are used for the collision cascade simulations too with a varying time-step such that the fastest atom in the system moves less than 0.1 Å. Electronic stopping is included as a frictional term calculated by the Lindhard-Scharff model [34]. The collision cascade simulations are carried out for 20 ps using an NVE ensemble. Each cascade simulation is followed by an NPT simulation at zero pressure and 300 K temperature for 10 ps to relax the damage. Five trials of successive collision cascade simulations were carried out at each energy for statistics. 3000 such successive cascades were carried out with the DND-BN potentials, whereas for the SNAP potentials 1000 successive cascades were carried since the calculation of forces using these potentials are computationally expensive.
2.1 Calculation of dpa
The dpa is calculated from MD simulations (MD-DPA) by finding the cumulative number of displaced atoms () at the end of each cascade simulation and dividing it by the total number of atoms in the simulation (). The cumulative number of displaced atoms is obtained by counting the number of displaced atoms in each successive cascade () and adding it to the current value of . Note that is counted with respect to the initial positions of the atoms at the beginning of each successive cascade and not with respect to the initial positions of the atoms before the launch of the first PKA. Choosing the latter would limit the dpa to a value 1 once all the atoms have been displaced and will miss out on the possibility of multiple displacements of the same lattice atom in different cascades.
2.2 Analysis of the micro-structure damage
The parallelized version of CSaransh [12], a software suite to analyze large database of MD simulations of collision cascades, was used to analyze the simulation results. It outputs various defect properties such as the number of defects, defects in clusters, the defect morphology and size distributions. We analyze the simulation box after every collision cascade for all the five trials which makes a total of 40000 simulation frames to analyze.
A number of factors make analysing high dose SCC simulations particularly more challenging compared to the single PKA simulations. The boundaries in current SCC simulations are not fixed which may result in the movement of whole lattice structure. Due to this global shift in positions the methods that use initial lattice positions as template to find defects such as Wigner-Sietz become infeasible. We find that the Wigner-Sietz method of Ovito does not work well for such successive collision cascade simulations. The presence of large defects sometimes wrapping across the boundary makes it even more difficult to estimate the absolute perfect lattice positions to compare with. The defect analysis algorithms of Csaransh termed as AnuVikar use specific minimization methods to make this estimation efficient as well as accurate at such a large scale of analysis. The accuracy of the analysis of defect morphologies such as of dislocations using DXA, becomes challenging due to the spread of high number of vacancies and other defects (3D, rings etc.) across the lattice structure.
The Csaransh software suite used in our study uses, Anuvikar algorithm, a modification of W-S and ES methods [10] to find defects. The algorithm does not take an initial set of positions as input template in case of known crystal structures such as bcc, fcc, hcp etc. The only inputs are structure type and lattice constant. The initial position of the beginning of lattice is estimated from the atomic positions which makes it effective for successive collision cascades where the lattice can shift as a whole and there is a possibility of volumetric swelling. Each atomic coordinate is then associated with its nearest lattice site using modular arithmetic which is more space and time efficient than making geometric structures or neighbour lists. The lattice sites that have no atoms as nearest lattice site are marked as vacancies and the atoms that are associated with over occupied lattice sites are SIAs or displaced atoms. We use SaVi, a computational graph based algorithm [10, 11] to classify defect morphologies. It identifies the orientation and internal morphology of the defects into various classes using computational graphs and computational geometry. It has recently been parallelized for quick analysis of a large database of MD simulations using C++ and python and can typically carry out the analysis of thousands of MD collision cascade atomic positions output in less than an hour and outputs JSON (JavaScript Object Notation) files for further specific analysis.
3 Results
Table.1 shows the dpa obtained by the MD simulations for each of the PKA energies and IAP explored.
| PKA Energy | IAP used | Number of | dpa |
| (keV) | PKA Launched | ||
| 20 | DND-BN | 3000 | 2.8 |
| 50 | DND-BN | 3000 | 6.9 |
| 20 | SNAP | 1000 | 1.2 |
| 50 | SNAP | 1000 | 3.2 |
Fig.1 shows the variation of the number of defects with the number of PKA launched and with dpa. In the former case the number of defects for the 50 keV PKA are well separated from the 20 keV PKA while in the latter case the variation is less pronounced. This is to be expected since in the former only the number of PKA launched are counted, whereas in the latter case, dpa involves both fluence and energy of PKA. Note that initially the number of defects increase linearly with greater slope. The rate of increase of defects decreases slowly. The decrease is slightly more in SNAP than DND-BN.
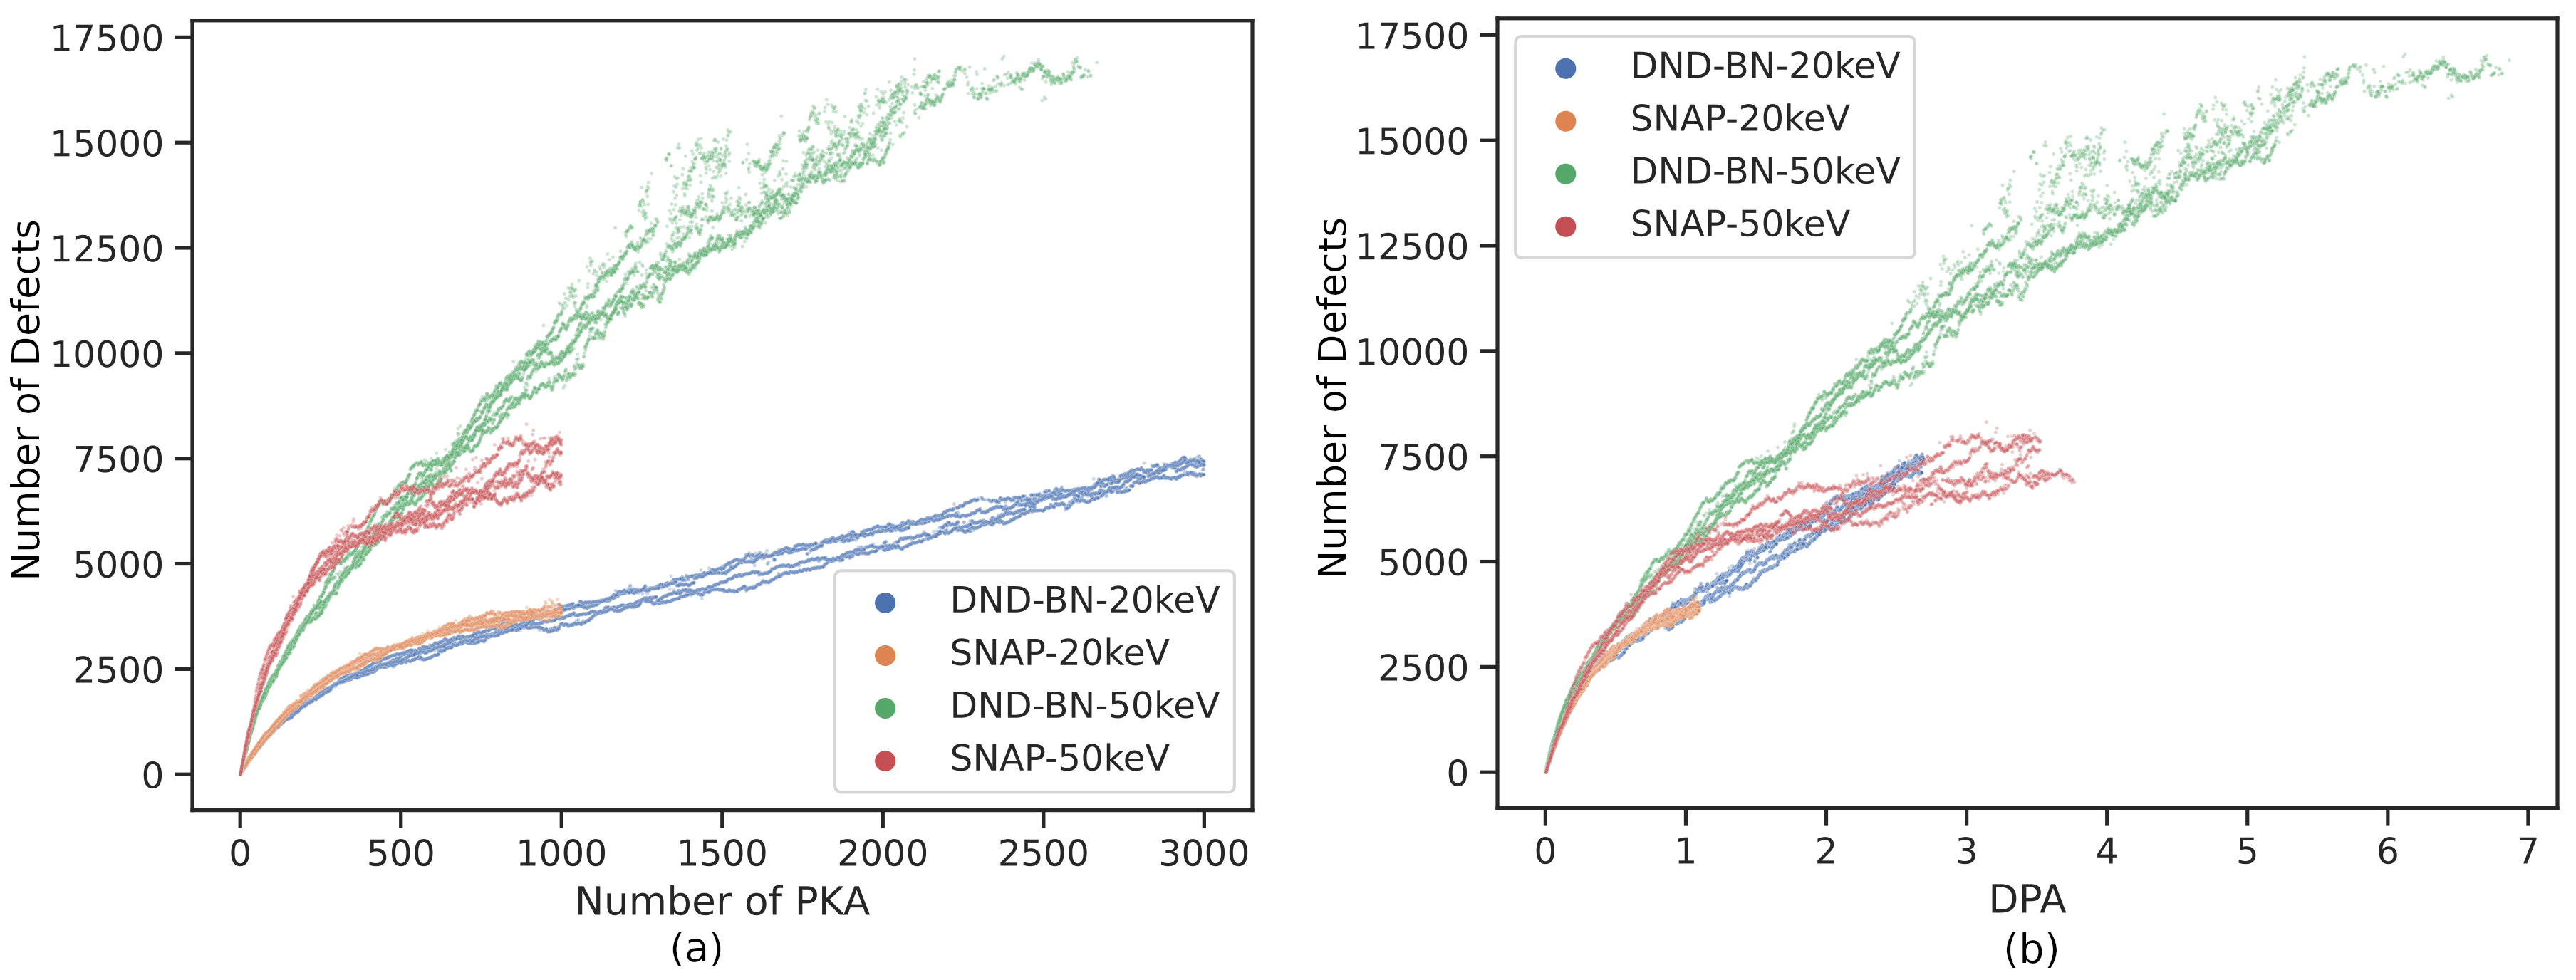
The decrease in the rate of defect production is due to the greater probability
of overlap of PKA launch site with existing defect region. Initially, the collision cascades
occur at independent locations with minimal
overlap due to random selection of PKA launch positions. However, with more pre-existing
defects, the defect region of the subsequent PKAs have higher probability
to overlap with pre-existing defects which increases the dpa but does not increase the number of
defects.
Fig.2 shows the variation in the number of SIA (self-interstitial atoms) and vacancy clusters as a function of dpa. The number of SIA clusters for DND-BN start to decrease while for SNAP the values only saturate. The decrease in clusters in DND-BN is due to the big SIA clusters in DND-BN which start to merge together with the increase in defect density. There is a quantitative separation based on the IAP rather than the PKA energy as was seen in the case of number of defects.
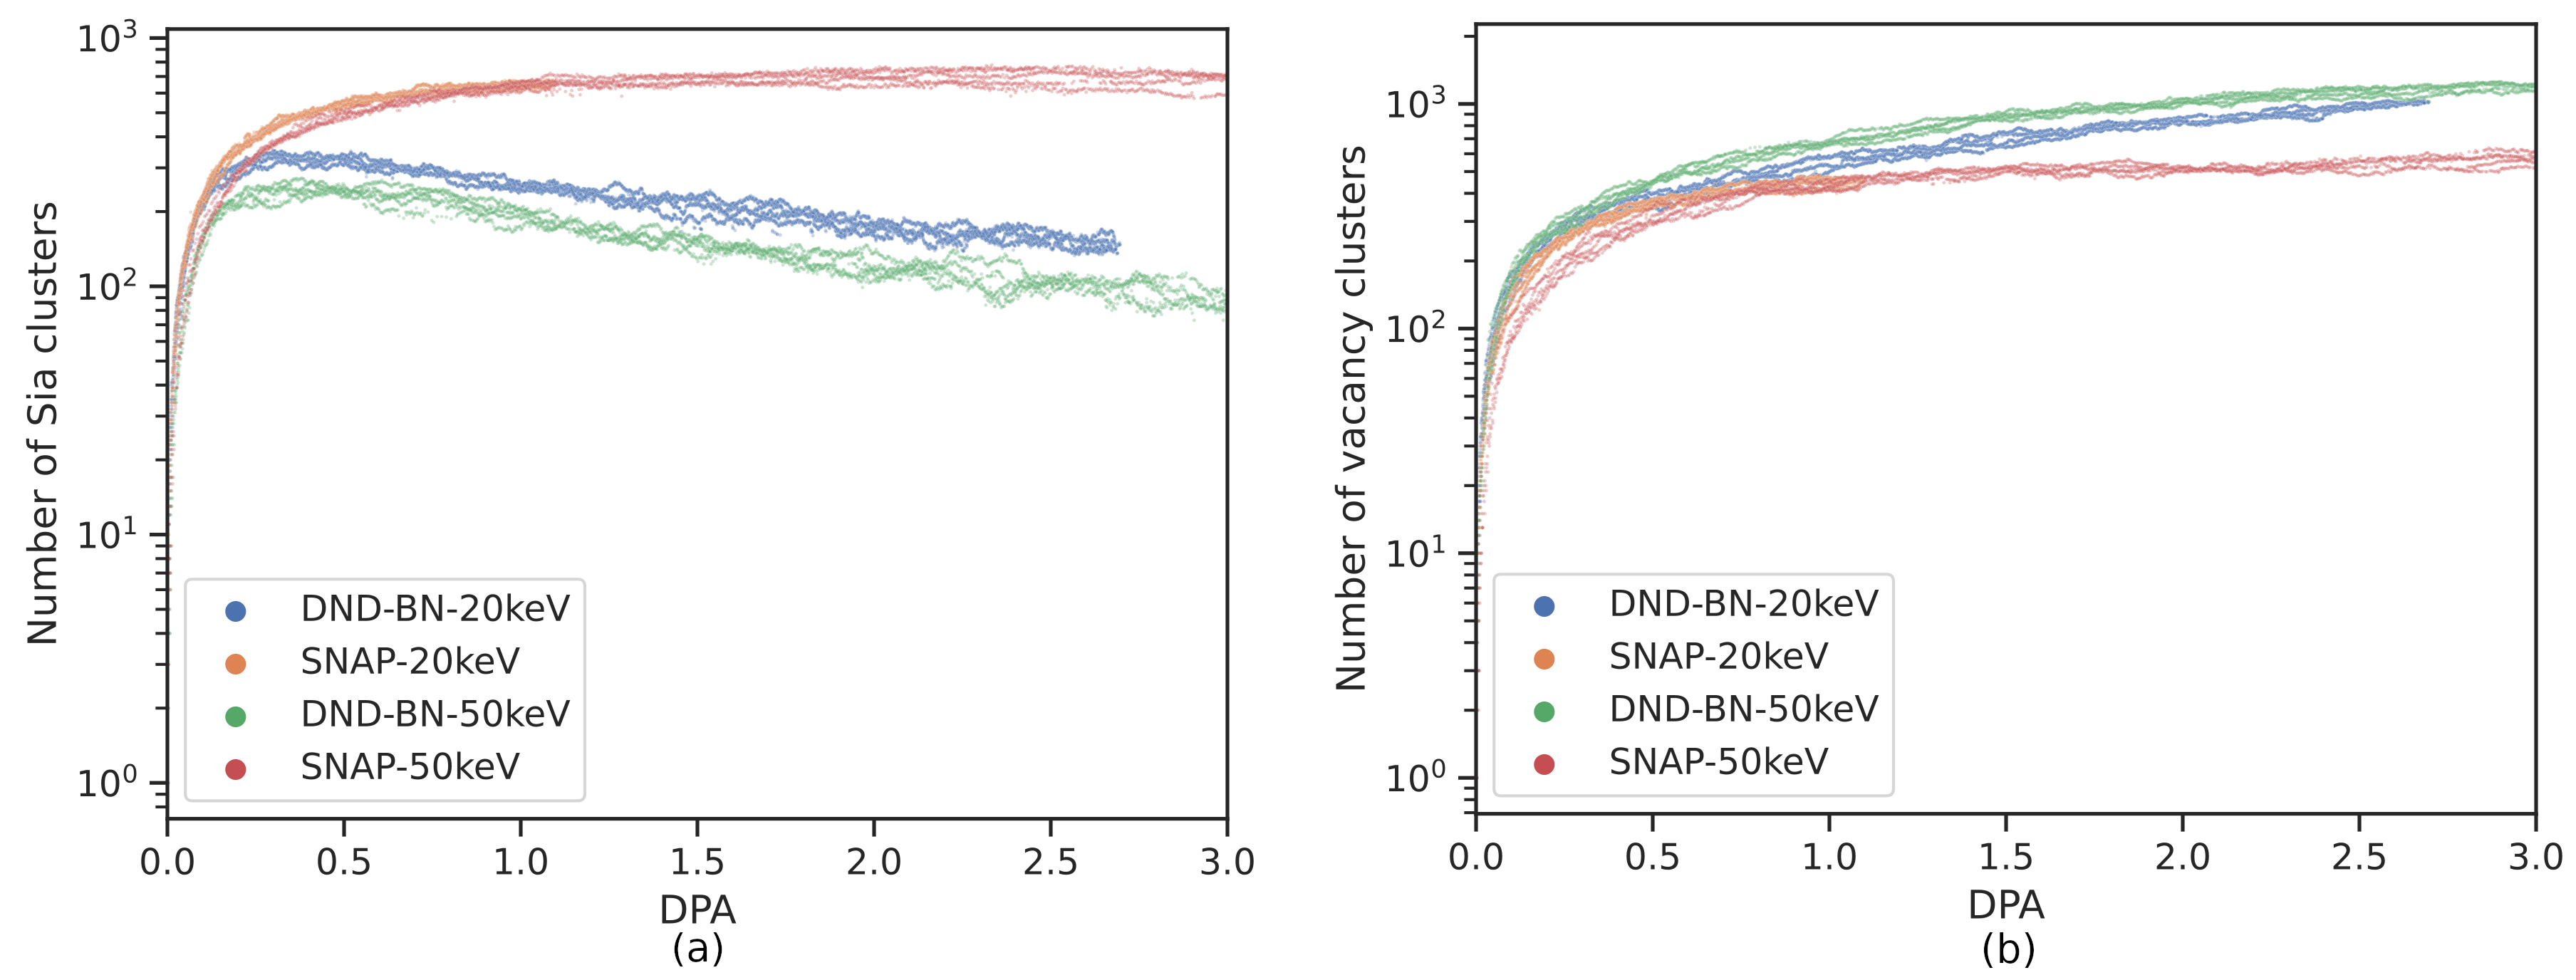
Fig.3 shows the variation of the percentage of
in-cluster SIAs and vacancies as a function
of dpa. From Fig.3 (a) it can be seen that the percentage of
interstitials in clusters quickly rises and reaches to greater than 95 % by 0.2 dpa for
SNAP and by 0.5 dpa for DND-BN. Again the rising curves are separated by IAP
type rather than the PKA energy. For the in-cluster vacancies case shown
in Fig.3 (b), there is a gradual rise with dpa. Unlike the in-cluster
interstitials case, there is a well defined separation in the variation of the
percentage of vacancies in clusters for both the PKA energies and for the IAP.
The vacancies also show greater variability for different simulation trials.
In general the SNAP potential shows a larger number of in-cluster vacancies.
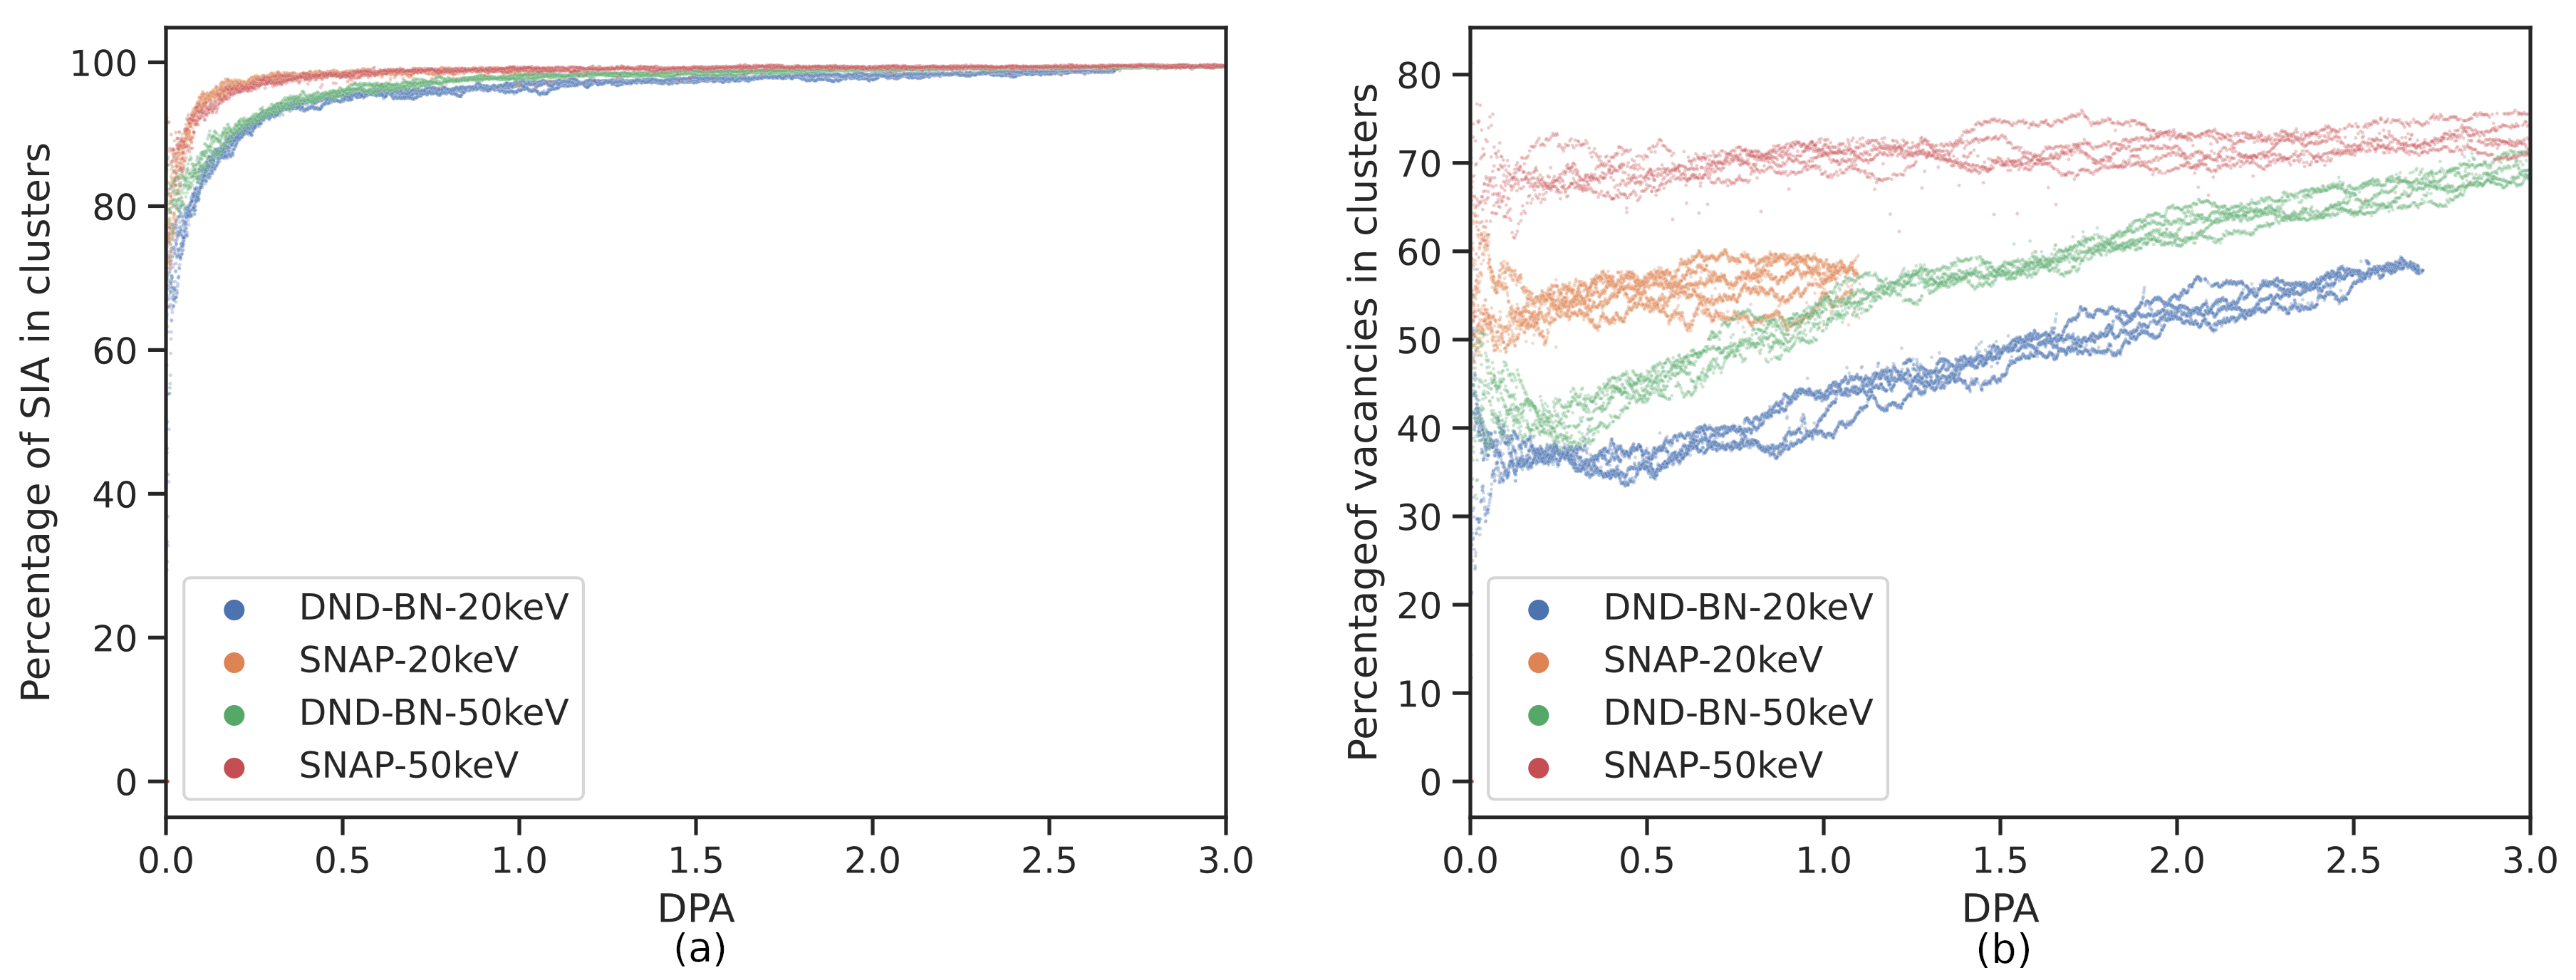
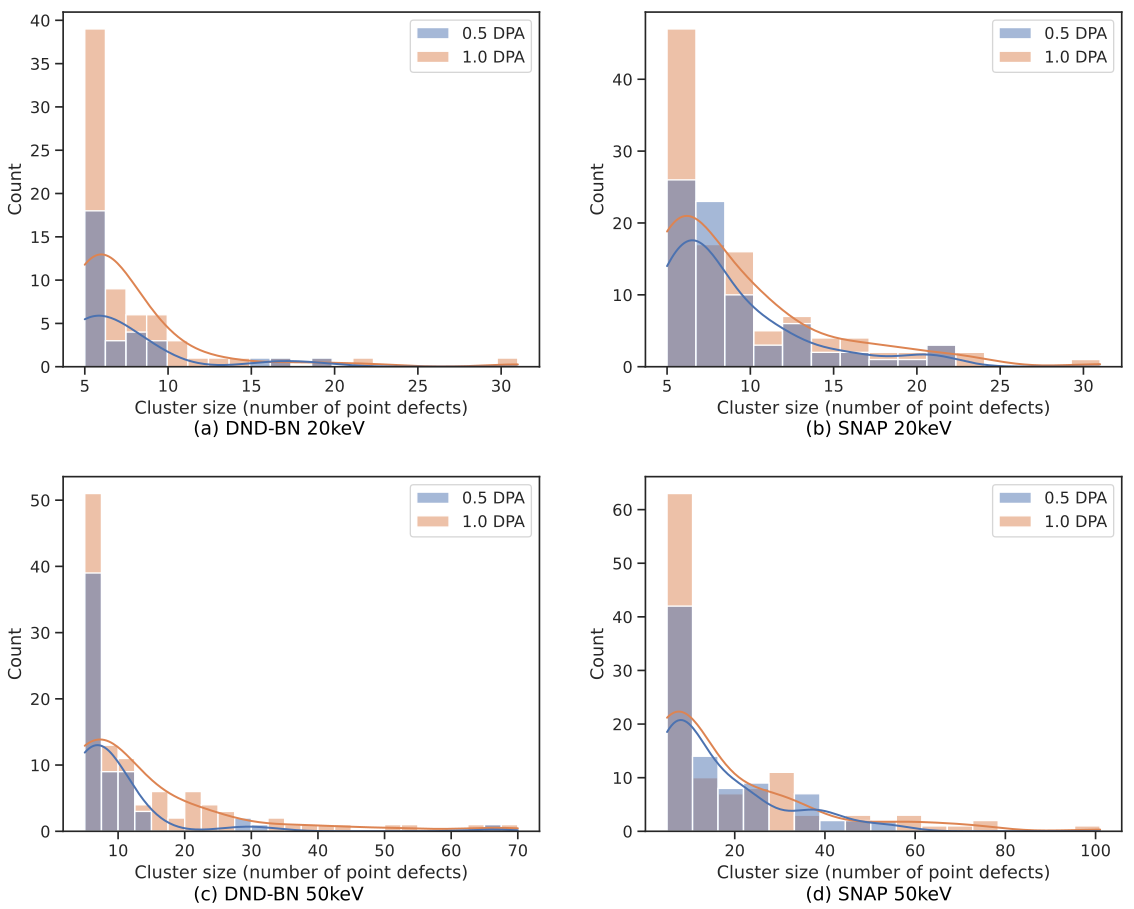
Fig.4 shows the vacancy cluster size distribution for all the vacancy clusters with size more than 5 number of vacancies. As the dpa increases from 0.5 to 1.0, the maximum vacancy size and the counts for all the sizes both grow in all the cases. The vacancy sizes for the same dpa at different energies are vastly different. The 50keV energy cases for both the IAPs have bigger vacancy clusters compared to 20keV. This is expected because at both these energies, W still prefers single sub-cascade [13] and the 50keV single sub-cascade will have a bigger central core of vacant sites. It can be seen that the distributions of SNAP IAP have slightly fatter tails signifying tendency to have more of bigger vacancy clusters. This is contrary to the SIA cluster size distribution as we will show in the following results.
The Savi algorithm of CSaransh [11] was used to classify the SIA
clusters based on their morphology and orientations. Fig.5 shows the
variation of the total number of defect clusters in the various classes of
morphology as a function of dpa for the four cases (two IAP at two energies, 20
and 50 keV). The plot is for a specific trial however all the other trial
simulations show similar trend. Note that the dpa extent on the X-axis for the
four cases are different. The different morphologies are represented by
different ASCII letters. signifies clusters with dumbbells/crowdions
arranged in parallel configuration which form 1/2 \hkl¡1 1 1¿ and \hkl¡1 0 0¿
edge dislocations in W. The symbol signifies C-15 like rings and its basis
configurations. There are also mixed morphologies defects with multiple
components and we distinguish between defect morphologies based on both
components and full defect morphology. The symbol is for defects
composed of two or more dislocations in different orientations. In the Figure
legend, the symbol represents the number of defects that form
\hkl¡1 1 1¿ edge dislocation and are part of a multi-component dislocation
while is the number of defects that form pure \hkl¡1 1 1¿
dislocation. The symbol is for the configuration that form \hkl¡1
1 1¿ dislocation while also being attached to a ring . The properties such
as diffusion, stability and interaction of the same component can vary
in the above three cases.
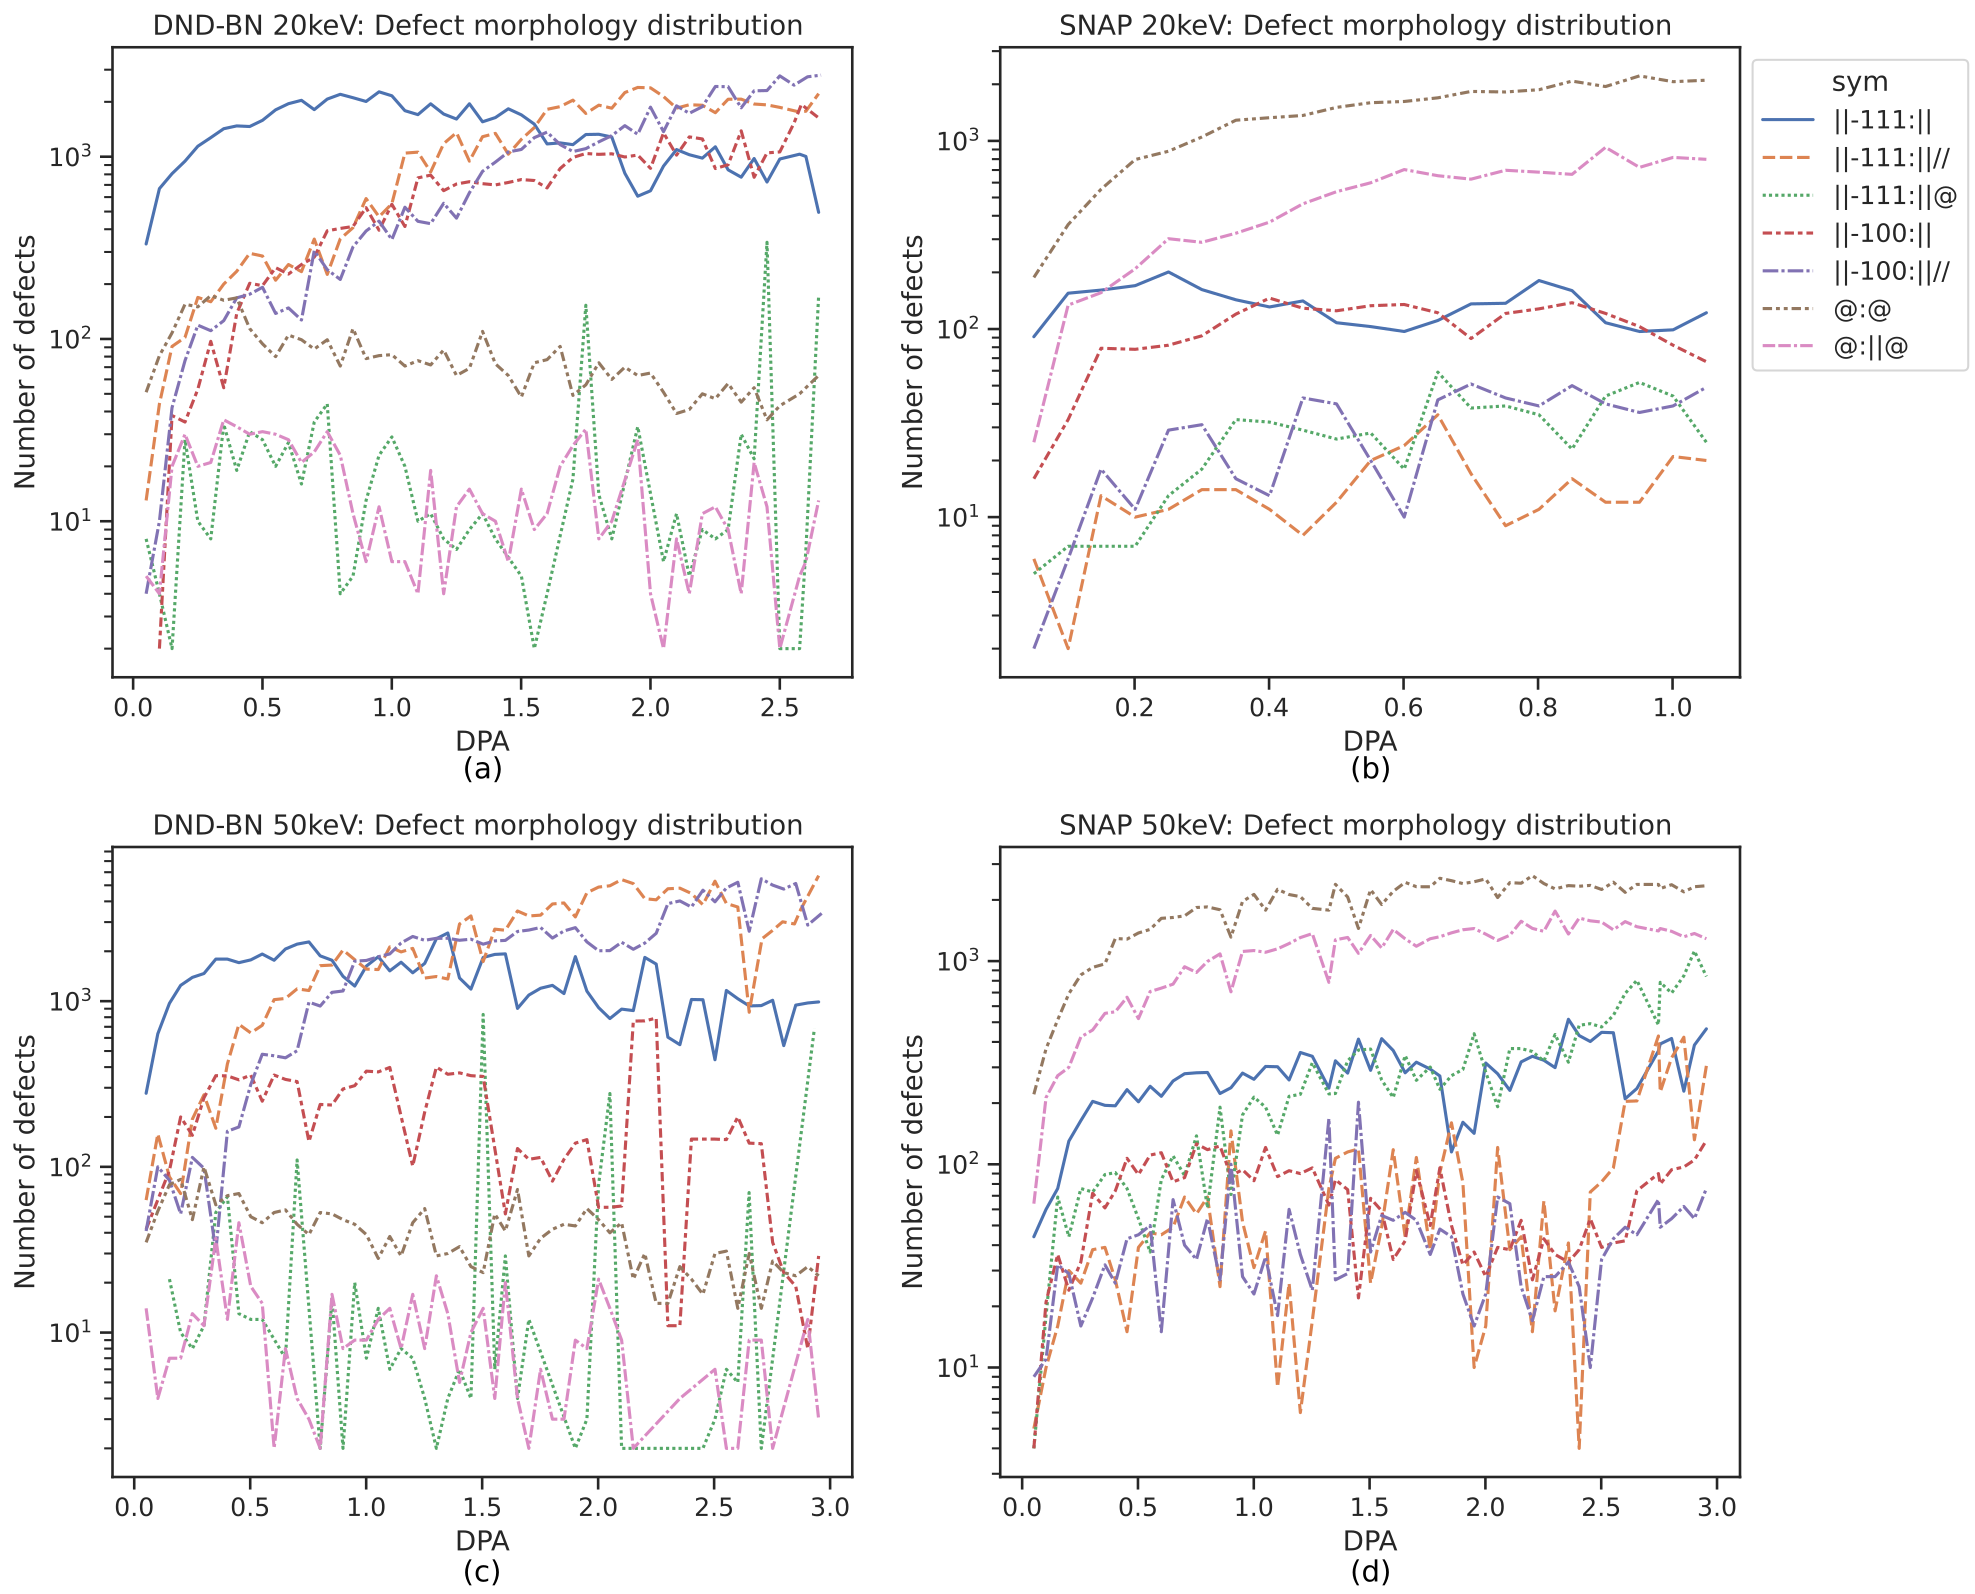
The number of defects in different morphologies remain similar for the two energies,
whereas notable difference exists across the two IAPs.
It is seen that the SNAP IAP results in significantly higher number of ring like structures
(Fig.5). The rings remain dominant through out the DPA range and do not decrease at any point.
The DND-BN potential in contrast shows very few ring like structures and
the micro-structure is dominated by the edge dislocations . Initially, the
1/2\hkl¡111¿ edge-dislocations in pure () as well as mixed defects are
dominating however with higher dpa the \hkl¡1 0 0¿ dislocations become dominant
and pure \hkl¡1 1 1¿ dislocations start to drop. The SNAP IAP has very less \hkl¡1 0 0¿
edge-dislocations.
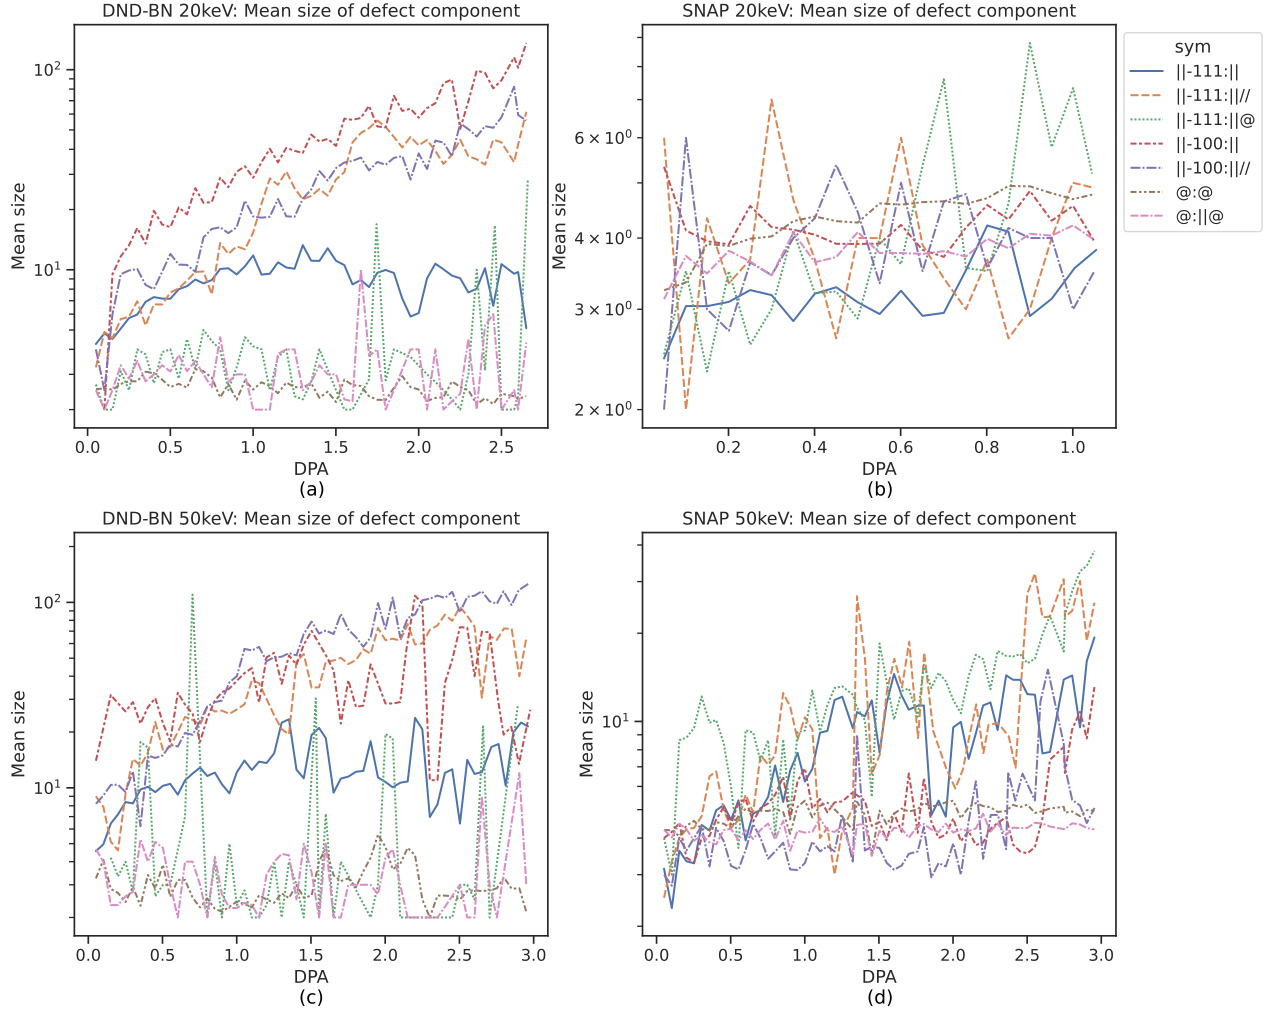
The mean sizes of the SIA defect clusters in various morphologies as a function
of dpa are shown in fig.6 for the two IAP at PKA energies 20 and 50
keV. The \hkl¡1 1 1¿ parallel defects ()
that form glissile 1/2 \hkl¡1 1 1¿ edge dislocations have a mean size of few
tens of defects in all the four cases. The mean size of \hkl¡1 0 0¿ dislocation component is
slightly higher than \hkl¡1 1 1¿ in DND-BN.
The small \hkl¡1 0 0¿ edge dislocations defects are not stable in W
[21] as a result the mean size of \hkl¡1 0 0¿
dislocations () is higher in DND-BN than the \hkl¡1 1 1¿ parallel
defects which includes bigger \hkl¡1 1 1¿ edge dislocations as well as many
small parallel pairs, triplets etc. of dumbbells which form very often with
every collision cascade. In SNAP rarely gets formed.
For SNAP, the mean size of rings remain less that 10 although the maximum is a
few tens of point defects. A good number of bigger \hkl¡1 1 1¿ edge
dislocations appear in conjunction with a ring component (). It is
seen that for both the IAPs the C15 ring like structures ( and ) are
small while the \hkl¡1 1 1¿ and \hkl¡1 0 0¿ defects are relatively much bigger,
especially for the DND-BN potential. This matches the trend of larger sized
loop formation at higher DPA in the range 0-1 dpa as seen in proton bombardment
studies of tungsten [35].
The trend of mean sizes for dislocations () are slightly different for the two energies. For DND-BN at 20keV, the sizes of \hkl¡1 0 0¿ and \hkl¡1 1 1¿ in multi-componenet dislocation defect () start at lower value and increase gradually in size with DPA while at 50 keV the sizes of these morphologies get comparatively higher from the beginning. For SNAP, at 20keV the mean sizes remain slightly lower when compared with 50keV.
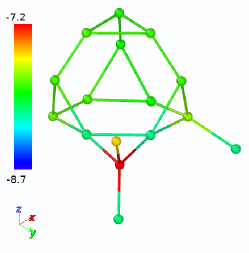
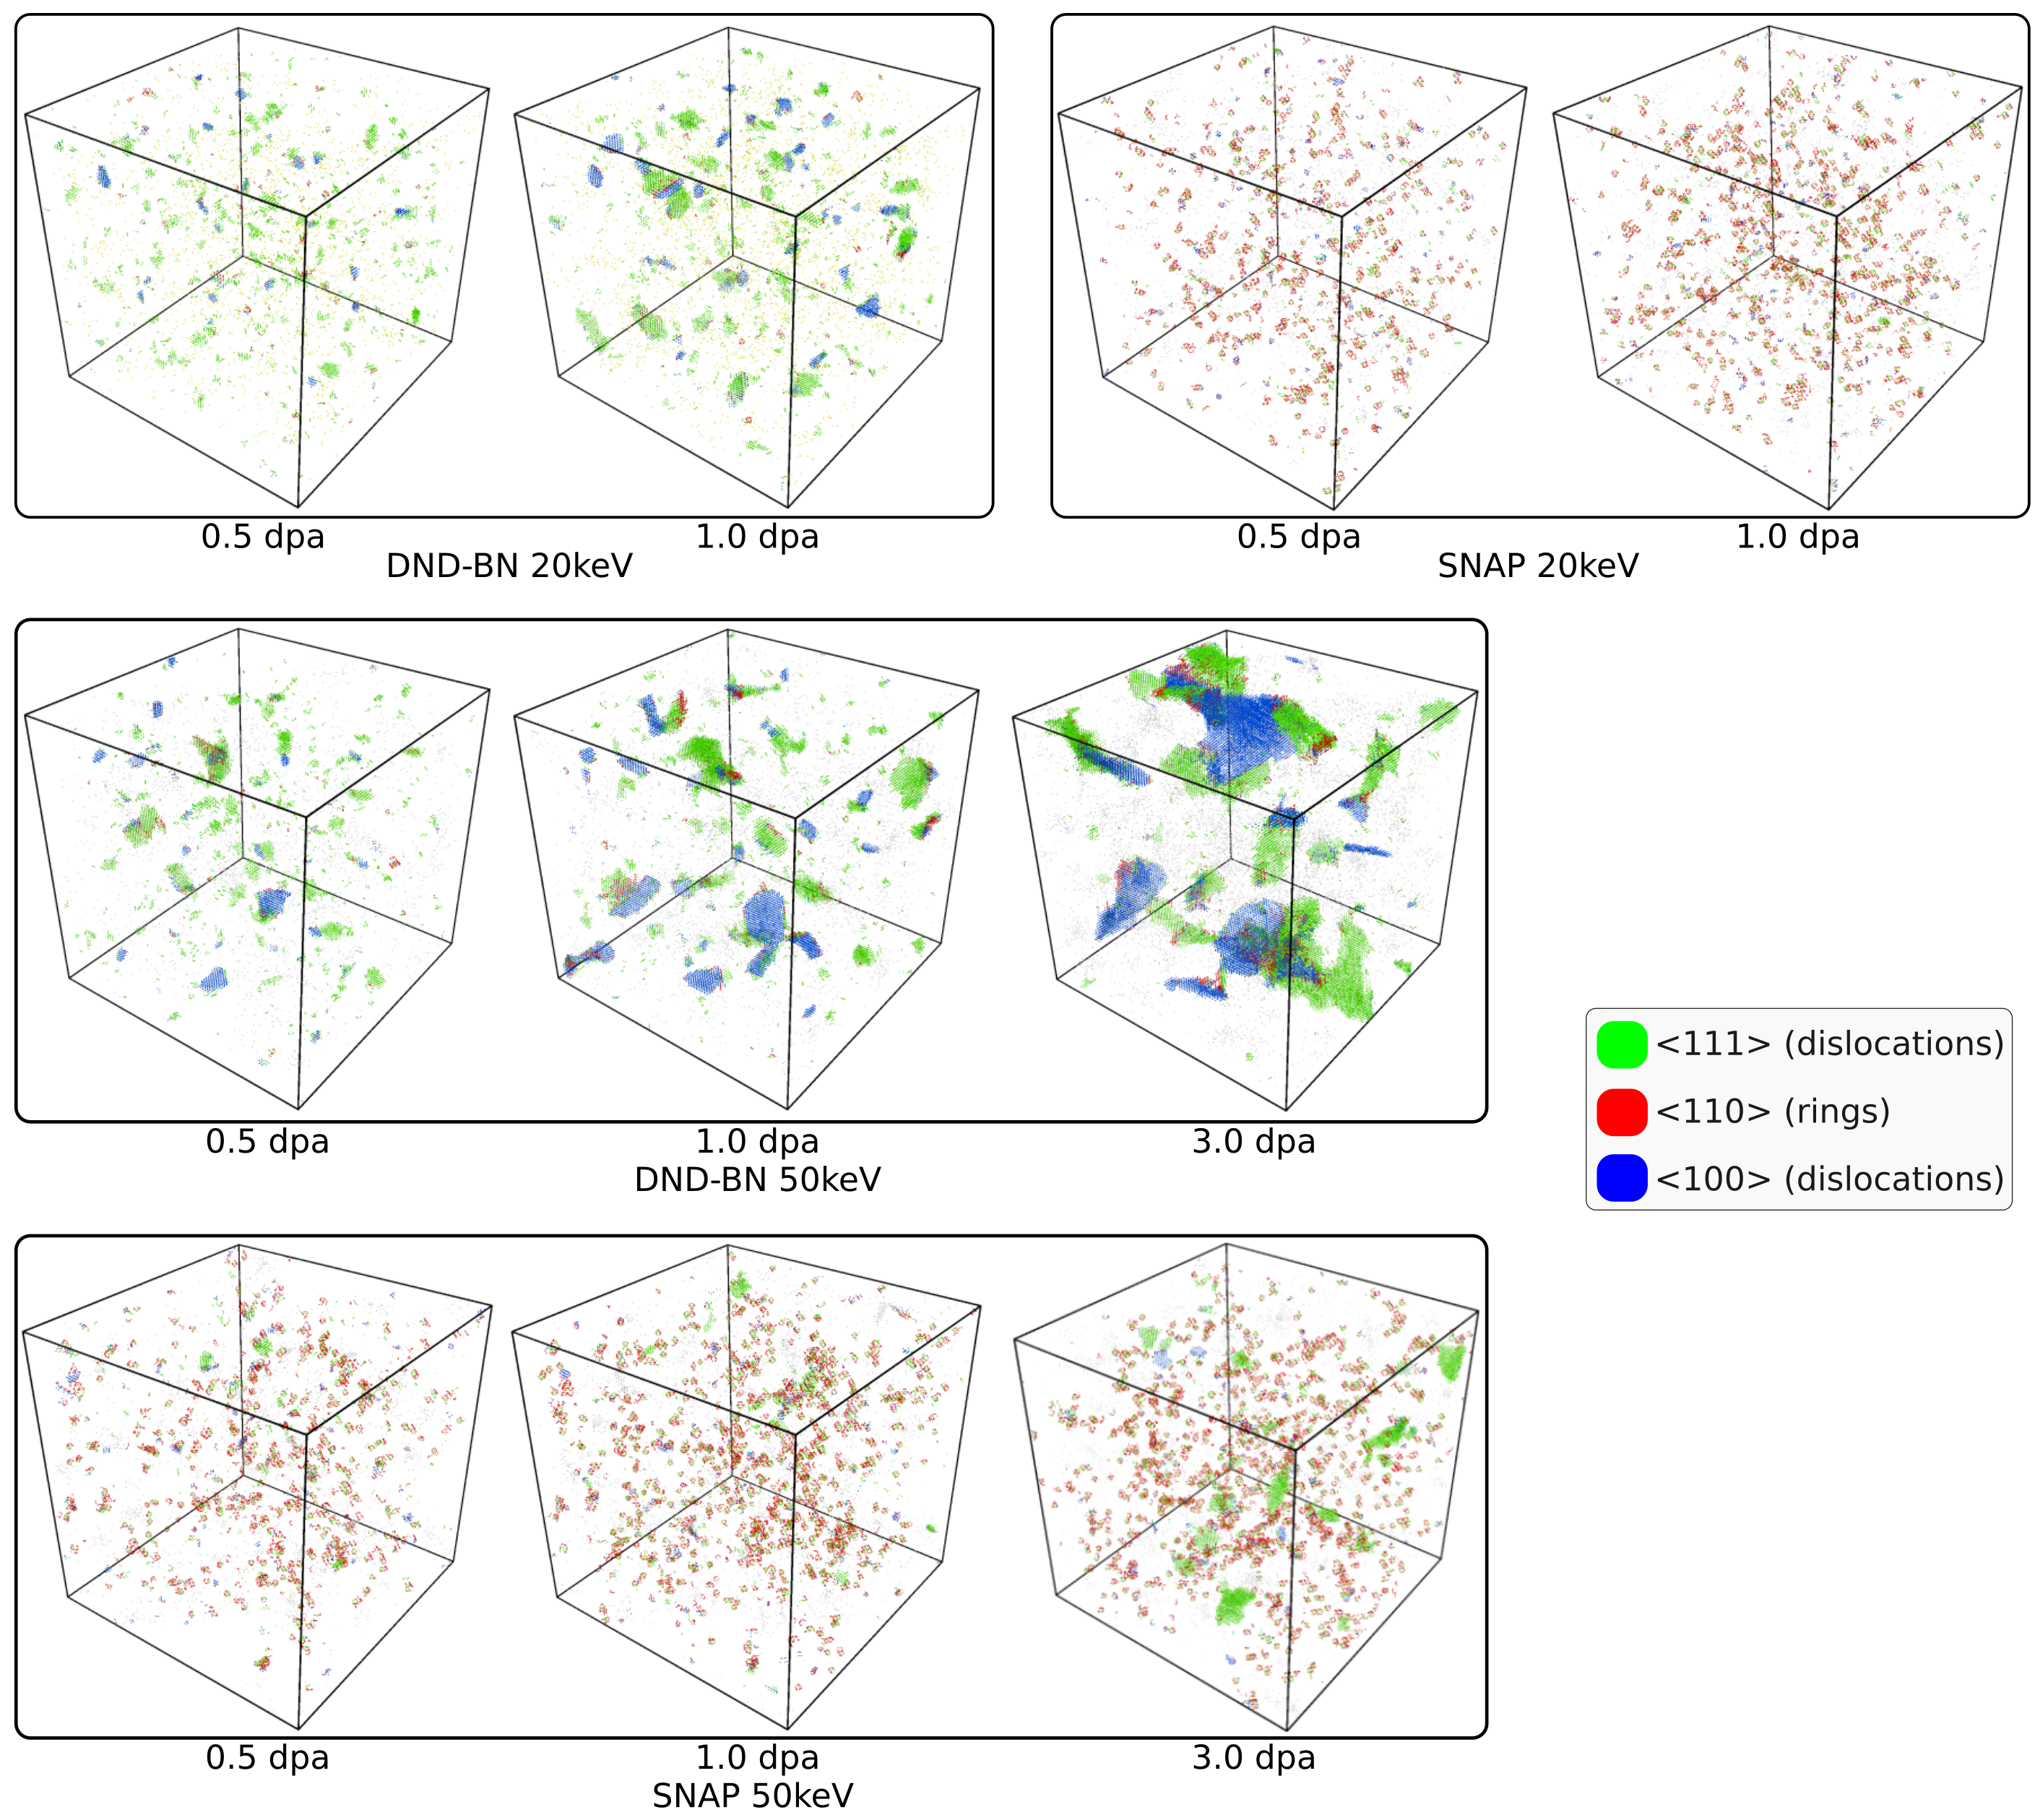
Fig.7 shows the SIA defects in the simulation box at different dpa. The SIA are coloured based on the orientation of dumbbells/crowdions as found using SaVi algorithm [11]. The bigger clusters of parallel \hkl¡1 1 1¿ and \hkl¡1 0 0¿ dumbbells/crowdions form the edge dislocations with burgers vector of 1/2\hkl¡1 1 1¿ and \hkl¡1 0 0¿, respectively. The \hkl¡1 1 0¿ dumbbells sometimes appear at the interface between a multi-component dislocation but mostly they form the C15 like rings or their basis () defect configurations. The frames in the Fig.7, qualitatively show the differences in morphology of SIAs in the four cases as discussed in the morphology and size distribution plots earlier. The SNAP IAP forms lots of small C15 like rings while in case of DND-BN we see bigger \hkl¡1 1 1¿ and \hkl¡1 0 0¿ defects being formed as the dpa increases. Fig.8 shows a typical C15 3d ring defect. These sessile defects are dominant morphology in SNAP simulations. With increasing dpa, the rings remain stable and their numbers and sizes grow slowly.
The number of \hkl¡1 0 0¿ dislocations increase in DND-BN sometimes due to morphology transition from \hkl¡1 1 1¿ dislocation to \hkl¡1 0 0¿. The diffusion and creation of more dislocations results in dislocations being combined to form bigger multi-dislocations and dislocation network. This results in reduction of the number of different defects as shown in Fig.2. The sizes of the defects at 20 keV 1 dpa matches more with 50 keV 0.5 dpa than with 50 keV 1 dpa. This can be understood as a result of the bigger clusters being formed right after a 50 keV collision cascade as compared to a 20 keV collision cascade.
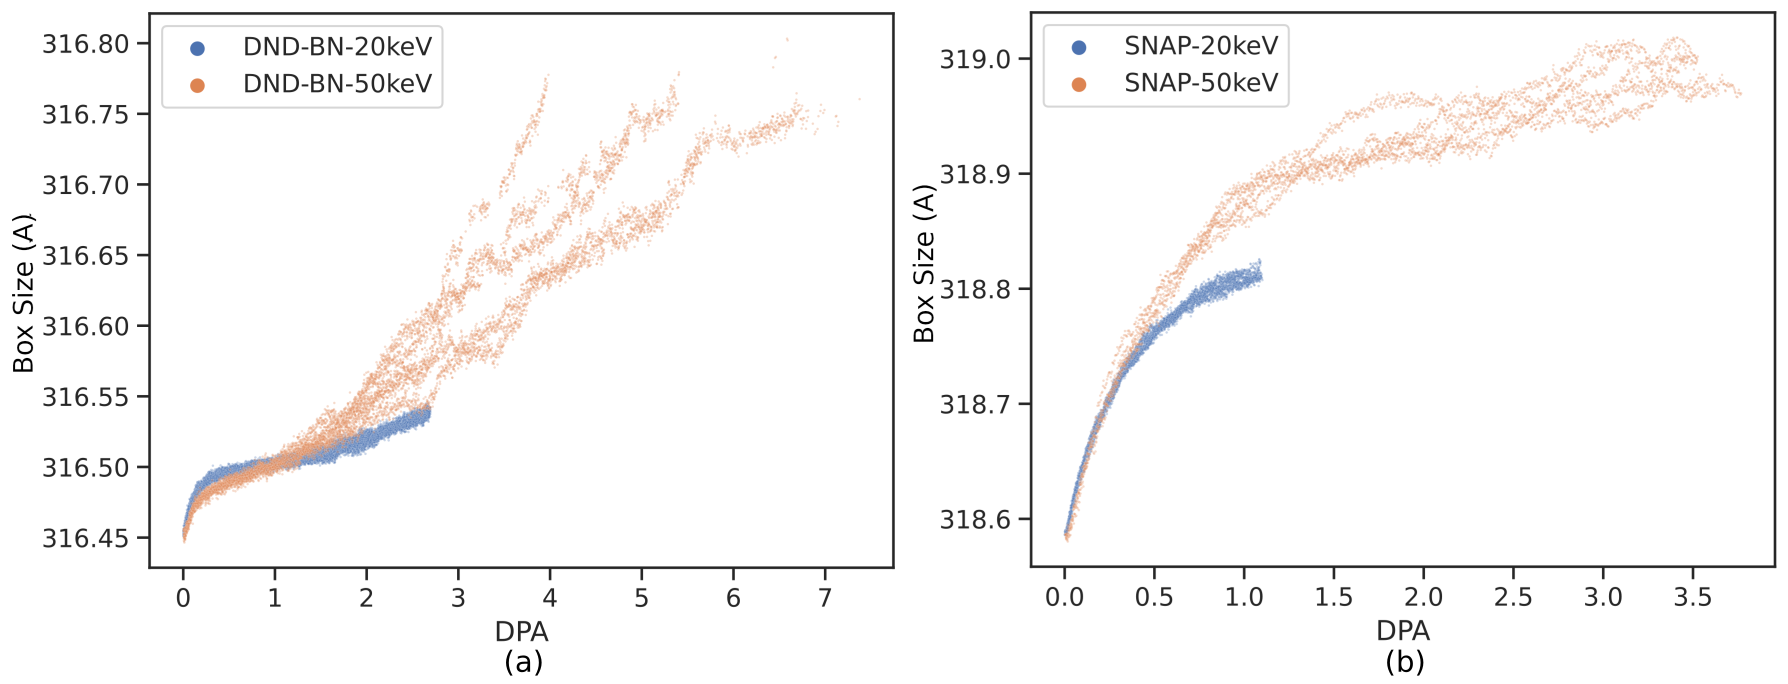
Fig.9 shows the expansion or swelling of the simulation box as a function of dpa. The increase in simulation box size is more significant in SNAP IAP than DND-BN. The swelling in 50 keV is slightly more for both the potentials. The increase saturates in the case of SNAP while it saturates mid-way but again starts to increase in the case of DND-BN.
4 Discussion
Many of the material properties are known to correlate well with the dpa since it captures both the energy of the incident particle and the fluence. The creation relaxation algorithm (CRA) [29, 30] is also based on the same fact that the material properties show a good correlation with dpa [23].
Many of the microstuctural properties at the atomistic scale that we observed in the MD simulations show good correlation with dpa irrespective of the energy of the PKA. The properties such as the number of defect clusters (Fig.3) and the in-cluster interstitials (Fig.4) show a good correlation with dpa and therefore can be expected to be correlated to the material property changes which correlate to dpa. However their values slightly vary based on the IAP used. The evolution of the number of point defects with dpa show slight differences at two PKA energies while the significant differences are observed in the sizes of both vacancy clusters and SIA clusters. This is to be expected as the clusters formed at the primary damage state are bigger for higher energy.
Many of the microstructural parameters such as the number of point defects, sizes and number of vacancy clusters, percentage of SIAs in clusters etc. are similar for both the two IAPs used. However, there is a significant difference between the two IAPs when we look at the SIA cluster sizes which arises due to underlying differences in morphology distribution of SIA defect clusters. The experiments have shown presence of large \hkl¡1 1 1¿ and \hkl¡1 0 0¿ dislocations in W at 1 dpa and below [36, 37, 38]. DND-BN shows these dislocations to be most prominent among all the morphologies, the SNAP IAP shows very less \hkl¡1 1 1¿ dislocations of considerable size and \hkl¡1 0 0¿ dislocations are even rarer. The earlier studies have shown that the rings are quite stable in W [22] once formed and even if they transition they do so to small clusters of \hkl¡1 1 1¿ dumbbells and crowdions. To further establish the stability of rings that are formed, we gave 10 ns annealing simulations at 2000K temperature for the 1.0 dpa simulation output of SNAP IAP. We found that the rings remain stable even at the end of the simulation. The microstructure suggested by DND-BN potential with both \hkl¡1 1 1¿ and \hkl¡1 0 0¿ seems to be more inline with experiments. However, the SNAP IAP is stated to be more close to the ab-initio calculations [32]. The ML IAPs such as SNAP depend heavily on the dataset on which they are trained. To further evalute the IAPs, detailed simulations of annealing for longer time scales at different DPAs will have to be performed to match the conditions of experimental studies.
5 Conclusions
MD simulations of successive collision cascades have been carried out in tungsten at PKA energies of 20 keV and 50 keV using an EAM and a ML based inter-atomic potential. Five sample simulations were carried out for 3000 successive PKAs reaching a dose of 1-3 dpa at each energy and for both the IAP.
The analysis was carried out after each PKA which amounts to analysing 40000 simulations for various properties of interest such as the number of defects, their cluster sizes and morphologies etc. We have shown the trends of these properties with dpa (up-to 3 dpa), while also contrasting and comparing results from different energies and IAPs. We have carried out 5 trials for each energy and IAP and following results stand out in all the cases.
-
1.
The micro-structure produced due to the SCC are very different for the two potentials due to differences in SIA defect cluster morphologies. The EAM potential produces a micro-structure dominated by \hkl¡1 1 1¿, \hkl¡1 0 0¿ and mixed parallel defect clusters while the ML based potential produces smaller C15 Laves phase structures with a smattering of larger \hkl¡1 1 1¿ and even fewer \hkl¡1 0 0¿ clusters.
-
2.
The variation of the number density of defect clusters with dpa was similar for both the PKA energies for a given IAP. This implies that any material property that correlates well with dpa would also correlate well with this parameter.
-
3.
The SIA and vacancy cluster sizes are notably higher in higher energy at the same dpa as higher energy PKA results in bigger defect clusters in primary damage. The number of point defects also are slightly higher at 50 keV.
-
4.
The fraction of interstitials in cluster as a function of dpa was independent of the energy of the PKA, whilst the fraction of vacancy clusters was dependent on the PKA energy.
The microstructure predicted by the two IAPs at different dpa has been shown to be significantly different, both qualitatively and quantitavely. The quantitative results from the two IAPs do not look significantly different unless we look at the defect morphology distribution. This underscores the importance of morphology distribution studies while analysing collision cascades. High energy ion bombardment experiments with active cooling of the target and SCC simulations with morphology and size distribution can be effective for validating IAPs and examining micro-structure. In the present study, the significantly higher number of small C15 rings for ML potential (SNAP) when compared to EAM potential (DND-BN) which shows both \hkl¡1 1 1¿ and \hkl¡1 0 0¿ dislocations indicate that the EAM potential has a better match with the experimental observations. The experimentts show high fraction of defects forming \hkl¡1 1 1¿ and \hkl¡1 0 0¿ dislocations [36, 37, 38] and do no observe rings, possibly because of small sizes of ring based defects. The presence of small sessile defects can have significant impact on defect evolution and material properties. A detailed simulation study with annealing and longer time evolution of microstructure is needed to further bolster this finding.
Acknowledgements
We acknowledge the HPC team at CAD for the HPC maintenance and for support in installing LAMMPS.
References
References
- [1] J. B. Gibson, A. N. Goland, M. Milgram, G. H. Vineyard, Dynamics of radiation damage, Phys. Rev. 120 (1960) 1229–1253. doi:10.1103/PhysRev.120.1229.
- [2] S. Zinkle, 1.03 - radiation-induced effects on microstructure*, in: R. J. Konings (Ed.), Comprehensive Nuclear Materials, Elsevier, Oxford, 2012, pp. 65 – 98. doi:https://doi.org/10.1016/B978-0-08-056033-5.00003-3.
-
[3]
K. Nordlund,
Historical
review of computer simulation of radiation effects in materials, Journal of
Nuclear Materials 520 (2019) 273–295.
doi:https://doi.org/10.1016/j.jnucmat.2019.04.028.
URL https://www.sciencedirect.com/science/article/pii/S0022311518314703 - [4] R. Stoller, S. Golubov, C. Domain, C. Becquart, Mean field rate theory and object kinetic monte carlo: A comparison of kinetic models, Journal of Nuclear Materials 382 (2) (2008) 77 – 90, microstructural Processes in Irradiated Materials. doi:http://dx.doi.org/10.1016/j.jnucmat.2008.08.047.
- [5] R. Stoller, 1.11 - primary radiation damage formation, in: R. J. Konings (Ed.), Comprehensive Nuclear Materials, Elsevier, Oxford, 2012, pp. 293 – 332. doi:https://doi.org/10.1016/B978-0-08-056033-5.00027-6.
-
[6]
D. Bacon, F. Gao, Y. Osetsky,
The
primary damage state in fcc, bcc and hcp metals as seen in molecular dynamics
simulations, Journal of Nuclear Materials 276 (1) (2000) 1–12.
doi:https://doi.org/10.1016/S0022-3115(99)00165-8.
URL https://www.sciencedirect.com/science/article/pii/S0022311599001658 -
[7]
L. Malerba,
Molecular
dynamics simulation of displacement cascades in fe: A critical
review, Journal of Nuclear Materials 351 (1) (2006) 28–38, proceedings of
the Symposium on Microstructural Processes in Irradiated Materials.
doi:https://doi.org/10.1016/j.jnucmat.2006.02.023.
URL https://www.sciencedirect.com/science/article/pii/S0022311506000638 -
[8]
Cascadesdb is a database of molecular dynamics
simulations of collision cascades, developed by the international atomic
energy agency.
URL https://cascadesdb.org/ -
[9]
A. De Backer, C. S. Becquart, P. Olsson, C. Domain,
Modelling
the primary damage in fe and w: influence of the short-range interactions on
the cascade properties: Part 2 – multivariate multiple linear regression
analysis of displacement cascades, Journal of Nuclear Materials 549 (2021)
152887.
doi:https://doi.org/10.1016/j.jnucmat.2021.152887.
URL https://www.sciencedirect.com/science/article/pii/S0022311521001100 -
[10]
U. Bhardwaj, A. E. Sand, M. Warrier,
Classification
of clusters in collision cascades, Computational Materials Science 172
(2020) 109364.
doi:https://doi.org/10.1016/j.commatsci.2019.109364.
URL https://www.sciencedirect.com/science/article/pii/S0927025619306639 -
[11]
U. Bhardwaj, A. E. Sand, M. Warrier,
Graph
theory based approach to characterize self interstitial defect morphology,
Computational Materials Science 195 (2021) 110474.
doi:https://doi.org/10.1016/j.commatsci.2021.110474.
URL https://www.sciencedirect.com/science/article/pii/S0927025621001993 - [12] U. Bhardwaj, H. Hemanu, M. Warrier, N. Semwal, K. Ali, A. Arya, Saransh : Software suite to study molecular dynamics simulations of collision cascades, Journal of Open Source Software 4(41) (2019) 1461. doi:https://doi.org/10.21105/joss.01461.
- [13] U. Bhardwaj, M. Warrier, Identifying subcascades from the primary damage state of collision cascades (2023). arXiv:2306.04975.
-
[14]
J. Byggmästar, F. Granberg, K. Nordlund,
Effects
of the short-range repulsive potential on cascade damage in iron, Journal of
Nuclear Materials 508 (2018) 530–539.
doi:https://doi.org/10.1016/j.jnucmat.2018.06.005.
URL https://www.sciencedirect.com/science/article/pii/S0022311518305166 -
[15]
C. S. Becquart, A. Souidi, M. Hou,
Relation between
the interaction potential, replacement collision sequences, and collision
cascade expansion in iron, Phys. Rev. B 66 (2002) 134104.
doi:10.1103/PhysRevB.66.134104.
URL https://link.aps.org/doi/10.1103/PhysRevB.66.134104 -
[16]
D. Terentyev, C. Lagerstedt, P. Olsson, K. Nordlund, J. Wallenius, C. Becquart,
L. Malerba,
Effect
of the interatomic potential on the features of displacement cascades in
: A molecular dynamics study, Journal of Nuclear Materials
351 (1) (2006) 65–77, proceedings of the Symposium on Microstructural
Processes in Irradiated Materials.
doi:https://doi.org/10.1016/j.jnucmat.2006.02.020.
URL https://www.sciencedirect.com/science/article/pii/S0022311506000675 -
[17]
A. Sand, J. Dequeker, C. Becquart, C. Domain, K. Nordlund,
Non-equilibrium
properties of interatomic potentials in cascade simulations in tungsten,
Journal of Nuclear Materials 470 (2016) 119–127.
doi:https://doi.org/10.1016/j.jnucmat.2015.12.012.
URL https://www.sciencedirect.com/science/article/pii/S0022311515303810 -
[18]
U. Bhardwaj, A. E. Sand, M. Warrier,
Comparison of sia defect
morphologies from different interatomic potentials for collision cascades in
w, Modelling and Simulation in Materials Science and Engineering 29 (6)
(2021) 065015.
doi:10.1088/1361-651X/ac095d.
URL https://dx.doi.org/10.1088/1361-651X/ac095d - [19] C. Domain, C. Becquart, L. Malerba, Simulation of radiation damage in fe alloys: an object kinetic monte carlo approach, Journal of Nuclear Materials 335 (1) (2004) 121 – 145. doi:http://dx.doi.org/10.1016/j.jnucmat.2004.07.037.
-
[20]
C. Becquart, A. Barbu, J. Bocquet, M. Caturla, C. Domain, C.-C. Fu, S. Golubov,
M. Hou, L. Malerba, C. Ortiz, A. Souidi, R. Stoller,
Modeling
the long-term evolution of the primary damage in ferritic alloys using
coarse-grained methods, Journal of Nuclear Materials 406 (1) (2010) 39–54,
fP6 IP PERFECT Project: Prediction of Irradiation Damage Effects in Reactor
Components.
doi:https://doi.org/10.1016/j.jnucmat.2010.05.019.
URL https://www.sciencedirect.com/science/article/pii/S002231151000231X - [21] U. Bhardwaj, A. E. Sand, M. Warrier, Stability of ¡100¿ dislocations formed in w collision cascades, Journal of Nucl. Mater. 569 (2022) 153938.
-
[22]
L. Liu, N. Gao, Y. Chen, R. Qiu, W. Hu, F. Gao, H. Deng,
Formation
mechanism of interstitial
dislocation loops from irradiation-induced c15 clusters in tungsten, Phys.
Rev. Mater. 5 (2021) 093605.
doi:10.1103/PhysRevMaterials.5.093605.
URL https://link.aps.org/doi/10.1103/PhysRevMaterials.5.093605 - [23] A. Standard, E693-94, Standard practice for characterising neutron exposure in iron and low alloy steels in terms of displacements per atom (dpa).
- [24] G. Was, R. Averback, 1.07 - Radiation Damage Using Ion Beams, Vol. 1-5, Elsevier, 2012, pp. 195–221, publisher Copyright: © 2012 Elsevier Ltd. All rights reserved. doi:10.1016/B978-0-08-056033-5.00007-0.
- [25] M. Norgett, M. Robinson, I. Torrens, A proposed method of calculating displacement dose rates, Nuclear Engineering and Design 33 (1) (1975) 50 – 54. doi:http://dx.doi.org/10.1016/0029-5493(75)90035-7.
- [26] K. Nordlund, S. J. Zinkle, A. E. Sand, F. Granberg, et al., Improving atomic displacement and replacement calculations with physically realistic damage models, Nature Communications 9 (2018) 1084.
- [27] R. Stoller, K. Nordlund, S. Simakov, Summary report of the technical meeting on primary radiation damage: from nuclear reaction to point defects, INDC International Nuclear Data Committee Report INDC-NDS-0624.
- [28] R. Stoller, L. R. Greenwood, S. Simakov, Summary report of the first research coordination meeting on primary radiation damage cross sections, INDC International Nuclear Data Committee Report INDC-NDS-0648.
-
[29]
A. R. Warwick, M. Boleininger, S. L. Dudarev,
Microstructural
complexity and dimensional changes in heavily irradiated zirconium, Phys.
Rev. Mater. 5 (2021) 113604.
doi:10.1103/PhysRevMaterials.5.113604.
URL https://link.aps.org/doi/10.1103/PhysRevMaterials.5.113604 -
[30]
D. R. Mason, F. Granberg, M. Boleininger, T. Schwarz-Selinger, K. Nordlund,
S. L. Dudarev,
Parameter-free
quantitative simulation of high-dose microstructure and hydrogen retention in
ion-irradiated tungsten, Phys. Rev. Mater. 5 (2021) 095403.
doi:10.1103/PhysRevMaterials.5.095403.
URL https://link.aps.org/doi/10.1103/PhysRevMaterials.5.095403 - [31] C. Björkas, K. Nordlund, S. Dudarev, Modelling radiation effects using the ab-initio based tungsten and vanadium potentials, Nuclear Instruments and Methods in Physics Research Section B: Beam Interactions with Materials and Atoms 267 (18) (2009) 3204 – 3208, proceedings of the Ninth International Conference on Computer Simulation of Radiation Effects in Solids. doi:http://dx.doi.org/10.1016/j.nimb.2009.06.123.
- [32] M. A. Wood, A. P. Thompson, Quantum-accurate molecular dynamics potential for tungsten (2017). arXiv:1702.07042.
- [33] J. F. Ziegler, J. P. Biersack, The stopping and range of ions in matter, in: Treatise on Heavy-Ion Science, Springer, 1985, pp. 93–129.
- [34] H. Hemani, A. Majalee, U. Bhardwaj, A. Arya, K. Nordlund, M. Warrier, Inclusion and validation of electronic stopping in the open source lammps code (2020). arXiv:2005.11940.
-
[35]
R. Rayaprolu, S. Möller, R. Abernethy, M. Rasinski, J. Haley, C. Linsmeier,
Indentation
testing on 3 mev proton irradiated tungsten, Nuclear Materials and Energy
25 (2020) 100776.
doi:https://doi.org/10.1016/j.nme.2020.100776.
URL https://www.sciencedirect.com/science/article/pii/S2352179120300521 -
[36]
X. Yi, M. L. Jenkins, M. A. Kirk, Z. Zhou, S. G. Roberts,
In-situ
tem studies of 150 kev w+ ion irradiated w and w-alloys: Damage production
and microstructural evolution, Acta Materialia 112 (2016) 105–120.
doi:https://doi.org/10.1016/j.actamat.2016.03.051.
URL https://www.sciencedirect.com/science/article/pii/S135964541630204X - [37] Y. Li, L. Wang, G. Ran, Y. Yuan, L. Wu, X. Liu, X. Qiu, Z. Sun, Y. Ding, Q. Han, et al., In-situ tem investigation of 30 kev he+ irradiated tungsten: Effects of temperature, fluence, and sample thickness on dislocation loop evolution, Acta Materialia 206 (2021) 116618.
- [38] R. Harrison, J. Hinks, S. Donnelly, Influence of pre-implanted helium on dislocation loop type in tungsten under self-ion irradiation, Scripta Materialia 150 (2018) 61–65.