On bursty star formation during cosmological reionization - how does it influence the baryon mass content of dark matter halos?
Abstract
The baryon mass content (i.e. stellar and gas mass) of dark matter halos in the early Universe depends on both global factors - e.g. ionising ultraviolet (UV) radiation background - and local factors - e.g. star formation efficiency and assembly history. We use a lightweight semi-analytical model to investigate how both local and global factors impact the halo baryon mass content at redshifts of . Our model incorporates a time delay between when stars form and when they produce feedback of , which can drive bursts of star formation, and a mass and redshift dependent UV background, which captures the influence of cosmological reionization on gas accretion onto halos. We use statistically representative halo assembly histories and assume that the cosmological gas accretion rate is proportional to the halo mass accretion rate. Delayed (¿0) feedback leads to oscillations in gas mass with cosmic time, behaviour that cannot be captured with instantaneous feedback (=0). Highly efficient star formation drives stronger oscillations, while strong feedback impacts when oscillations occur; in contrast, inefficient star formation and weak feedback produce similar long-term behaviour to that observed in instantaneous feedback models. If the delayed feedback timescale is too long, a halo retains its gas reservoir but the feedback suppresses star formation. Our model predicts that lower mass systems (halo masses ) at should be strongly gas deficient (), whereas higher mass systems retain their gas reservoirs because they are sufficiently massive to continue accreting gas through cosmological reionization. Interestingly, in higher mass halos, the median , but is a factor of 3-5 smaller when feedback is delayed. Our model does not include seed supermassive black hole feedback, which is necessary to explain massive quenched galaxies in the early Universe.
keywords:
galaxies: formation, galaxies: high-redshift, cosmology: theory, cosmology: dark ages, reionization, first stars, methods: numericalARC Centre of Excellence for All Sky Astrophysics in 3 Dimensions (ASTRO 3D) Anand Menon]anand-jm@hotmail.com
1 Introduction
Recent observations with the JWST have revealed a potential overabundance of massive galaxies () in the high redshift Universe () when compared to the predictions of theoretical models of galaxy formation (Finkelstein2023, 15, 24, e.g.). This has prompted questions about the validity of the standard cosmological model and the early growth of dark matter halos (e.g. boylan-kolchin2023 (5), but see KraghJespersen2024 (22)), as well as questions about our understanding of the interplay between gas reservoirs, star formation, and feedback at early times (Dekel2023, 8, 4, e.g.). Whether or not there is an actual overabundance of massive galaxies when compared to theoretical model predictions (Finkelstein2023_2, 16, see discussion in, e.g., ), the questions these observations have prompted highlight the fundamental time limit imposed by the age of the Universe at early cosmic times when assessing galaxy properties, given the rate at which the highest mass dark matter halos can grow and consequently the stellar masses of the galaxies that they contain.
A similar time limit exists at lower halo masses. It has been understood for some time that the presence of photo-ionizing backgrounds should inhibit the formation of galaxies in low mass dark matter halos (Efstathiou1992, 10, 47, e.g.). For example, the presence of an ultraviolet (UV) background will photo-ionize warm diffuse gas in the inter-galactic medium (IGM), preventing its accretion onto low mass dark matter halos while also preventing gas already present in halos from cooling(Efstathiou1992, 10, e.g.). Such a UV background emerged during cosmological reionization driven by high mass stars (Barkana2001, 1, 50, e.g.), leading to the suppression of galaxy formation in lower mass halos (Gnedin2000, 19, 51, 33, 23, e.g.). Therefore, for lower mass halos to host galaxies, we might argue that there is a time limit imposed by the requirement that they form their stars prior to cosmological reionization, at .
In this paper, we investigate the consequences of the time limit imposed by cosmological reionization for the baryon content - the stellar mass, , and gas mass, - of dark matter halos at high redshifts. In particular, we examine the interplay between the UV background-driven suppression of gas accretion onto lower dark matter halos, stellar feedback driven by star formation in these halos, and their baryon mass content - and . Galaxies embedded within low-mass halos will experience episodes of supernova-driven feedback that deplete their reservoir of star forming gas via powerful winds (Dekel1986, 7, 11, e.g.), and prevent further stellar mass assembly and gas accretion. It’s interesting to note that the main sequence lifetimes of the high mass stars () that result in supernovae are relatively short - of order yrs - which, at , is an appreciable fraction - approximately 10% - of a dark matter halo’s dynamical time. This means that a common assumption of galaxy formation models - that the time between star formation and supernova feedback is short and be treated as instantaneous - should break down in the high redshift Universe. Instead, feedback is delayed, leading to episodic or bursty star formation (Scalo1986, 40, 14, 35, 17, 36, 41, 46, e.g.).
FaucherGiguere2018 (14) modelled such bursty star formation and showed that it can arise when the effective equilibrium between the self-gravity of gas in a galaxy and stellar feedback following star formation cannot be maintained. This should be commonplace in galaxies at high redshifts and in lower mass galaxies across cosmic time. Indeed, there is observational evidence for bursty star formation in galaxies at high redshifts (Faisst2019, 13, 28, 44, e.g.). Faisst2019 (13) concluded from a statistical sample of 4.5 galaxies that the significant scatter in UV and H luminosities and star formation rates implied episodes of bursty star formation during the prior Myr. Drawing on JWST/NIRSpec data, Strait2023 (44) found star formation is in the process of being shut down in a galaxy, while Looser2023 (28) found star formation has been quenched in a galaxy; both are consistent with galaxy formation model predictions that incorporate bursty star formation Dome2023 (9). Similarly, there is observational evidence for bursty star formation in dwarf galaxies (Weisz2012, 48, 12, e.g.), based on the distributions of UV and Hα that probe their star formation histories. Such bursty star formation arises naturally in hydrodynamical galaxy formation simulations that can track resolved star formation and feedback (Hopkins2023, 20, e.g.), especially in lower mass galaxies (Onorbe2015, 34, 30, 42, e.g.) and during the epoch probed by JWST (Pallottini2023A&A, 36, 41, 46, e.g.).
Using a lightweight semi-analytical model that we have written, we examine how the combination of UV suppression of gas accretion from cosmological scales and bursty star formation driven by delayed feedback influence the baryon content of dark matter halos at high redshifts. We model the assembly histories of these halos using Monte Carlo merger trees that have been calibrated against cosmological -body simulations (Parkinson2008, 37, cf.) and therefore capture plausible variations in their growth over cosmic time. We assume that cosmological gas accretion tracks halo growth, modulated by the presence of the UV background, following the approach of Kravtsov2022 (23). We parameterise star formation and feedback efficiencies, allowing for delayed feedback following the approach of Furlanetto2022 (17). In this way, we can assess how local factors (star formation efficiency, onset and strength of stellar feedback, variation in dark matter halo assembly history) and global factors (onset of a UV ionizing background and the suppression of cosmological gas accretion) influence the baryon content of halos at .
In the following sections, we describe the main features of our model (§ 2); we present our results for the baryon content of halos as a function of cosmic time and halo mass (§ 3.1), showing how they are sensitive to the assumptions of our model (instantaneous versus delayed feedback, absence or presence of UV background), model parameters (e.g. star formation efficiency, delayed feedback time interval), and variations in dark matter halo assembly history; and we summarise our key findings and their implications for our understanding of galaxy formation and evolution in the low-mass halo regime (§ 4). We use the cosmological parameter values , , , , , and , which are consistent with the results obtained by the Planck2018 (38).
2 Theoretical Model
We have written a lightweight semi-analytical model111This python code can be made available by contacting the corresponding author. for studying the growth of gas and stellar mass in dark matter halos, which is motivated by the philosophy of equilibrium models set out in Dave2012 (6). We track the mass assembly of dark matter halos and the corresponding cosmological accretion of gas from the IGM; the accumulation of a cold gas reservoir at the centre of the halo; star formation; and the expulsion of gas via stellar feedback (supernovae-driven winds). In particular, we follow Furlanetto2022 (17) and introduce a delay between when stars form and when they produce feedback, and we adopt a time-dependent suppression of cosmological gas accretion that reflects the growth of a UV ionizing background, following Kravtsov2022 (23).
Note that we do not account for the growth of the seeds of super-massive black holes and the feedback they produce. We expect this to be important in more massive galaxies - star formation will be preferred at the expense of black hole growth in lower mass galaxies because black hole growth is limited to occur on a Salpeter timescale (Nayakshin2009MNRAS, 32, 3, see, e.g.). This difference in timescales on which stellar and black hole driven feedback acts (Power2011, 39, e.g.) should give rise to more complex bursty star formation histories in more massive galaxies; we will investigate this in a future paper.
2.1 Evolutionary Equations
We track the time rate of change of gas (), star formation (), and supernova-driven wind mass loss () at time via a set of coupled differential equations:
| (1) | ||||
| (2) | ||||
| (3) |
It is straightforward to convert between and redshift for our adopted cosmology, which is important for evaluating the contribution of the UV background. The various parameters are now described in the following subsections.
2.1.1 Growth of the Gas Reservoir
Equation 1 tracks the gas reservoir in a galaxy, accounting for the accretion rate of gas from cosmological scales (), gas that is converted to stars via , and gas that is lost via winds (). As is commonly assumed (White1991, 49, e.g.), tracks the accretion rate of the dark matter halo that hosts the galaxy, ;
| (4) |
Here the quantities and refer to the total baryon and matter densities of the Universe, respectively, and the assumption is that the halo accretes a baryon mass equivalent to the cosmic fraction () per unit dark matter accreted. We also use a pre-factor , such that corresponds to the accretion of the cosmic baryon fraction and corresponds to complete suppression of baryon accretion. We discuss this further in the context of UV suppression of cosmological accretion below.
2.1.2 Growth of Stellar Mass
Equation 2,
links the star formation rate to the mass of the gas reservoir, , a star formation timescale, , and an efficiency factor, . We assume that is proportional to the dynamical time,
| (5) |
where and are the characteristic radius and velocity dispersion of the system respectively. If we adopt the dynamical time of the halo as characterising this timescale, we expect that
| (6) |
where is the virial overdensity of the halo and
| (7) |
is the Hubble parameter at cosmic time, . We assume that
| (8) |
and expect that . We take as our fiducial value, following Furlanetto2022 (17) and motivated by Murray2011 (31) and Leroy2017 (27), but we allow this parameter to vary between (low efficiency) and (high efficiency) to gauge its influence on our results.
2.1.3 Supernovae-Driven Wind Mass Loss
Equation 3,
links the rate of mass loss driven by supernovae to at some time , where is the delayed feedback timescale. If , then this mass loss rate is driven by the instantaneous star formation rate; however, if , then it depends on star formation at some earlier time and corresponds to delayed feedback. We adopt =0.015 Gyr (15 Myr) as our fiducial value, but have explored values of Gyr.
We follow Furlanetto2017 (18) in defining our choice of feedback efficiency parameter; they model momentum-regulated supernova feedback and assume that supernovae accelerate the wind to the escape velocity of the halo. This gives,
| (9) |
where parameterises feedback efficiency and corresponds to the momentum injected by the supernovae driving the wind, and is the total amount of momentum from each supernova. We follow Furlanetto2022 (17) in adopting as our fiducial value, but we also consider values in the range . Following Furlanetto2017 (18), we assume g cm .
2.1.4 UV Suppression of Cosmological Gas Accretion
We follow the approach of Kravtsov2022 (23) by noting that the gas mass within a dark matter halo may be a function of both mass and redshift (Okamoto2008, 33, e.g.),
| (10) |
The quantity is related to in Equation 1, as we make clear below. Following Gnedin2000 (19, 33), we write,
| (11) |
where is the cosmic baryon fraction and is defined as,
| (12) |
, where is a characteristic mass below which . Following Kravtsov2022 (23), we adopt
| (13) |
where and is given by,
| (14) |
here is the redshift of reionization. We adopt as our fiducial value but have checked the sensitivity of our results to this choice.
If we consider the time rate of change of Equations 10 and 11, we see that
which is equivalent to Equation 4, and so we can evaluate , given the form of Equation 12.222We note that Kravtsov2022 (23) explored the general case in which gas accretion is suppressed by the presence of a UV background (), the presence of a hot halo (), and preventive feedback (), such that . We argue that suppression by hot halos and by preventive feedback can be neglected at high redshifts (i.e. , and so we consider . We write,
| (15) |
where
This has the effect of suppressing gas accretion at halo masses below the threshold mass at , with increasing with decreasing (i.e. accretion is suppressed onto progressively higher mass halos). For redshifts , there is no suppression of gas accretion. We refer the interested reader to Figure 1 of Kravtsov2022 (23) for an illustration of this behaviour.
2.2 Modelling Dark Matter Halo Growth
We have used the algorithm of Parkinson2008 (37) to generate Monte Carlo dark matter halo merger trees based on Extended Press-Schechter theory (Bond1991, 2, 25, e.g.). This has been calibrated to provide predicted halo masses as a function of cosmic time that are consistent with merger trees derived from the Millennium Simulation (Springel2005, 43, cf.). For each of the 11 halo mass bins equally spaced (linearly) in the interval , we sample 100 realisations following mass assembly histories in the redshift range equally spaced in the logarithm of the expansion factor, . This provides us with as a function of ; we calculate as a function of by constructing a smooth spline interpolant, which we differentiate numerically.
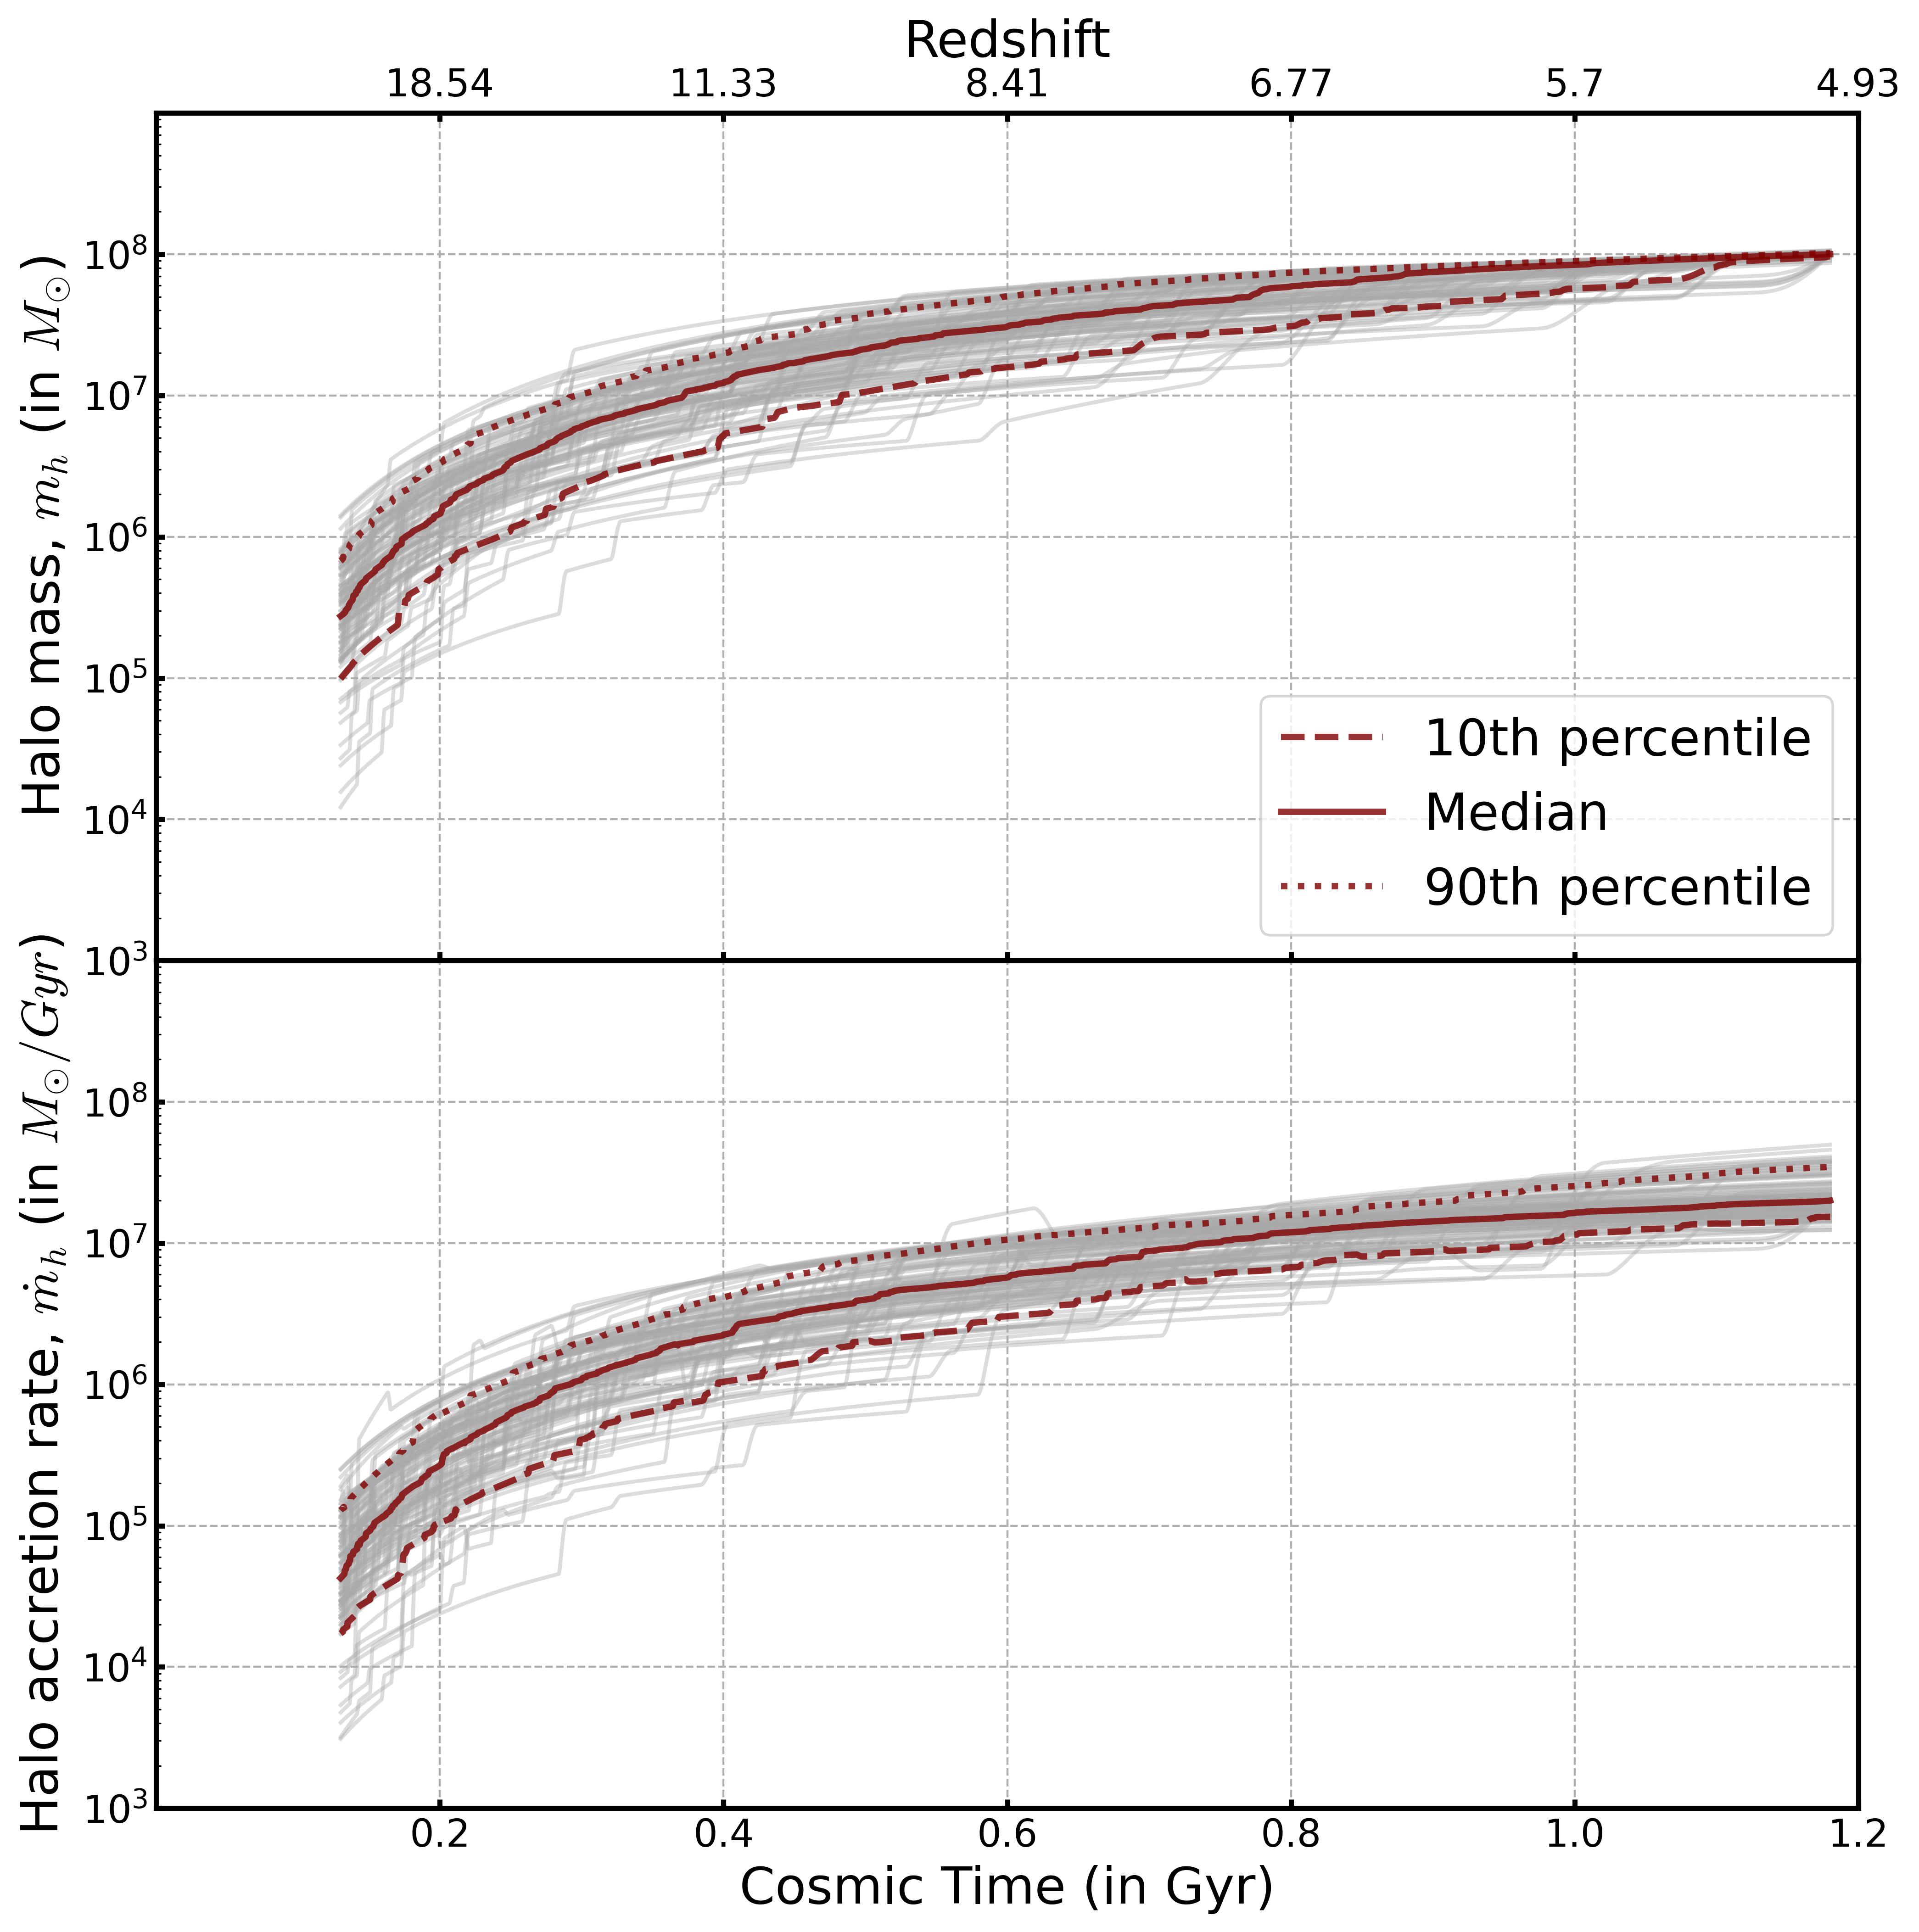
In Figure 1, we show the mass assembly histories of a sample of dark matter halos that have masses of at . Each individual halo is represented by a light grey curve; the median, 10, and 90 percentiles are indicated by the red solid and dotted curves. The upper panel shows the variation of with cosmic time (lower horizontal axis) and redshift (upper horizontal axis), starting at =25, while the lower panel shows the corresponding values of . This shows that our Monte Carlo merger trees produce a diversity of assembly histories and that halos that have the same value of at =5 can differ by up to an order of magnitude in and at earlier times. This allows us to explore how such variation in and the corresponding influence on and affect the halos’ baryon mass content.
3 Results
3.1 Bursty star formation & UV suppression of accretion
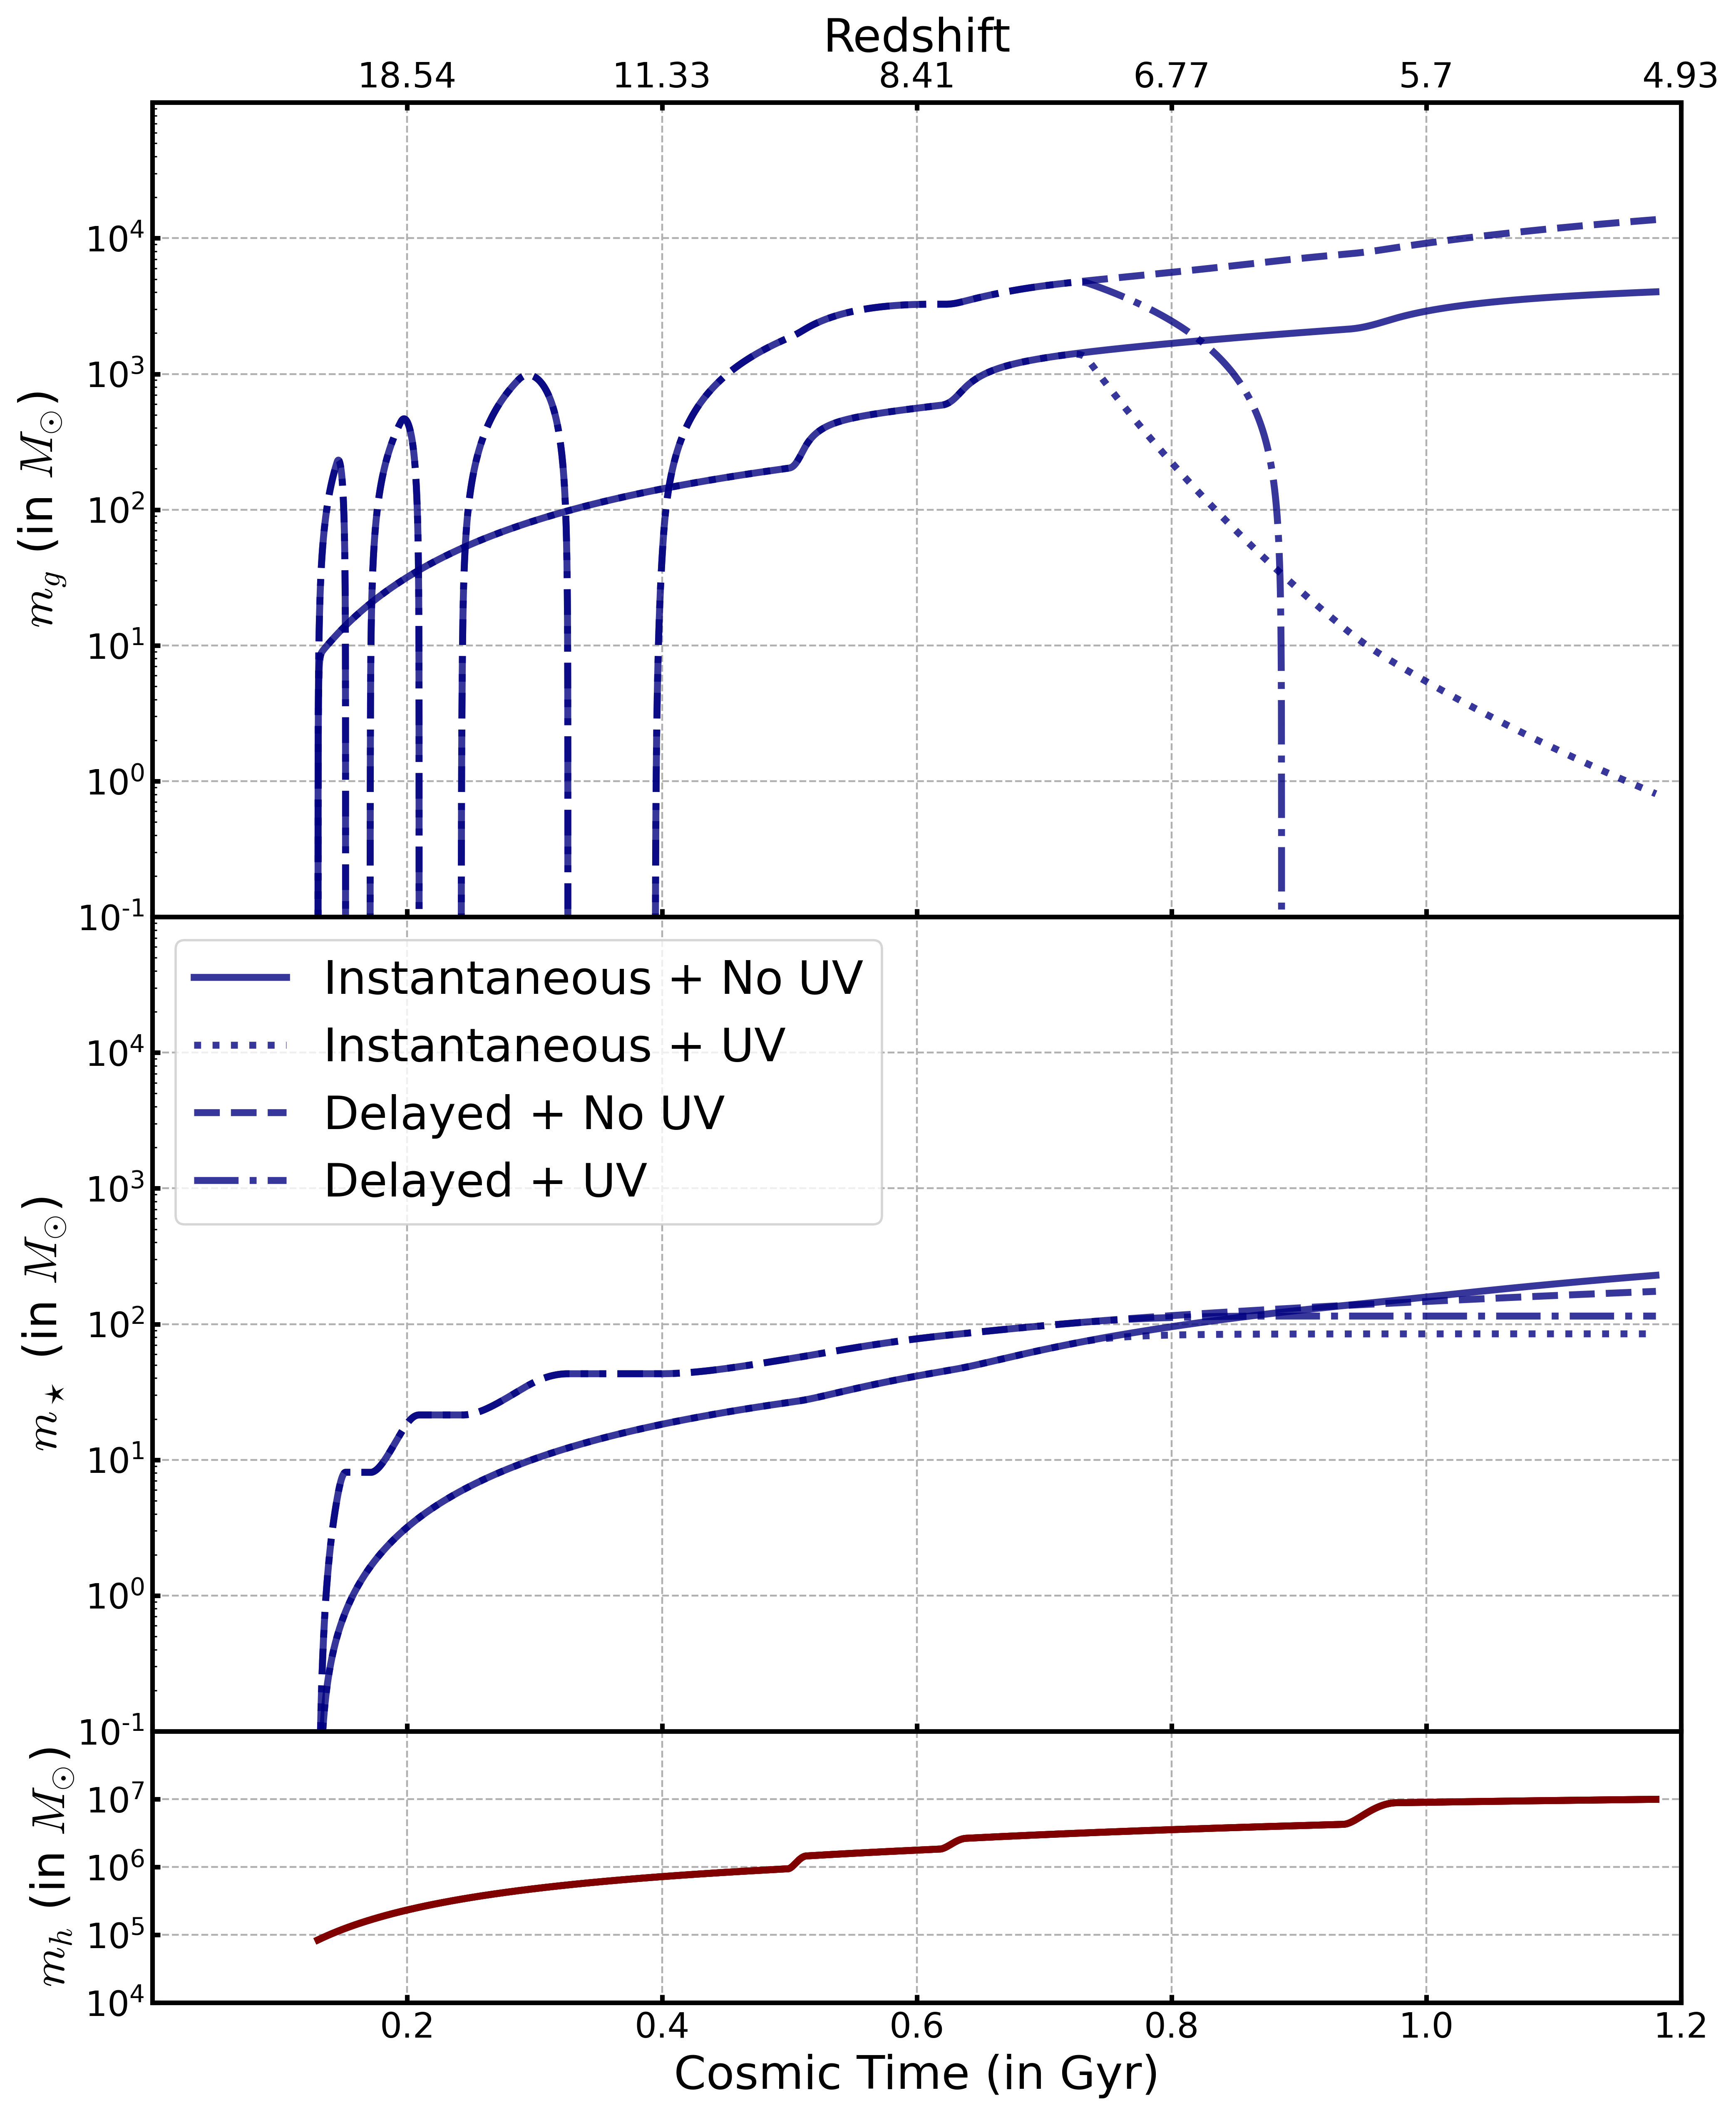
We begin by considering the growth of gas mass (upper panel), stellar mass (middle panel), and halo mass (lower panel; for comparison) in Figure 2, focusing on an example halo with at , drawn from the sample of 100 halos in this mass bin. We choose this halo mass bin because it marks the transition between low-mass halos that can be efficiently quenched via delayed feedback alone and high-mass halos that continue to accrete and form stars after the onset of UV suppression; we show examples of low- and high-mass systems’ assembly histories in A. To illustrate the effects of bursty star formation and UV suppression on the growth of gas and stellar mass as a function of cosmic time, we consider the cases of instantaneous star formation and feedback and no UV suppression of accretion (hereafter instantaneous + No UV; solid curves); instantaneous star formation feedback and UV suppression of gas accretion with (hereafter instantaneous + UV; dotted curves); bursty star formation from delayed feedback and no UV suppression of accretion (hereafter delayed + No UV; dashed curves); and bursty star formation and feedback and UV suppression of accretion with (hereafter delayed + UV; dot-dashed curves). We adopt our fiducial parameters of and .
In the instantaneous + No UV case, we find that both and show an initial steep rise at early times ( Gyr), and continue to grow but at a slower at later times (up to 2 Gyr). There are noticeable increases in at approximately 0.5 and 0.6 Gyr; these correlate with increases in evident in the lower panel, which translate into increases in given our assumption that tracks . In contrast, for instantaneous + UV, we find that and show a similar initial steep rise at early times but the effect of the UV background shutting off cosmological accretion is evident - peaks after 0.75 Gyr and then declines with increasing time, while plateaus. Because is linked to and the magnitude of UV suppression is both halo mass and redshift dependent, we see that shows an initial sharp decline but plateaus after 1.5 Gyr. For the delayed + No UV case, we see the characteristic strong oscillations in - and to a lesser extent in - evident during the initial 0.5 Gyr, but as the halo grows, these oscillations damp away, and both quantities are indistinguishable from the case with instantaneous star formation and feedback. Similarly, for the delayed + UV case, we see these oscillations in and repeated.
3.2 Halo mass assembly history
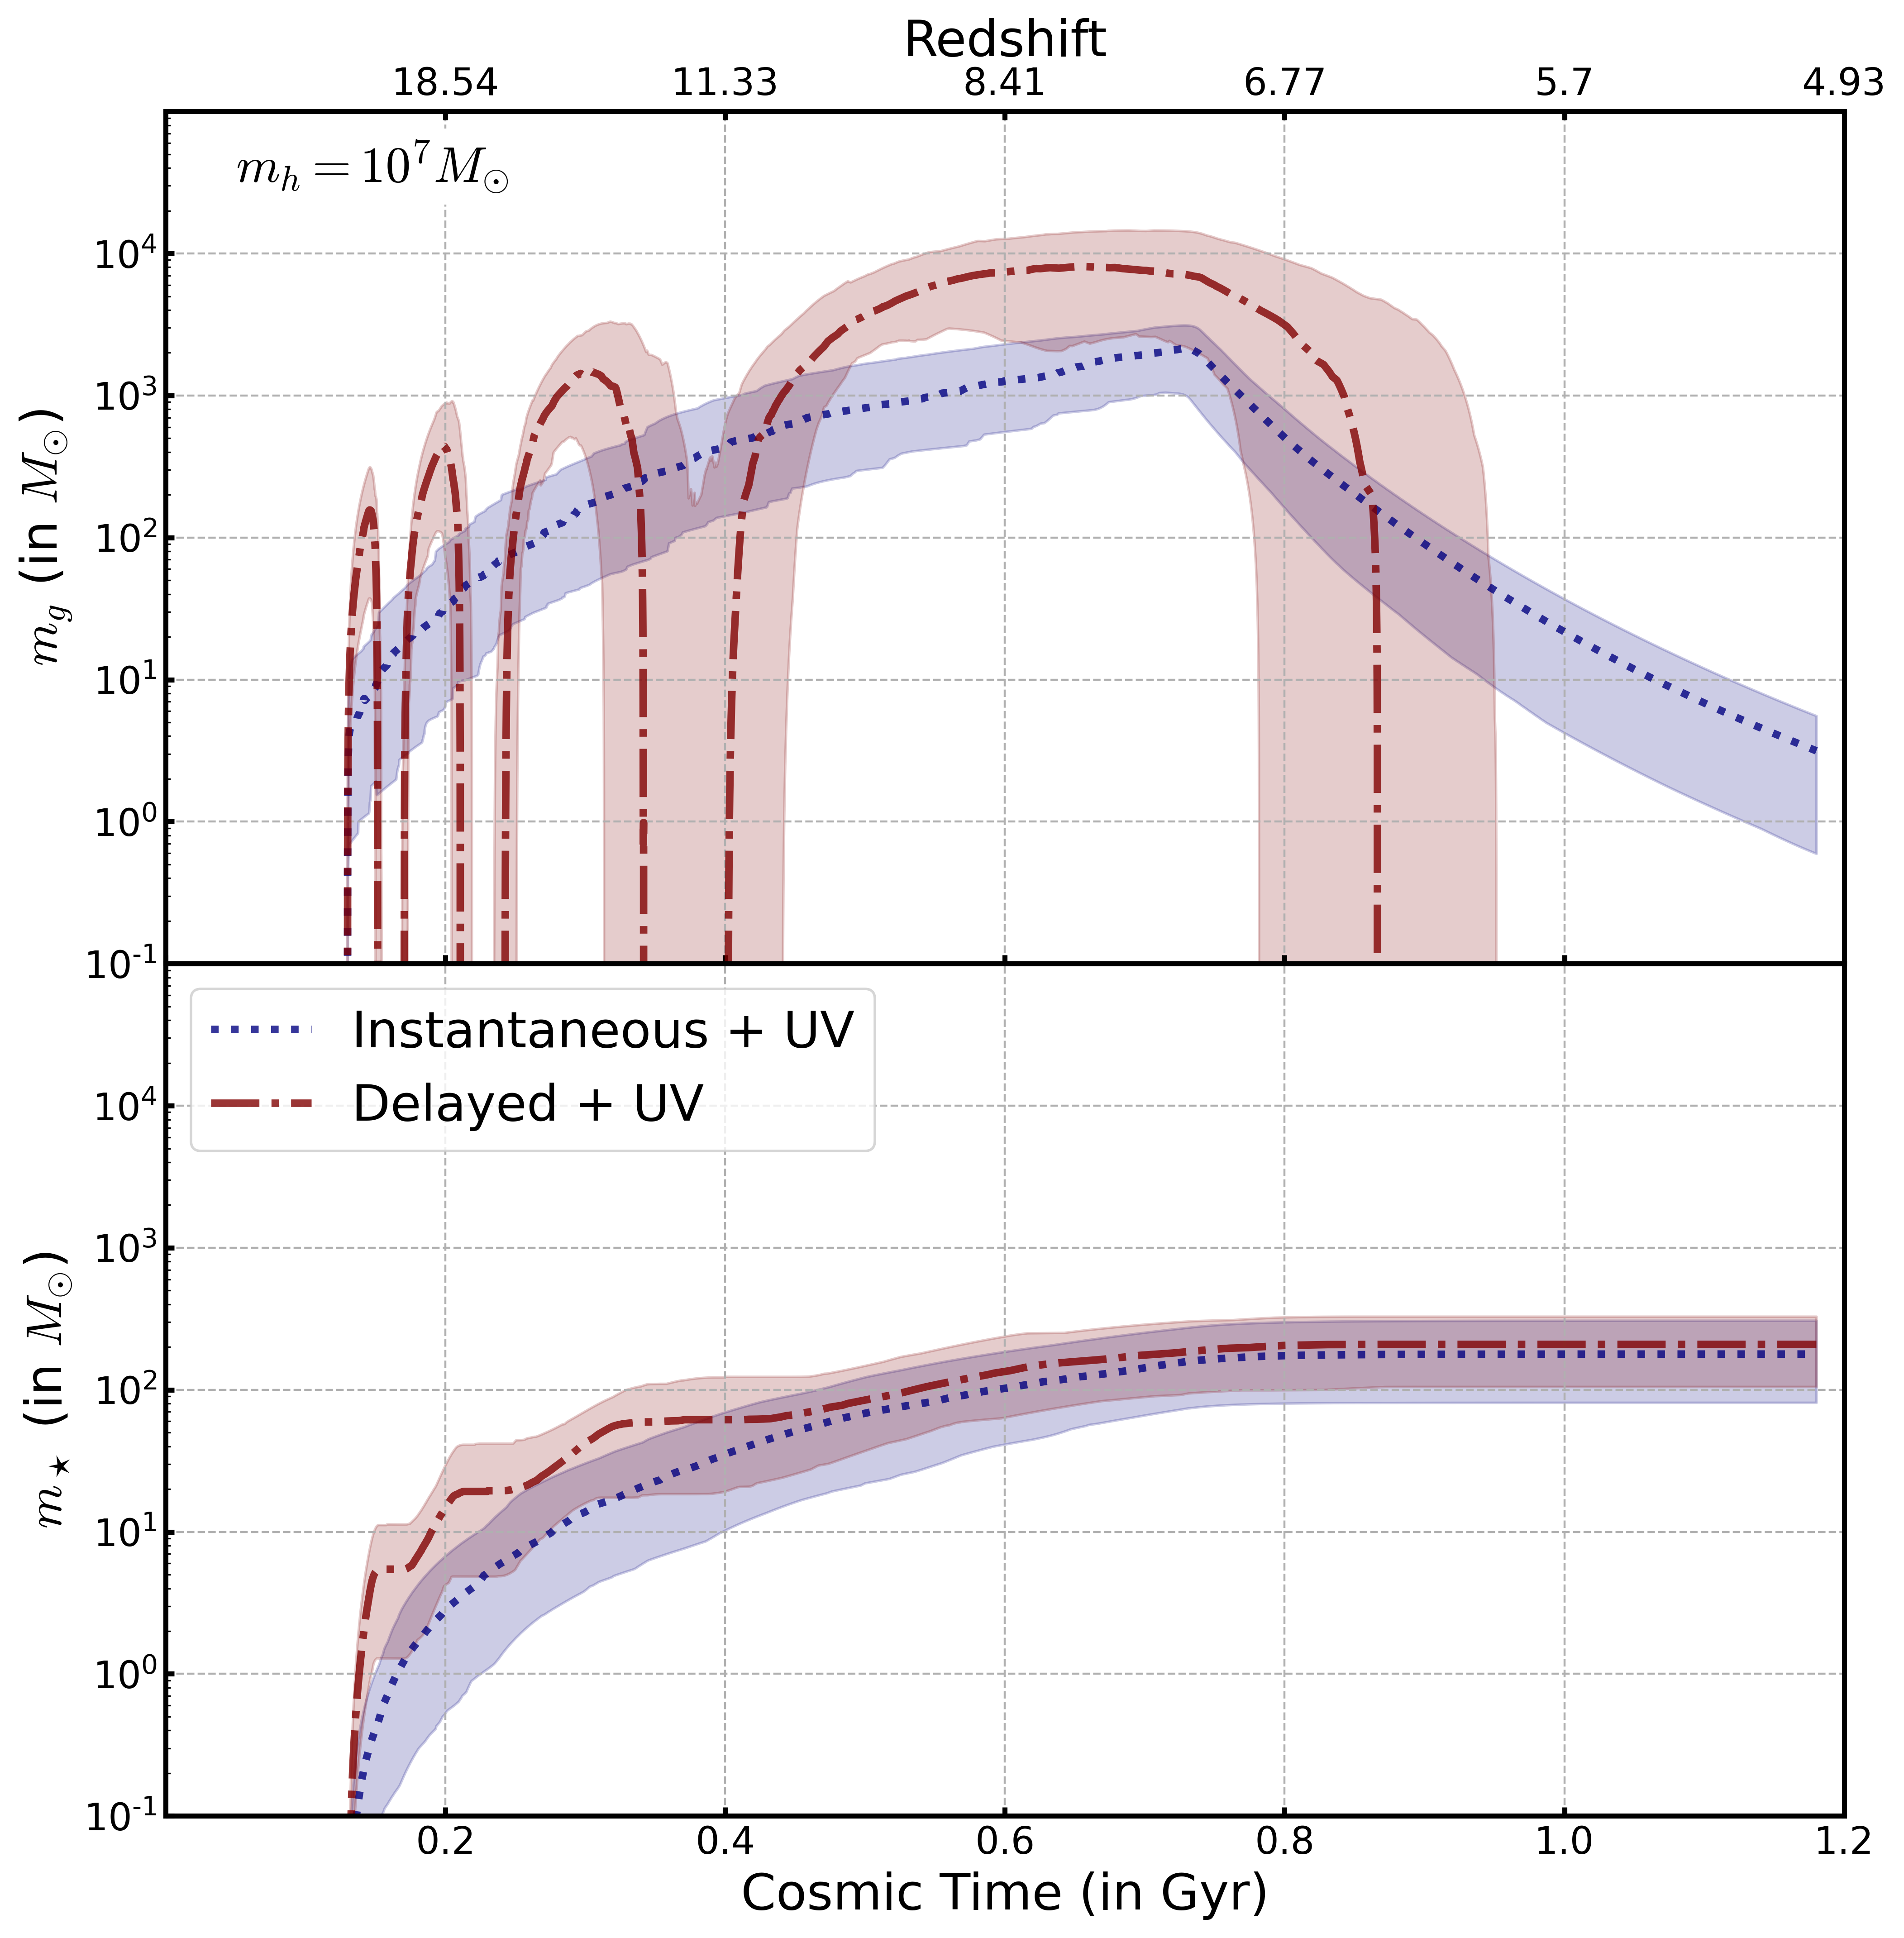
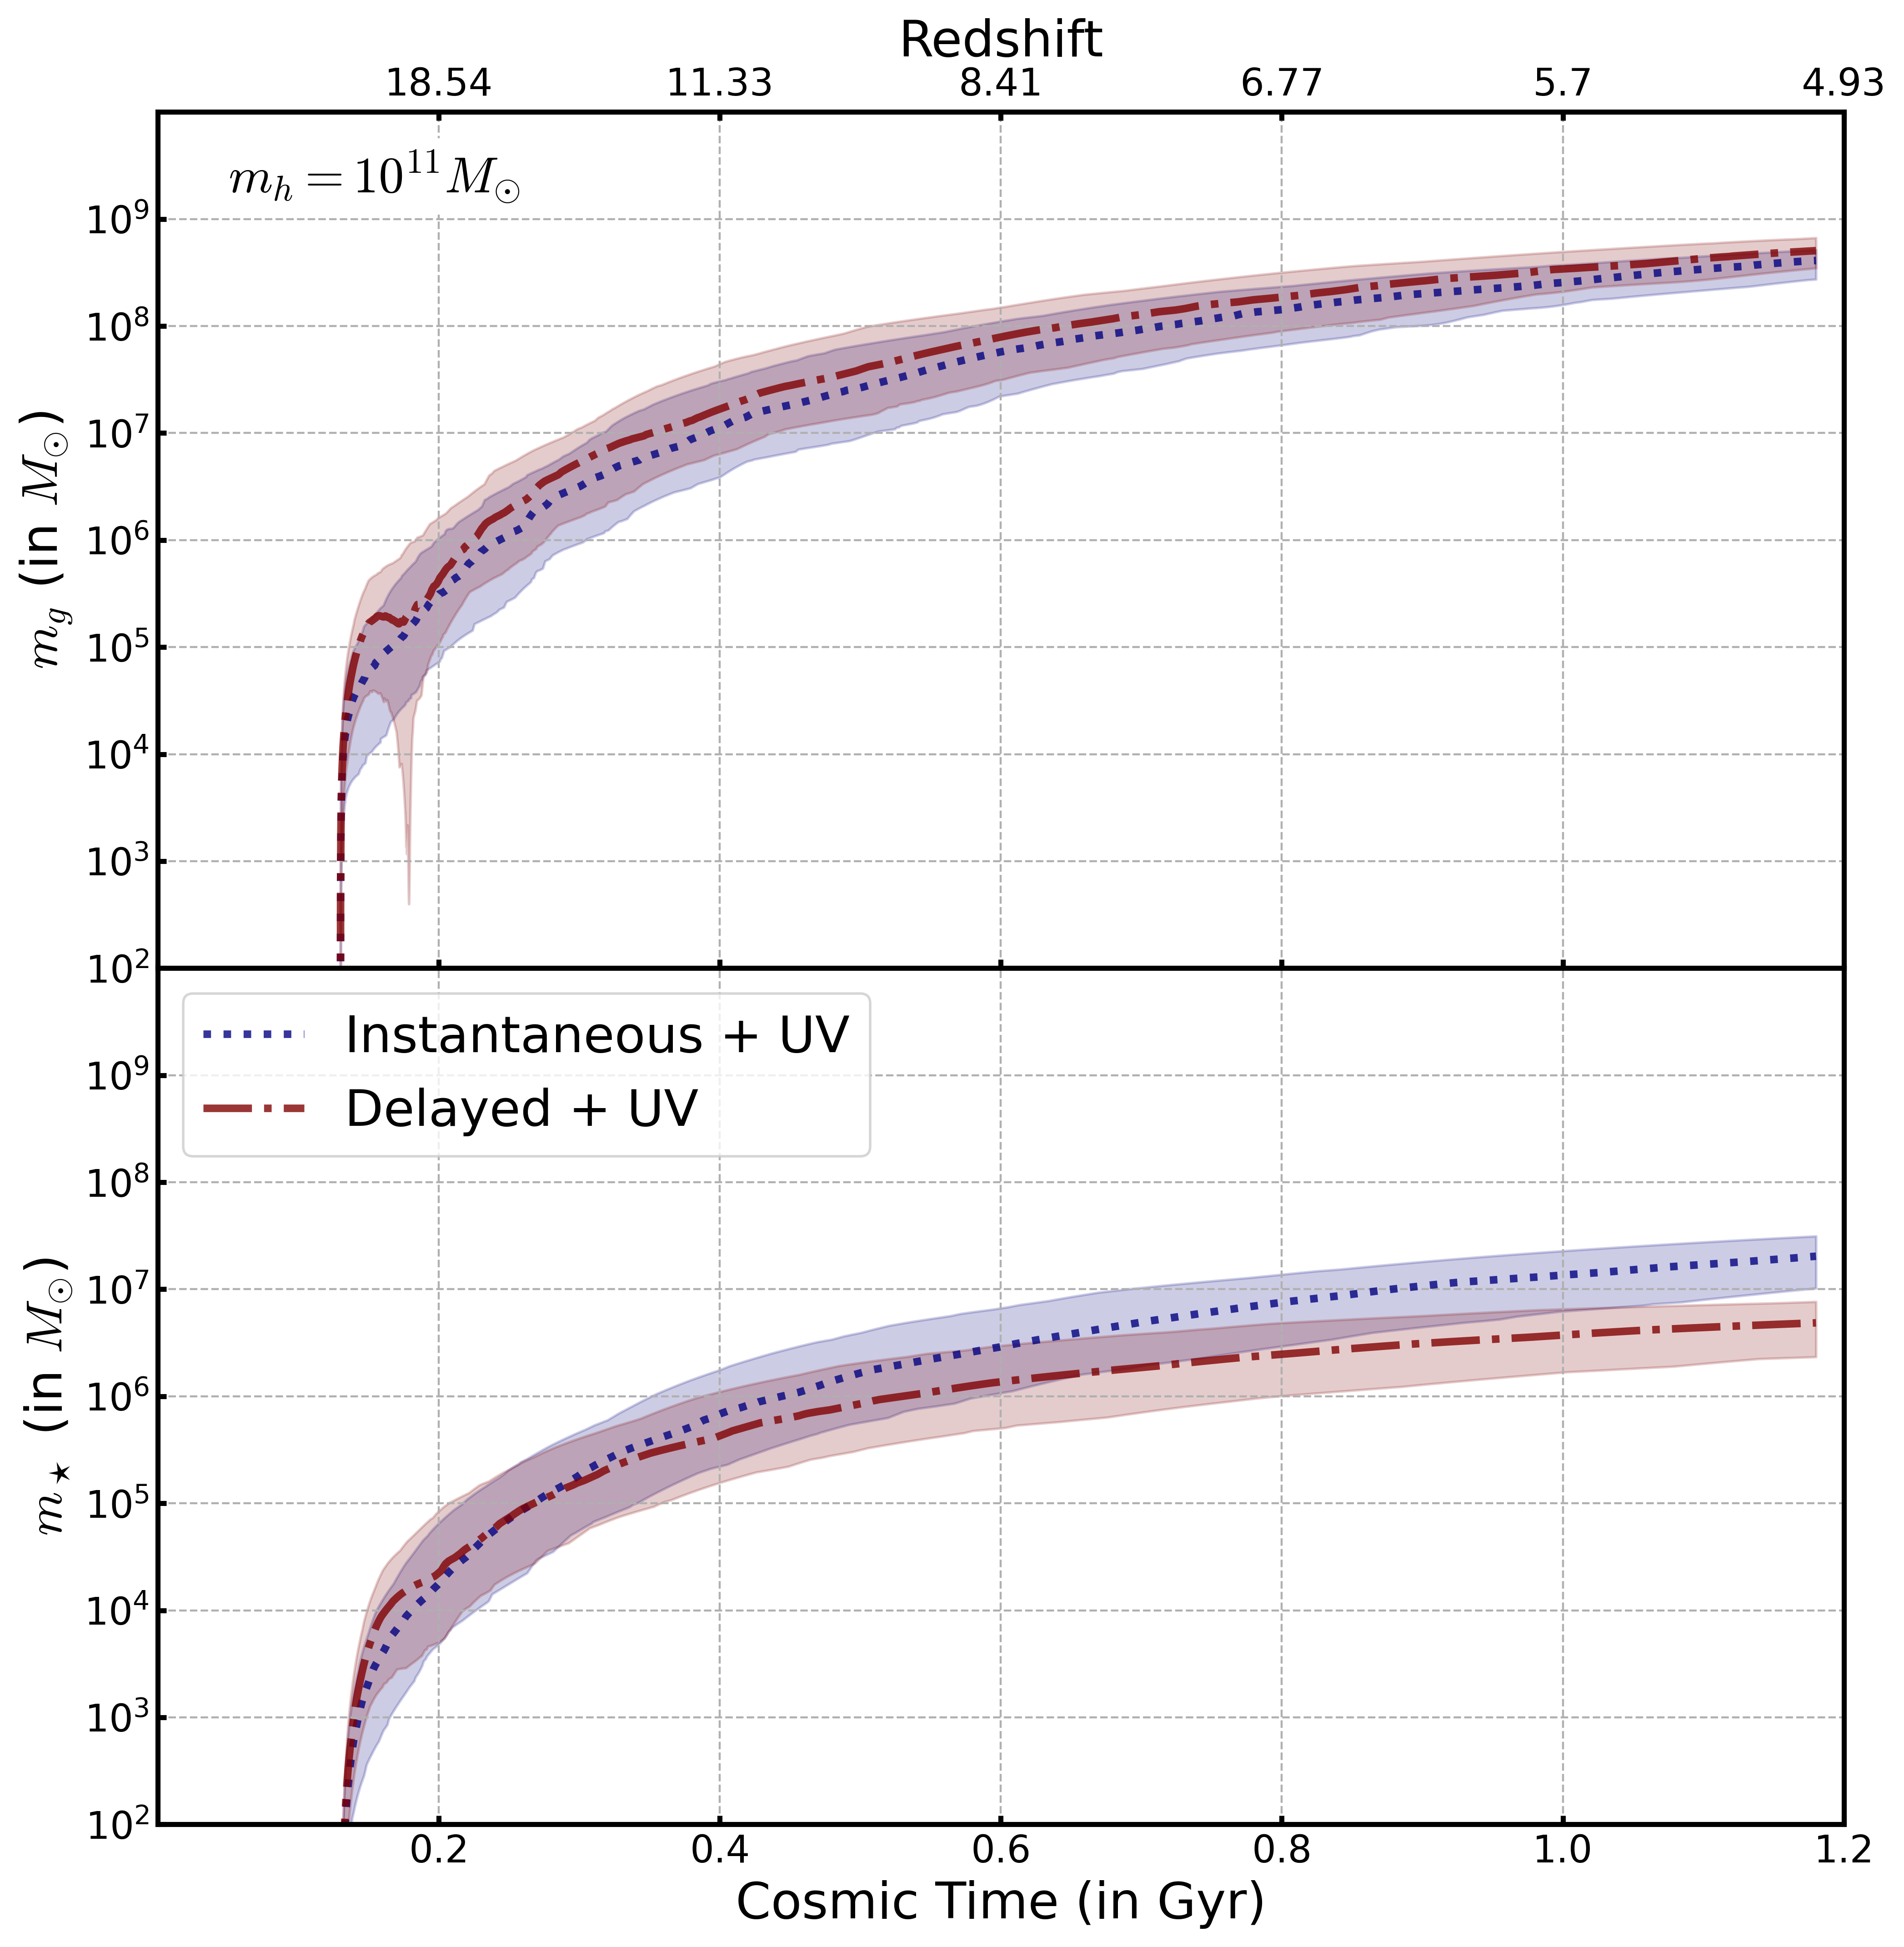
In Figure 3, we show the variation in and with cosmic time for a sample of 100 halos, each with at . We now focus on models with the UV suppression of accretion of gas from the IGM. The dotted (dot-dashed) curves correspond to the median values of (upper panel) and (lower) for the instantaneous + UV (delayed +UV) case, while the coloured bands indicate the range of the 10 and 90 percentiles. This shows how variations in the assembly history of the underlying dark matter halo, whose growth rate governs the growth rate of the gas mass and consequently the stellar mass. The variations introduced by the diversity of halo assembly histories correspond to approximately dex in both and . The variations in are larger for the delayed + UV case, as we might expect, while we we see that the variations in are similar in magnitude for both the instantaneous + UV and delayed + UV cases ( dex at early times, dex at later times).
3.3 Efficiency of star formation, , and feedback,
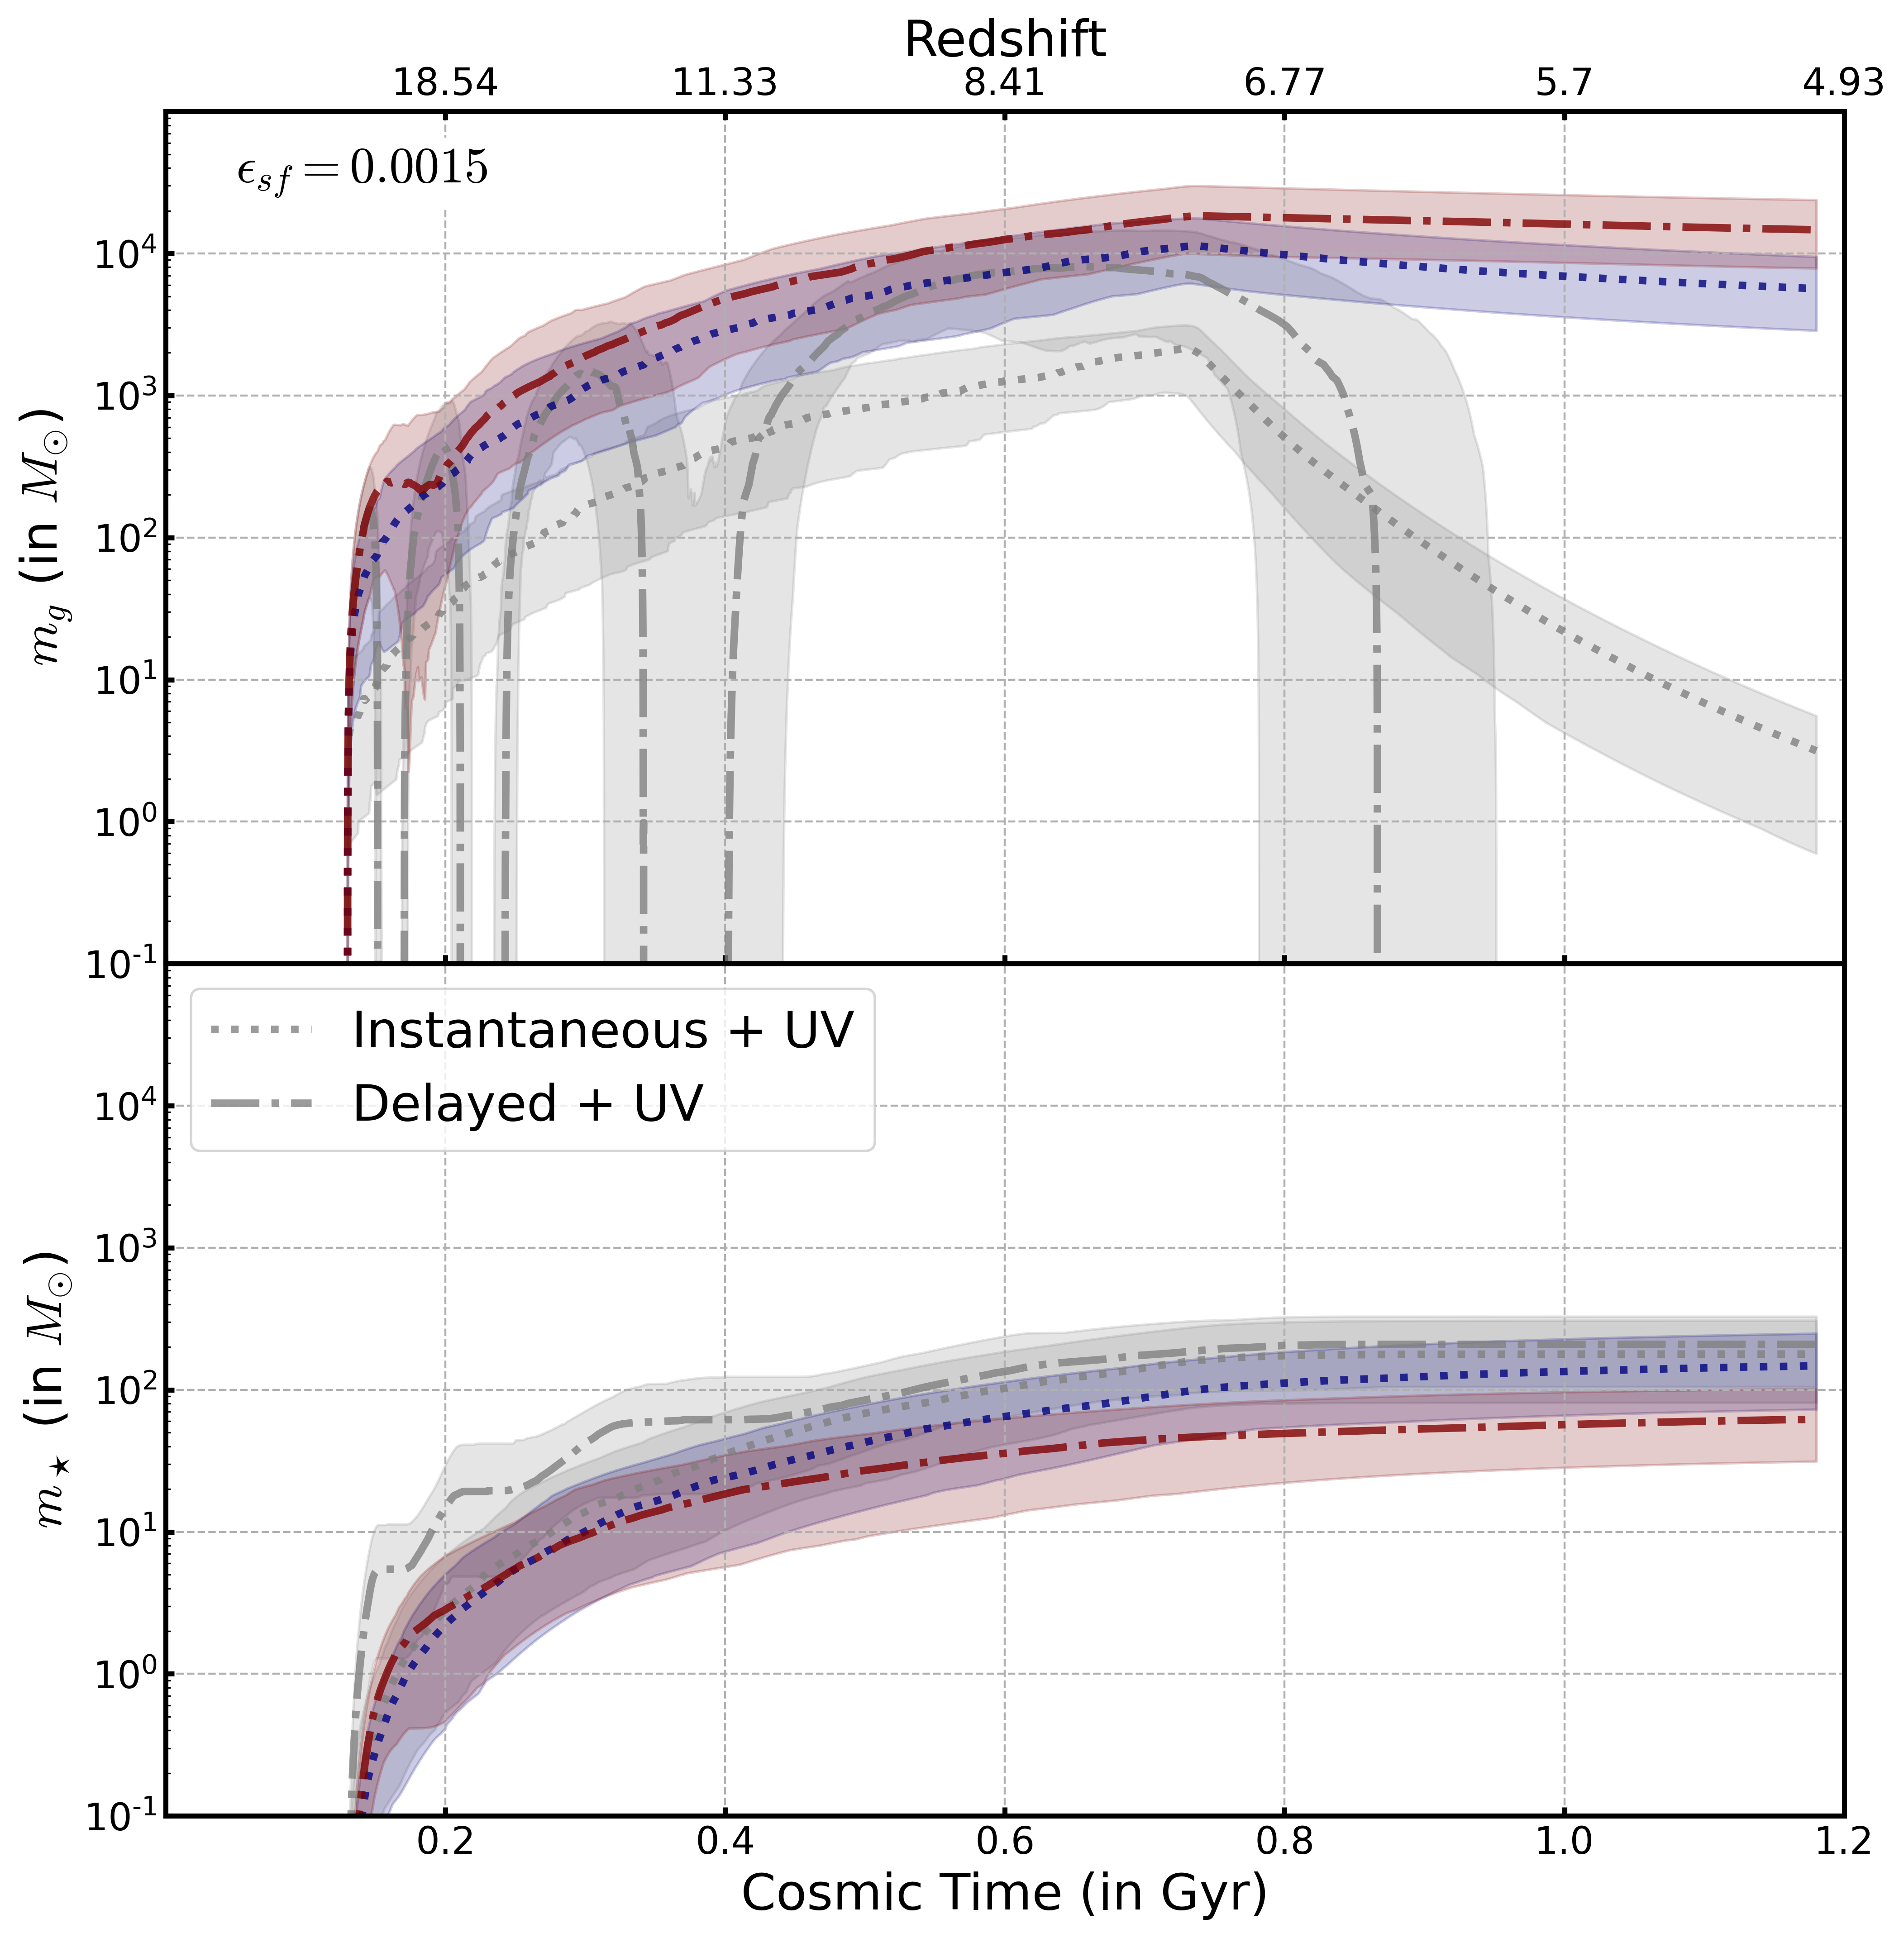
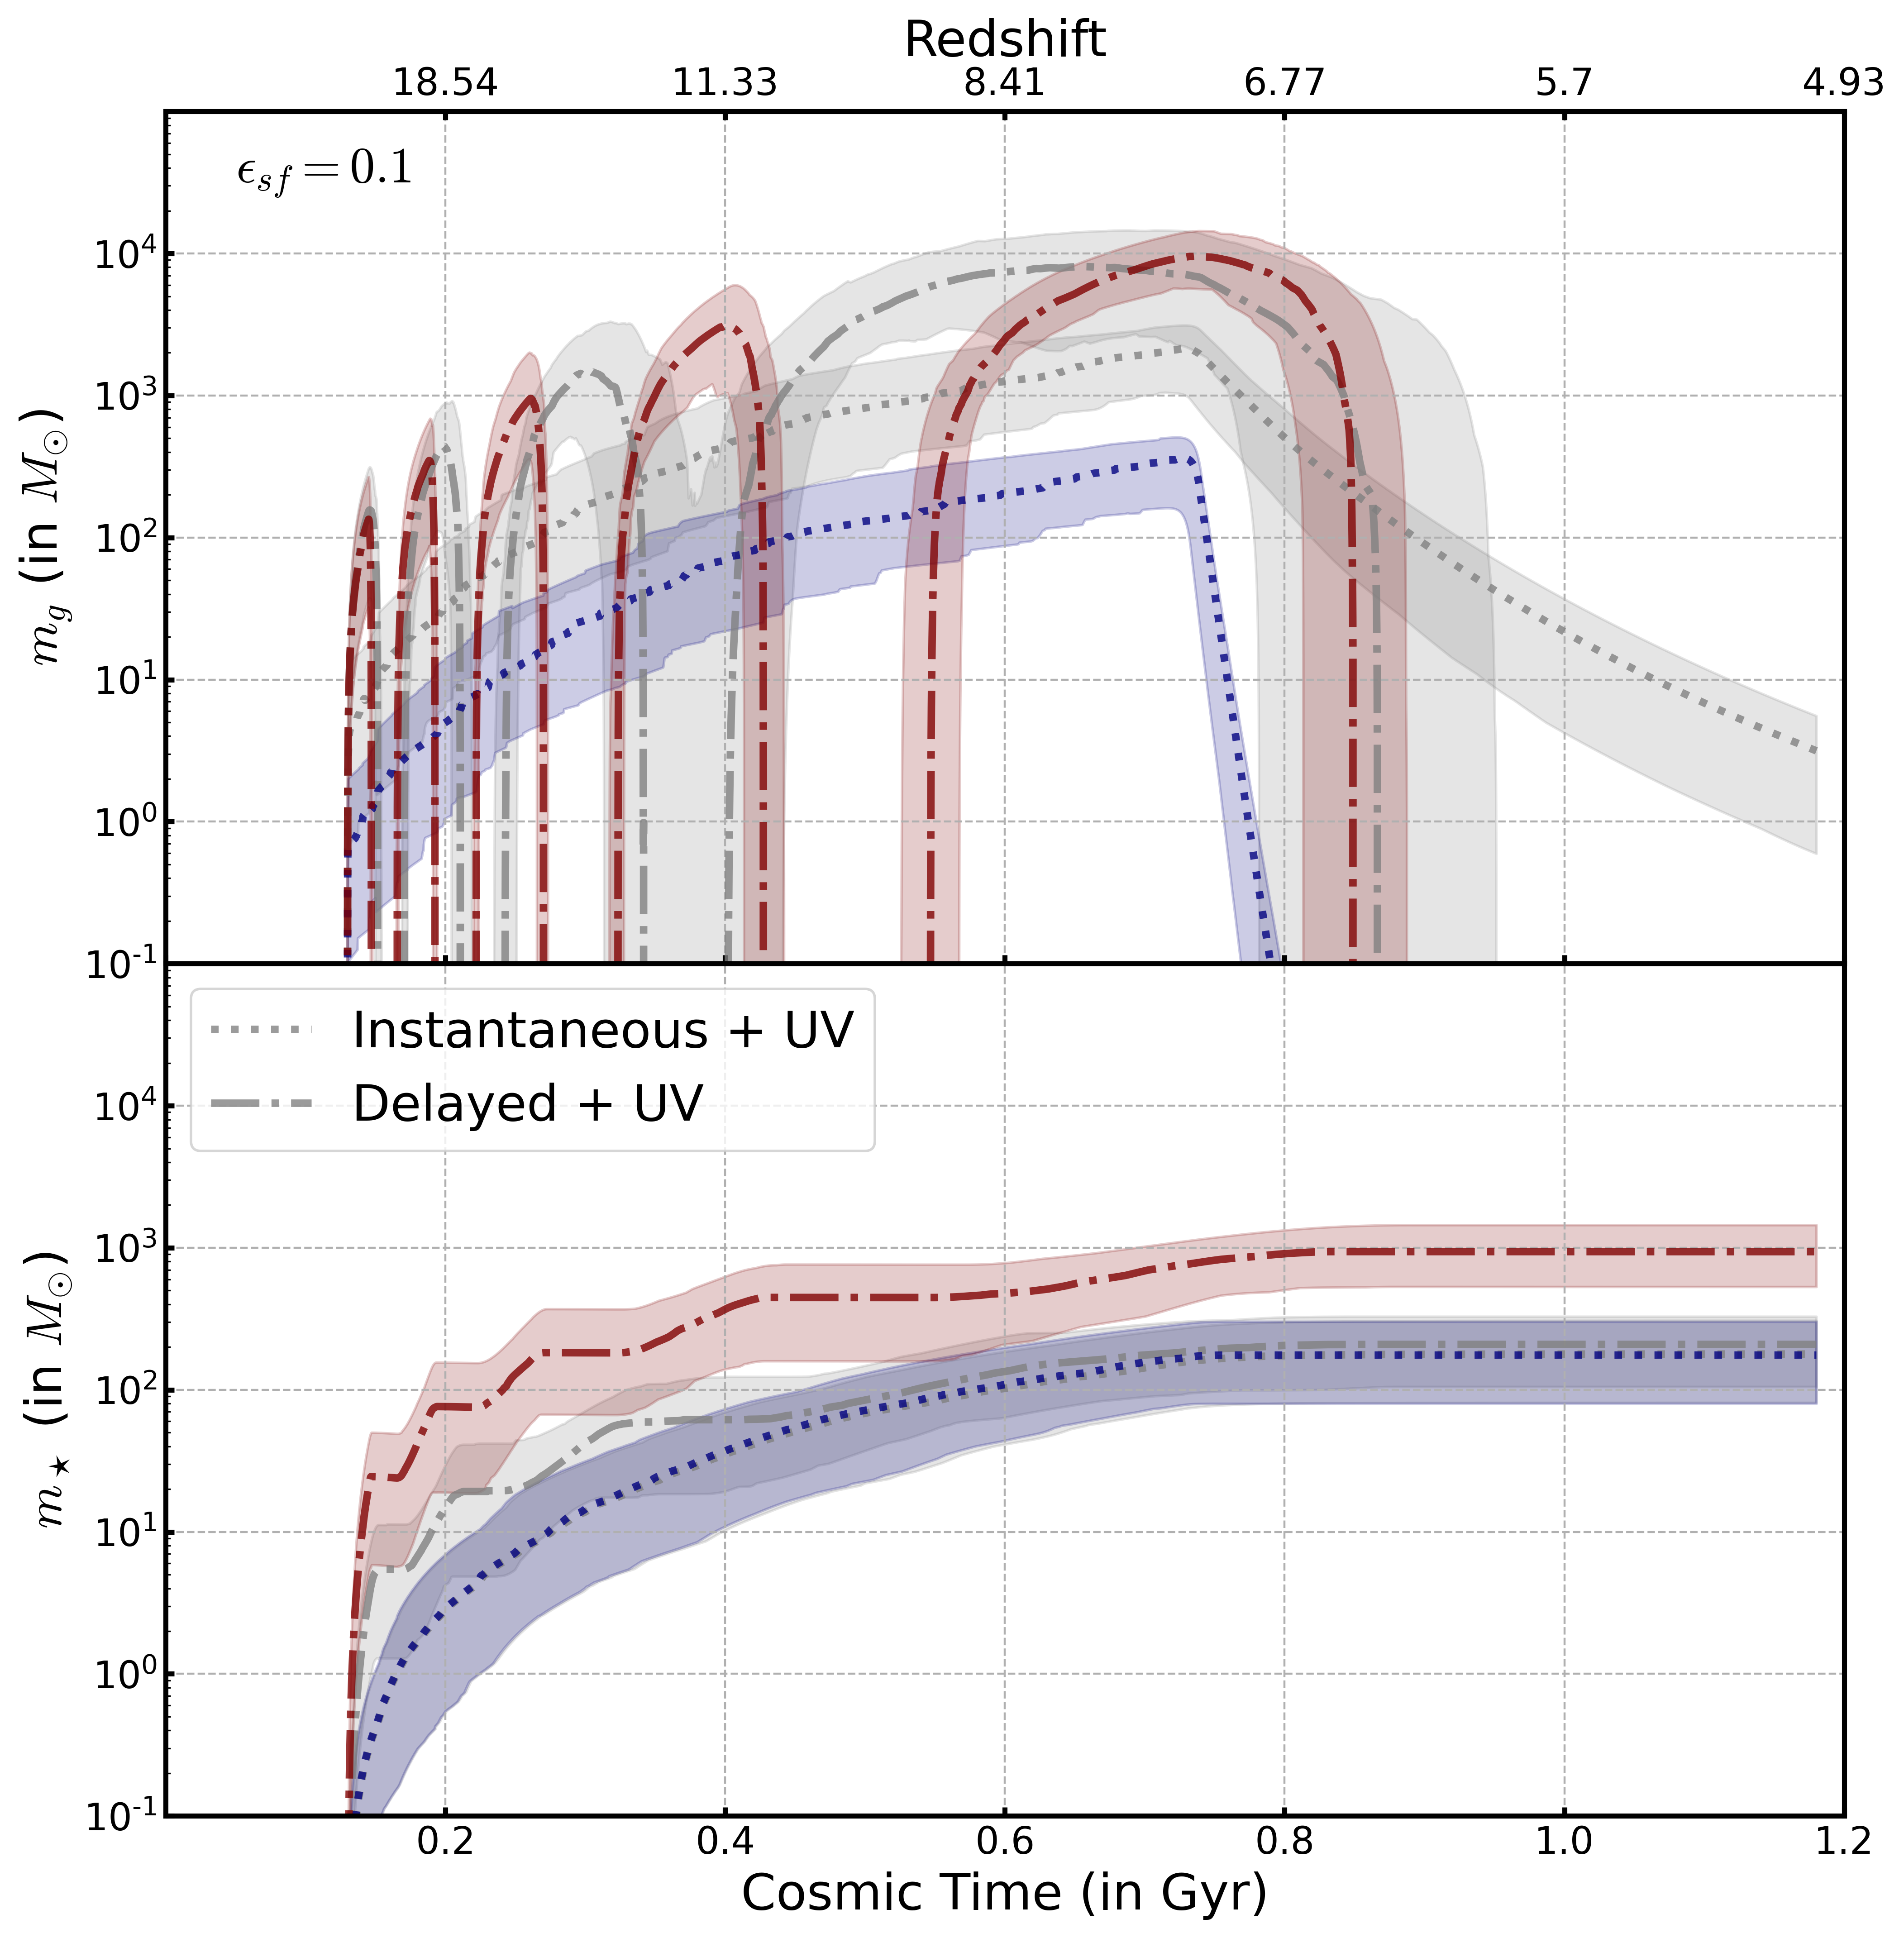
We now examine how our choices of star formation and feedback efficiency affect the growth of gas mass (upper panel) and stellar mass (lower panel) in Figures 4 and 5. As in Figure 3, we focus on a sample of 100 halos with at , but for cases of low and high star formation and feedback efficiencies, and , respectively. We keep fixed and look at the cases of low (high) efficiency in the upper (lower) panels, with reference curves corresponding to our fiducial values plotted in light grey (=0.015 and =5).
As before, we focus on the cases of instantaneous + UV (dotted curves) and delayed + UV (dot-dashed curves). By reducing (increasing) the star formation efficiency, we expect a reduction in the number of stars to form over a fixed interval to be lower (higher) than in the fiducial case; however, the coupling of star formation to feedback means that a higher star formation efficiency should boost the strength of the feedback, which, in the case of delayed feedback, should lead to stronger oscillations in the and (Furlanetto2022, 17, see, e.g.,). We anticipate that stronger (weaker) feedback efficiency should impact and consequently , but it’s likely the that the difference with respect to the fiducial run will be more pronounced for weaker feedback - it may evacuate the halo of gas more quickly, but the accretion rate onto the halo is unchanged.
In Figure 4, we fix feedback efficiency at =5 and look at star formation efficiencies of =0.0015 (low efficiency, upper panel) and =0.1 (high efficiency, lower panel). As expected, in the case of higher star formation efficiency, we see evidence for enhanced star formation efficiency driving enhanced feedback. Consider the instantaneous + UV case. At a given time, we see that is smaller by approximately 0.5 dex compared to the fiducial run up to the point at which the effect of UV suppression kicks in, following which rapidly declines as its converted to stars; the evolution of is relatively unchanged from the fiducial case. In contrast, the delayed + UV case shows some interesting changes compared to the fiducial case; the initial evolution of is similar but from approximately 0.2 Gyr it experiences 3 longer periods in which , while we also note that the typical system forms more stars at a given time, and is dex higher after 1.2 Gyr. For the low star formation efficiency case, we see that the differences between the two models are dramatically reduced. In particular, the strong oscillations apparent in the fiducial delayed + UV case are very weak - only a dip in is evident at 0.2 Gyr - and the evolution in and are very similar, with the delayed + UV case having higher values of by dex and lower values of by dex, when compared to the instantaneous + UV case.
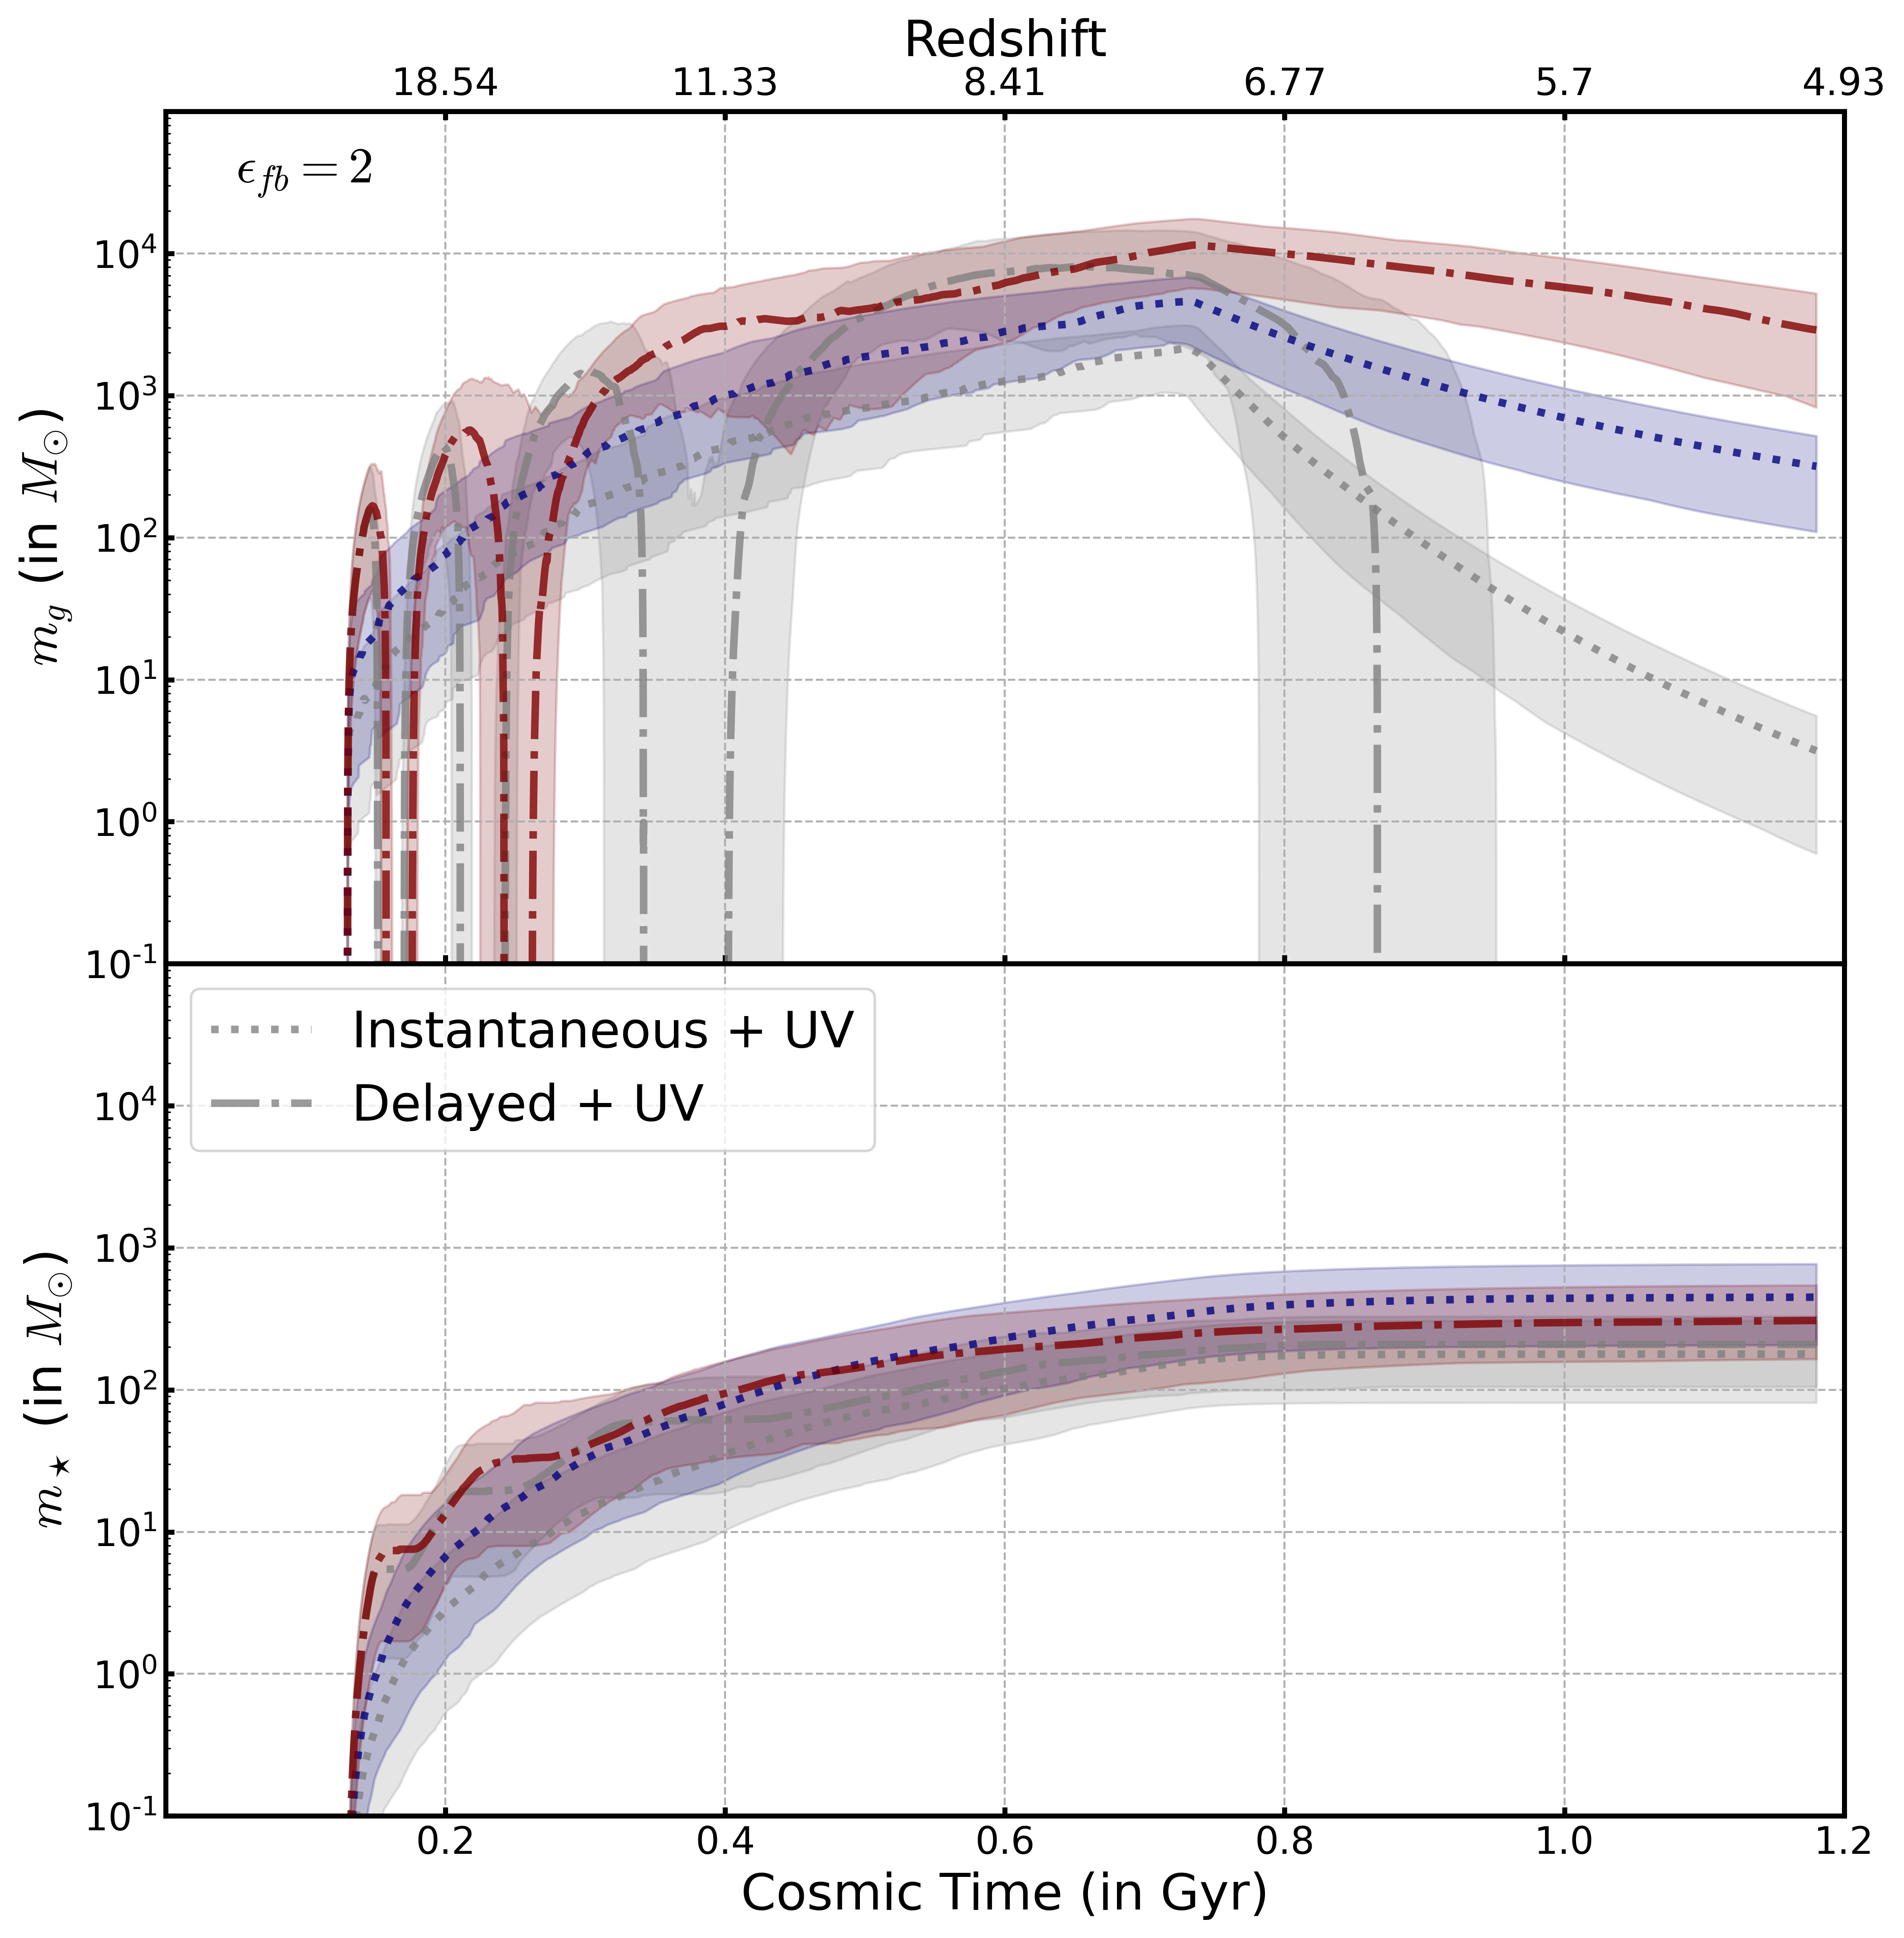
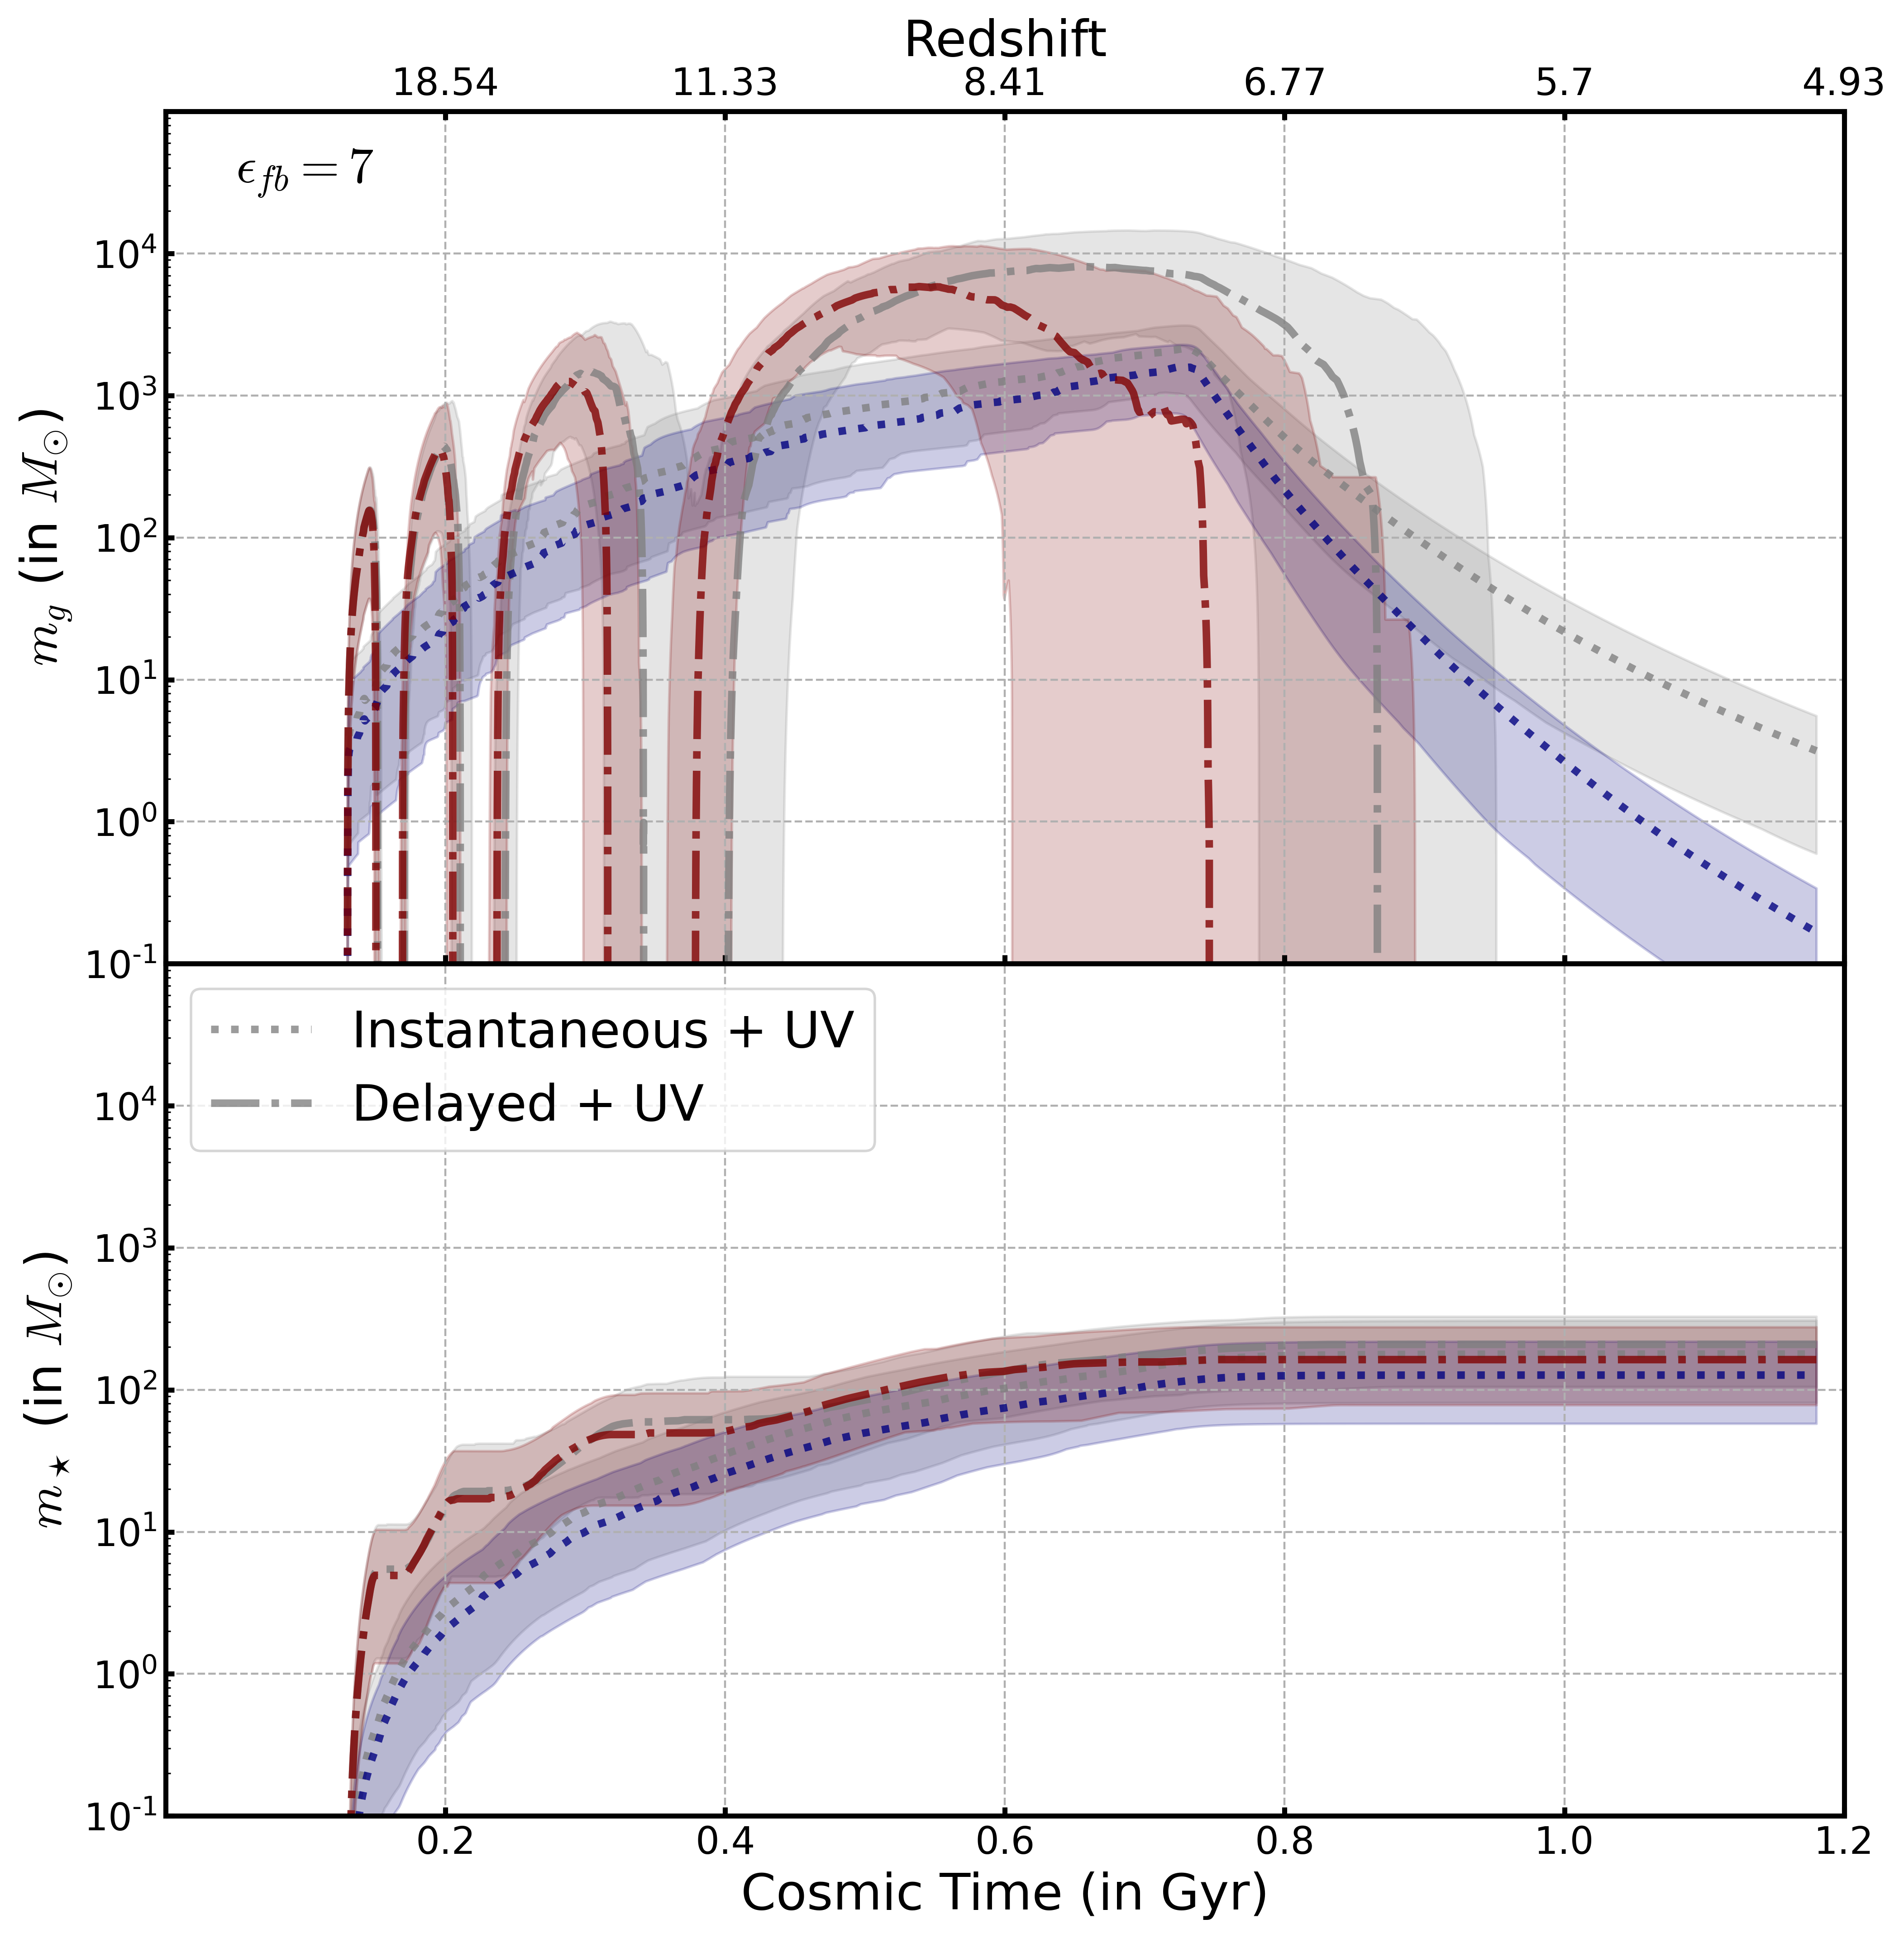
In Figure 5, we fix star formation efficiency at =0.015 and look at feedback efficiencies of =2 (low efficiency, upper panel) and =7 (high efficiency, lower panel). As anticipated, stronger feedback acts to accelerate when the median halo loses its gas mass (i.e. ), especially following the onset of UV suppression, and the spread in times when this occurs is larger than in the fiducial model (0.3 Gyr compared to 0.2 Gyr in the fiducial case); however, it has little effect on the evolution of the stellar mass. We find that weaker feedback has a dramatic effect on the evolution of in the delayed +UV model; the initial oscillations seen in the fiducial case are present, but after 0.3 Gyrs grows up to the onset of UV suppression, before showing a slow decline; the total gas mass in this model is larger than in the instantaneous feedback case after the initial oscillations have damped away. The behaviour of the instantaneous +UV models in both the strong and weak feedback cases track that in the fiducial case, with the key difference being in the rate of decline of after the onset of UV suppression - the halo retains more (less) gas mass at a given time when feedback is strong (weak).
3.4 Delayed Feedback Timescale,
In Figure 6 we assess how our choice of the delayed feedback timescale, , influences the growth of and with cosmic time. We focus on a sample of 100 halos with at , with fixed and our fiducial values of star formation and feedback efficiency of =0.015 and =5. According to our formulation, the instantaneous star formation and feedback model corresponds to =0, while our fiducial delayed feedback model assumes =0.015 Gyr; we consider two further cases, with =0.0075 Gyr (upper panel) and 0.03 Gyr (lower panel).
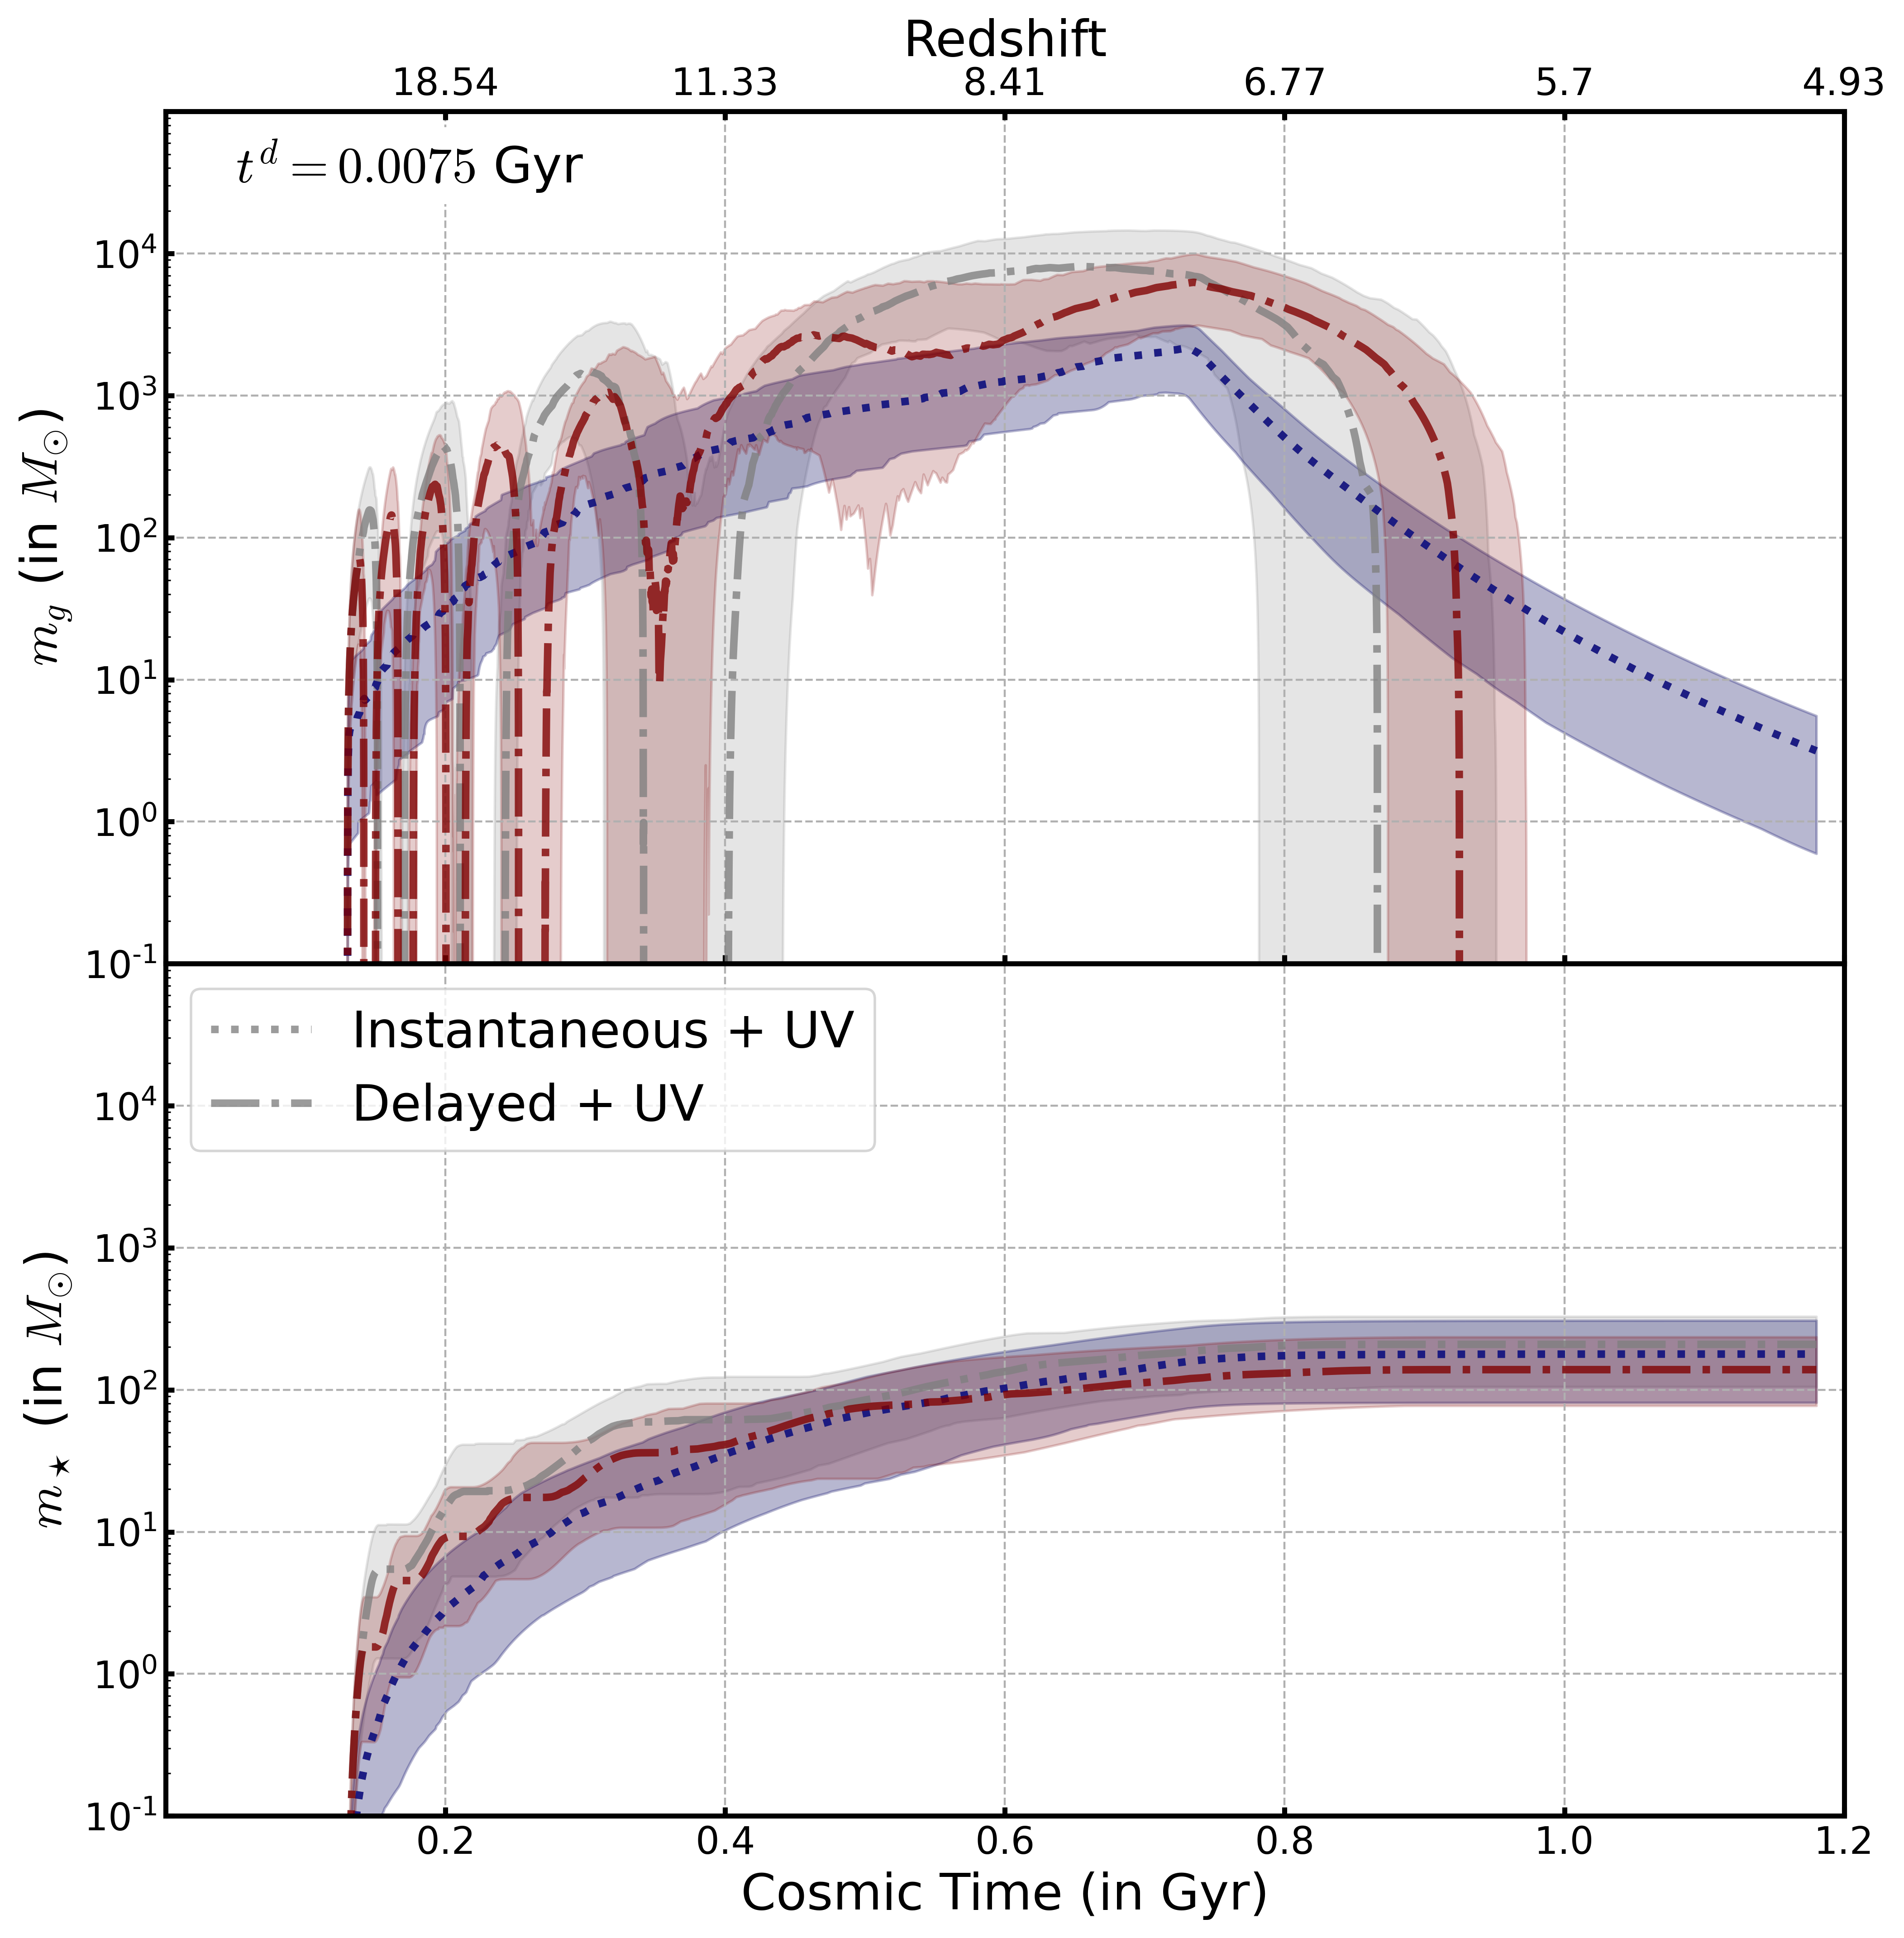
Compared to our fiducial model with =0.015 Gyr, we see that a shorter (longer) time delay increases (decreases) the number of initial oscillations in both and , and the peak median masses are similar. There are two noticeable differences - in the lengths of the intervals when at early times, with =0.03 Gyr experiencing longer intervals when ; and in the evolution of after the onset of UV suppression of gas accretion, such that plateaus close to its peak value in the model with the long time delay through to 1.2 Gyr, whereas after the onset of UV suppression as in the fiducial case, albeit with a delay of Gyr. These trends highlight the complex interplay between gas accretion, star formation, and delayed feedback - especially the manner in which gas mass is retained at later times when =0.03 Gyr.
3.5 Redshift of Reionization,
In Figure 7 we assess how our choice of the redshift of reionization, , influences the growth of and with cosmic time. Again we focus on a sample of 100 halos with at , with our fiducial values of star formation and feedback efficiency of =0.015, =5 fixed. We look at the case of =10, which corresponds to the time when the Universes was approximately 60% of its age at =7 (our fiducial redshift of reionization). The trends are qualitatively similar to those we see when =7; the peak values of and are lower, and the rate at which is more rapid in the case of instantaneous feedback with UV suppression, as we would expect because of the shorter dynamical times in these systems.
3.6 Baryon Mass Content - Variation with Halo Mass
We have explored how local factors - star formation and feedback efficiencies, burstiness of star formation, variation in dark matter halo assembly histories - and global factors - the onset of UV suppression arising from cosmological reionization - influence the time evolution of the gas and stellar masses of halos. We focused on a halo mass scale - at - that we argued is transitional, being sufficiently massive enough not to experience early truncation of gas accretion and star formation, but not overly massive that it’s unaffected by delayed feedback and UV suppression of gas accretion from the IGM. We have this information for halos spanning a mass range at that epoch, as we show in A.
In Figure 8 we quantify how and vary with , looking at three epochs - =10, 7, and 5 (from right to left). Because we are interested in relative trends, we plot the quantity against at that epoch. As the system becomes gas depleted, we expect that because , which we expect at lower halo masses and should move to a higher mass scale following the onset of the UV suppression of gas accretion from the IGM.
At =10, we see that this ratio shows little variation across the mass range, with the median in the instantaneous + UV case, compared to in the delayed + UV case. There is a weak trend for to decrease (increase) with increasing mass in the instantaneous (delayed) + UV case. Interestingly, we see an enhancement in the delayed + UV case in the halo mass range - this reflects the transitional nature of this halo mass range and how halo mass assembly histories interact with burstiness in star formation and delayed feedback to produce a range in gas mass.
By =7, we now see a marked variation across the mass range. At higher masses, the median in the instantaneous + UV case, unchanged from =10; in contrast, in the delayed + UV case, which has is lower than at =10. The ratio increases smoothly towards lower masses in the instantaneous + UV case, whereas the ratio is flat down to before sharply turning up to . At =5, the marked variation with mass has strengthened. At higher masses, the median in the instantaneous + UV case is unchanged from =10, whereas in the delayed + UV case, which is marginally lower than at =7. We now see a gradual rise in towards lower becoming evident at ; by =1 by in both the instantaneous + UV and delayed + UV cases.
At the three epochs we have considered, we see a general trend for to be approximately a factor of larger in the instantaneous + UV case compared to the delayed + UV case. Depending on epoch and mass scale, this can mean both a relative enhancement in stellar mass or a relative deficit in gas mass in the instantaneous + UV model. However, the trend is for the lower mass galaxies to have higher stellar masses in the delayed + UV case, while - in the context of this particular physical model - higher mass galaxies can retain their gas reservoirs. Physically, we would expect seed super-massive black hole growth and associated feedback to reduce gas mass in these high mass galaxies. We will revisit this in a future paper.
4 Conclusions
We have investigated how the baryon mass content (i.e. the stellar and gas mass) of dark matter halos in the early Universe () is affected by the complex interplay between bursty star formation - arising from delayed feedback - and the UV suppression of gas accretion from the IGM driven by cosmological reionization. Using a lightweight semi-analytical model that we have written, we have assessed how global factors - the emergence of an ionising ultraviolet (UV) radiation background - and local factors - star formation and feedback efficiency, time delayed feedback, and variations in dark matter halo assembly histories - influence the evolution of baryon mass content as a function of cosmic time () and dark matter halo mass ().
Using the assembly histories of baryons in a sample of halos with at =5 to illustrate the relative importance of physical processes, we investigated how star formation efficiency, the strength of feedback, and the delayed feedback timescale influenced the stellar and gas masses over cosmic time. As shown by previous studies, delayed feedback leads to oscillations in gas mass, evident more subtly in the stellar mass, as a function of cosmic time. If star formation is inefficient, gas and stellar mass growth histories are similar regardless of whether or not feedback is instantaneous or delayed; in contrast, highly efficient star formation can drive strong oscillations, as we would anticipate given that this population produces feedback via supernovae winds. Weaker delayed feedback cannot suppress the oscillatory behaviour in lower mass systems and these systems can retain their gas for a more extended period, whereas the main effect of stronger feedback is to drive more quickly. Longer delayed feedback timescales reduce the number of oscillations in and can result in more gas being retained at later times, whereas an earlier redshift of reionization has the simple effect of nudging the evolutionary trends in and (i.e. , plateauing of to the correspondingly earlier time.
If we consider the variation of baryon mass content - which we parameterise by the ratio - with halo mass, we find at earlier times that the median trend is for the ratio to be relatively flat and small in both the instantaneous and delayed feedback cases - of order - but with to be approximately a factor of larger in the instantaneous case. At later times, we find that the ratio increases with decreasing halo mass such that in the lowest mass systems. Higher mass systems retain their gas reservoirs in both cases considered because they are sufficiently massive to continue accreting gas from the IGM in a way that less massive systems cannot during cosmological reionization.
The relative gas richness of massive systems is at odds with both observations and theoretical expectations (Moster2018, 29, 24, e.g.), but we would expect feedback from super-massive black holes in these massive galaxies to expel gas and quench star formation. As noted in § 2, we do not model seed supermassive black growth or its associated feedback; we expect this to be important (Power2011, 39, e.g.) in an interesting, mass scale dependent manner (Nayakshin2009MNRAS, 32, cf.) and we shall explore it in a future paper.
We have not explicitly considered the influence of metallicity in this paper, although we have investigated straightforward extensions to our model to do this (Kravtsov2022, 23, e.g.). We expect that feedback efficiency should depend on metallicity (Jecmen2023, 21, 45, e.g.). For example, the ability of massive stars to drive stellar winds depends on the interaction cross-section of energetic photons with gas in stellar atmospheres, which depends on the presence of heavier elements (Lamers1999, 26, cf.). This will introduce another mass-scale dependence, reflecting the number of generations of stars and metal enrichment events, and we shall explore it in future work.
5 Acknowledgement
AM and CP thank the anonymous referee for their very positive report. CP acknowledges the support of the ARC Centre of Excellence for All Sky Astrophysics in 3 Dimensions (ASTRO 3D), through project number CE170100013.
Appendix A Evolution of Baryon Mass Content at Low and High Halo Masses
In Figure 9, we show the variation in and with cosmic time for a sample of 100 halos, each with at . The dotted (dot-dashed) curves correspond to the median values of (upper panel) and (lower) for instantaneous (bursty) star formation and feedback with UV suppression of accretion, while the coloured bands indicate the range of the 10 and 90 percentiles. This shows how variations in the assembly history of the underlying dark matter halo, whose growth rate governs the growth rate of the gas mass and consequently the stellar mass. Interestingly we see a large variation in gas mass at late times for the lower mass system - although the median , there is a large number of systems with .
References
- (1) R. Barkana and A. Loeb “In the beginning: the first sources of light and the reionization of the universe” In Phys. Rep. 349.2, 2001, pp. 125–238 DOI: 10.1016/S0370-1573(01)00019-9
- (2) J.. Bond, S. Cole, G. Efstathiou and N. Kaiser “Excursion Set Mass Functions for Hierarchical Gaussian Fluctuations” In ApJ 379, 1991, pp. 440 DOI: 10.1086/170520
- (3) Martin A. Bourne and Chris Power “Simulating feedback from nuclear clusters: the impact of multiple sources” In MNRAS 456.1, 2016, pp. L20–L24 DOI: 10.1093/mnrasl/slv162
- (4) Kristan Boyett et al. “A massive interacting galaxy 510 million years after the Big Bang” In Nature Astronomy, 2024 DOI: 10.1038/s41550-024-02218-7
- (5) Michael Boylan-Kolchin “Stress testing CDM with high-redshift galaxy candidates” In Nature Astronomy 7, 2023, pp. 731–735 DOI: 10.1038/s41550-023-01937-7
- (6) Romeel Davé, Kristian Finlator and Benjamin D. Oppenheimer “An analytic model for the evolution of the stellar, gas and metal content of galaxies” In MNRAS 421.1, 2012, pp. 98–107 DOI: 10.1111/j.1365-2966.2011.20148.x
- (7) A. Dekel and J. Silk “The Origin of Dwarf Galaxies, Cold Dark Matter, and Biased Galaxy Formation” In ApJ 303, 1986, pp. 39 DOI: 10.1086/164050
- (8) Avishai Dekel et al. “Efficient formation of massive galaxies at cosmic dawn by feedback-free starbursts” In MNRAS 523.3, 2023, pp. 3201–3218 DOI: 10.1093/mnras/stad1557
- (9) Tibor Dome et al. “Mini-Quenching of High-Redshift Galaxies by Bursty Star Formation” arXiv, 2023 DOI: 10.48550/ARXIV.2305.07066
- (10) G. Efstathiou “Suppressing the formation of dwarf galaxies via photoionization” In Monthly Notices of the Royal Astronomical Society 256.1 Oxford University Press (OUP), 1992, pp. 43P–47P DOI: 10.1093/mnras/256.1.43p
- (11) G. Efstathiou “A model of supernova feedback in galaxy formation” In Monthly Notices of the Royal Astronomical Society 317.3 Oxford University Press (OUP), 2000, pp. 697–719 DOI: 10.1046/j.1365-8711.2000.03665.x
- (12) Najmeh Emami et al. “A Closer Look at Bursty Star Formation with and Distributions” In The Astrophysical Journal 881.1 American Astronomical Society, 2019, pp. 71 DOI: 10.3847/1538-4357/ab211a
- (13) Andreas L. Faisst et al. “The Recent Burstiness of Star Formation in Galaxies at iz/i 4.5 from Hi/i Measurements” In The Astrophysical Journal 884.2 American Astronomical Society, 2019, pp. 133 DOI: 10.3847/1538-4357/ab425b
- (14) Claude-André Faucher-Giguère “A model for the origin of bursty star formation in galaxies” In Monthly Notices of the Royal Astronomical Society 473.3 Oxford University Press (OUP), 2018, pp. 3717–3731 DOI: 10.1093/mnras/stx2595
- (15) Steven L. Finkelstein et al. “CEERS Key Paper. I. An Early Look into the First 500 Myr of Galaxy Formation with JWST” In ApJ 946.1, 2023, pp. L13 DOI: 10.3847/2041-8213/acade4
- (16) Steven L. Finkelstein et al. “The Complete CEERS Early Universe Galaxy Sample: A Surprisingly Slow Evolution of the Space Density of Bright Galaxies at z ~8.5-14.5” In arXiv e-prints, 2023, pp. arXiv:2311.04279 DOI: 10.48550/arXiv.2311.04279
- (17) Steven R. Furlanetto and Jordan Mirocha “Bursty star formation during the Cosmic Dawn driven by delayed stellar feedback” In Monthly Notices of the Royal Astronomical Society 511.3 Oxford University Press (OUP), 2022, pp. 3895–3909 DOI: 10.1093/mnras/stac310
- (18) Steven R. Furlanetto, Jordan Mirocha, Richard H. Mebane and Guochao Sun “A minimalist feedback-regulated model for galaxy formation during the epoch of reionization” In Monthly Notices of the Royal Astronomical Society 472.2 Oxford University Press (OUP), 2017, pp. 1576–1592 DOI: 10.1093/mnras/stx2132
- (19) Nickolay Y. Gnedin “Effect of Reionization on Structure Formation in the Universe” In The Astrophysical Journal 542.2 American Astronomical Society, 2000, pp. 535–541 DOI: 10.1086/317042
- (20) Philip F. Hopkins et al. “What causes the formation of discs and end of bursty star formation?” In MNRAS 525.2, 2023, pp. 2241–2286 DOI: 10.1093/mnras/stad1902
- (21) Michelle C. Jecmen and M.. Oey “Delayed Massive-star Mechanical Feedback at Low Metallicity” In ApJ 958.2, 2023, pp. 149 DOI: 10.3847/1538-4357/ad0460
- (22) Christian Kragh Jespersen, Charles L. Steinhardt, Rachel S. Somerville and Christopher C. Lovell “On the Significance of Rare Objects at High Redshift: The Impact of Cosmic Variance” In arXiv e-prints, 2024, pp. arXiv:2403.00050 DOI: 10.48550/arXiv.2403.00050
- (23) Andrey Kravtsov and Viraj Manwadkar “GRUMPY: a simple framework for realistic forward modelling of dwarf galaxies” In Monthly Notices of the Royal Astronomical Society 514.2 Oxford University Press (OUP), 2022, pp. 2667–2691 DOI: 10.1093/mnras/stac1439
- (24) Ivo Labbé et al. “A population of red candidate massive galaxies 600 Myr after the Big Bang” In Nature 616.7956, 2023, pp. 266–269 DOI: 10.1038/s41586-023-05786-2
- (25) Cedric Lacey and Shaun Cole “Merger rates in hierarchical models of galaxy formation” In MNRAS 262.3, 1993, pp. 627–649 DOI: 10.1093/mnras/262.3.627
- (26) Henny J…. Lamers and Joseph P. Cassinelli “Introduction to Stellar Winds”, 1999
- (27) Adam K. Leroy et al. “Cloud-scale ISM Structure and Star Formation in M51” In The Astrophysical Journal 846.1 American Astronomical Society, 2017, pp. 71 DOI: 10.3847/1538-4357/aa7fef
- (28) Tobias J. Looser et al. “Discovery of a quiescent galaxy at z=7.3” arXiv, 2023 DOI: 10.48550/ARXIV.2302.14155
- (29) Benjamin P. Moster, Thorsten Naab and Simon D.. White “EMERGE - an empirical model for the formation of galaxies since z 10” In MNRAS 477.2, 2018, pp. 1822–1852 DOI: 10.1093/mnras/sty655
- (30) Alexander L. Muratov et al. “Gusty, gaseous flows of FIRE: galactic winds in cosmological simulations with explicit stellar feedback” In MNRAS 454.3, 2015, pp. 2691–2713 DOI: 10.1093/mnras/stv2126
- (31) Norman Murray “Star formation efficiencies and lifetimes of giant molecular clouds in the Milky Way” In The Astrophysical Journal 729.2 American Astronomical Society, 2011, pp. 133 DOI: 10.1088/0004-637x/729/2/133
- (32) Sergei Nayakshin, Mark I. Wilkinson and Andrew King “Competitive feedback in galaxy formation” In MNRAS 398.1, 2009, pp. L54–L57 DOI: 10.1111/j.1745-3933.2009.00709.x
- (33) Takashi Okamoto, Liang Gao and Tom Theuns “Mass loss of galaxies due to an ultraviolet background” In Monthly Notices of the Royal Astronomical Society 390.3 Oxford University Press (OUP), 2008, pp. 920–928 DOI: 10.1111/j.1365-2966.2008.13830.x
- (34) Jose Oñorbe et al. “Forged in fire: cusps, cores and baryons in low-mass dwarf galaxies” In Monthly Notices of the Royal Astronomical Society 454.2 Oxford University Press (OUP), 2015, pp. 2092–2106 DOI: 10.1093/mnras/stv2072
- (35) Matthew E Orr, Christopher C Hayward and Philip F Hopkins “A simple non-equilibrium feedback model for galaxy-scale star formation: delayed feedback and SFR scatter” In Monthly Notices of the Royal Astronomical Society 486.4 Oxford University Press (OUP), 2019, pp. 4724–4737 DOI: 10.1093/mnras/stz1156
- (36) A. Pallottini and A. Ferrara “Stochastic star formation in early galaxies: Implications for the James Webb Space Telescope” In A&A 677, 2023, pp. L4 DOI: 10.1051/0004-6361/202347384
- (37) Hannah Parkinson, Shaun Cole and John Helly “Generating dark matter halo merger trees” In MNRAS 383.2, 2008, pp. 557–564 DOI: 10.1111/j.1365-2966.2007.12517.x
- (38) Planck Collaboration et al. “Planck 2018 results. VI. Cosmological parameters” In A&A 641, 2020, pp. A6 DOI: 10.1051/0004-6361/201833910
- (39) C. Power, K. Zubovas, S. Nayakshin and A.. King “Self-regulated star formation and the black hole-galaxy bulge relation” In MNRAS 413.1, 2011, pp. L110–L113 DOI: 10.1111/j.1745-3933.2011.01048.x
- (40) J.. Scalo and C. Struck-Marcell “A physical mechanism for bursts of star formation” In The Astrophysical Journal 301 American Astronomical Society, 1986, pp. 77 DOI: 10.1086/163874
- (41) Xuejian Shen et al. “The impact of UV variability on the abundance of bright galaxies at z 9” In MNRAS 525.3, 2023, pp. 3254–3261 DOI: 10.1093/mnras/stad2508
- (42) Martin Sparre et al. “(Star)bursts of FIRE: observational signatures of bursty star formation in galaxies” In MNRAS 466.1, 2017, pp. 88–104 DOI: 10.1093/mnras/stw3011
- (43) Volker Springel et al. “Simulations of the formation, evolution and clustering of galaxies and quasars” In Nature 435.7042, 2005, pp. 629–636 DOI: 10.1038/nature03597
- (44) Victoria Strait et al. “An Extremely Compact, Low-mass Galaxy on its Way to Quiescence at z = 5.2” In The Astrophysical Journal Letters 949.2 American Astronomical Society, 2023, pp. L23 DOI: 10.3847/2041-8213/acd457
- (45) Kazuyuki Sugimura et al. “Violent starbursts and quiescence induced by FUV radiation feedback in metal-poor galaxies at high-redshift” In arXiv e-prints, 2024, pp. arXiv:2403.04824 DOI: 10.48550/arXiv.2403.04824
- (46) Guochao Sun et al. “Bursty Star Formation Naturally Explains the Abundance of Bright Galaxies at Cosmic Dawn” In ApJ 955.2, 2023, pp. L35 DOI: 10.3847/2041-8213/acf85a
- (47) Anne A. Thoul and David H. Weinberg “Hydrodynamic Simulations of Galaxy Formation. II. Photoionization and the Formation of Low-Mass Galaxies” In ApJ 465, 1996, pp. 608 DOI: 10.1086/177446
- (48) Daniel R. Weisz et al. “Modeling the Effects of Star Formation Histories on H and Ultraviolet Fluxes in nearby Dwarf Galaxies” In ApJ 744.1, 2012, pp. 44 DOI: 10.1088/0004-637X/744/1/44
- (49) Simon D.. White and Carlos S. Frenk “Galaxy Formation through Hierarchical Clustering” In ApJ 379, 1991, pp. 52 DOI: 10.1086/170483
- (50) J. B. Wyithe and Abraham Loeb “Reionization of Hydrogen and Helium by Early Stars and Quasars” In ApJ 586.2, 2003, pp. 693–708 DOI: 10.1086/367721
- (51) J. B. Wyithe and Abraham Loeb “Suppression of dwarf galaxy formation by cosmic reionization” In Nature 441.7091, 2006, pp. 322–324 DOI: 10.1038/nature04748