Probing dark energy using anisotropies in the clustering of post-EoR H i distribution
Abstract
We propose an anisotropy quantifier of the H i 21-cm signal traditionally used to clock the astrophysics of the reionization era as a post-reionization dark energy diagnostic. We find that the anisotropy probe can be measured at SNR in both auto-correlation and in cross-correlation with the Ly- forest over a wide and range. We propose to use the BAO signature on the anisotropy signal to measure . Subsequently, we put constraints on a dark energy model involving a negative cosmological constant on top of a quintessence scalar field and find that such a model is consistent with futuristic observations.
Introduction: An understanding of the nature of dark energy [1, 2] for explaining cosmic acceleration [3, 4, 5, 6] remains elusive even today. The generally accepted CDM paradigm also indicates tension with data. The measured value from high redshift CMBR observations [7, 8, 9, 10, 11, 12] seems to consistently disagree with low redshift estimates from distance measurements using Supernova (SnIa) observations [13, 14, 15, 16, 17] and from the imprint of baryon acoustic oscillation (BAO) signature in galaxy clustering [18] or in the Ly- forest [19, 20]. Given the immense diversity of dark energy models spanning the theoretical landscape [21], and the critical observational crisis [22, 23, 24, 25, 26], it is imperative to measure the expansion history over a much wider redshift range and with greater level of precision.
Intensity mapping of the post-reionization HI distribution using the redshifted 21-cm signal holds the rich possibility of probing dark energy scenarios over a wide range of redshifts [27, 28, 29, 30, 31, 32, 33, 34, 35, 36, 37, 38, 39]. While it is theoretically promising, precise subtraction of large galactic and extra-galactic foregrounds [40, 41, 42, 43, 44, 45] remains the singularly crucial hindrance towards detecting the signal. The cross-correlation of the redshifted 21cm signal from the post-reionization epoch with other tracers from the same epoch has been extensively studied as a probe of cosmological evolution and structure formation [46, 47, 48, 49, 50, 51, 52, 53, 54, 55]. The 21-cm foregrounds do not appear in the cross-correlation signal, and appears only as a noise. Therefore a statistically significant detection of the 21-cm signal can only be truly ascertained when detected in a cross-correlation [56, 57, 58].
The redshifts probed by the 21-cm signal can also be probed by Ly- forest, which is an established probe of the post-EoR epoch [59, 60, 61, 62, 63, 64, 65, 66, 67, 19, 68, 69]. The Ly- forest consists of distinct absorption features in the spectra of distant QSOs and are tracers of the low column density HI density fluctuations along one dimensional sight lines. Observation of a large number of QSO spectra by the Baryon Oscillation Spectroscopic Survey (BOSS) 111https://www.sdss3.org/surveys/boss.php with high signal to noise ratio (SNR) allows the possibility of a measurement of the matter power spectrum [68] at redshift . The cross-correlation of the Ly- forest and the redshifted 21cm signal as a powerful probe of the post-reionization epoch [71, 72, 73] was proposed theoretically in linear theory [48, 51, 74], subsequently studied in numerical simulations [54] and is recently detected in observations [58].
The 21-cm auto power spectrum and the 21-cm Ly- cross-correlation power spectrum is anisotropic as it depends on where, is the angle between the line of sight and the Fourier mode vector . This anisotropy arises from (i) the redshift space distortion (Kaiser effect [75, 76]) arising due to the peculiar motion of the gas (ii) the nonlinear effect of peculiar velocity dispersion - Finger of God effect [77] and (iii) the Alcock-Paczynski (AP) effect arising due to departures of distance scales from their values in a fiducial cosmology from their actual values along the line of sight and in the transverse direction [78, 79]. In this paper we propose this anisotropy in the auto and cross-power spectrum to be a probe of dark energy. As a suitable diagnostic for this anisotropy we use the quantity [80]
| (1) |
where the average in the suitable range. This anisotropy ratio quantifies the dependence of the power spectrum and has values for highly anisotropic power spectrum and is when the dependence is negligible. This quantifier is used traditionally to “clock” the astrophysics of the re-ionization process [80, 81, 82]. The anisotropy arises in the 21-cm signal from the cosmic-dawn due to different powers of in the various terms of the 21-cm reionization power spectrum. In this paper we propose as a dark energy diagnostic from the post-reionization epoch where the anisotropy is now rooted in the AP effect. The AP effect shall imprint the oscillatory BAO signature [83] on and can thus be used to constrain and . The anisotropy ratio has the advantage that any improper modelling of the global signal including the neutral fraction does not affect . Further, the differences in the anisotropy of the Ly- forest signal from the 21-cm signal in the space implies that the anisotropy ratio shall be higher for the cross-correlation. In this work we investigate in the binned space as a means to optimally detect the BAO feature in both auto and cross signal and subsequently make error projections on various dark energy models.
Dark Energy Models: In this work we have considered the following dark energy scenarios governing the low redshift cosmic evolution and structure formation. Firstly we note that it is convenient to use some parametrization of these models which mimic their general behaviour. The dynamic equation of state (EoS) is one such commonly used parametrization. The standard CDM model is characterized by . In a two prameter model the EoS is given by . The most popular and widely used parametrization of this form is given by Chevallier-Linder-Polarski (CPL) [84, 85], where . This model gives a smooth variation of as to as . A large class of quintessence scalar field models can be mapped into the CPL parametrization [86].
Certain quintessence models with an AdS vacuum do not rule out the possibility of a negative cosmological constant [87, 88, 89, 90, 91, 92]. In this work we also consider such quintessence models with a non zero vacuum called CPL-CDM models. These models mimic a rolling scalar field alongside a cosmological constant [93, 94]. In this work we assume that the Universe is governed by such a model with the best fit model parameters () obtained from [93]. We then use the BAO imprint on to make error projections on CDM, CPL, and CPL-CDM models.
The H i 21-cm and Ly- auto and cross-correlation: The astrophysical processes that characterized the EoR got over by [95] Most of H i in the post-reionization era are housed in the Damped Ly- (DLA) [96] systems which source the HI 21-cm signal to be seen in emission against the background CMBR. A low resolution tomographic imaging of the diffuse HI 21-cm radiation background without resolving the individual DLAs is the aim of intensity mapping experiments. The diffuse H i in a predominantly ionized IGM in the same epoch also produces distinct absorption features, in the spectra of background quasars. These Ly- forest systems traces H i density fluctuations along one dimensional quasar lines of sight. On large cosmological scales the Ly- forest and the redshifted 21-cm signal are, both known to be biased tracers of the underlying dark matter (DM) distribution [63, 97, 98, 99, 54]. The 3D cross-correlation power spectrum of the smoothed fluctuations of the 21-cm brighness temperature and the transmitted QSO flux through the Ly- forest as a function of is given by
| (2) |
where . We note that when we have the 21-cm auto power spectrum. Here is the dark matter power spectrum at redshift . The amplitude of the 21-cm signal is given by [28, 29, 30]
| (3) |
The mean neutral fraction [100, 101] is assumed to be a constant in the post EoR epoch. The 21-cm bias has been studied in [97, 98, 102]. We have adopted the dependent bias fit function from [102] in this work. The redsift space distortion parameter for the 21-cm signal is given by where is the logarithmic growth rate of matter fluctuations. The amplitude of the Ly- forest transmitted flux fluctuation is adopted from the fitted flux data using BOSS [103] with fiducial and [103]. The corresponding distortion factor for Ly- forest is assumed to be . If the fiducial cosmological model is different from the real Universe, additional anisotropy shall be introduced through the AP effect[104, 105, 106].Thus, if and are the Hubble rate and angular diameter distance in the fiducial and real cosmology, additional AP anisotropy appears as in Eq.Probing dark energy using anisotropies in the clustering of post-EoR H i distribution through the quantity .
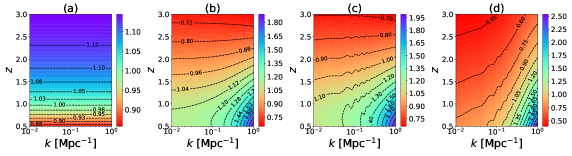
Results and Discussion: This work focuses on the anisotropy diagnostic defined in Eq.(1) as a probe of cosmology in the post EoR epoch. We first note that in the absence of the AP effect, any overall function of shall not affect which is determined by the relative coeffecients of the different powers of . Thus, in this case the isotropic matter power spectrum has no imprint on , the latter being only sensitive to the ratio . In Fig.1(a) we consider a constant linear bias . Here, since is independent, is also scale independent and follows the dependence of . At large redshifts irrespective of dark energy models as perturbations grows as in the matter dominated epoch. Thus, in Fig.1(a) is seen to saturate at large redshifts. In this case is thus a low redshift probe of .
The assumption of constant bias is reasonable on large scales. However, in general increases with monotonically and is dependent on small scales. We note that is enhanced when is large which corresponds to small . This is reflected in Fig.1(b), where is seen to decrease with since grows with faster than . As a function of , the bias function for low redshifts is known to have a dip at around [102]. The corresponding rise of with is reflected in the peak in at these scales for . Thus, in models where is only a function of redshift, the scale dependence of thus gives a direct probe of the 21-cm bias without the issue of degeneracy with the overall amplitude of the power spectrum. The AP effect imprints on through the discrepancy in distance scales measured along the radial and transverse direction using the fiducial cosmology as compared to their real values. This introduces dependence in which manifests as the BAO oscillations in the plane as contours of as is seen in Fig.1(c). In Fig.1(d), we consider a cosmological model with a Hu-Sawicki [107] modification to gravity with [107, 108]. In such models, the growth rate is scale dependent and manifests in additional anisotropy on small scales at all redshifts. The lower panel in Fig.1 shows for the cross-correlation and demonstrates the same qualitative behaviour.
We adopt a visibility-visibility correlation approach in a radio-interferometric observation to make estimates for errors on the 21-cm auto power spectrum. We assume suitable averaging over visibility bins such that the covariance matrix is diagonal whereby [109]
Here for an observing redshift , corresponding to a frequency we have m, is the comoving distance to the source, is the effective area of the antenna dish, is the bandwidth and
The system temperature is assumed to be dominated by sky temperature. For a total observation time , we have , where is the number of antennae in the array and is the normalized baseline distribution function.
For the cross-correlation of 21-cm signal with the Ly- forest, the error is given by
with, , where is the quasar number density.
In order to make error projections on , we use the formalism in [109]. Each term in are integrals of in some range. Thus is a sum in quadrature of the relative errors of each of those terms, which are of the form .
For the radio-interferometric measurement of the 21-cm power spectrum we consider a futuristic SKA1-Mid like experiment. We consider dish antennae each of diameter m and efficiency . The antennae are assumed to be distributed radially and falls off as which increases the noise on small scales due to poor visibility sampling. We consider about observations of bandwidth MHZ measurements at observing frequencies in the range MHz to MHz. We also consider logarithmically binned values, in the range with with . We consider a total observation time of hrs per pointing and with multiple pointings for a full sky survey. For cross correlation with the Ly- forest we note that the quasar redshift distribution peaks in the range [110]. For quasars at redshift , excluding some reshifts to avoid quasar’s proximity effect and contamination from Ly- forest or the intrinsic O-VI absorption, we focus on a redshift zone of . We also assume that all the Ly- spectra are measured at a SNR of and consider a quasar number density of . The Ly- and 21-cm data are also assumed to be smoothed to the same resolution before cross-correlating them.
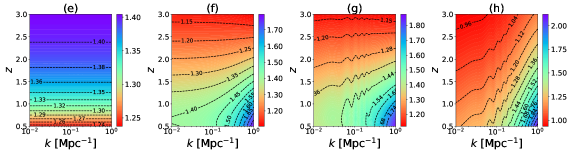
Figure 2 shows in the plane. Fig.2(a) shows that using the 21-cm auto power spectrum can be measured at in the range and . Fig.2(b) shows that for the cross-correlation signal can be measured at sensitivity for .
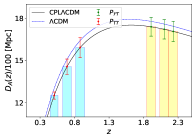
The BAO scale is the sound horizon at the drag epoch . We adopt the fiducial values and Mpc from [111] in our subsequent analysis. The dependence of on BAO distance scale in the transverse and radial direction allows us to measure the angular diameter distance and Hubble rate . The BAO feature in the matter power spectrum [18] is of the form , where . We choose two parameters and so that and . The Fisher matrix defined as
| (4) |
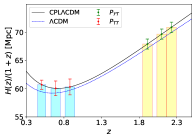
is used to obtain the errors on the parameters . For this purpose we use the high SNR regions identified from Fig. 2. Figure 3 shows the 1- errors on and for three z-bins at low redshifts obtained from the 21-cm auto correlation and three z-bins at high redshifts from the cross-correlation with Ly-.
| Parameters | |||||
|---|---|---|---|---|---|
| Constraints | |||||
| CPL-CDM | |||||
| CPL |
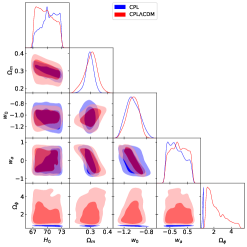
We find that a dark energy model with a scalar field along with a negative cosmological constant and the CDM can not be distinguished with these observations.
Taking flat priors for the CPL-CDM model model parameters with ranges of , , , , we obtain the the marginalized posterior distribution of the set of parameters using a Monte Carlo Markov Chain (MCMC) analysis. Figure 4 shows the corresponding 2D confidence contours. The fiducial model parameters are taken from [93]. We also constrain the parameters for the CPL model with fiducial values adopted from [112]. The results are tabulated in Table (1). We find that even high redshift measurements of in using the proposed anisotropy diagnostic indicates that dark energy with AdS vacua is consistent with cosmological observation including the local R21 measurements of [113].
We conclude, by noting that is a potentially powerful probes of dark energy models at redshifts where galaxies and CMBR can not probe. Further, though has a similar appearance as the spherically averaged power spectrum, it has two distinct advantages. Firstly it is a ratio and is hence insensitive to the global signal and does not require a precise measurement of . Secondly we note that foreground modeling and subtraction is key to detecting the 21-cm signal [40, 41, 42, 43, 44, 114]. We know that for a radio field of view one has to avoid the foreground wedge [114] where . subtracts out the integral for small s in the numerator and is thus is enhanced when the low modes are eliminated. A detailed treatment of the issues of foregrounds and other systematics would require a more comprehensive work.
References
- Padmanabhan [2003] T. Padmanabhan, Physics Reports 380, 235–320 (2003).
- Peebles and Ratra [2003] P. J. E. Peebles and B. Ratra, Rev. Mod. Phys. 75, 559 (2003).
- Perlmutter et al. [1997] S. Perlmutter, S. Gabi, G. Goldhaber, A. Goobar, D. E. Groom, I. M. Hook, A. G. Kim, M. Y. Kim, J. C. Lee, and R. e. a. Pain, The Astrophysical Journal 483, 565–581 (1997).
- Spergel et al. [2003] D. N. Spergel, L. Verde, H. V. Peiris, E. Komatsu, M. R. Nolta, C. L. Bennett, M. Halpern, G. Hinshaw, N. Jarosik, A. Kogut, and et al., The Astrophysical Journal Supplement Series 148, 175–194 (2003).
- Hinshaw et al. [2003] G. Hinshaw, D. N. Spergel, L. Verde, R. S. Hill, S. S. Meyer, C. Barnes, C. L. Bennett, M. Halpern, N. Jarosik, A. Kogut, and et al., The Astrophysical Journal Supplement Series 148, 135–159 (2003).
- Riess et al. [2016] A. G. Riess, L. M. Macri, S. L. Hoffmann, D. Scolnic, S. Casertano, A. V. Filippenko, B. E. Tucker, M. J. Reid, D. O. Jones, J. M. Silverman, and et al., The Astrophysical Journal 826, 56 (2016).
- Balkenhol and Dutcher et.al [2021] L. Balkenhol and D. Dutcher et.al (SPT-3G Collaboration), Phys. Rev. D 104, 083509 (2021).
- Dutcher et al. [2021] D. Dutcher, L. Balkenhol, P. Ade, Z. Ahmed, E. Anderes, A. Anderson, M. Archipley, J. Avva, K. Aylor, P. Barry, et al., Physical Review D 104, 022003 (2021).
- Jain and Taylor [2003] B. Jain and A. Taylor, Physical Review Letters 91, 141302 (2003).
- Huterer [2002] D. Huterer, Physical Review D 65, 063001 (2002).
- Amendola et al. [2008] L. Amendola, M. Kunz, and D. Sapone, Journal of Cosmology and Astroparticle Physics 2008 (04), 013.
- Martinet et al. [2021] N. Martinet, J. Harnois-Déraps, E. Jullo, and P. Schneider, Astronomy & Astrophysics 646, A62 (2021).
- Sandage et al. [2006] A. Sandage, G. Tammann, A. Saha, B. Reindl, F. Macchetto, and N. Panagia, The Astrophysical Journal 653, 843 (2006).
- Riess et al. [2021] A. G. Riess, S. Casertano, W. Yuan, J. B. Bowers, L. Macri, J. C. Zinn, and D. Scolnic, The Astrophysical Journal Letters 908, L6 (2021).
- Beaton et al. [2016] R. L. Beaton, W. L. Freedman, B. F. Madore, G. Bono, E. K. Carlson, G. Clementini, M. J. Durbin, A. Garofalo, D. Hatt, I. S. Jang, et al., The Astrophysical Journal 832, 210 (2016).
- Freedman et al. [2020] W. L. Freedman, B. F. Madore, T. Hoyt, I. S. Jang, R. Beaton, M. G. Lee, A. Monson, J. Neeley, and J. Rich, The Astrophysical Journal 891, 57 (2020).
- Blakeslee et al. [2021] J. P. Blakeslee, J. B. Jensen, C.-P. Ma, P. A. Milne, and J. E. Greene, The Astrophysical Journal 911, 65 (2021).
- Seo and Eisenstein [2007] H.-J. Seo and D. J. Eisenstein, The Astrophysical Journal 665, 14 (2007).
- Slosar et al. [2009] A. Slosar, S. Ho, M. White, and T. Louis, Journal of Cosmology and Astroparticle Physics 2009 (10), 019–019.
- du Mas des Bourboux et al. [2020] H. du Mas des Bourboux, J. Rich, and et.al, Astrophys. J. 901, 153 (2020), arXiv:2007.08995 [astro-ph.CO] .
- Di Valentino et al. [2021a] E. Di Valentino, O. Mena, S. Pan, L. Visinelli, W. Yang, A. Melchiorri, D. F. Mota, A. G. Riess, and J. Silk, Classical and Quantum Gravity 38, 153001 (2021a).
- Di Valentino et al. [2021b] E. Di Valentino, L. A. Anchordoqui, Ö. Akarsu, Y. Ali-Haimoud, L. Amendola, N. Arendse, M. Asgari, M. Ballardini, S. Basilakos, E. Battistelli, et al., Astroparticle Physics 131, 102605 (2021b).
- Wong et al. [2020] K. C. Wong, S. H. Suyu, G. C. Chen, C. E. Rusu, M. Millon, D. Sluse, V. Bonvin, C. D. Fassnacht, S. Taubenberger, M. W. Auger, et al., Monthly Notices of the Royal Astronomical Society 498, 1420 (2020).
- Abbott et al. [2022] T. Abbott, M. Aguena, A. Alarcon, S. Allam, O. Alves, A. Amon, F. Andrade-Oliveira, J. Annis, S. Avila, D. Bacon, et al., Physical Review D 105, 023520 (2022).
- Verde et al. [2013] L. Verde, P. Protopapas, and R. Jimenez, Physics of the Dark Universe 2, 166 (2013).
- Fields [2011] B. D. Fields, Annual Review of Nuclear and Particle Science 61, 47 (2011).
- Wyithe and Loeb [2009] J. S. B. Wyithe and A. Loeb, MNRAS 397, 1926 (2009).
- Bharadwaj and Sethi [2001] S. Bharadwaj and S. K. Sethi, Journal of Astrophysics and Astronomy 22, 293 (2001), arXiv:astro-ph/0203269 .
- Bharadwaj et al. [2001] S. Bharadwaj, B. B. Nath, and S. K. Sethi, Journal of Astrophysics and Astronomy 22, 21 (2001), arXiv:astro-ph/0003200 .
- Wyithe and Loeb [2007] S. Wyithe and A. Loeb, ArXiv e-prints (2007), arXiv:0708.3392 .
- Loeb and Wyithe [2008] A. Loeb and J. S. B. Wyithe, Physical Review Letters 100, 161301 (2008), arXiv:0801.1677 .
- Wyithe and Loeb [2008] S. Wyithe and A. Loeb, ArXiv e-prints (2008), arXiv:0808.2323 .
- Visbal et al. [2009] E. Visbal, A. Loeb, and S. Wyithe, Journal of Cosmology and Astro-Particle Physics 10, 30 (2009), arXiv:0812.0419 .
- Bharadwaj and Pandey [2003] S. Bharadwaj and S. K. Pandey, Journal of Astrophysics and Astronomy 24, 23 (2003), arXiv:astro-ph/0307303 .
- Bharadwaj and Srikant [2004] S. Bharadwaj and P. S. Srikant, Journal of Astrophysics and Astronomy 25, 67 (2004), arXiv:astro-ph/0402262 .
- Subramanian and Padmanabhan [1993] K. Subramanian and T. Padmanabhan, MNRAS 265, 101 (1993).
- Kumar et al. [1995] A. Kumar, T. Padmanabhan, and K. Subramanian, MNRAS 272, 544 (1995).
- Bagla et al. [1997] J. S. Bagla, B. Nath, and T. Padmanabhan, MNRAS 289, 671 (1997), arXiv:astro-ph/9610267 .
- Padmanabhan et al. [2015] H. Padmanabhan, T. R. Choudhury, and A. Refregier, Monthly Notices of the Royal Astronomical Society 447, 3745 (2015).
- Ghosh et al. [2010] A. Ghosh, S. Bharadwaj, S. S. Ali, and J. N. Chengalur, Monthly Notices of the Royal Astronomical Society 411, 2426–2438 (2010).
- Ghosh et al. [2011] A. Ghosh, S. Bharadwaj, S. S. Ali, and J. N. Chengalur, MNRAS 418, 2584 (2011), arXiv:1108.3707 [astro-ph.CO] .
- Liu and Tegmark [2012] A. Liu and M. Tegmark, Monthly Notices of the Royal Astronomical Society 419, 3491 (2012).
- Liu et al. [2009] A. Liu, M. Tegmark, J. Bowman, J. Hewitt, and M. Zaldarriaga, Monthly Notices of the Royal Astronomical Society 398, 401 (2009).
- Wang et al. [2006] X. Wang, M. Tegmark, M. G. Santos, and L. Knox, The Astrophysical Journal 650, 529 (2006).
- Di Matteo et al. [2002] T. Di Matteo, R. Perna, T. Abel, and M. J. Rees, The Astrophysical Journal 564, 576 (2002).
- Sarkar et al. [2009] T. G. Sarkar, K. K. Datta, and S. Bharadwaj, Journal of Cosmology and Astroparticle Physics 2009 (08), 019–019.
- Sarkar [2010] T. G. Sarkar, Journal of Cosmology and Astroparticle Physics 2010 (02), 002–002.
- Guha Sarkar et al. [2010] T. Guha Sarkar, S. Bharadwaj, T. R. Choudhury, and K. K. Datta, Monthly Notices of the Royal Astronomical Society 410, 1130–1134 (2010).
- Villaescusa-Navarro et al. [2015] F. Villaescusa-Navarro, M. Viel, D. Alonso, K. K. Datta, P. Bull, and M. G. Santos, Journal of Cosmology and Astroparticle Physics 2015 (03), 034.
- Jelić et al. [2010] V. Jelić, S. Zaroubi, N. Aghanim, M. Douspis, L. V. Koopmans, M. Langer, G. Mellema, H. Tashiro, and R. M. Thomas, Monthly Notices of the Royal Astronomical Society 402, 2279 (2010).
- Sarkar and Datta [2015] T. G. Sarkar and K. K. Datta, Journal of Cosmology and Astroparticle Physics 2015 (08), 001–001.
- Dash and Guha Sarkar [2021] C. B. Dash and T. Guha Sarkar, Journal of Cosmology and Astroparticle Physics 2021, 016.
- Sarkar et al. [2016a] T. G. Sarkar, K. Datta, A. Pal, T. R. Choudhury, and S. Bharadwaj, Journal of Astrophysics and Astronomy 37, 1 (2016a).
- Carucci et al. [2017] I. P. Carucci, F. Villaescusa-Navarro, and M. Viel, Journal of Cosmology and Astroparticle Physics 2017 (04), 001–001.
- Dash and Guha Sarkar [2022] C. B. Dash and T. Guha Sarkar, Monthly Notices of the Royal Astronomical Society 516, 4156 (2022).
- Chang et al. [2010] T.-C. Chang, U.-L. Pen, K. Bandura, and J. B. Peterson, Nature, arXiv:1007.3709 466, 463 (2010).
- Amiri et al. [2023] M. Amiri, K. Bandura, T. Chen, M. Deng, M. Dobbs, M. Fandino, S. Foreman, M. Halpern, A. S. Hill, G. Hinshaw, et al., The Astrophysical Journal 947, 16 (2023).
- Amiri et al. [2024] M. Amiri, K. Bandura, A. Chakraborty, M. Dobbs, M. Fandino, S. Foreman, H. Gan, M. Halpern, A. S. Hill, G. Hinshaw, et al., The Astrophysical Journal 963, 23 (2024).
- Croft et al. [1999] R. A. C. Croft, D. H. Weinberg, M. Pettini, L. Hernquist, and N. Katz, The Astrophysical Journal 520, 1–23 (1999).
- Gnedin and Hamilton [2002] N. Y. Gnedin and A. J. S. Hamilton, Monthly Notices of the Royal Astronomical Society 334, 107–116 (2002).
- Viel et al. [2002] M. Viel, S. Matarrese, H. Mo, M. Haehnelt, and T. Theuns, Monthly Notices of the Royal Astronomical Society 329, 848–862 (2002).
- Mandelbaum et al. [2003] R. Mandelbaum, P. McDonald, U. Seljak, and R. Cen, Monthly Notices of the Royal Astronomical Society 344, 776–788 (2003).
- McDonald [2003] P. McDonald, The Astrophysical Journal 585, 34–51 (2003).
- Coppolani and Petitjean [2006] F. Coppolani and P. e. Petitjean, Monthly Notices of the Royal Astronomical Society 370, 1804 (2006).
- Gallerani et al. [2006] S. Gallerani, T. R. Choudhury, and A. Ferrara, Monthly Notices of the Royal Astronomical Society 370, 1401–1421 (2006).
- McDonald and Eisenstein [2007] P. McDonald and D. J. Eisenstein, Physical Review D 76, 10.1103/physrevd.76.063009 (2007).
- D’Odorico et al. [2006] V. D’Odorico, M. Viel, F. Saitta, S. Cristiani, S. Bianchi, B. Boyle, S. Lopez, J. Maza, and P. Outram, Monthly Notices of the Royal Astronomical Society 372, 1333–1344 (2006).
- McQuinn and White [2011] M. McQuinn and M. White, Monthly Notices of the Royal Astronomical Society 415, 2257–2269 (2011).
- Delubac et al. [2015] T. Delubac, J. E. Bautista, N. G. Busca, J. Rich, D. Kirkby, S. Bailey, A. Font-Ribera, A. Slosar, K.-G. Lee, M. M. Pieri, and et al., Astronomy and Astrophysics 574, 10.1051/0004-6361/201423969 (2015).
- Note [1] Https://www.sdss3.org/surveys/boss.php.
- Sarkar and Bharadwaj [2013] T. G. Sarkar and S. Bharadwaj, Journal of Cosmology and Astroparticle Physics 2013 (08), 023.
- Sarkar et al. [2019] A. Sarkar, A. K. Pal, and T. G. Sarkar, Journal of Cosmology and Astroparticle Physics 2019 (12), 058–058.
- Pal and Guha Sarkar [2016] A. K. Pal and T. Guha Sarkar, Monthly Notices of the Royal Astronomical Society 459, 3505 (2016).
- Sarkar et al. [2018] A. K. Sarkar, S. Bharadwaj, and T. Guha Sarkar, Journal of Cosmology and Astroparticle Physics 2018 (05), 051.
- Kaiser [1987] N. Kaiser, Monthly Notices of the Royal Astronomical Society 227, 1 (1987).
- Hamilton [1998] A. Hamilton, in The evolving universe (Springer, 1998) pp. 185–275.
- Jackson [1972] J. Jackson, Monthly Notices of the Royal Astronomical Society 156, 1P (1972).
- Alcock and Paczynski [1979] C. Alcock and B. Paczynski, Nature (London) 281, 358 (1979).
- Lopez-Corredoira [2014] M. Lopez-Corredoira, The Astrophysical Journal 781, 96 (2014).
- Fialkov et al. [2015] A. Fialkov, R. Barkana, and A. Cohen, Physical Review Letters 114, 101303 (2015).
- Ross et al. [2021] H. E. Ross, S. K. Giri, G. Mellema, K. L. Dixon, R. Ghara, and I. T. Iliev, Monthly Notices of the Royal Astronomical Society 506, 3717 (2021).
- Sikder et al. [2024] S. Sikder, R. Barkana, A. Fialkov, and I. Reis, Monthly Notices of the Royal Astronomical Society 527, 10975 (2024).
- Eisenstein and Hu [1998] D. J. Eisenstein and W. Hu, The Astrophysical Journal 496, 605 (1998).
- Chevallier and Polarski [2001] M. Chevallier and D. Polarski, International Journal of Modern Physics D 10, 213–223 (2001).
- Linder [2003] E. V. Linder, Phys. Rev. Lett. 90, 091301 (2003).
- Scherrer [2015] R. J. Scherrer, Physical Review D 92, 043001 (2015).
- Dutta et al. [2020] K. Dutta, A. Roy, Ruchika, A. A. Sen, and M. Sheikh-Jabbari, General Relativity and Gravitation 52, 15 (2020).
- Calderón et al. [2021] R. Calderón, R. Gannouji, B. L’Huillier, and D. Polarski, Physical Review D 103, 023526 (2021).
- Akarsu et al. [2020] Ö. Akarsu, J. D. Barrow, L. A. Escamilla, and J. A. Vazquez, Physical Review D 101, 063528 (2020).
- Visinelli et al. [2019] L. Visinelli, S. Vagnozzi, and U. Danielsson, Symmetry 11, 1035 (2019).
- Ye and Piao [2020] G. Ye and Y.-S. Piao, Physical Review D 101, 083507 (2020).
- Yin [2022] W. Yin, Physical Review D 106, 055014 (2022).
- Sen et al. [2023] A. A. Sen, S. A. Adil, and S. Sen, Monthly Notices of the Royal Astronomical Society 518, 1098 (2023).
- Dash et al. [2024] C. B. Dash, T. Guha Sarkar, and A. A. Sen, Monthly Notices of the Royal Astronomical Society 527, 11694 (2024).
- Fan et al. [2002] X. Fan, V. K. Narayanan, M. A. Strauss, R. L. White, R. H. Becker, L. Pentericci, and H.-W. Rix, The Astronomical Journal 123, 1247 (2002).
- Wolfe et al. [2005] A. M. Wolfe, E. Gawiser, and J. X. Prochaska, ARAA 43, 861 (2005), arXiv:astro-ph/0509481 .
- Bagla et al. [2010] J. S. Bagla, N. Khandai, and K. K. Datta, Monthly Notices of the Royal Astronomical Society 407, 567–580 (2010).
- Guha Sarkar et al. [2012] T. Guha Sarkar, S. Mitra, S. Majumdar, and T. R. Choudhury, Monthly Notices of the Royal Astronomical Society 421, 3570–3578 (2012).
- Villaescusa-Navarro et al. [2014] F. Villaescusa-Navarro, M. Viel, K. K. Datta, and T. R. Choudhury, Journal of Cosmology and Astroparticle Physics 2014 (09), 050.
- Storrie-Lombardi et al. [1996] L. J. Storrie-Lombardi, R. G. McMahon, and M. J. Irwin, MNRAS 283, L79 (1996), arXiv:astro-ph/9608147 .
- Peroux et al. [2003] C. Peroux, R. G. McMahon, L. J. Storrie-Lombardi, and M. J. Irwin, MNRAS 346, 1103 (2003), arXiv:astro-ph/0107045 .
- Sarkar et al. [2016b] D. Sarkar, S. Bharadwaj, and S. Anathpindika, Monthly Notices of the Royal Astronomical Society 460, 4310–4319 (2016b).
- Font-Ribera et al. [2018] A. Font-Ribera, P. McDonald, and A. Slosar, Journal of Cosmology and Astroparticle Physics 2018 (01), 003.
- Simpson and Peacock [2010] F. Simpson and J. A. Peacock, Physical Review D 81, 043512 (2010).
- Samushia et al. [2012] L. Samushia, W. J. Percival, and A. Raccanelli, Monthly Notices of the Royal Astronomical Society 420, 2102 (2012).
- Montanari and Durrer [2012] F. Montanari and R. Durrer, Physical Review D 86, 063503 (2012).
- Hu and Sawicki [2007] W. Hu and I. Sawicki, Physical Review D 76, 10.1103/physrevd.76.064004 (2007).
- Dash et al. [2020] C. B. V. Dash, T. G. Sarkar, and A. K. Sarkar, Probing f(r) gravity using the post-reionization hi 21-cm signal (2020), arXiv:2012.07373 [astro-ph.CO] .
- McQuinn et al. [2006] M. McQuinn, O. Zahn, M. Zaldarriaga, L. Hernquist, and S. R. Furlanetto, The Astrophysical Journal 653, 815 (2006).
- Schneider et al. [2005] D. P. Schneider, P. B. Hall, G. T. Richards, D. E. V. Berk, S. F. Anderson, X. Fan, S. Jester, C. Stoughton, M. A. Strauss, and M. SubbaRao, The Astronomical Journal 130, 367 (2005).
- Aghanim et al. [2020] N. Aghanim, Y. Akrami, M. Ashdown, J. Aumont, C. Baccigalupi, M. Ballardini, A. J. Banday, R. B. Barreiro, N. Bartolo, and et al., Astronomy and Astrophysics 641, 6 (2020).
- Hazra et al. [2015] D. K. Hazra, S. Majumdar, S. Pal, S. Panda, and A. A. Sen, Physical Review D 91, 083005 (2015).
- Riess et al. [2022] A. G. Riess, W. Yuan, L. M. Macri, D. Scolnic, D. Brout, S. Casertano, D. O. Jones, Y. Murakami, G. S. Anand, L. Breuval, et al., The Astrophysical journal letters 934, L7 (2022).
- Liu et al. [2014] A. Liu, A. R. Parsons, and C. M. Trott, Phys. Rev. D 90, 023018 (2014), arXiv:1404.2596 [astro-ph.CO] .