Coarsening in Bent-core Liquid Crystals: Intermediate Splay Bend State en route to the Twist Bend Phase
Abstract
We use molecular dynamics simulations to study coarsening dynamics in achiral banana-shaped bent-core liquid crystals following a quench from the high concentration polar smectic (SmX) phase to lower concentrations that favor the exotic twist-bend (TB) phase. Our novel result is the identification of an intermediate splay-bend state emerging prior to the eventual TB phase. The latter coarsens via the annihilation of beta lines which are analogous to string defects in nematic liquid crystals. Our findings are relevant for a large class of chiral systems assembled from achiral entities.
Liquid crystals (LCs) are an intermediate state of matter which combines fluidity with long-range orientational order Stephen and Straley (1974); de Gennes and Prost (1995); Singh (2000); Priestly (2012); Andrienko (2018). They are of huge technological interest for designing devices such as LC displays Chen et al. (2018), and are equally important in fundamental research for studies of topological defects Kleman and Friedel (2008). Rod-shaped molecules are the simplest example of LCs. These exhibit an orientationally ordered low-temperature uniaxial nematic (Nm) phase described by the director . In the past two decades, there has been an intense excitement in this field due to investigations of banana-shaped bent-core liquid crystals (BCLCs). The alteration in shape produces novel phases with fundamentally different properties due to the emergence of polar order Lubensky and Radzihovsky (2002); Ros et al. (2005); Reddy and Tschierske (2006); Takezoe and Takanishi (2006); Etxebarria and Blanca Ros (2008); Jákli et al. (2018) described by the polarization Meyer (1969) [see Fig. (1)(a)].
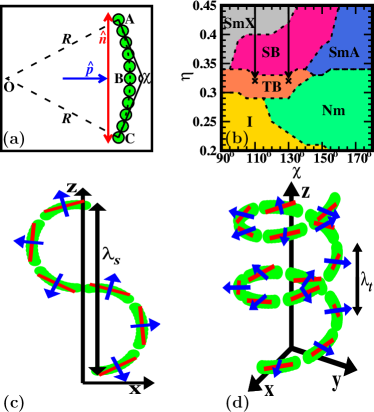
In BCLCs, the uniform Nm phase can become unstable to form modulated nematics. In that case, there arises a bend deformation of the field given by Dozov (2001); Szmigielski (2023). However, a constant field cannot fill space uniformly. The geometrical frustration is then resolved either through formation of (a) a 3- chiral structure with a spontaneous twist called the twist-bend (TB) phase; or (b) a 2- structure with splay distortions termed as the splay-bend (SB) phase (see Fig. 1). These structures were postulated by Meyer in 1973 Meyer (1976) and later by Dozov Dozov (2001). The TB phase is characterized by and . If is the conical angle that the director of a BCLC molecule in the TB phase makes with the helical -axis, then and Shamid et al. (2013). Here, , where is the pitch of the helix. The SB phase has and . The director of a BCLC molecule in the SB structure oscillates in a plane with a maximum angle . We can then express and . Here, , where is the SB wavelength Shamid et al. (2013).
Experimental observations of the SB phase remain rare and are possible only under specific conditions Fernández-Rico et al. (2020); Chiappini and Dijkstra (2021); Kotni et al. (2022). The TB phase was first observed a decade ago in the dimer CB7CB and is one of the most exotic and interesting LC phases Cestari et al. (2011); Chen et al. (2013). The BCLC molecules are achiral but can organize into a (ambidextrous) chiral TB structure, providing a striking example of spontaneous mirror symmetry breaking in a liquid Fujii and Saito (2004); Ruiz-Mirazo et al. (2014); Yashima et al. (2016); Tschierske (2018); Sang and Liu (2022). This milestone discovery led to the rapid development of experimental synthesis methods Henderson and Imrie (2011); Adlem et al. (2013); Borshch et al. (2013); Chen et al. (2013); Mandle et al. (2014a); Sebastián et al. (2014); Mandle et al. (2014b); Chen et al. (2014); Mandle et al. (2015); Gorecka et al. (2015), theoretical models Memmer (2002); Shamid et al. (2013); Greco and Ferrarini (2015); Chiappini et al. (2019); Longa and Tomczyk (2020); Chiappini and Dijkstra (2021); Kubala et al. (2022); Szmigielski (2023) and explorations for technological applications Panov et al. (2017, 2021); Sreenilayam et al. (2022); Kocot et al. (2022); Khatun et al. (2023); Meyer et al. (2023). Investigations in the past decade have primarily focused on understanding equilibrium properties. Non-equilibrium aspects have not been studied, the most fundamental being how SB and TB structures assemble from the BCLC molecules.
In this letter, we address the above gap in the literature. We study the kinetics of phase transitions that occur when the system is rendered thermodynamically unstable by a sudden change of parameters Bray (2002); Puri (2004); Puri and Wadhawan (2009). The subsequent evolution is characterized by the emergence and growth of domains of the preferred phase. The domain growth depends on several factors such as symmetry of the order parameter, conservation laws, hydrodynamic flows, etc. The growth laws convey significant details of the ordering system, and the late-stage kinetics can be explained in terms of the defect dynamics. In this work, we use molecular dynamics (MD) simulations to perform deep quenches of a model BCLC system from a polar smectic (SmX) phase to the TB phase by abruptly changing the concentration of BCLC molecules. This may be experimentally realized by adding/subtracting the solvent. We identify the nature of the defects and study their annihilation to understand the emergence of the chiral phase from achiral building blocks. Our most significant finding is the appearance of an intermediate SB phase that precedes the formation of the stable TB phase at late times. As the system evolves in configuration space so as to minimize its free energy, this suggests that the SB phase constitutes an easily accessible metastable state in the complex free energy landscape of the system.
Our MD simulations utilize a model of a BCLC molecule shown in Fig. 1(a). It is constructed from eleven spherical beads (of mass and diameter ) rigidly fixed with respect to one another, and evenly spaced along a circular arc with center and radius Greco and Ferrarini (2015); Kubala et al. (2022). From the center of the terminating beads A and C, tangents are constructed which intersect at an angle , an inverse measure of the structural bend. The two ordering directions for the BCLCs are and . Beads on different molecules interact via the Weeks-Chandler-Andersen (WCA) potential Weeks et al. (1971); Chandler et al. (1983). The emergence of different LC phases depends on the bend angle () and the concentration or packing fraction of beads (). A rich phase diagram was presented earlier in Kubala et al. (2022). Fig. 1(b) depicts an adapted schematic (CC BY 4.0). The schematics in Figs. 1(c) and (d) show the arrangement of the BCLCs in the SB and TB structures, respectively.
The MD simulations are performed in the constant ensemble using LAMMPS Plimpton (1995); Lam . molecules are simulated in a periodic cubic box of size (all lengths are in units of ). The equations of motion are integrated using the rigid body algorithm Kamberaj et al. (2005), and the system temperature is maintained constant via the Nosé-Hoover thermostat Martyna et al. (1992). The quenches indicated in Fig. 1(b) are from the SmX phase () to the TB phase () for and . In the initial state , the BCLC molecules are arranged on a lattice with parallel to the axis. The polarization of all molecules is co-aligned in a randomly selected direction. We then allow the system to evolve in time. All statistical measures have been averaged over 15 independent initial conditions with random choice of .
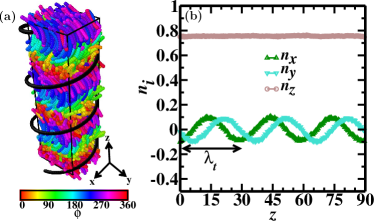
We also perform a reference simulation with 3200 BCLC molecules in a box elongated along the -axis (), setting it as the helical axis. It is relatively easy to drive this small system to the equilibrium TB phase. The resultant configuration is shown in Fig. 2(a). We determine the TB properties: from the period of the averaged and components of ; and from the corresponding component [see Fig. 2(b)]. The values are: () = (30,) for , and (45,) for . These values will be used later to evaluate the Ginzburg-Landau (GL) values for the magnitudes of and , using the definitions mentioned earlier.
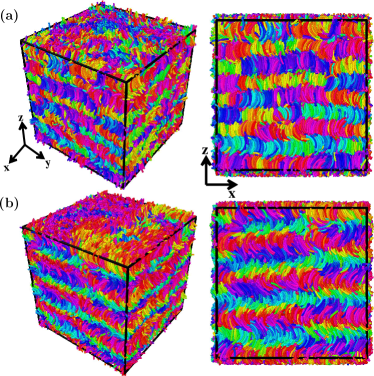
Now, let us show results from our domain growth studies, performed in a cubic box. In Fig. 3, we present evolution snapshots for at time (in units of MD time-steps) (a) and (b) . The corresponding cross-sections at are presented alongside. The BCLCs are color-coded as in Fig. 2(a). The evolution demonstrates the development of helical order along the -axis. In Fig. 3(a), periodic modulations have developed along the -axis. The layers with alternating colors shown in Fig. 3(b) correspond to S-shaped SB structures. The late-time morphology in Fig. 3(b) with continuously changing indicates the development of helical order characteristic of the TB structure [cf. Fig. 2(a)].
To quantify the structural evolution, we evaluate the longitudinal (parallel) orientational correlations of , and chirality . The last of these captures the handedness of the helical organization of the BCLCs Stone (1978); Greco and Ferrarini (2015); Kubala et al. (2022). These are defined as: (i) ; (ii) ; and (iii) , respectively. Here, is the intermolecular separation along the helical axis. Further, , where is the separation between the and molecules along the helical axis.
In Fig. 4, we show (a) vs. , (b) vs. , (c) vs. for at 3 -values. Let us first focus on Figs. 4(a)-(b). The initial condition () corresponds to the SmX phase with . At early times (), both and develop oscillations about a non-zero average. For intermediate times (), the oscillations grow and become characteristic of the SB phase (see Fig. 3(a)) Kubala et al. (2022). Finally, for late times (), the system has relaxed into the TB phase (see Fig. 3(b)) with large-amplitude oscillations which are damped with distance. (In a perfect TB phase, the correlations do not decay with distance.) The periodicity of these oscillations ( in Figs. 3(a)-(b)) determines the pitch of the TB phase. Notice that the -field reflects helical order earlier than the -field. We have also obtained similar data for (not shown here). The evolution to the TB phase is considerably faster in that case.
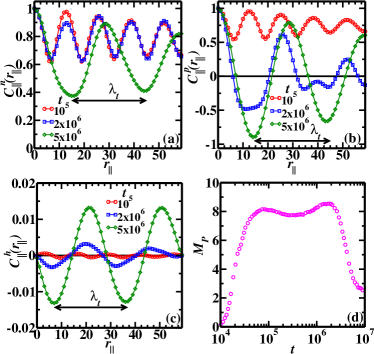
The correlation function vs. , which is a measure of chirality, is shown in Fig. 4(c). In contrast to and , it has been evaluated from a single morphology as the handedness of the emerging helix needs to be retained. The system is initially achiral since the correlations are negligible for . Periodic variations build up as time evolves, capturing the development of chirality that is characteristic of the TB phase. Note that the data in Fig. 4(c) indicates a left-handed helix, and an opposite sign will be obtained for a right-handed helix.
To confirm the intermediate SB phase, we define an order parameter . From the definitions of for the SB and TB phases, should be positive in the SB phase and zero in the TB phase. Fig. 3(d) shows vs. for . In accord with the results of Figs. 4(a)-(c), indeed exhibits a sharp drop near , confirming that the SmX-TB kinetic transformation traverses an intermediate SB state. As mentioned earlier, this result is the principal finding of our study.
To better elucidate the coarsening behavior, it is crucial to understand the nature of defects whose annihilation gives rise to domain growth. In the TB phase, the dominant defects are the beta lines that correspond to regions where the bend field Binysh et al. (2020). To identify them, we coarse-grain the evolution snapshots by dividing the simulation box into a simple cubic lattice of overlapping sub-boxes of size each. The center of each sub-box defines a lattice site with a director , which is an average over all BCLCs with centers in the sub-box. As the boxes are overlapping, the size of the coarse-grained lattice is also . The advantage of coarse-graining is that it reduces fluctuations in the system, and is analogous to a numerical renormalization group procedure.
The derivatives of , which are numerically approximated using the central-difference method with accuracy of order 8, are used to obtain the and fields at each lattice site. Figs. 5(a)-(b) show the -field for the snapshots in Fig. 3. The beta lines
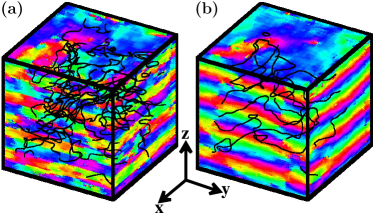
are shown in black and their density decreases as coarsening proceeds. In the TB phase, . This anisotropic form results in modulations along the helical -axis and uniformity in the planes perpendicular to it. Fig. 5(b) captures this feature in the form of colored stripes that repeat in the -direction. With time, the helical ordering grows and the beta lines annihilate. On the time-scales of our simulation, the beta lines do not exhibit marked anisotropy. They are reminiscent of vortex strings in 3- liquid crystals or the XY model.
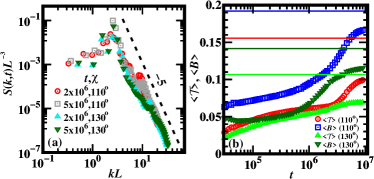
What will be the signatures of these defects in coarsening experiments? Small-angle scattering experiments measure the structure factor , where is the wave vector of the scattered beam Puri (2004); Puri and Wadhawan (2009). If the ordering system is characterized by a single length scale , the structure factor obeys dynamical scaling: , where is a scaling function. The nature of the defects can be interpreted from the tail of the structure factor. Continuous spin models exhibit the generalized Porod law, with the asymptotic form: Porod et al. (1982); Oono and Puri (1988); Bray and Puri (1991). For , the defects are interfaces, and the corresponding scattering function exhibits the usual Porod law: . For , the different topological defects are vortices (), strings () and monopoles or hedgehogs ().
As the coarsening in the field is driven by isotropic vortex strings, we expect the corresponding structure factor to behave as at large . In Fig. 6(a), we show a scaling plot of the structure factor: vs. at 2 times for . The length scale is defined as the inverse of the first moment of . The scaled data sets show a reasonable collapse, confirming dynamical scaling. Moreover, the structure factor tail is consistent with the expected Porod tail. For completeness, the spatial averages of and (denoted as and ) are shown in Fig. 6(b). The horizontal lines denote the corresponding GL values of and . Not surprisingly, the GL mean-field values of these quantities Shamid et al. (2013) overestimate our simulation results (which include fluctuations).
To conclude, we have performed extensive MD simulations in to study phase transition kinetics in BCLCs. This system is a liquid with achiral constituents, but exhibits remarkable phases. These include the achiral S-shaped planar SB phase and the (chiral) helical TB phase. We have focused on understanding the emergence of the exotic TB phase by monitoring the coarsening dynamics after a concentration quench from the SmXTB phase. Our unexpected finding is that this transition occurs through an intermediate SB structure. The spontaneous formation of a metastable phase preceding the emergence of the stable phase during spinodal decomposition has been observed in many experiments in the last decade. It is generic to the phase ordering kinetics associated with the recently introduced landscape-inversion phase transitions Alert et al. (2014, 2016). We characterize the dynamic pathway SmX SB TB via appropriate correlation functions and structure factors. The dominant defects observed in the TB phase, the beta lines, are analogous to string defects in NmLCs Birdi et al. (2021, 2022). Their signature is a generalized Porod decay in the relevant structure factor: .
We expect that the framework developed for studying BCLCs, along with our novel numerical results, will be important for a large class of systems with helical order. Experimental work on the chiral phases of BCLCs is limited. We hope that the current work will inspire and motivate further experimental studies of this system with its rich variety of equilibrium and non-equilibrium phenomena.
Acknowledgments: NB acknowledges UGC, India for a senior research fellowship. VB acknowledges partial financial support from SERB India via a research grant. NB and VB gratefully acknowledge the High Performance Computing (HPC) facility at IIT Delhi for computational resources.
References
- Stephen and Straley (1974) M. J. Stephen and J. P. Straley, Rev. Mod. Phys. 46, 617 (1974).
- de Gennes and Prost (1995) P. G. de Gennes and J. Prost, The Physics of Liquid Crystals (Oxford: Oxford University Press, 1995).
- Singh (2000) S. Singh, Physics Reports 324, 107 (2000).
- Priestly (2012) E. Priestly, Introduction to Liquid Crystals (Springer, 2012).
- Andrienko (2018) D. Andrienko, Journal of Molecular Liquids 267, 520 (2018).
- Chen et al. (2018) H.-W. Chen, J.-H. Lee, B. Y. Lin, S. Chen, and S. T. Wu, Light: Sci. Appl. 7, 17168 (2018).
- Kleman and Friedel (2008) M. Kleman and J. Friedel, Rev. Mod. Phys. 80, 61 (2008).
- Lubensky and Radzihovsky (2002) T. C. Lubensky and L. Radzihovsky, Phys. Rev. E 66, 031704 (2002).
- Ros et al. (2005) M. B. Ros, J. L. Serrano, M. R. de la Fuente, and C. L. Folcia, J. Mater. Chem. 15, 5093 (2005).
- Reddy and Tschierske (2006) R. A. Reddy and C. Tschierske, J. Mater. Chem. 16, 907 (2006).
- Takezoe and Takanishi (2006) H. Takezoe and Y. Takanishi, Japanese Journal of Applied Physics 45, 597 (2006).
- Etxebarria and Blanca Ros (2008) J. Etxebarria and M. Blanca Ros, J. Mater. Chem. 18, 2919 (2008).
- Jákli et al. (2018) A. Jákli, O. D. Lavrentovich, and J. V. Selinger, Rev. Mod. Phys. 90, 045004 (2018).
- Meyer (1969) R. B. Meyer, Phys. Rev. Lett. 22, 918 (1969).
- Kubala et al. (2022) P. Kubala, W. Tomczyk, and M. Cieśla, Journal of Molecular Liquids 367, 120156 (2022).
- Dozov (2001) I. Dozov, Europhysics Letters 56, 247 (2001).
- Szmigielski (2023) M. Szmigielski, Soft Matter 19, 2675 (2023).
- Meyer (1976) R. B. Meyer, in Molecular Fluids, edited by R. Balian and G. Weil (Gordon and Breach, New York, 1976) pp. 271–343.
- Shamid et al. (2013) S. M. Shamid, S. Dhakal, and J. V. Selinger, Phys. Rev. E 87, 052503 (2013).
- Fernández-Rico et al. (2020) C. Fernández-Rico, M. Chiappini, T. Yanagishima, H. de Sousa, D. G. A. L. Aarts, M. Dijkstra, and R. P. A. Dullens, Science 369, 950 (2020).
- Chiappini and Dijkstra (2021) M. Chiappini and M. Dijkstra, Nature Communications 12, 2157 (2021).
- Kotni et al. (2022) R. Kotni, A. Grau-Carbonell, M. Chiappini, M. Dijkstra, and A. van Blaaderen, Nature Communications 13, 7264 (2022).
- Cestari et al. (2011) M. Cestari, S. Diez-Berart, D. A. Dunmur, A. Ferrarini, M. R. de la Fuente, D. J. B. Jackson, D. O. Lopez, G. R. Luckhurst, M. A. Perez-Jubindo, R. M. Richardson, J. Salud, B. A. Timimi, and H. Zimmermann, Phys. Rev. E 84, 031704 (2011).
- Chen et al. (2013) D. Chen, J. H. Porada, J. B. Hooper, A. Klittnick, Y. Shen, M. R. Tuchband, E. Korblova, D. Bedrov, D. M. Walba, M. A. Glaser, J. E. Maclennan, and N. A. Clark, Proceedings of the National Academy of Sciences 110, 15931 (2013).
- Fujii and Saito (2004) N. Fujii and T. Saito, The Chemical Record 4, 267 (2004).
- Ruiz-Mirazo et al. (2014) K. Ruiz-Mirazo, C. Briones, and A. de la Escosura, Chemical Reviews 114, 285 (2014).
- Yashima et al. (2016) E. Yashima, N. Ousaka, D. Taura, K. Shimomura, T. Ikai, and K. Maeda, Chemical Reviews 116, 13752 (2016).
- Tschierske (2018) C. Tschierske, Liquid Crystals 45, 2221 (2018).
- Sang and Liu (2022) Y. Sang and M. Liu, Chem. Sci. 13, 633 (2022).
- Henderson and Imrie (2011) P. A. Henderson and C. T. Imrie, Liquid Crystals 38, 1407 (2011).
- Adlem et al. (2013) K. Adlem, M. Čopič, G. R. Luckhurst, A. Mertelj, O. Parri, R. M. Richardson, B. D. Snow, B. A. Timimi, R. P. Tuffin, and D. Wilkes, Phys. Rev. E 88, 022503 (2013).
- Borshch et al. (2013) V. Borshch, Y.-K. Kim, J. Xiang, M. Gao, A. Jákli, V. P. Panov, J. K. Vij, C. T. Imrie, M. G. Tamba, G. H. Mehl, and O. D. Lavrentovich, Nature Communications 4, 2635 (2013).
- Mandle et al. (2014a) R. J. Mandle, E. J. Davis, C. T. Archbold, S. J. Cowling, and J. W. Goodby, J. Mater. Chem. C 2, 556 (2014a).
- Sebastián et al. (2014) N. Sebastián, D. O. López, B. Robles-Hernández, M. R. de la Fuente, J. Salud, M. A. Pérez-Jubindo, D. A. Dunmur, G. R. Luckhurst, and D. J. B. Jackson, Phys. Chem. Chem. Phys. 16, 21391 (2014).
- Mandle et al. (2014b) R. J. Mandle, E. J. Davis, S. A. Lobato, C.-C. A. Vol, S. J. Cowling, and J. W. Goodby, Phys. Chem. Chem. Phys. 16, 6907 (2014b).
- Chen et al. (2014) D. Chen, M. Nakata, R. Shao, M. R. Tuchband, M. Shuai, U. Baumeister, W. Weissflog, D. M. Walba, M. A. Glaser, J. E. Maclennan, and N. A. Clark, Phys. Rev. E 89, 022506 (2014).
- Mandle et al. (2015) R. J. Mandle, E. J. Davis, C. T. Archbold, C. C. A. Voll, J. L. Andrews, S. J. Cowling, and J. W. Goodby, Chemistry – A European Journal 21, 8158 (2015).
- Gorecka et al. (2015) E. Gorecka, N. Vaupotič, A. Zep, D. Pociecha, J. Yoshioka, J. Yamamoto, and H. Takezoe, Angewandte Chemie International Edition 54, 10155 (2015).
- Memmer (2002) R. Memmer, Liquid Crystals 29, 483 (2002).
- Greco and Ferrarini (2015) C. Greco and A. Ferrarini, Phys. Rev. Lett. 115, 147801 (2015).
- Chiappini et al. (2019) M. Chiappini, T. Drwenski, R. van Roij, and M. Dijkstra, Phys. Rev. Lett. 123, 068001 (2019).
- Longa and Tomczyk (2020) L. Longa and W. Tomczyk, The Journal of Physical Chemistry C 124, 22761 (2020).
- Panov et al. (2017) V. P. Panov, J. K. Vij, and G. H. Mehl, Liquid Crystals 44, 147 (2017).
- Panov et al. (2021) V. P. Panov, J.-K. Song, G. H. Mehl, and J. K. Vij, Crystals 11 (2021).
- Sreenilayam et al. (2022) S. P. Sreenilayam, N. Yadav, Y. P. Panarin, G. Shanker, and J. K. Vij, Journal of Molecular Liquids 351, 118632 (2022).
- Kocot et al. (2022) A. Kocot, B. Loska, Y. Arakawa, and K. Merkel, Phys. Rev. E 105, 044701 (2022).
- Khatun et al. (2023) N. Khatun, V. Sridurai, K. F. Csorba, and G. G. Nair, J. Mater. Chem. C 11, 9686 (2023).
- Meyer et al. (2023) C. Meyer, P. Davidson, G. R. Luckhurst, I. Dokli, A. Knežević, A. Lesac, D. A. Paterson, R. Walker, J. M. D. Storey, C. T. Imrie, and I. Dozov, Crystals 13 (2023).
- Bray (2002) A. J. Bray, Advances in Physics 51, 481 (2002).
- Puri (2004) S. Puri, Phase Transitions 77, 407 (2004).
- Puri and Wadhawan (2009) S. Puri and V. Wadhawan, Kinetics of phase transitions (CRC Press, Boca Raton, 2009).
- Weeks et al. (1971) J. D. Weeks, D. Chandler, and H. C. Andersen, The Journal of Chemical Physics 54, 5237 (1971).
- Chandler et al. (1983) D. Chandler, J. D. Weeks, and H. C. Andersen, Science 220, 787 (1983).
- Plimpton (1995) S. Plimpton, Journal of Computational Physics 117, 1 (1995).
- (55) https://lammps.sandia.gov.
- Kamberaj et al. (2005) H. Kamberaj, R. J. Low, and M. P. Neal, The Journal of Chemical Physics 122, 224114 (2005).
- Martyna et al. (1992) G. J. Martyna, M. L. Klein, and M. Tuckerman, The Journal of Chemical Physics 97, 2635 (1992).
- Stone (1978) A. Stone, Molecular Physics 36, 241 (1978).
- Binysh et al. (2020) J. Binysh, J. Pollard, and G. P. Alexander, Phys. Rev. Lett. 125, 047801 (2020).
- Porod et al. (1982) G. Porod, O. Glatter, and O. Kratky, by O. Glatter and O. Kratky, Academic Press, London , 17 (1982).
- Oono and Puri (1988) Y. Oono and S. Puri, Mod. Phys. Lett. B 2, 861 (1988).
- Bray and Puri (1991) A. J. Bray and S. Puri, Phys. Rev. Lett. 67, 2670 (1991).
- Alert et al. (2014) R. Alert, J. Casademunt, and P. Tierno, Phys. Rev. Lett. 113, 198301 (2014).
- Alert et al. (2016) R. Alert, P. Tierno, and J. Casademunt, Nature communications 7, 13067 (2016).
- Birdi et al. (2021) N. Birdi, V. Banerjee, and S. Puri, Europhysics Letters 132, 66002 (2021).
- Birdi et al. (2022) N. Birdi, T. L. Underwood, N. B. Wilding, S. Puri, and V. Banerjee, Phys. Rev. E 105, 024706 (2022).