Date of publication xxxx 00, 0000, date of current version xxxx 00, 0000. 10.1109/ACCESS.2023.0322000
“This research has received funding from the European Union’s Horizon 2020 research and innovation program under the Marie Sokolowski-Curie grant agreement No 813114. A part of the data for this study was retrieved from the ESFRI AnaEE platform Antwerp FATI supported by the FWO IRI project I000223N.”
Corresponding author: Priyesh Pappinisseri Puluckul (e-mail: priyesh.pappinisseripuluckul@uantwerpen.be).
Harvesting Energy from Soil-Air Temperature Differences for Batteryless IoT Devices: A Case Study
Abstract
The temperature difference between soil and air holds the potential to generate energy to power many low-power IoT devices. However, there is a lack of studies in the literature that explore the nuances of soil-air thermal energy harvesting. This paper offers a comprehensive discussion on soil-air thermal energy harvesting. We engineer a custom Soil-air Thermoelectric Generator (SoTEG) that incorporates an off-the-shelf TEG and an efficient heat transfer network. A detailed discussion of the design and analysis of SoTEG is presented along with a versatile simulation model which can be used to simulate the performance of the harvester under different ambient conditions. Investigations using the model and results gathered from experiments demonstrate that the SoTEG has a heat transfer efficiency of % with room for improvement and can power a load from temperature differences as low as between soil and air, or across the TEG. Power generated by SoTEG at difference amounts to or a power density of . When connected to a Power Management Unit (PMU), the combined system generates around at . During a 14-day outdoor deployment in a winter month, the maximum power generated by the combined system is when the temperature difference across the TEG is . Additionally, the model analysis reveals that the weather conditions have an impact on the harvester. While Solar radiation enhances power generation, wind can either improve or diminish the harvested energy depending on whether it is day or night.
Index Terms:
Energy Harvesting, Internet of Batteryless Things, Soil Thermal Energy, Sustainability, Thermal Energy, Thermoelectric Generators.=-21pt
I Introduction
The discourse on sustainability has become increasingly prominent, urging people to embrace green and sustainable alternatives [1]. Often in sustainability conversations, the issue of discarded batteries from the Internet of Things (IoT) consistently receives attention. The seamless and dependable functioning of any IoT device hinges upon a single factor- energy source. Conventional Internet of Things (IoT), powered by batteries, contributes tons of batteries dumped to the Earth every day [2]. They are not sustainable and face limited lifetime issues which hinder their widespread adoption. In response to address these issues, the concept of Energy Harvesting (EH) in conjunction with Internet of Batteryless Things (IoBT) emerged. By scavenging energy from naturally present sources and storing it in alternate energy buffers like supercapacitors, IoBT leads to energy-autonomous systems.
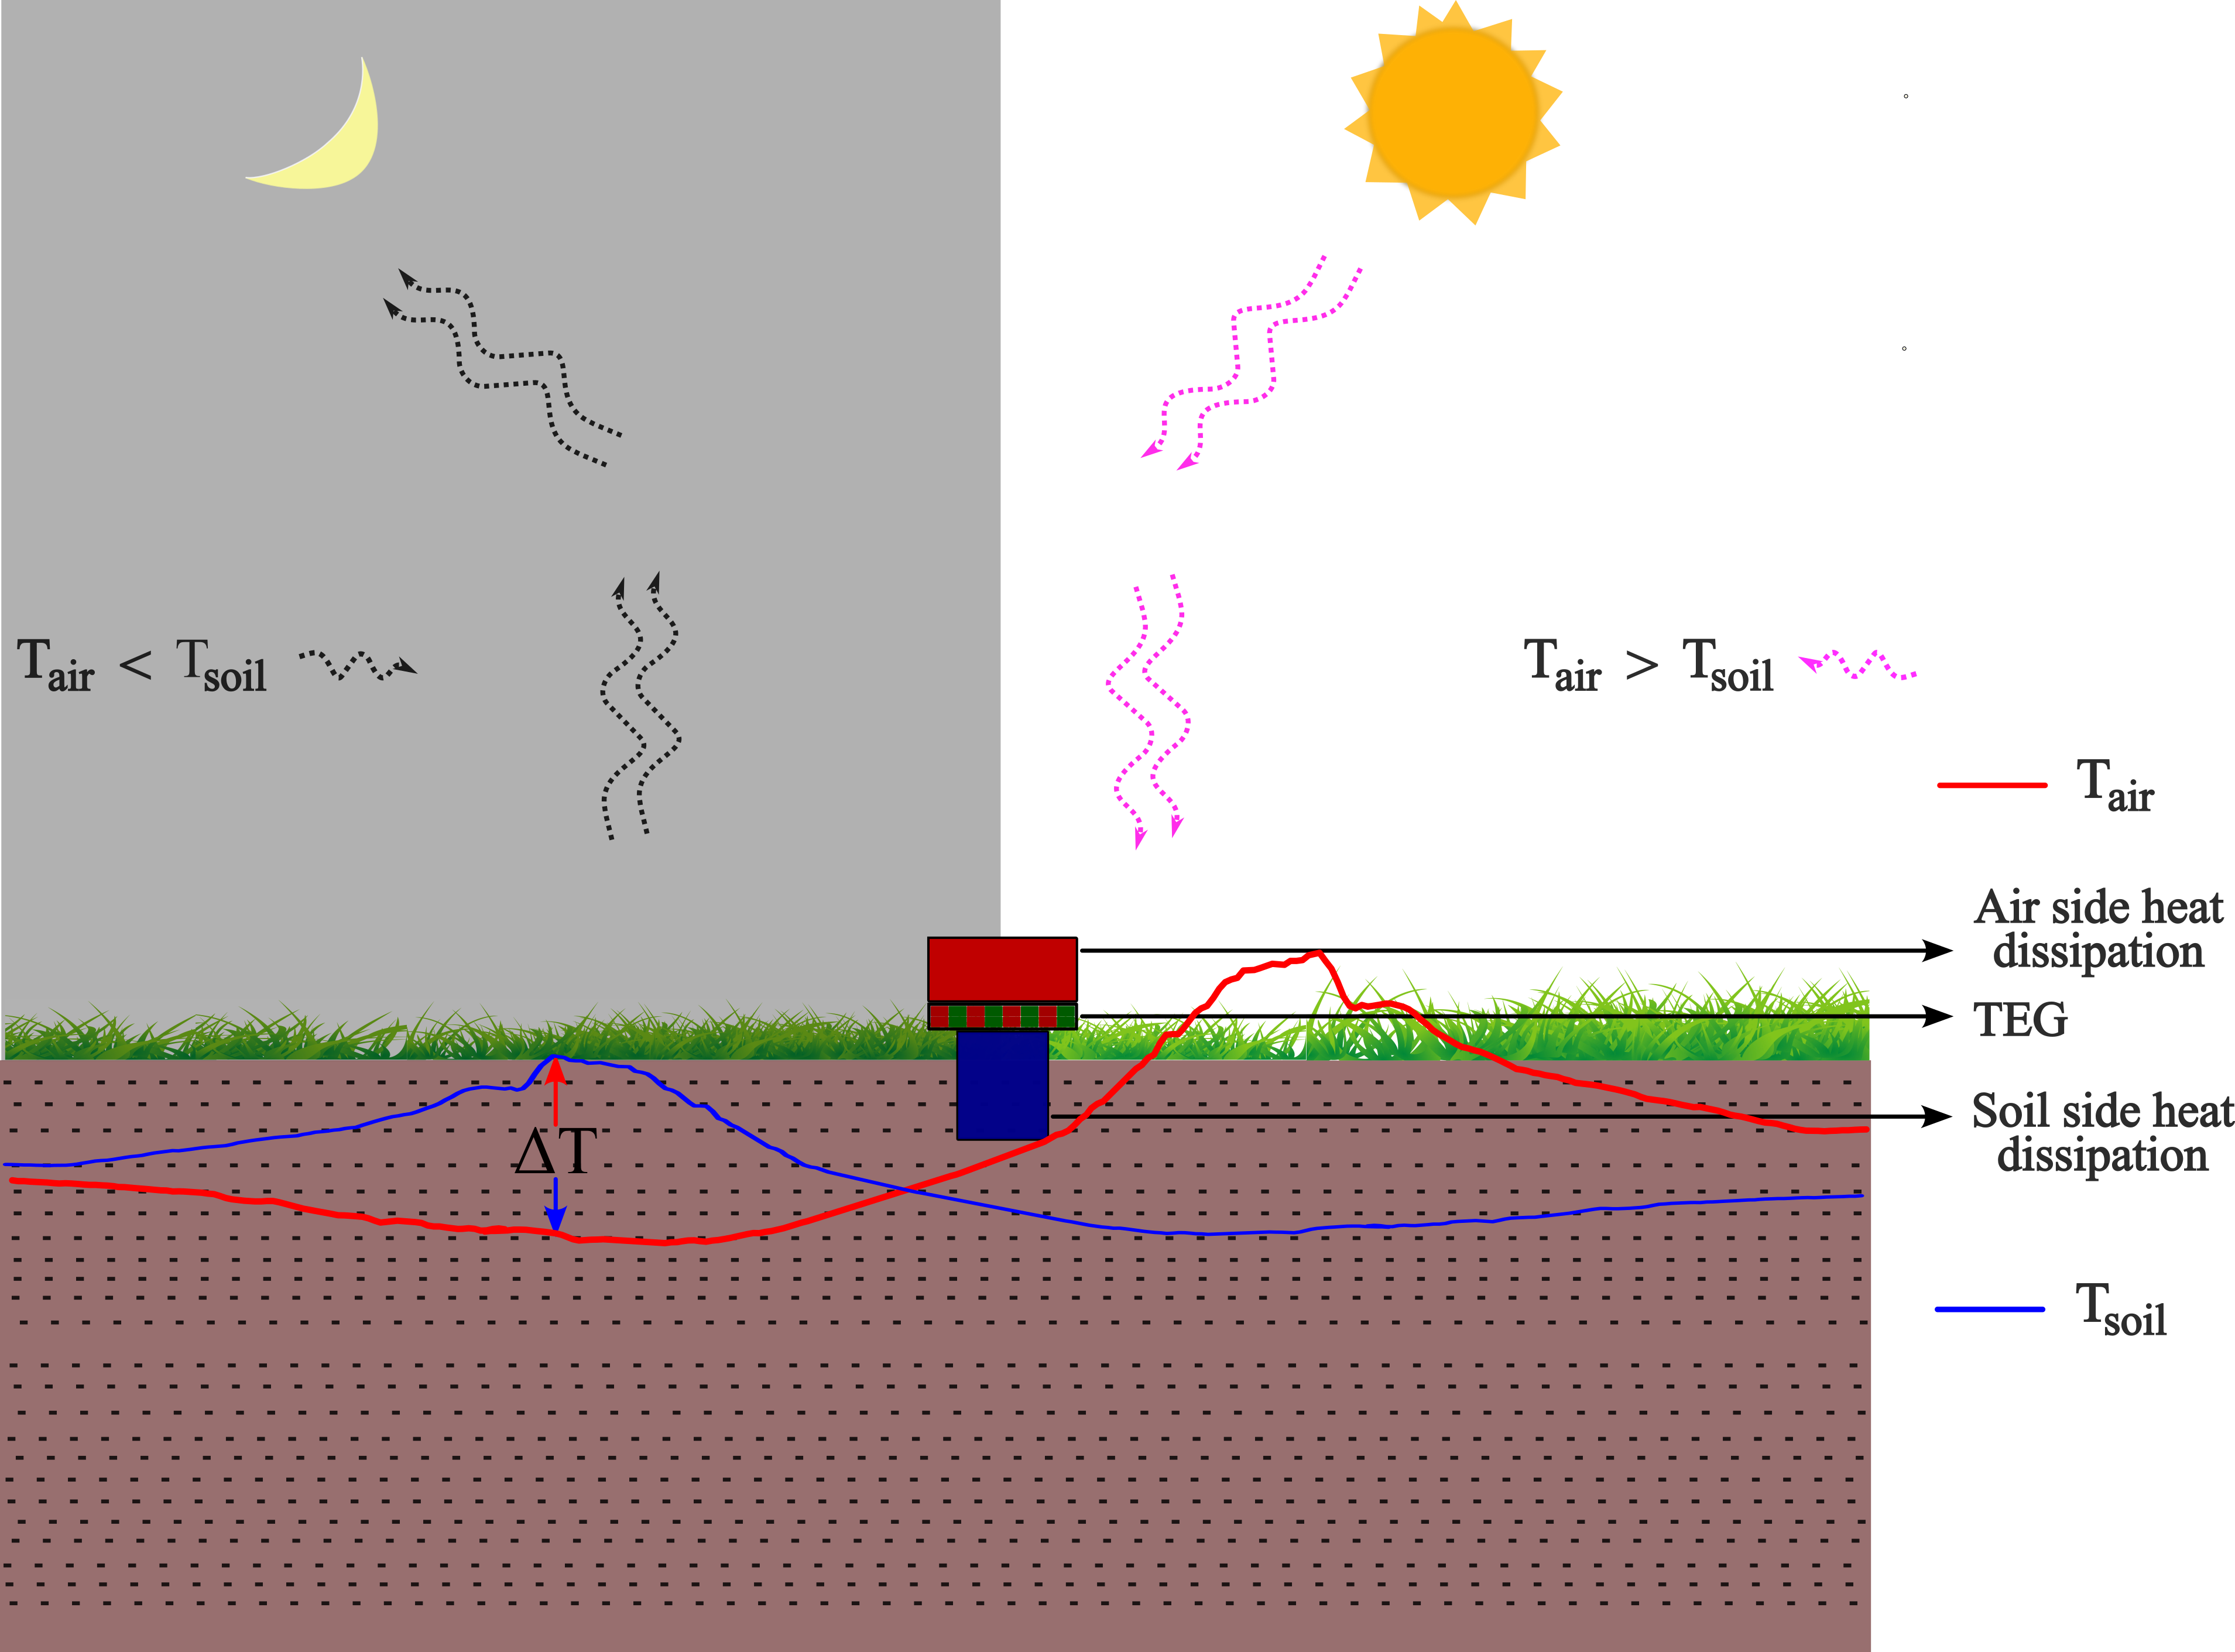
IoBT deployments in many scenarios can be powered by scavenging energy from thermal energy sources, employing an energy converter, often a TEG, that can transduce temperature differences into electrical energy. In any deployment where temperature differences are present, thermal energy harvesting may be considered. There is a plethora of works available in the literature that discuss thermal energy harvesting in the context of IoT and IoBT. However, a major concern with thermal energy harvesting is its poor efficiency, especially at low-temperature differences [3]. As a result, a primary focus within thermal energy harvesting has been on utilizing sources with high thermal energy, such as in industrial manufacturing environments [4]. Consequently, many naturally occurring low-grade thermal energy sources remained untapped. Among these, soil thermal energy stands as a significant example. Due to the distinct thermal properties of the soil and air, the soil temperature variations lag behind the air temperature, leading to a persistent temperature difference between both[5, 6]. Thus, the soil will be relatively cooler than the air in the daytime and warmer in the nighttime. As a result, the soil can act as a heat sink during the day, collecting the heat produced by solar radiation, and as a heat source in the night, dissipating the stored heat to the atmosphere [7]. This temperature difference is a naturally occurring phenomenon and can be extracted using a TEG by providing an efficient heat conduction path through the air, soil and TEG as depicted in Fig. 1. In contrast to solar energy which is the de facto standard for outdoor IoT deployments, the heat energy from the soil remains available even in the night, making it a viable choice for many low-power sensing systems.
This paper is an attempt to fill the void of literature that examines the technicalities and practical considerations of building soil-air thermal energy harvesters. In this paper, we present a detailed discussion of the design of a custom Soil-Air Thermoelectric Generator (SoTEG)prototype and an in-depth analysis of its properties and performance. To make the assessment and customization of the Soil-Air Thermoelectric Generator (SoTEG) easy, a model that effectively captures the relation between different environmental parameters and the output power of the SoTEG is developed. We further perform experiments with the prototype in the lab as well as on the field to examine its performance. Different meteorological data along with the power and temperature profile of the SoTEG are collected and analysed to understand its performance in real-world conditions. Along with that, an in-depth analysis of the parameters influencing the performance and efficiency of SoTEG is addressed, which will allow the research community to customize and improve the prototype to their need.
The remainder of this paper is organised as follows. A discussion of existing works on thermal energy harvesting using soil-air temperature differences is presented in Section II. The design and modelling of the energy harvester are discussed in Section III. Details of different components and their thermal properties are discussed in this section along with a one-dimensional heat transfer model. Experiments conducted in the lab and on the field to assess the performance of the models and prototype are elaborated in Section IV. A detailed data set collected from outdoor experiments that includes, harvested power, temperature, precipitation, wind speed and irradiance is explored in this section. A discussion on the primary factors influencing the performance of SoTEG is illustrated in Section V. This section explores in detail the impact of the efficiency of Power Management Unit (PMU), thermal resistance, weather conditions and cost per watt on the performance of the SoTEG along with a short note on the future research directions. Finally, the conclusions of this research are presented in Section VI.
II Related Work
Numerous prior studies have tried to harness thermal energy from soil and air temperature differences to generate electricity or to power IoT devices. One of the earliest works available in this area is presented in [8] where the author investigated the performance of heat sinks when exposed to ambient air and buried in soil. The primary objective of the research was to derive methods to predict the thermal conductance of a given heat sink when buried in soil. To accomplish this, the author used 5 different heat sinks, out of which four were buried in soil and one exposed to ambient air. Instead of a TEG, a dummy of the TEG made using brass was used in the experiments. Further, shape factor analysis was used to predict the thermal conductance of the heat sink buried in soil and air. The predicted values match roughly with the actual values. The author claims that this prediction method can be used to give a rough estimate of the upper bound for the heat sink performance when buried in the soil.
The feasibility of using diurnal heat flow in the upper soil layer to design a Thermoelectric Power Source (TPS) which generates output levels similar to a battery is investigated by Whalen et al. [9]. The TPS uses four Bisumth-Telluroid based TEG modules connected thermally in parallel and electrically in series and installed between cold and hot plates of . At , the fabricated TPS could generate of power. The authors conducted outdoor experiments between June 2009 and June 2010 and the average power generated during this duration was . Further, the maximum peak power produced was at an output voltage of . In addition, the authors observed that approximately % of energy was generated between and when the surface temperature was higher than the air temperature.
The research reported in [10] discusses the factors affecting the performance of ground-air thermoelectric generators. Similar to the work reported in [8], research presented in [10] focused on the influence of heat sink on the overall performance of the system. The author performed a 25-day long field experiment in May 2012 with two different types of heat exchangers, one with a finned heat sink and the other with an un-finned heat sink. Two commercial heat sinks were mounted thermally in series between an air-side and a soil-side heat exchanger of the same kind. The addition of an extra module was expected to improve the performance by % over a single module design. From the experiment results, the author claims that the un-finned version produced an average power of and the finned version produced an average power of . Additionally, solar radiation had a significant impact on the output of the harvester and might be responsible for more than half of the energy production. Consequently, % of power was generated between and for the finned and % for the un-finned. Likewise, % and % of the total energy were produced between and for the finned and un-finned types, respectively.
A feasibility analysis of soil thermal energy using a long-term data set of soil temperature at different depths is conducted by Pullwitt et al. in [11]. The authors collected temperature data from eight different soil depths at a location in Northern Germany for a year. Analysis based on this empirical data shows an increase in soil temperature with an increase in depth. However, after certain depths, the influence of soil depth on temperature delta becomes minimal. The authors observe that the increase in temperature delta is only % from to . Using the temperature data and an end-to-end simulation model, the authors analyzed the feasibility of powering a wireless sensor node using soil thermal energy. While the simulation demonstrated satisfactory performance in hotter periods of the year, a considerable packet drop was reported in winter due to reduced air and soil temperatures. The recent investigations from the same author discuss the design of a soil-air thermal energy-powered device [12] and data from long-term deployments [13].
In [14], Carvalhaes-Dias et al. make similar observations as in [11] about the influence of depth on energy output. They report that the energy generated was the same for soil depths of and in summer. However, during the winter months, depth generated a relatively higher energy than . Furthermore, they investigated the influence of geographic locations on the performance of harvesters by conducting experiments at two different latitudes, one in Brazil and the other in Spain. The authors report that the energy harvested in 32 winter days in Brazil is equal to % of the total energy harvested during 205 days in Spain. They further claim that by increasing the depth of installation to in higher latitude areas, their system with a buried heat sink can harvest energy even when the ambient air is at .
Another study reported by Huang et al. investigates soil thermal energy harvesting in a forest environment [15]. Similar to many previous studies, the authors use a TEG mounted between a heat guide and an air-side heat exchanger. The heat guide is made of stainless steel and filled with salt water. However, contrary to other harvesters presented in the literature, they use the temperature difference available between air and soil at a depth of . During a 6-month long experiment, the harvester could scavenge energy in a single day with a peak power of recorded when the temperature difference across the TEG was , which corresponds to between the air and soil.
Not many works are available in the literature discussing the practical deployment of sensor nodes powered by soil-air thermal energy harvesting. The only two real-life long-term deployments to our knowledge are discussed in [16] and [17]. In [16], Sigrist et al. used a harvester with a commercial TEG mounted between a radiator of and a copper rod of . The use of a radiator allows for exploiting solar absorption in the daytime and heat emission in the nighttime, leading to an increase in the amount of heat energy collected by the system. Additionally, they developed an indigenous circuit to rectify the small bipolar voltage from TEG. An end-to-end simulation model of the harvester is presented. The authors claim a peak power of in the day and in the night for the long-term deployment. While the authors have not provided any specific details about the temperature difference corresponding to the peak power, from the graphs presented, we estimate the temperature difference corresponding to peak daytime power to be around .
Unlike the harvester presented by Sigrist et al. [16], the harvester developed by Ikeda et al. uses a cooper rod as the heat guide and a heat sink at the ambient side as to dissipate heat [17]. The harvesters combined with a batteryless device were deployed at three different locations, three in Japan and one in India. Based on the data obtained from the deployments, authors postulate that their prototype could harvest to .
Harvesting energy from a geothermally active area surrounding a volcano which, can be considered as a special case of soil thermal energy harvesting is demonstrated by Catalan et al. in [18]. The average power generated during the experiment is reported to be at an average temperature difference of and a nearly constant geothermal temperature of .
The latest studies in the area of soil thermal energy harvesters rely on technologies such as passive radiative cooling to augment the performance of soil-air thermal energy harvesters. Passive radiative cooling can reduce the temperature of materials below ambient air by radiating energy to the outer space through the transparency window of the atmosphere between and . Since the temperature of outer space is extremely low, around , the outer space can be a very efficient heat sink [7]. Therefore, by using custom-designed radiators with selective emissivity in the atmospheric window, the radiator can be cooled down many degrees Celsius below the ambient temperature. Such a system can create a high-temperature gradient between the radiator and soil at night, considerably increasing the energy output. A proof of concept work that demonstrates the applicability of radiative cooling in soil thermal energy harvesting is illustrated in [7]. The harvester uses a selective emitter-absorber at the ambient side and a heat sink at the soil side. While the selective emitter-absorber increases the temperature delta by absorbing solar radiation during the day, at night, it emits radiation through the atmospheric window to enhance the temperature gradient. The authors claim that the harvester archives a peak power density of () at night and () in the daytime.
Subsequently, there came many investigations utilizing the concept of passive radiative cooling to generate energy, with a major portion of these studies trying to improve nighttime energy generation [19, 20]. However, a significant challenge in exploiting radiative cooling with soil and outer space as the heat sink is the development of a radiator with selective emissivity/absorptivity. To ensure maximum heat collection during the day, the radiator should have a very high absorptivity and low emissivity in the solar spectrum. Whereas at night, the radiator must dissipate maximum heat through the atmospheric window which requires high emissivity in the atmospheric window.
Despite a plethora of works available in scientific literature, we have observed a lack of a standard and comprehensive understanding of soil-air thermal energy harvesting. Much of the existing literature focuses on specific use cases without providing substantial information on the performance of their harvester or design parameters and decisions that influence and enhance the efficiency of the harvester. Many works fail to report the efficiency of heat transfer networks which is essential to understand the heat loss and minimum temperature difference required to activate the harvester. This lack of uniformity in the literature even hinders meaningful comparison within the state of the art. We stumbled upon this issue when we started working with soil and air temperature data collected from locations in Belgium, aiming to assess the energy potential of Belgium soil. This prompted us to delve into the intricacies of soil-air thermal energy harvesting, and this paper stands as an outcome. In this paper, we try to offer an exhaustive analysis of soil-air thermal energy harvesting, incorporating both model-based and experimental studies. We provide an in-depth discussion on the thermal properties of various components of the prototype and their influence on system performance. Furthermore, we examine the influence of weather conditions on the energy output of the harvester. Additionally, a comparison between the power output of solar and SoTEG harvesters is presented. This work also serves as a prologue to a more detailed study of soil thermal energy harvesting we are planning to conduct. We anticipate these analyses and discussions to benefit the research community, enabling them to leverage the models and designs unveiled in this paper to build efficient SoTEG devices. This, in turn, will empower researchers to focus on exploring different use cases for the SoTEG.
In general, we make the following contributions in this paper:
-
•
We develop and discuss a proof concept design of a SoTEG which has a heat transfer efficiency of % and can power a load from temperature differences between soil and air. We show that with further enhancements, the harvester can work with temperature differences as low as .
-
•
We develop a mathematical model of the harvester that can predict the energy output for different ambient conditions. The model encapsulates all the components of the SoTEG and a model for the PMU to estimate the available energy to the load.
-
•
We perform detailed experiments, both emulation and real-world deployments to study the performance of the SoTEG and to evaluate the model. The real-world deployments are carried out during winter days, hence covering the worst-case scenarios for the harvester.
-
•
We discuss the impact of different components and weather conditions on the efficiency of the SoTEG and discuss design improvements to enhance its performance.
-
•
We further present a comparison of the SoTEG with the solar harvester based on energy output and cost per watt.
The model described in this paper provides a comprehensive package for simulating the performance of the harvester and PMU under different ambient conditions. While we use methods similar to the previous works [16] and [17] to model our harvester, the model incorporates many parameters that have been ignored. The research presented by Sigrist et al. is the closest one to the work discussed in this paper. However, they have not considered the influence of wind, sky temperature, solar incident angle, and sky emissivity on radiative emission. Moreover, the authors have assumed sky temperature to be throughout the simulation and have not discussed the final equations and models in detail, making it difficult to reproduce the results. On the other hand, the work presented by Ikeda et al. only considers heat conduction and convection with constant wind velocity assumed. However, the wind velocity can significantly influence the performance of the harvester as we demonstrate later in this paper. The model described in this paper incorporates all the ambient parameters including wind speed, sky temperature, sky emissivity, ambient temperature, solar angle of incidence, etc. This allows a highly realistic harvester simulation. Furthermore, the model can be easily converted into a Python script, allowing anyone to use it to simulate the entire system and modify the design parameters to suit their specific requirement.
III Soil-Air Thermal Energy Harvester
To investigate soil thermal energy harvesting, we designed a custom harvester architecture that can be installed into the ground to a maximum depth of . In this section, we delve into the details of the SoTEG.
III-A Design
Harvesting temperature difference between the air and soil necessitates a thermally optimised harvester architecture that is capable of providing maximum temperature difference across the TEG module. This involves providing a smooth heat conduction route to and from the soil and an effective heat absorber/radiator for the ambient side. The absorber/emitter should scavenge maximum heat from the solar radiation during the day and dissipate heat from the soil rapidly at night. Taking these points into consideration, we design a SoTEG as shown in Fig. 2.
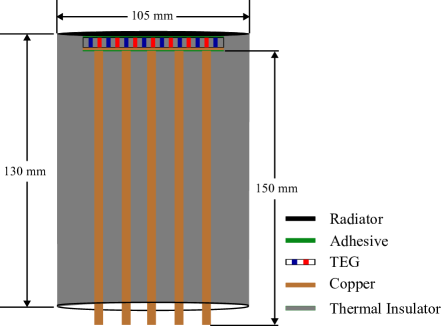
The main components of the SoTEG include a TEG module, an assembly of copper rods connected to the cold side of the TEG, a radiator that interfaces with the ambient air and connected to the hot side of the TEG, and an enclosure that houses the whole system. The harvester uses a commercially available TEG TG12-06 from Marlow Industries [21]. The hot side of the TEG is attached to the radiator of diameter and thickness using thermal adhesive as depicted in Fig. 2. The radiator is made out of copper and painted black to increase its emissivity and absorptivity. Thus, the radiator acts as a heat absorber during the day or a radiator in the night. We chose a radiator instead of a heat sink to exploit both solar heating and radiative emission.The cold side of the TEG is connected to a copper plate of x x . An assembly of five copper rods of length and diameter are attached thermally in parallel to this copper plate using thermal adhesive. The copper rod conducts heat between the soil and the cold side of the TEG. The whole system is housed in an enclosure made out of PVC which is of long and has an inner diameter of . The hollow ends of the PVC pipe are closed using end caps made of acrylic sheets of thickness. The gaps between the copper rods, the walls of the enclosure and the copper disks are filled with thermal insulators to ensure any unwanted heat transfer between the cold and hot sides as well as any radial heat loss. All the materials used for the manufacturing of the SoTEG and their thermal properties are presented in Table III-A.
| Component | Notation | Thermal Conductivity (\unit\per\per) | Thermal Resistance (\unit\per) | Price (€) |
|---|---|---|---|---|
| TEG [21] | Not Available | 25.55 | ||
| Copper rod [22] | 9.54 | |||
| Copper plate [23] | 2.19 | |||
| Radiator [23] | 8.76 | |||
| Thermal adhesive [24] | ||||
| Black paint [25] | Not Available | |||
| Polyurethane foam [26] |
1. miscellaneous cost calculated to be €10.
III-B Modelling
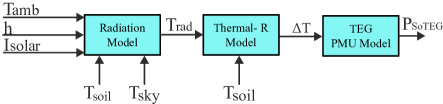
Modelling the SoTEG energy harvester involves modelling two main components of the energy harvester as shown in Fig. 3- the SoTEG thermal network which takes care of the heat transfer and the PMU which manages and regulates unstable output from the TEG. The thermal model estimates the temperature difference between faces of the TEG for different soil and air temperatures and the TEG estimates the output power for different temperature differences.

Creating a model for SoTEG requires modelling the heat transfer mechanisms in the system. There are three possible heat transfer mechanisms for the SoTEG: conduction through the SoTEG, convection of heat between the radiator and the ambient air and radiation of heat from the radiator to the sky at night. Radial heat loss between the copper rods and soil is assumed to be negligible and hence not considered. The conduction of heat depends on the temperature of the radiator and soil. Convective heat transfer depends on the temperature of the radiator and ambient conditions such as temperature, wind speed, etc. The radiative heat transfer depends on the temperature of the radiator and sky and, the total thermal resistance of the network, and can be impacted by cloud coverage [7].
To model the thermal conduction, a network of thermal resistors as shown in Fig. 4 can be used. The circuit models each component of the SoTEGs with an equivalent thermal resistance. Thus, The model incorporates the resistance introduced by five copper rods, adhesive, copper plate, TEG, and the heat radiator. For the thermal resistance model shown in Fig. 4, the temperature difference across the TEG can be written as,
| (1) |
Where, and are the temperature of the soil and radiator respectively, and is the thermal resistance of the TEG and is the total thermal resistance of SoTEG which can be calculated as,
| (2) |
Using the values listed in Table III-A, is estimated as .
The equivalent model illustrated in Fig. 4 can be used to estimate the efficiency of the thermal network as,
| (3) |
Inserting the values given in Table III-A in Eqn. 3 gives the efficiency of the SoTEG thermal network as % which means that only % of the total heat applied between the copper rods and the copper radiator will be available for the TEG. Therefore, the temperature difference across the TEG at any moment will be % of the temperature difference between the radiator and the copper rod. It is worth noting that the efficiency of the SoTEG is primarily decided by the thermal resistance of the copper rods and the TEG. The efficiency is directly proportional to the thermal resistance of TEG and inversely proportional to that of copper rods.
During the daytime, the absorber(radiator) absorbs a portion of the solar radiation striking it based on its absorptivity and position. The quantity of solar energy absorbed by the absorber(radiator) can be calculated using Eqn. 4.
| (4) |
Where, is the absorptivity of the copper disk, is the area of the disk, is the intensity of solar radiation falling on the disk, and is the angle of incidence of solar radiation.
While the copper disk absorbs energy from solar radiation, it loses energy to the ambient through convection. The energy lost due to heat convection can be given as,
| (5) |
Where is the ambient air temperature and is the coefficient of heat convection which can be calculated using wind speed as [27],
| (6) |
Furthermore, any substance at a temperature above radiates heat proportional to its temperature. Thus, the copper disk loses some of the absorbed energy as radiated heat. The energy lost or gained by a body through radiation can be estimated using the Stefan-Boltzmann relation and can be written as,
| (7) |
Where is the Stefan–Boltzmann constant and has a value of , is the emissivity of the copper disk, and is the temperature of the sky which can be estimated as [28],
| (8) |
Where is the emissivity of the sky which depends on dew temperature and sky opacity as [29],
| (9) |
Finally, a portion of the total energy absorbed by the radiator conducts through the SoTEG to the soil which can be written as,
| (10) |
Considering all these heat sources and sinks, the energy balance equation for the copper disk can be written as,
| (11) |
| (12) |
Where,
Eqn. 12 is a quartic equation in with four possible roots. By solving this quartic equation, the value for can be found. Once the value of is calculated, the temperature difference across TEG can be estimated using Eqn. 1.
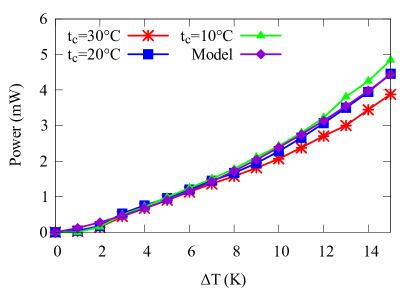
While the radiation and conduction models can be used to estimate the temperature of the radiator and difference across the TEG for various ambient conditions, the harvested energy depends on the efficiency of the TEG. In addition, a PMU is required between the load and the TEG to ensure that the extremely low output voltage from the TEG is boosted to a range suitable for charging an energy buffer or powering the load. As a result, the total energy available to the load depends on the efficiency of both the TEG and PMU. Thus, we introduce a combined model for the PMU and TEG that can capture the performance of the combined system under different conditions. The model is based on the empirical measurements obtained using the thermal energy harvesting emulator TEGBed [30]. The TEGBed is an emulation framework developed for testing and evaluating energy harvesting and batteryless devices. TEGBed can mimic different thermal energy harvesting situations which can be used to evaluate the performance of EH devices within a controlled environment. A novel energy gauging tool called Joule Counter accurately measures harvested power and energy. Using the TEGBed, different temperature gradients were applied across the TEG. LTC3109 from Analog Devices which can work with an input voltage as low as was employed as the PMU [31]. Temperature differences starting from to were applied across the TEG and for each difference the power was measured using the Joule Counter. A plot of the measurements obtained using the TEGBed is shown in Fig. 5. A prediction model for the system is derived using the curve fitting method which is given as,
| (13) |
Where is the temperature difference across the TEG. One can use Eqn. 12 to calculate the temperature of the TEG and Eqn. 1 to estimate the difference across the TEG and. The value produced by Eqn. 1 can be fed to Eqn. 13 to estimate the power generated by the SoTEG. Thus, the model provides a complete package to simulate the performance of the SoTEG under different environmental conditions.
IV Experiments and Results
We conducted multiple experiments to evaluate the performance of the fabricated SoTEG. The experiments involved in-lab validation using TEGBed and real-world deployments. Using the empirical results, we assess the validity and effectiveness of the SoTEG and its model. A detailed discussion of the experiments and model validation are discussed in this section.
IV-A Emulation Experiment
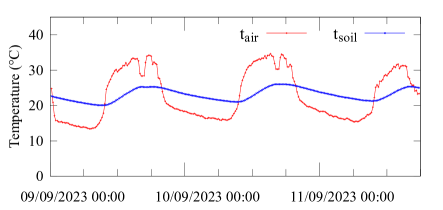
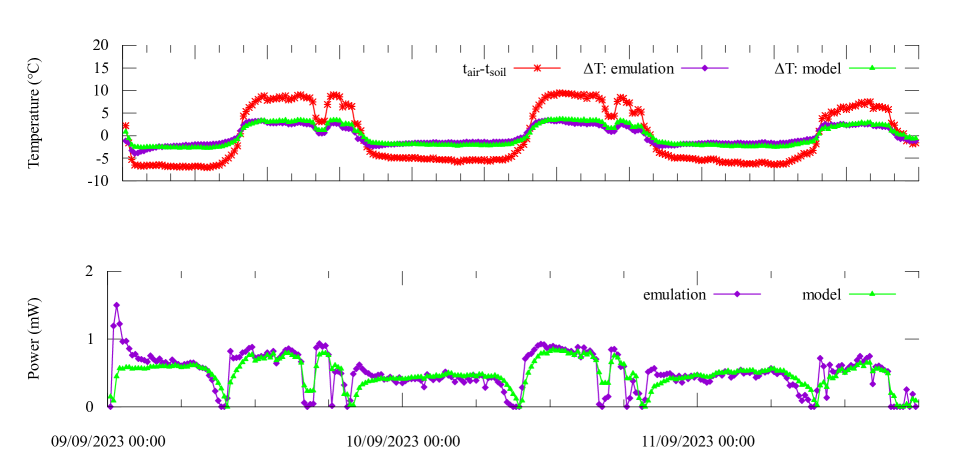
To verify the accuracy of the thermal and PMU models, we conducted emulation experiments with TEGBed. The TEGBed generated known temperature gradients for the SoTEG and the power output for each difference was measured. The experimentally obtained results are then compared with the values estimated using the model to estimate the accuracy of the model. We used soil and air temperature data collected from real-world deployments as the known temperature input TEGBed. This input data set contains air temperature and soil temperature at depth sampled in every for four days in September 2023. A plot of the data set is given in Fig. 7. Using TEGBed, we recreated both soil and air temperature profiles in the lab and then for every temperature difference, the output power of the SoTEG was recorded. In addition, the temperature difference across the TEG was also measured using a pair of temperature sensors. A picture of the SoTEG installed on TEGBed is shown in Fig. 8.
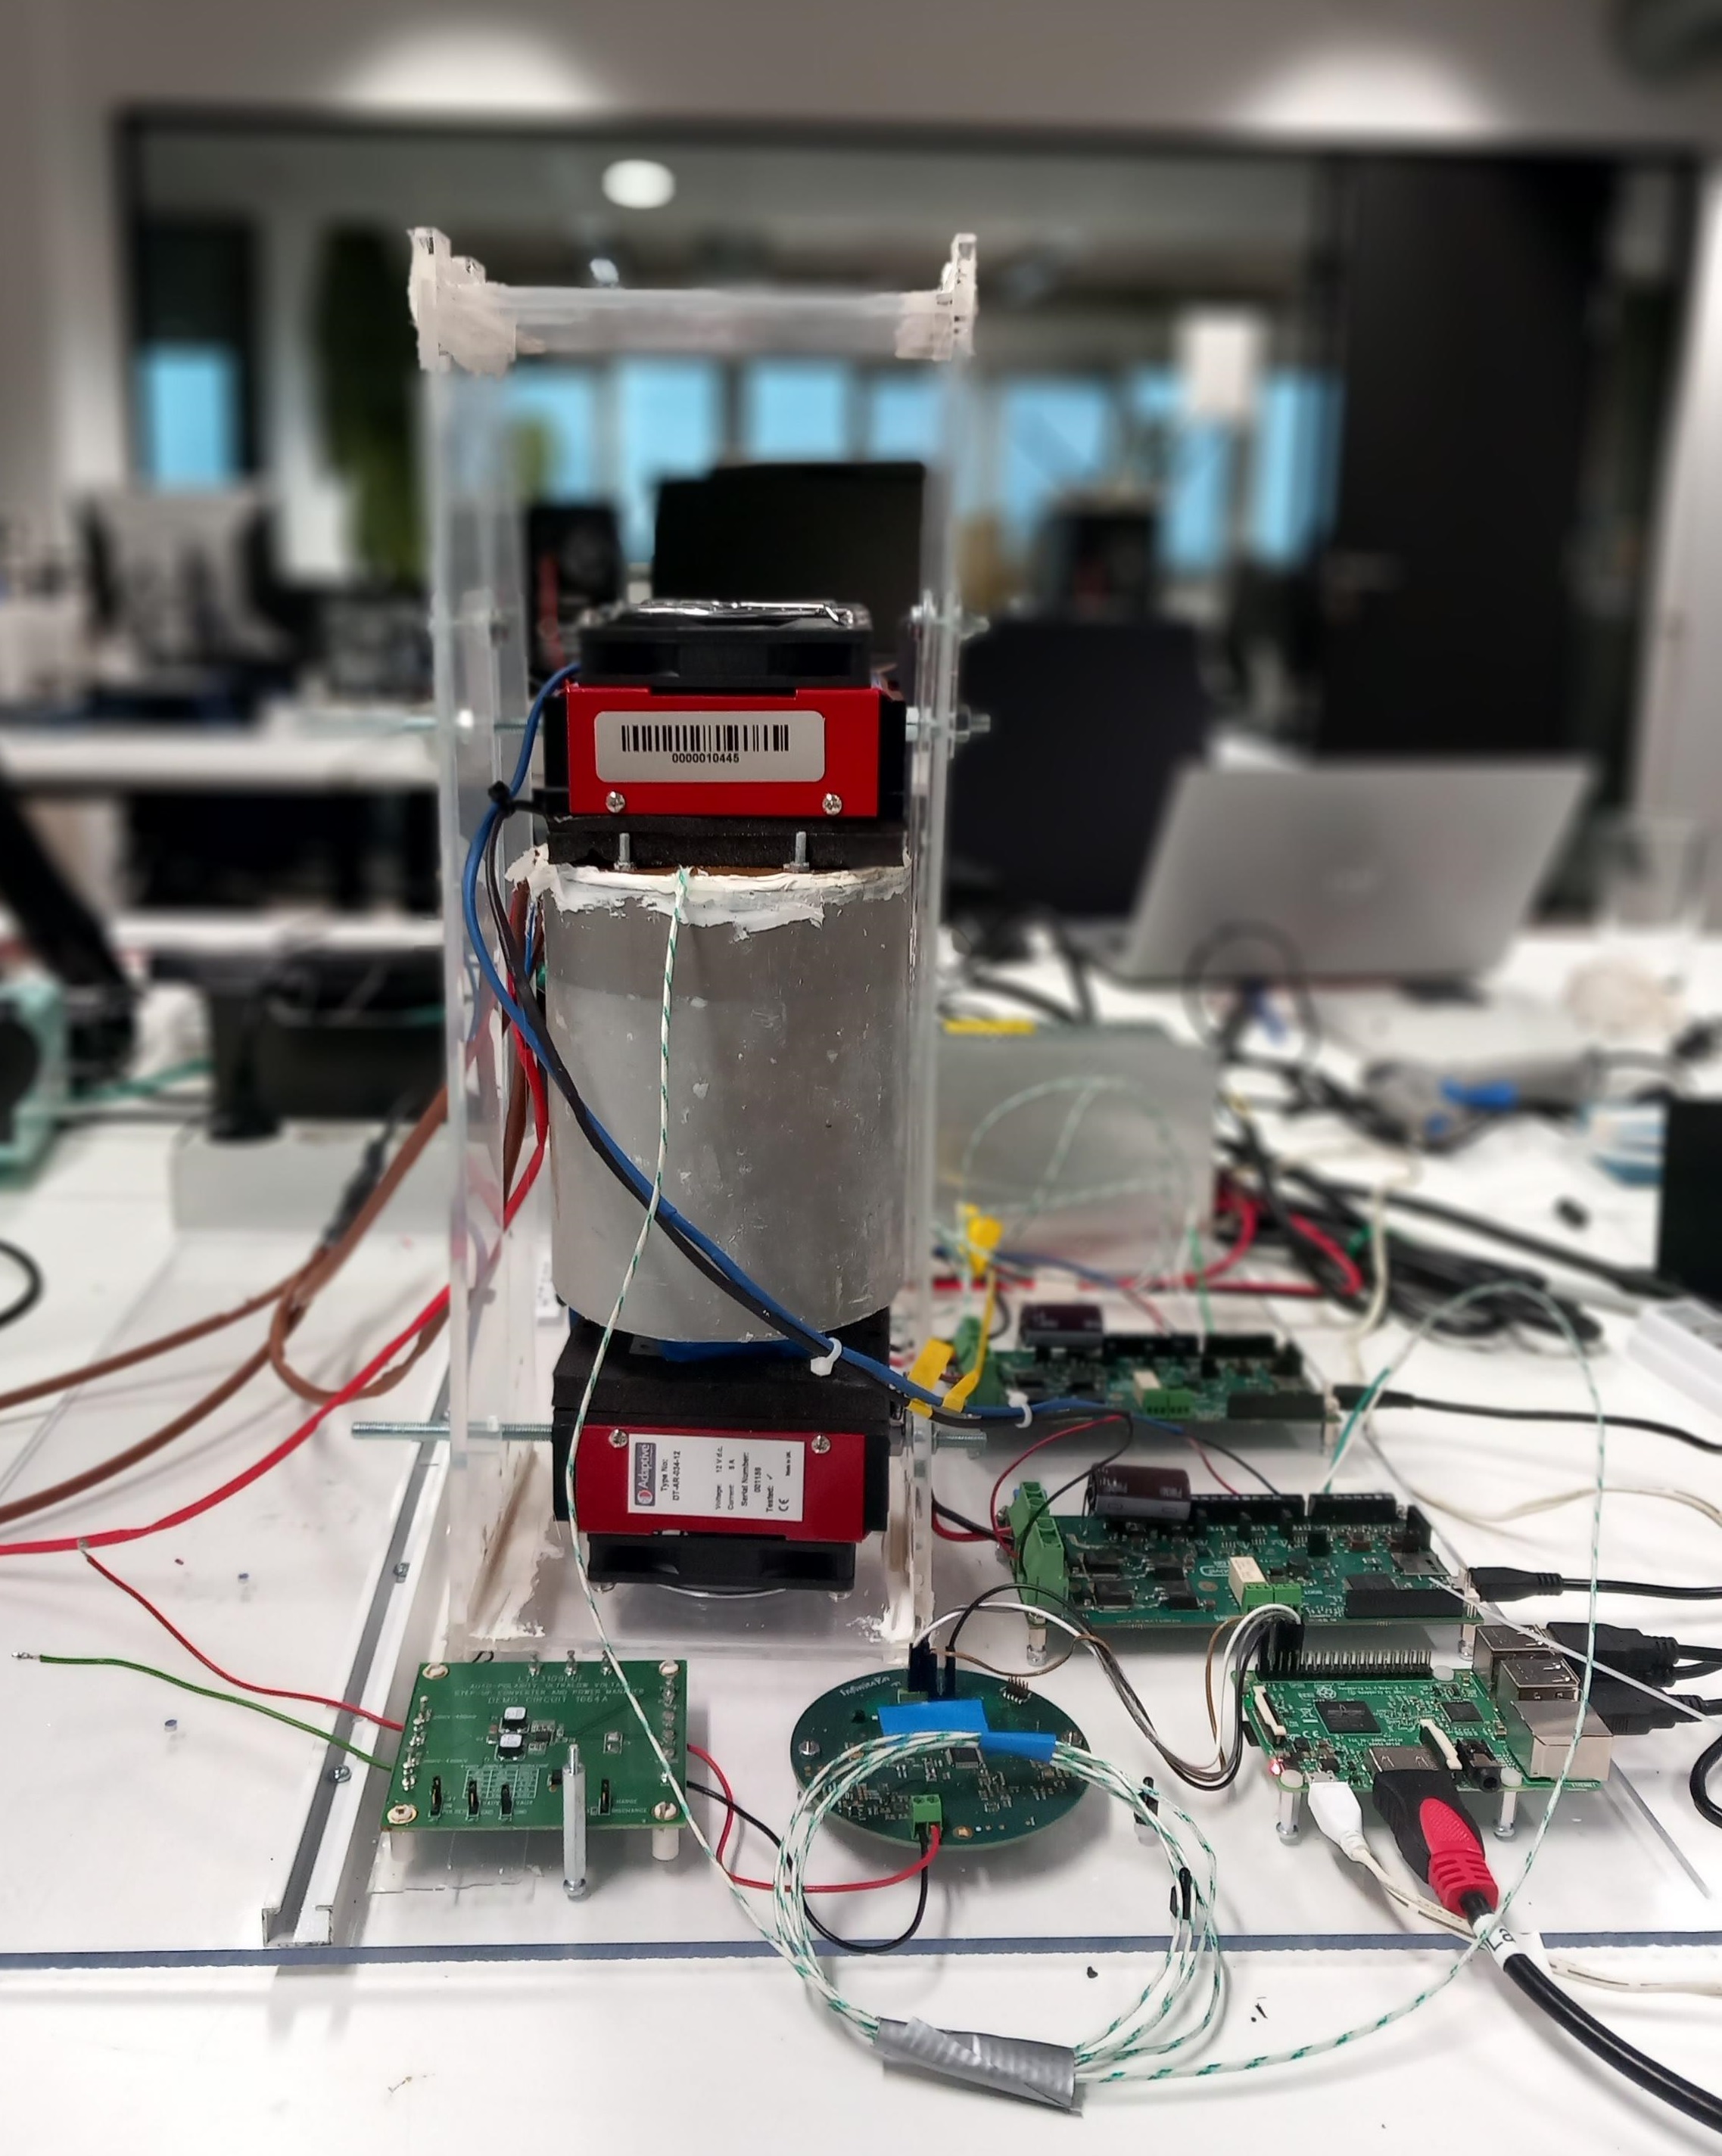
Fig. 6 shows the results of the emulation experiments. The plots show the temperature difference and power recorded during the emulation experiment and estimated by the model. It can be observed from the plots that the values estimated by the model agree with the empirical measurements except for a few instances. We identify two main reasons for this mismatch; firstly, the model does not consider the thermal capacitance introduced by the copper rods which might have introduced errors in heat transfer time. Secondly, the TEGBed uses PID temperature controllers which take time to lock to temperature set points. Since PID controllers are feedback controllers, temperature fluctuations happen while the controller tries to reach the set point temperature. This is the reason for spikes in the harvested power graph.
IV-B Real World Deployment
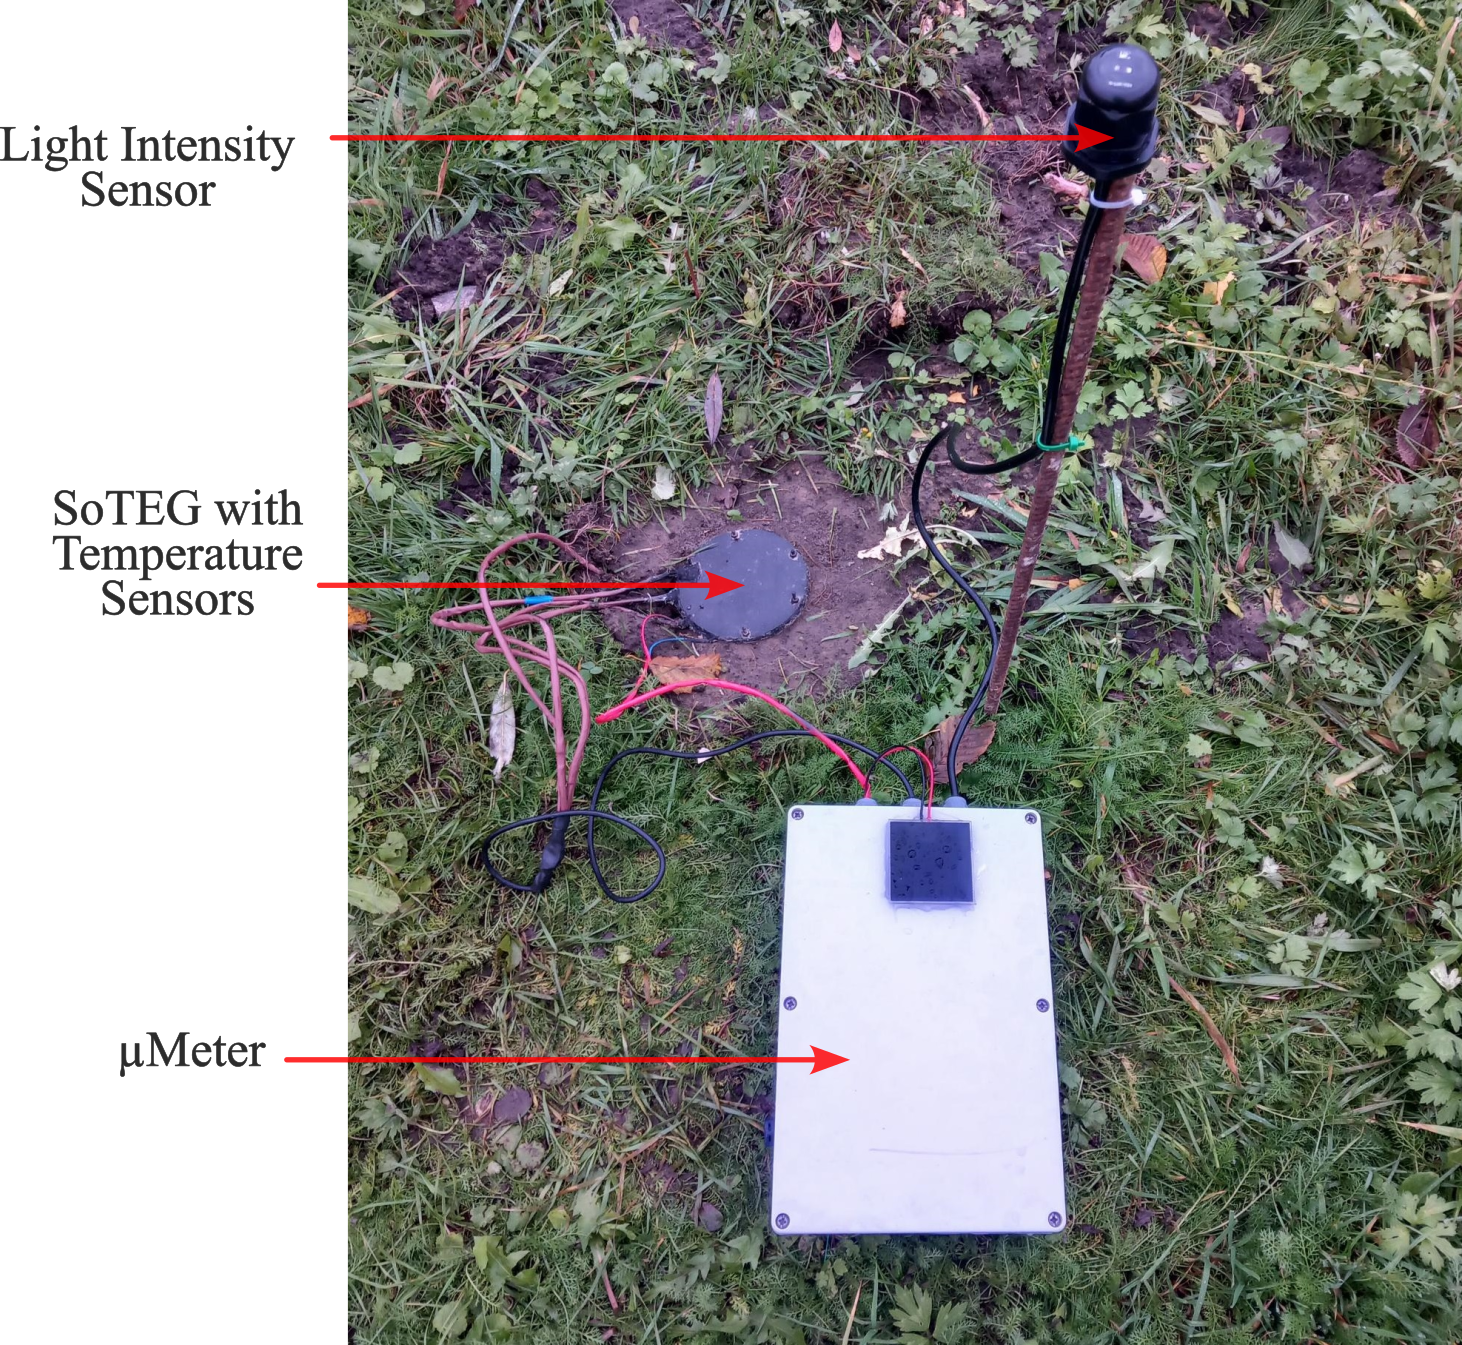
To evaluate the performance of the SoTEG and its model in real-world conditions, we conducted field tests by deploying the harvester in an outdoor environment. The system was installed at a location in Belgium (N , E ) for 14 days starting from 24 Nov 2023. During these 14 days, we collected different data from the energy harvester and ambient environment that would facilitate an accurate assessment of the energy harvester. The data collected include soil and air temperatures, temperature difference across the TEG, light intensity, the power output from the harvester, wind speed and ambient air temperature. Further, to establish a comparison between solar energy harvesting and thermal energy harvesting, the power generated by a solar energy harvester was also measured. A photo of the deployment is shown in Fig. 9.
As we observed during the emulation experiments, energy produced by SoTEG is at level. Gauging such low-power outputs requires sophisticated and costly tools. To address this challenge we have developed a specialized energy surveying instrument [32]. This custom-designed tool is tailored to measure low-power outputs of energy harvesters accurately. However, unlike many other energy measurement tools available in the literature, does not measure the power generated by the transducer alone, instead it measures the energy generated by the PMU. This gives a more realistic estimation of the power generation capability of the overall system as a transducer is always combined with a PMU in real-life use cases. The can measure the power generated by two different harvesters at a time. Additionally, it can accommodate sensors to measure ambient conditions. In the deployment presented in Fig. 9, was configured to measure power outputs from SoTEG and a solar harvester. A solar panel of size x was used as solar harvester. LTC3109 was used for the SoTEG and BQ25570 [33] was used for the solar harvester as the PMU. In addition, soil temperature, air temperature, temperature difference across TEG and solar light intensity were also measured using . The solar intensity () is converted into irradiance () using the relation [34]. Along with these data, wind speed, ambient air temperature and precipitation data were collected from a weather station installed approximately away from the SoTEG. However, due to some issues with the weather station, we lost the majority of the precipitation measurements, requiring us to use the precipitation measurements available from Solcast [35].
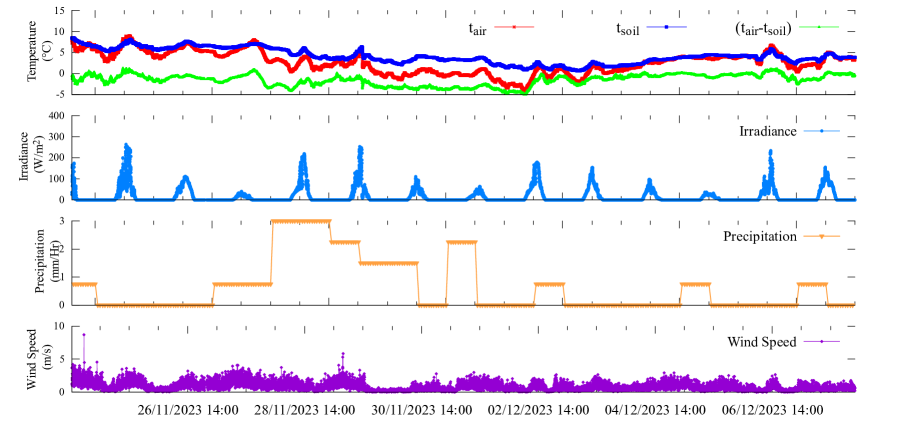
During the 14 days of deployment, the weather conditions were mostly cloudy with frequent showers. On and of December, there was light snowfall and snow cover. The maximum solar radiation recorded during the 14 days was measured on 28 Nov 2023. The ambient temperature recorded a maximum of and a minimum of . Measurements of the meteorological parameters and the power generated by SoTEG and solar harvester were recorded every 1 minute. The meteorological data measured using the , weather station and accessed from the Solcast database for the 14 days of the experiment are presented in Fig. 10.
Over the course of the experiment, the maximum power generated was when the temperature difference between the soil and radiator was which produced a difference of across the TEG. It was further noted that the SoTEG required at least a temperature difference between the soil and the radiator or across the TEG to start producing energy. Since we have used LTC3109 as the PMU, a minimum output is required from the TEG to cold start the PMU. This is equivalent to a temperature difference across the TEG in ideal conditions. However, it is observed that the PMU required at least to cold start it. In addition, the efficiency of LTC3109 is between % and % for input voltages in the range of to . Thus a significant portion of the energy is lost in conversion. Consequently, during the days of the experiment, the harvester produced energy intermittently only for 1626 minutes, out of which 1166 minutes (%) were between and . The absolute average temperature difference between the soil and radiator recorded for the whole days is .
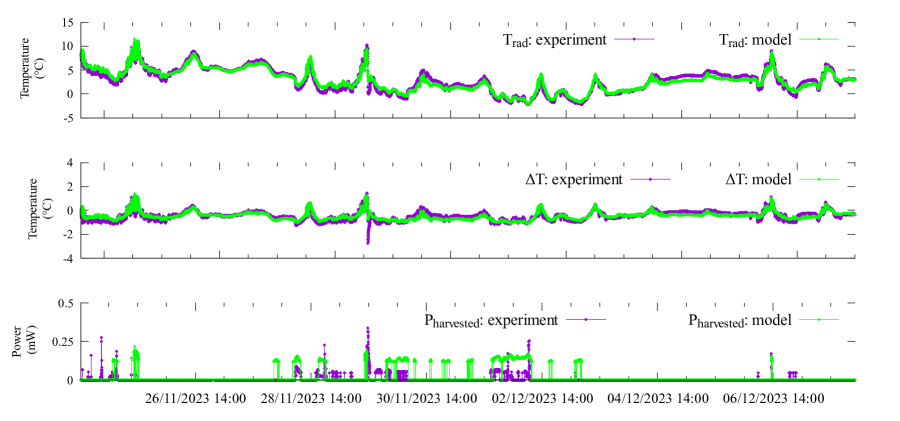
We further used the SoTEG model, both radiation and conduction, to estimate the temperature difference and the PMU model to calculate the output power. The radiation model used the meteorological data from the experiment to estimate radiator temperature. Additionally, the absorptivity/emissivity of the radiator was estimated to be and the value of the convection coefficient for the ambient air was calculated using Eqn. 6 and the temperature of the sky was estimated using Eqn. 8. Dew point temperature and cloud coverage data available from Solcast were used in Eqn. 9 to estimate sky emissivity. The calculated emissivity value was used to estimate the temperature of the sky as given by Eqn. 8. A plot of measurements recorded by the and that estimated by the model is shown in Fig. 11. While the model correctly estimates radiator temperature, temperature differences across the TEG and power for most of the days, for certain periods the estimation is off from the actual measurements. We assume multiple reasons for this mismatch. First of all, the ambient temperature was measured at a height of meters whereas the SoTEG was installed deep in the soil and the radiator was on the ground level as shown in Fig. 9 which might have impacted the actual ambient temperature around the radiator. Hence, introducing errors in the radiator temperature estimated and consequently the temperature across the TEG. Secondly, the natural convection coefficient was calculated only based on the wind speed and the variation in natural convection with precipitation and humidity was not modelled. Additionally, since the temperature differences were all close to throughout the experiment, even minute resolution changes or errors can impact the estimated values. Similarly, in the PMU model, we have not considered the cold start time of the PMU. For this reason, the model generates a valid number for all temperature differences above whereas the deployed device generates energy only if the temperature difference stays sufficiently long to cold start the PMU. Nonetheless, the model is capable of capturing the details of the physical device and providing an approximate estimation of its output.
V Discussions
While the temperature difference between soil and air can be a potential source of energy for many batteryless IoT devices, numerous factors influence its performance. In this section, we discuss the major factors deciding the performance of the SoTEG along with a short note on future research plans and directions.
Influence of the efficiency of the PMU: The PMU in a thermal energy harvesting system ensures that a regulated voltage is available for the energy buffer and load from the relatively low and unstable output from the TEG. Consequently, the energy harvested by the system is highly dependent on the efficiency of the PMU used. As mentioned earlier, our current design employs LTC3109 as the PMU. The PMU provides a maximum efficiency of % which can go down to % at higher input voltages [31]. Despite low efficiency, we chose LTC3109 due to its unique auto-polarity detection feature. This allows the PMU to work irrespective of the polarity of the input voltage and is useful in this case since the polarity of the SoTEG output changes based on the temperature of the air and soil. Therefore, it is possible to further increase the output of the SoTEG by using a PMU with a higher efficiency. Nevertheless, to our knowledge, LTC3109 is only one PMU available in the market with auto-polarity detection.
To estimate the energy loss due to PMU, we need to know the energy output from the TEG. This can be done by measuring the open circuit voltage of the TEG and estimating its Seebeck coefficient. The relation between open circuit voltage and the Seebeck coefficient is given as [3],
| (14) |
Where is the Seebeck coefficient, is the temperature difference and is the open circuit voltage of the TEG.
Once is estimated, the matched-load power can be calculated as [3],
| (15) |
Where is the internal resistance of the TEG.
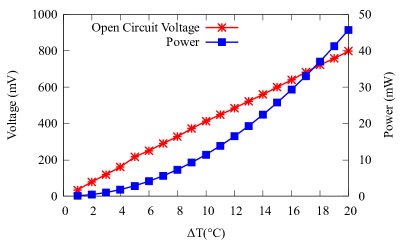
We used TEGBed to measure the open circuit voltage of the TEG for different temperature gradients. From the measurements, the Seebeck coefficient of the teg was found to be . The measured open circuit voltage for each temperature difference and the corresponding power estimated is shown in Fig. 12.
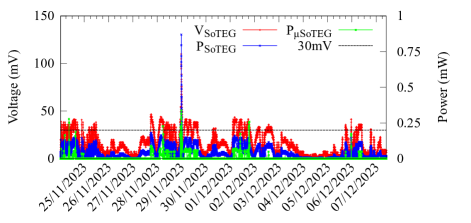
Using the Seebeck coefficient, the power output and open circuit voltage for the SoTEG for each temperature measurement from the deployment was further estimated using Eqn. 15 and 14. A plot of the power output from TEG, PMU and the open circuit voltage of the TEG estimated is shown in Fig. 13. The dashed line in the plot corresponds to which is the minimum startup voltage required for the PMU.
The degradation in the overall power output due to the insertion of PMU is well visible from Fig. 13. While the TEG has a non-zero power output most of the time, the output from the PMU is intermittent as it is activated only when a voltage of or more is available to cold start it. As mentioned earlier, this corresponds to a temperature difference of across the TEG. At this temperature difference, the power produced by the TEG is around whereas only around or less is available from the PMU at the same temperature difference. Thus, almost % of energy is lost during energy consumption. Similarly, at the highest temperature difference of recorded during the experiments, the TEG generates while the regulated output available from the PMU is only . Hence by improving the efficiency of the PMU, the performance of SoTEG can be improved. Nevertheless, limited by the availability of off-the-shelf PMU with higher efficiency.
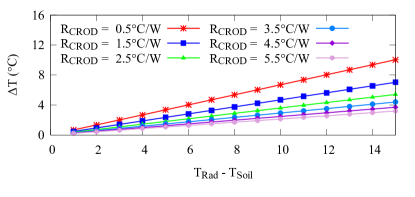
Impact of the thermal resistance of the SoTEG: The power generated by the SoTEG is primarily decided by the temperature difference across the TEG. To provide a maximum temperature difference across the TEG, the energy loss in the heat transfer network should be as minimal as possible. As we mentioned in Section III-A, the current prototype has an efficiency of around %. Thus, only % of the applied heat energy is available for the TEG to convert to useful work. A major factor deciding the efficiency is the thermal resistance of the copper rods. The current design uses five copper rods connected in thermal in parallel giving a total thermal resistance of . By increasing the number of copper rods, the thermal resistance of the network can be increased which will improve the efficiency of the SoTEG. However, this will increase the overall cost and form factor of the harvester.
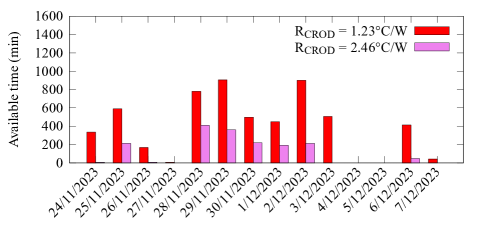
The impact of the thermal resistance of the copper rod on the total temperature difference available across the TEG is shown in Fig. 14. As evident from the graph, by reducing the thermal resistance of the copper rod, we can increase the temperature difference across the TEG. For instance, if we increase the number of copper rods to ten, the total thermal resistance of the copper rod will be which will increase the efficiency of the heat transfer network to around %. This will further reduce the minimum temperature difference between soil and radiator required for the PMU to start generating energy to , considerably increasing the available energy from the overall system. This is depicted in Fig. 15 which compares the active energy-generating periods for the SoTEG with the existing architecture, i.e., with five copper rods and when the number of copper rods increased to ten. From the results, decreasing the thermal resistance of the copper rods to provides minutes of active time, which equals an improvement by around %.
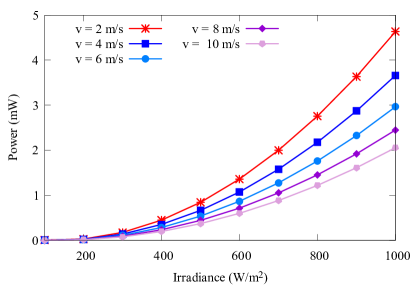
Impact of solar radiation: It is obvious from Eqn. 12 that the intensity of solar radiation can positively impact the output power of the TEG. Stronger radiation causes the radiator to heat up to a higher temperature, increasing the temperature difference across the TEG. To verify this theoretically, we used the SoTEG model to simulate the performance of SoTEG under different solar radiation power and ambient temperatures. For this simulation, the wind speed was assumed to be , the temperature of the sky , and soil temperature, . The ambient temperature varied from to and irradiance varied from . The results of the simulations are illustrated in Fig. 16 which shows the temperature difference and corresponding power output from SoTEG without a PMU for different irradiance levels and ambient temperatures.

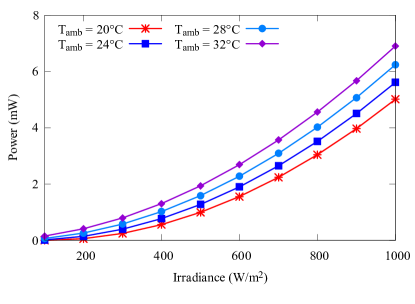
The results showcased in Fig. 16 match with the assumptions that an increase in solar radiation constructively influences the performance of SoTEG. From the graph, When both the soil and air were at the same temperature levels of with solar radiation of , the temperature difference across the TEG was . However, an increase in the solar radiation to produced temperature difference across the TEG and generated a corresponding power of . Further increase in irradiance to , rises the temperature across the TEG to and power to . Thus, the presence of solar radiation enhances the energy generation from the harvester as long as the soil is at a lower temperature than the radiator.
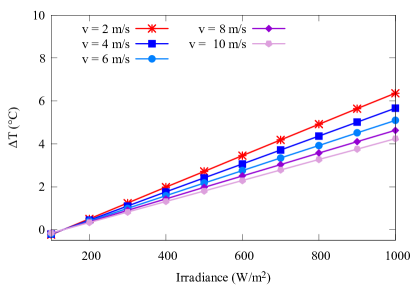
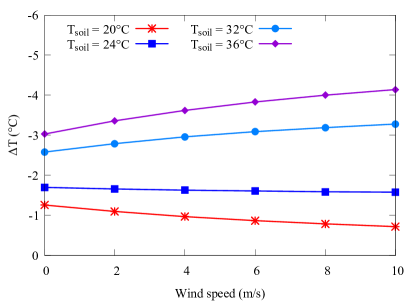
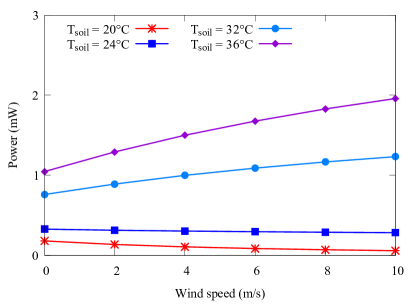
Impact of wind speed: While the influence of solar radiation on the performance of SoTEG is obvious, assessing the impact of wind speed on SoTEG requires considering other parameters as well. To investigate how SoTEG behaves with different wind speeds, we ran the model for both daytime and nighttime with different wind speeds, soil temperature and solar radiation power. The performance of SoTEG in daytime with constant ambient temperature while varying wind speed from to and irradiance from to is shown in Fig. 17. The plot confirms a diminishing temperature difference across the TEG and consequently power from the SoTEG with an increase in wind speed. This can be explained by referring to Eqn. 6 which shows the relation between the convection coefficient and wind speed. The wind speed is directly related to the convection coefficient. Further, according to Eqn. 5, the convective heat transfer increases as the convection coefficient increases. Consequently, increased wind speed causes more heat to be removed from the radiator through convection. Thus, during the day, power generated by the SoTEG diminishes as the wind speed increases. This is also a reason we chose a SoTEG architecture with a radiator instead of a heat sink. The heat sinks are designed to have a higher convection coefficient and will dissipate more thermal energy from the ambient side during the daytime, subsequently reducing the temperature difference. It is possible to reduce the convection loss by introducing a convection shield around the radiator. However, it must be noted that the soil temperature is assumed to be equal to or lower than the air temperature in the day, implying that heat flows from the radiator to the soil through the SoTEG. If the temperatures reverse during the daytime, then a higher convection coefficient is desirable.
While the wind normally reduces the daytime power generation of the SoTEG, its nighttime impact varies based on factors like radiator emissivity and soil temperature as depicted in Fig. 18. As long as the radiative heat transfer from the radiator is enough to dissipate heat from the radiator, an increase in wind speed will cause a reduction in the power generated by the SoTEG. A justification for this effect can be further drawn with the support of Eqn. 6 and Eqn. 5. In the night, the radiator loses its energy due to emission and subsequently, the temperature of the radiator goes below the ambient temperature. When the wind blows faster, convective heat transfer will increase leading to increased heat transfer from warmer ambient to cooler radiator. However, if the soil temperature is large enough so that the convective heat transfer alone is not enough to dissipate heat from the radiator, we observe that an increase in wind speed enhances the performance by improving heat transfer from the radiator to the ambient. Thus, the impact of wind on power generation during the night depends on the emissivity of the radiator. This is what passive radiative cooling devices try to achieve by increasing the emissivity of materials in the transparency window, enabling them to radiatively exchange energy with the outer space where the temperature can be as low as [7]. Moreover, to reduce the impact of convective heat transfer with the ambient, they often employ a convection shield [7, 19, 20].
At this point, there is not much data available to evaluate the impact of precipitation and soil water content on the performance of the SoTEG. However, from Fig. 10, we can observe that the precipitation affects soil temperature, leading to a convergence with air temperature after consecutive instances of rainfall and reduced solar radiation. This happens as the specific heat capacity of water is high, causing most of the heat energy from solar radiation to be absorbed by the water. Moreover, increased precipitation levels can generate water layers on the radiator, reducing its solar absorption efficiency. In addition, often precipitation is associated with reduced solar radiation, which can naturally reduce the radiator temperature. Nevertheless, further data and analysis are necessary to substantiate this observation.
Variation in power with time: To understand how the energy generation by SoTEG varies with time, we grouped the temperature differences and the energy generated by TEG into different time slots: and . Out of these six slots, and correspond to daytime and the remaining slots correspond to nighttime and when there is no sunlight. For each slot, we calculated the average temperature difference. When calculating the average temperature differences, absolute values were considered since the power generated is the same irrespective of the polarity of the temperature difference. The temperature difference and power distribution for each time slot along with the average value for each slot is illustrated in Fig. 19.
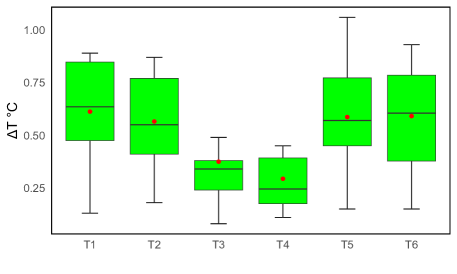
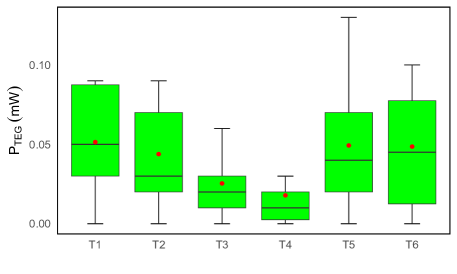
From Fig. 19a, it can be observed that the highest temperature differences are recorded for the slots and ; i.e., when there was no sunlight present and consequently, when the temperature of the soil is higher than that of the air. As a result, the highest average of power is reported for the slot (), followed by (), () and () as illustrated in Fig. 19b. The lowest average power is reported for time slot (), followed by time slot (). Therefore, it is conclusive that maximum energy is generated during slots with no sunlight. This also validates the claim on the nighttime energy generation potential of the SoTEG. However, it is worth mentioning that the experiments were conducted in November and December and had limited sunlight due to reduced daytime and overcast and rainy weather conditions. Therefore, the produced results are specifically for the experiment duration and can not be generalized. We expect the harvested energy to increase with solar radiation as discussed in previous sections. Nonetheless, this will not invalidate the claim on the nighttime energy generation but only enhance it.
Cost Analysis of SoTEG: The importance of the cost of the energy harvester becomes significant while considering the development of devices for the market. To be economically sustainable, the harvester should have a low Price Per Watt (PPW). Based on the components used for the current prototype, the cost per unit when units are manufactured would be €56.05 without including the labour costs required for the assembly of the module. A mammoth portion of the per unit cost is invested in procuring the TEG module which costs €25.55 per unit when a hundred or more units are purchased. We did not include the cost of the PMU in the per unit calculation, since a PMU is a common component in any energy harvesting device. The PPW of the harvester can be calculated by dividing the per unit cost by the maximum wattage of the harvester. The TEG module used in the design is rated for a maximum of , giving a PPW of €9.1. This is many times higher than a solar panel which can have PPW as low as $ [36]. A more useful cost estimate would be the Levelized Cost Of Energy (LCOE) which takes the PPW, lifetime and annual energy production of the SoTEG. However, calculating LCOE requires data on the annual energy production of the harvester, which is currently unavailable. Nonetheless, if we use the energy estimated for the SoTEG alone from the current deployment and extrapolate it for a whole year, the LCOE would be around . This is assuming an average lifetime of 10 years with an average power production of , no performance degradation over a year and zero maintenance cost.
| Harvester | LCOE |
|---|---|
| Solar | [37] |
| Wind (on-shore) | [37] |
| SoTEG |
A comparison of LCOE of SoTEG with solar and wind harvesters is shown in Table II. The LCOE values for solar and wind generators are obtained from the website of the International Renewable Energy Agency (IRENA) [37]. The LCOE of SoTEG is estimated solely based on the current experimental data which is limited to only two weeks in November-December. We expect an overall improvement in the harvester performance during summer along with other fine-tuning in the harvester design. Therefore, a more accurate cost estimate needs to be calculated based on a long-term dataset. This is also one of the main research goals of the currently ongoing study with the SoTEG models and long-term data set from around locations in Belgium. While one may observe from Table II that the SoTEG has a very high LCOE, it is worth noting that the targeted use cases for the SoTEG are low power deployments in harsh and extreme conditions where solar harvesters do not work. Similarly, we expect wind generators to be the least feasible for these kinds of applications. Therefore, the best way to compare them would be to consider not only the cost but also the usability of the harvester.
Comparison with solar harvester: Solar harvester is the de facto standard for a majority of outdoor IoT devices due to the abundance of solar radiation and relatively higher efficiency in energy conversion. However, one of the advantages of soil-thermal energy over solar energy is the almost 24/7 availability due to the distinct thermal characteristics of both the air and soil. To understand how SoTEG compares with the solar harvester, a plot of the power density of the harvesters is presented in Fig. 20. The plot shows both the power density calculated based on the power measured by the , ( and ) and estimated using Eqn 15 (.
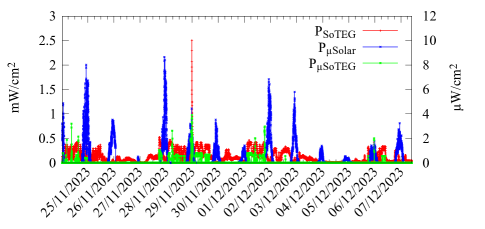
It is evident from Fig. 20 that the power harvested by the solar harvester is many times higher than that of the SoTEG. The supreme efficiency of solar harvesters over TEG is already a proven fact and hence a direct comparison in terms of power is unreasonable. The only motivation behind a comparison between SoTEG and the solar cell is to assert the unique property of SoTEG which is its availability during both the day and night. As visible from Fig. 20, the output from the SoTEG (PMU excluded) is available around the clock except for a couple of days when the solar radiation was extremely low. The highest power density achieved by the solar harvester for the 14-day experiment is whereas for the SoTEG alone the maximum power density estimated is . When combined with the PMU, the power density of the SoTEG deteriorates to .
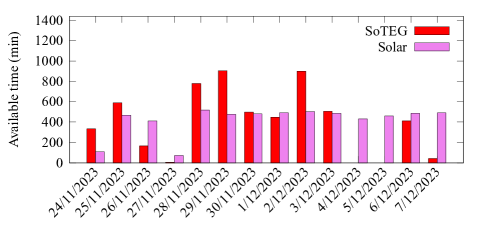
The active energy generation time of both the harvesters is showcased in Fig. 21.
System Reliability: Ensuring reliability is paramount in any successful system design. The reliability of the SoTEG can be categorised into mechanical reliability and environmental reliability which include response to high temperature, frequent temperature cycling and response to environmental conditions such as humidity, water content and ambient temperature. The mechanical reliability of the SoTEG can be regarded as high considering the lack of any moving parts within it. In addition, the TEG, which forms the central building block of the SoTEG is generally considered a system with high mechanical stability. Research shows that TEGs have high mechanical stability and reliability even under high thermal stress [38]. Moreover, increasing mechanical stress can enhance the performance in certain cases by reducing the contact resistance [39].
Exposure to high temperature and temperature cycling are the other two factors that can lead to the performance degradation of the harvester. Prolonged exposure to high temperatures above is reported to cause the unstable performance of certain TEGs due to the weakening of the soldered and joints of the thermocouples in the TEG [40]. However, in the case of SoTEG, we do not expect the temperature of either of the sides to reach this point. Though the ambient side can heat up from solar radiation, the size of the absorber is not enough to raise the temperatures to extreme levels. Using the model, we estimate the maximum temperature of the radiator to be around even at an irradiance level of and ambient temperature of . Therefore, we expect performance degradation and subsequent device failure due to high-temperature exposure to be the least possible failure mode. Frequent temperature cycling can cause a decrease in the Seebeck coefficient and an increase in thermal resistance, leading to reduced power generation over time [41, 42, 43]. This is particularly significant in the context of SoTEG as the device is exposed to highly dynamic air temperatures. Nonetheless, most of the literature discussing reliability over temperature cycling targets high-temperature applications [41, 42, 43]. Whereas in the case of a SoTEG, temperatures below only are expected. For instance, Hatzikraniotis et al. investigated the performance degradation when a TEG was subjected to hot side heating at and long-term cooling of hours [41]. They observed a % decrease in the Seebeck Coefficient of the TEG and % decrease in resistivity. Similarly, Park et al. analysed the impact of hot side cycling from to in every minutes [43]. They reported an % decrease in the figure of merit and % increase in thermal resistance after cycles. In addition, the power generated was reduced by %. In another work, Merienne, et al. investigated how the performance varies when the hot side temperature cycles in every seconds, seconds and seconds for three different TEGs [42]. The cycle power and heating time were also carried for each TEG but the maximum temperature was kept below and minimum at . They reported a similar observation of a reduction in power and figure of merit over temperature cycles. Therefore, at this moment, there is not enough data to estimate how the daily ambient temperature fluctuations would impact the performance of the SoTEG. In addition, most of the above research considers rapid temperature cycling in seconds or minutes whereas in the case of SoTEG, the cycling happens in the frequency of hours or less. Though we do not have much data on the impact of low-grade thermal cycling at this time, we are currently working towards analysing the reliability of TEGs under low-grade temperature cycling using an in-house temperature emulator for TEGs.
While the above reliability matrices consider engineering factors and corresponding events, the amount of ambient energy available is an external event that can influence the reliable power generation of SoTEG. The power generation reliability of the SoTEG can be assessed based on the heat transfer efficiency given in Eqn. 3. Therefore, improving the reliability of power generation requires reducing the thermal resistance of the system as low as possible. Nonetheless, since the thermal resistance of the copper rods and plates can never be zero, the system would never attain % efficiency. Another option to increase the power is to use a TEG module with a high Seebeck Coefficient. However, a high Seebeck Coefficient often leads to a high electrical resistance due to the increased number of thermocouples. Therefore, to improve reliable power generation at a given ambient energy, an optimum design based on the thermal resistance and electrical resistance of the system needs to be considered. This may be solved using methods such as Reliability-based Design Optimization (RBDO). This is currently out of the scope of this paper and hence not considered.
Future Work: Harvesting energy from the temperature difference between soil and air is an intriguing research field that could pave the way for numerous sustainable applications. However, several challenges must be addressed before such harvesters can be employed in real-world deployments. The impact of weather conditions, seasons, soil properties and geographical locations on the performance of the energy harvester needs to be further investigated. A comprehensive understanding of these relations requires a long-term data set and multiple deployments. Our current work serves as a prelude to a more diverse and long-term study that we are planning for the future. We further plan to run the current deployment for a year to observe its performance under various conditions and seasons. Considering the cost and investment required for scaling up the installation, we currently do not plan to increase the number of deployments.
While the data collected from experiments demonstrate the feasibility of soil-air thermal energy harvesting, the universal applicability of the proposed methods needs to be further verified. The data analyzed in this paper comes from a two-week long experiment conducted during the winter months in Belgium. Therefore, to claim universal applicability, data from various geographical locations and climates are required. However, based on the already available literature on soil temperature in different geographical conditions and climates [44], it may be intuitively claimed that the proposed method is applicable universally. Nonetheless, an accurate method would be to prove the viability using real-world data. Though an experimental method as illustrated in this paper is not feasible, both in terms of money and time, fortunately, there exists a large database of crowd-sourced soil and air temperature data [44]. We could use this data and the model presented in this paper to analyze the potential of the proposed energy harvesting method. This is also the main reason behind scripting an accurate mathematical model for the SoTEG. Currently, we have soil and air temperature data from locations in Belgium. By utilizing this data and the model, we aim to estimate the energy production capacity of all the locations. We expect such a model-based study to provide valuable insights into the performance and efficiency of the SoTEG under various environmental and microclimate conditions. Though we have access to data from many other geographical locations, we plan to work with data from Belgium as the first step and later extend it to different datasets.
VI Conclusion
We have presented a detailed discussion on the design, evaluation and performance of a soil-air thermal energy harvester using both real-world experiments and model analysis. The experiments were conducted in an outdoor location in Belgium for 14 days in the winter month, of November. Over the course of the deployment, the harvester combined with a PMU generated power only for 1612 minutes. The examination of the model and data asserts that the heat transfer network has a practical efficiency of around %, requiring at least temperature difference to be available across the radiator and the soil for the SoTEG to start generating energy. In addition, most of the energy generated by the SoTEG is lost across the PMU during the conversion process. An improvement in this situation can be made by enhancing the heat transfer network. Our analysis shows that increasing the number of copper rods in the network to will increase the efficiency to around %.
The model-based investigations further reveal that the performance of SoTEG is closely related to the weather conditions. Solar radiation has a positive influence causing the harvester to generate more energy with increased radiation. On the other hand, wind velocity causes a reduction in power generation in the daytime by increasing convective heat transfer between the radiator and the air. While the wind has a negative impact during the daytime, its influence on the nighttime performance of SoTEG depends on other factors such as soil-air temperature difference and radiator emissivity. As long as the temperature difference between soil and air is enough to be dissipated through radiative heat transfer, the wind tends to have a negative impact. But, when the temperature difference increases such that the radiative heat transfer is not enough to dissipate heat, an increase in wind speed has a positive impact as it enhances the heat removal from the radiator side of the heat sink.
Acknowledgment
The Authors would like to thank Karthick Raj A G, Department of Bioscience Engineering at the University of Antwerp for his assistance with optical measurements of the radiator.
References
- [1] “The 17 goals — sustainable development,” online; accessed: 2024-01-01. [Online]. Available: https://sdgs.un.org/goals
- [2] “Research Infrastructure Position Paper European Infrastructure Powering the Internet of Things,” accessed: 2024-01-01. [Online]. Available: https://www.enables-project.eu/outputs/position-paper
- [3] D. Enescu, “Thermoelectric energy harvesting: basic principles and applications,” Green energy advances, vol. 1, p. 38, 2019.
- [4] L. Hou, S. Tan, Z. Zhang, and N. W. Bergmann, “Thermal energy harvesting wsns node for temperature monitoring in iiot,” IEEE Access, vol. 6, pp. 35 243–35 249, 2018.
- [5] S. Kang, S. Kim, S. Oh, and D. Lee, “Predicting spatial and temporal patterns of soil temperature based on topography, surface cover and air temperature,” Forest Ecology and Management, vol. 136, no. 1-3, pp. 173–184, 2000.
- [6] L. Anatychuk and P. Mikityuk, “Thermal generators using heat flows in soils,” in Proceedings ICT’03. 22nd International Conference on Thermoelectrics (IEEE Cat. No. 03TH8726). IEEE, 2003, pp. 598–601.
- [7] Y. Tian, X. Liu, F. Chen, and Y. Zheng, “Harvesting energy from sun, outer space, and soil,” Scientific reports, vol. 10, no. 1, p. 20903, 2020. [Online]. Available: https://doi.org/10.1038/s41598-020-77900-7
- [8] E. E. Lawrence and G. J. Snyder, “A study of heat sink performance in air and soil for use in a thermoelectric energy harvesting device,” International Conference on Thermoelectrics, ICT, Proceedings, vol. 2002-January, pp. 446–449, 2002.
- [9] S. A. Whalen and R. C. Dykhuizen, “Thermoelectric energy harvesting from diurnal heat flow in the upper soil layer,” Energy conversion and management, vol. 64, pp. 397–402, 2012. [Online]. Available: http://dx.doi.org/10.1016/j.enconman.2012.06.015
- [10] J. W. Stevens, “Performance factors for ground-air thermoelectric power generators,” Energy conversion and management, vol. 68, pp. 114–123, 2013. [Online]. Available: http://dx.doi.org/10.1016/j.enconman.2012.12.029
- [11] S. Pullwitt, U. Kulau, R. Hartung, and L. C. Wolf, “A feasibility study on energy harvesting from soil temperature differences,” in Proceedings of the 7th International Workshop on Real-World Embedded Wireless Systems and Networks, 2018, pp. 1–6. [Online]. Available: https://doi.org/10.1145/3277883.3277886
- [12] S. Pullwitt, P. Tudyka, and L. Wolf, “Leveraging micro energy sources in energy harvesting wireless sensor networks,” 17th Conference on Wireless On-Demand Network Systems and Services, WONS 2022, 2022.
- [13] S. Pullwitt and L. Wolf, “Utilizing natural thermal gradients as micro energy sources for wireless sensor networks,” in 2023 19th International Conference on Distributed Computing in Smart Systems and the Internet of Things (DCOSS-IoT), 2023, pp. 95–102.
- [14] P. Carvalhaes-Dias, A. Cabot, and J. A. S. Dias, “Evaluation of the thermoelectric energy harvesting potential at different latitudes using solar flat panels systems with buried heat sink,” Applied Sciences (Switzerland), vol. 8, 12 2018.
- [15] Y. Huang, D. Xu, J. Kan, and W. Liid, “Study on field experiments of forest soil thermoelectric power generation devices,” Plos One, vol. 14, no. 8, p. e0221019, 2019.
- [16] L. Sigrist, N. Stricker, D. Bernath, J. Beutel, and L. Thiele, “Thermoelectric energy harvesting from gradients in the earth surface,” IEEE Transactions on Industrial Electronics, vol. PP, 2019.
- [17] N. Ikeda, “Soil-monitoring sensor powered by temperature difference between air and shallow underground soil,” Proceedings of the ACM on Interactive, Mobile, Wearable and Ubiquitous Technologies, vol. 4, no. 1, pp. 1–22, 2020. [Online]. Available: https://doi.org/10.1145/3380995
- [18] L. Catalan, A. Garacochea, A. Casi, M. Araiz, P. Aranguren, and D. Astrain, “Experimental evidence of the viability of thermoelectric generators to power volcanic monitoring stations,” Sensors (Switzerland), vol. 20, pp. 1–25, 9 2020.
- [19] S. Assawaworrarit, Z. Omair, and S. Fan, “Nighttime electric power generation at a density of 50 mw/m2 via radiative cooling of a photovoltaic cell,” Applied Physics Letters, vol. 120, no. 14, 2022.
- [20] Y. Ji and S. Lv, “Comprehensive research on a simple and efficient radiative cooling driving thermoelectric generator system for nighttime passive power generation,” Applied Thermal Engineering, vol. 219, p. 119560, 2023.
- [21] “Single‐Stage Thermoelectric Generator,” online; accessed: 2024-01-01. [Online]. Available: https://www.digikey.be/nl/htmldatasheets/production/1958589/0/0/1/tg12-6-datasheet
- [22] “RS PRO Copper Rod 6mm Diameter, 1m L,” online; accessed: 2024-01-01. [Online]. Available: https://docs.rs-online.com/a43d/0900766b8150f814.pdf
- [23] “pure copper sheet, 6"x 6", 24 gauge (0.51mm) thickness, film attached copper sheets,” online; accessed: 2024-01-01. [Online]. Available: https://www.amazon.nl/gp/product/B074V88T1J
- [24] “8329TFS - Thermal Adhesive. Long Working Time, Flowable,” online; accessed: 2024-01-01. [Online]. Available: https://mgchemicals.com/products/adhesives/thermally-conductive-adhesives/thermally-conductive-adhesive/
- [25] “GAMMA heat-resistant lacquer matt black 400 ml,” online; accessed: 2024-01-01. [Online]. Available: https://www.gamma.be/nl/assortiment/gamma-hittebestendige-lak-mat-zwart-400-ml/p/B455023
- [26] “Soudafoam 1K,” online; accessed: 2024-01-01. [Online]. Available: https://www.soudal.com/sites/default/files/soudal_api/document/F0036237_0001.pdf
- [27] S. Kumar and S. Mullick, “Wind heat transfer coefficient in solar collectors in outdoor conditions,” Solar energy, vol. 84, no. 6, pp. 956–963, 2010.
- [28] A. Karn, V. Chintala, and S. Kumar, “An investigation into sky temperature estimation, its variation, and significance in heat transfer calculations of solar cookers,” Heat Transfer—Asian Research, vol. 48, no. 5, pp. 1830–1856, 2019.
- [29] A. Albatayneh, D. Alterman, A. Page, and B. Moghtaderi, “The significance of sky temperature in the assessment of the thermal performance of buildings,” Applied Sciences, vol. 10, no. 22, p. 8057, 2020.
- [30] P. P. Puluckul, R. K. Singh, and M. Weyn, “TEGBed: A thermal energy harvesting testbed for batteryless internet of things,” Internet of Things, p. 101060, 2024. [Online]. Available: https://www.sciencedirect.com/science/article/pii/S2542660524000027
- [31] “LTC3109 Auto-Polarity, Ultralow Voltage Step-Up Converter and Power Manager,” online; accessed: 2024-01-01. [Online]. Available: https://www.analog.com/en/products/ltc3109.html
- [32] P. P. Puluckul and M. Weyn, “: An energy surveying tool for energy harvesting applications,” Article in preperation.
- [33] “Ultra Low power Harvester power Management IC with boost charger, and Nanopower Buck Converter,” online; accessed: 2024-01-01. [Online]. Available: https://www.ti.com/product/BQ25570
- [34] P. R. Michael, D. E. Johnston, and W. Moreno, “A conversion guide: Solar irradiance and lux illuminance,” Journal of Measurements in Engineering, vol. 8, pp. 153–166, 2020.
- [35] “Solcast, 2019. Global solar irradiance data and PV system power output data,” online; accessed: 2024-01-01. [Online]. Available: https://solcast.com/
- [36] M. Sodhi, L. Banaszek, C. Magee, and M. Rivero-Hudec, “Economic lifetimes of solar panels,” Procedia CIRP, vol. 105, pp. 782–787, 2022, the 29th CIRP Conference on Life Cycle Engineering, April 4 – 6, 2022, Leuven, Belgium. [Online]. Available: https://www.sciencedirect.com/science/article/pii/S2212827122001317
- [37] “Global LCOE and Auction values — irena.org,” https://www.irena.org/Data/View-data-by-topic/Costs/Global-LCOE-and-Auction-values, online;Accessed 10-04-2024.
- [38] X. Jia and Q. Guo, “Design study of bismuth-telluride-based thermoelectric generators based on thermoelectric and mechanical performance,” Energy, vol. 190, p. 116226, 2020.
- [39] P. Górszczak, M. Rywotycki, S. K\kac, and M. Borówka, “Increase in the efficiency of electricity production with a thermoelectric generator (teg),” Journal of Thermal Analysis and Calorimetry, vol. 148, no. 24, pp. 13 973–13 981, 2023.
- [40] L. C. Ding, A. Akbarzadeh, and A. Date, “Performance and reliability of commercially available thermoelectric cells for power generation,” Applied Thermal Engineering, vol. 102, pp. 548–556, 2016.
- [41] E. Hatzikraniotis, K. Zorbas, I. Samaras, T. Kyratsi, and K. Paraskevopoulos, “Efficiency study of a commercial thermoelectric power generator (teg) under thermal cycling,” Journal of Electronic Materials, vol. 39, pp. 2112–2116, 2010.
- [42] R. Merienne, J. Lynn, E. McSweeney, and S. O’Shaughnessy, “Thermal cycling of thermoelectric generators: The effect of heating rate,” Applied energy, vol. 237, pp. 671–681, 2019.
- [43] W. Park, M. T. Barako, A. M. Marconnet, M. Asheghi, and K. E. Goodson, “Effect of thermal cycling on commercial thermoelectric modules,” in 13th InterSociety Conference on Thermal and Thermomechanical Phenomena in Electronic Systems. IEEE, 2012, pp. 107–112.
- [44] J. J. Lembrechts, J. van den Hoogen, J. Aalto, M. B. Ashcroft, P. De Frenne, J. Kemppinen, M. Kopeckỳ, M. Luoto, I. M. Maclean, T. W. Crowther et al., “Global maps of soil temperature,” Global change biology, vol. 28, no. 9, pp. 3110–3144, 2022.
![[Uncaptioned image]](/html/2405.02986/assets/Figures/Priyesh.jpeg) |
Priyesh Pappinisseri Puluckul Priyesh Pappinisseri Puluckul completed his MS(Research) in Telecommunication Technology and Management from the Indian Institute of Technology Delhi, in 2017. During his masters, he extensively worked with energy-conserving mechanisms for Wireless Sensor Networks and was actively involved in many research projects funded by the DST, India. In 2017, he along with his colleagues co-founded Aquasense, a startup building innovative solutions for groundwater level monitoring in India. He served as the CTO of Aquasense from 2017 to 2019. In late 2019, he joined imec, Belgium as a Marie Curie Early-Stage Researcher in the FutreArcitc ITN. Currently, he is affiliated with IDLab-imec as a PhD researcher where his research mainly focuses on battery-free sensing and energy harvesting. |
![[Uncaptioned image]](/html/2405.02986/assets/Figures/maarten.jpeg) |
Maarten Weyn Maarten Weyn is an industrial engineer in electronics-ict and received his PhD in Computer Science from the University of Antwerp, Belgium. He is a full professor at the University of Antwerp, vice-dean of research of the faculty of Applied Engineering and deputy chair of the Industrial Research Fund of the University of Antwerp. He currently teaches the courses Mobile Communication, Telecommunications and the master courses Communication Systems and Internet of Things: Low Power Embedded Communication in the department Electronics-ICT. Maarten is a lecturer in the LoraWAN Academy on the topic of localization and a lecturer in some courses on Coursera on Embedded IoT systems. His research in the imec-IDLab research group focuses on ultra-low power sensor communication and embedded systems, sub 1-Ghz communication, sensor processing and localization. He is the co-founder of the spin-offs Aloxy, CrowdScan, IoSa and AtSharp, involved in the creation of the spin-offs 1OK and Viloc and actively collaborated as a creator in the Canvas program Team Scheire. |