Importance of Gas Heating in Capacitively Coupled Radiofrequency Plasma-assisted Synthesis of Carbon Nanomaterials
Abstract
In pursuit of diamond nanoparticles, a capacitively-coupled radio frequency (CCRF) flow-through plasma reactor was operated with methane-argon gas mixtures. Signatures of the final product obtained microscopically and spectroscopically indicated that the product was an amorphous form of graphite. This result was consistent irrespective of combinations of the macroscopic reactor settings. To explain the observed synthesis output, measurements of C2 and gas properties were carried out by laser-induced fluorescence and optical emission spectroscopy. Strikingly, the results indicated a strong gas temperature gradient of 100 K per mm from the center of the reactor to the wall. Based on additional plasma imaging, a model of hot constricted region (filamentation region) was then formulated. It illustrated that, while the hot constricted region was present, the bulk of the gas was not hot enough to facilitate diamond formation: characterized by much lower reaction rates, when compared to , formation kinetics are expected to become exponentially slow. This result was further confirmed by experiments under identical conditions but with a H2/CH4 mixture, where no output material was detected: if graphitic formation was expected as the main output material from the methane feedstock, atomic hydrogen would then be expected to etch it away in situ, such that the net production of that -hybridized solid material is nearly a zero.
I Introduction
Low-temperature plasmas (LTP) have been an enabling technology and indispensable tool for the microelectronics and semiconductor industry.Graves et al. (2023) The critical importance of LTP technologies keeps growing in the modern era of sub-10 nm node 3D integration, where UV lithography, etching, passivation and ultrathin film growth are the most critical steps of optoelectronic integrated circuits fabrication and integration. At the same time, LTP-based syntheses occupy a special place in semiconductor nanomaterial manufacturing which is important in photovoltaics, optoelectronics, and quantum information sciences.Hori and Niemira (2017); Kortshagen et al. (2016) Among other types of LTP reactors, sub-atmospheric capacitively coupled RF continuous flow-through reactors gained a lot of attention and implementations since the early 2000s due to their simplicity, high production rates/material yields, simple means of material collection and post-synthesis treatment and integration (including 3D printing).Anthony and Kortshagen (2009); Kortshagen (2016); Mangolini and Kortshagen (2007); Woodard et al. (2018); Exarhos et al. (2018); Thimsen et al. (2015); Uner et al. (2019); Izadi and Anthony (2019); Mandal et al. (2018); Ho et al. (2021); Dsouza et al. (2023); Askari et al. (2015); Nozaki et al. (2007) By now, flow- through CCRF LTP reactors succeeded in creating a profound list of compound (oxide, sulfide, nitride, and phosphide) and elemental group IV semiconductors.Kortshagen et al. (2016) To date, syntheses of Group IV nanomaterials have included well-established and vetted synthetic routes for Si, Ge, and SiGe nanocrystalsMangolini et al. (2005); Pi and Kortshagen (2009); Gresback et al. (2007), SiC, and graphite or moieties of carbon, but never diamond itself.
Historically, microwave plasma-assisted CVD is used to deposit diamonds in bulk thin film form where substrate surface kinetics governs the growth. Gas phase diamond nucleation and growth is a subject that was studied much less. In the 1970s, Deryagin proposed the possibility of nucleating diamond in the gas phase inside a plasma.Deryagin and Fedoseev (1979) Experimental work on gas-phase nucleation was conducted by Frenklach at Penn State using a low-pressure microwave plasma. As-synthesized materials had to be treated and purified before sub-micron diamond crystals could be retrieved thereby proving Deryagin’s hypothesis.Frenklach et al. (1989) At that time, there were a limited number of reports corroborating the results by Frenklach and co-workers. Much later, Sankaran produced nano-diamonds using a dc atmospheric pressure flow-through micro-discharge plasma.Kumar et al. (2013) Synthesis of diamond nanocrystals in CCRF flow-through reactors remains elusive. Given the scarcity of characterization results of the plasmas that successfully produced nano-diamonds, the conditions required for nanocrystals of -bonded carbon (i.e. nano-diamond) synthesis are not well known.
At face value, this synthesis route to diamond nanocrystals appears obvious, when compared to that of silicon nanocrystals. If diamond cubic Si nanocrystals are synthesized in SiH4/Ar plasmas, then simple switching to CH4/Ar plasma would be expected to produce diamond cubic diamond nanocrystals. Such a switching was successfully implemented in CVD reactors at the Argonne National Lab where ultra-nano-crystalline-diamond (UNCD) was patented and trademarked.Auciello (2022) In this work, we study this trivial switching in a moderate pressure flow through CCRF reactor and find that carbon allotropy plays the critical role in engineering plasma and gas phase conditions to successful diamond nano-crystal synthesis by LTP flow through reactors.
II Experiment
II.1 Reactor Setup and Sample Characterization
The syntheses were carried out in a flow-through tubular reactor. A schematic of the reactor is shown in Fig. 1. The gases used for the synthesis were argon (or hydrogen) and methane, where methane was the carbon precursor for the reaction. The reactor consisted of a 1.27 cm outer diameter quartz cylindrical tube of length 23.5 cm to which the gas mixture of 100 standard cubic centimeters per minute (sccm) of argon (or hydrogen) and 2 sccm of methane flowed via mass flow meters (Alicat Inc.). The total pressure measured upstream of the reaction region was between 4-4.2 Torr. RF power of 200 W at 13.56 MHz from the power supply (AG0313, T&C Power Conversion) was delivered to the reactor via a copper ring electrode placed around the tube, with a ground electrode placed 3.5 cm downstream of the powered electrode. An impedance matching network (MFJ 989D) was used in addition to the power supply to minimize the reflected power.
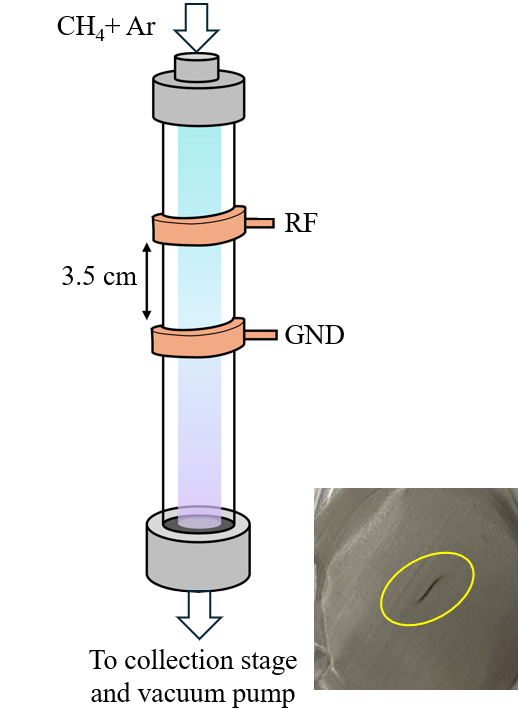
Nanomaterials were collected on stainless steel meshes or Si coupons placed downstream of the reactor. Samples were characterized using scanning electron microscopy (SEM) on a Verios 460XHR instrumentand visible (532 nm) and UV (325 nm) Raman spectroscopy with Horiba LabRAM ARAMIS Raman instrument.
II.2 Laser Induced Fluorescence (LIF)
LIF was used to measure the absolute densities of carbon dimer C2 as one of the suspected pre-cursors for the synthesis of carbon nanomaterials generated from the plasma-induced reactions inside the reactor.Yatom et al. (2018, 2017); Stratton et al. (2018) The LIF approach is a versatile tool for the absolute density measurement of atoms and molecules, including C2.Vekselman et al. (2018) An Nd: YAG+OPO tunable laser systemYatom and Dobrynin (2022); Yatom et al. (2023) was used to generate the laser pulse at 438.8 nm, to excite the (2,0) swan band transitions, and the fluorescence from the corresponding excitation was detected around 470 nm. The excitation beam was generated by a Nd: YAG laser producing nanosecond duration laser pulses with a frequency of 20 Hz. The laser beam is shaped with a cylindrical lens into a laser sheath with a height of 4.2 mm and width of 754 m.
The laser energy was limited to 650 J per pulse. The beam passed through the cylindrical tube from one end to the other and was terminated with the help of a beam dump placed at the other side of the reactor (see LIF schematic). The fluorescence signal is observed in a direction normal to the incoming excitation beam. A mechanical slit was situated on the detection axis, with its position and width adjusted to eliminate reflections from the sides of the tube. The detector (iCCD camera PiMAX4, Princeton Instruments, Gen III HBf intensifier) was used with a spectral filter (470 nm, FWHM 10 nm). The camera gate and the laser pulse are synchronized with the help of a pulse delay generator (BNC 575-4C).
II.3 Optical emission spectroscopy (OES)
Broadband OES was performed using Ocean Optics HR2000+ spectrometer for preliminary detection of various species present in the plasma. For the measurement of gas temperature, high-resolution OES (HROES) was performed using (HRS SpectraPro 750 monochromator coupled with PiMAX4 iCCD camera) to detect CH(A-X) and C2 emissions. In the HROES setup the whole length of the discharge tube was imaged (with demagnification) on the spectrometer slith (14 mm), so that the obtained spectra contain spatially resolved emission from all the investigated locations along the vertical axis of the iCCD screen, while the horizontal axis corresponds to the dispersion axis. A similar approach was utilized in earlier work on plasma characterization.Yatom and Raitses (2020)
III Results
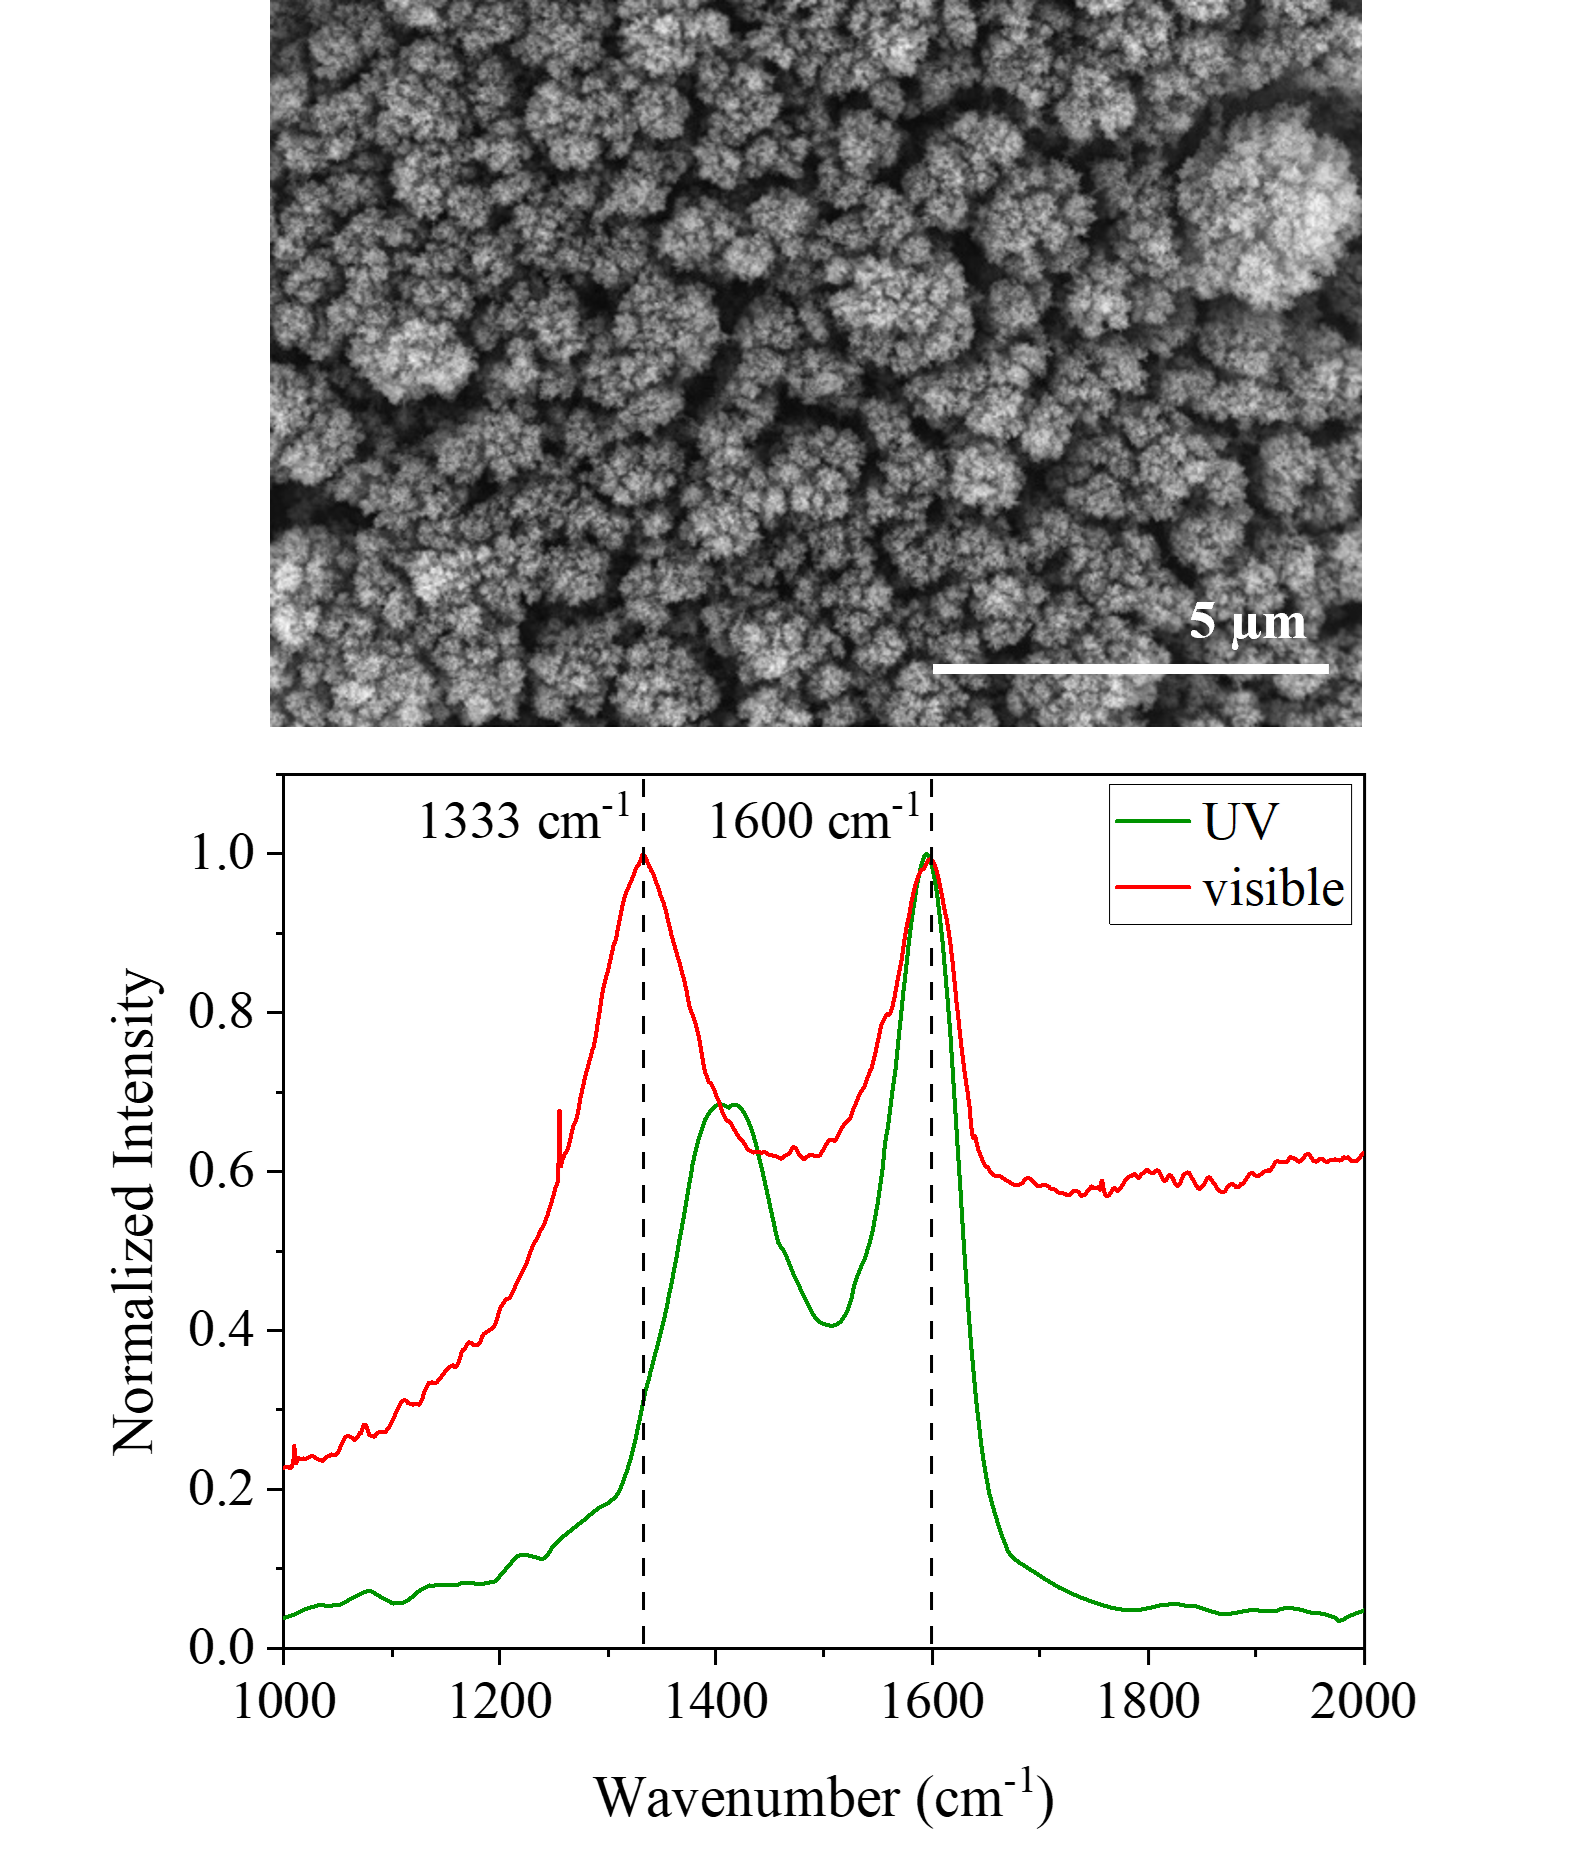
Fig. 2 (top) shows the SEM image of the synthesized nanomaterial exhibiting agglomerated carbon colonies indicating its amorphous nature. The Raman spectra from Fig. 2 (bottom) shows broad D and G bands from the visible Raman typical to bonded carbon. The absence of a 1333 cm-1 peak in the UV Raman spectrum indicates the lack of any bonded carbon in the sample. These characterization findings raise the question of why crystalline carbon allotropes like graphite, diamond, or lonsdaleite were not created within the reactor parameters studied here. With Si or other materials, the primary variable responsible for crystallization is the temperature of the growing nanomaterial environment (as realized via the delivered power to the reactor),Anthony and Kortshagen (2009); Galli and Kortshagen (2009); Mangolini and Kortshagen (2009); Lopez and Mangolini (2014) and so it is important to get an estimate of the gas temperature inside the reactor along with the reactive species responsible for the formation of the obtained amorphous carbon.
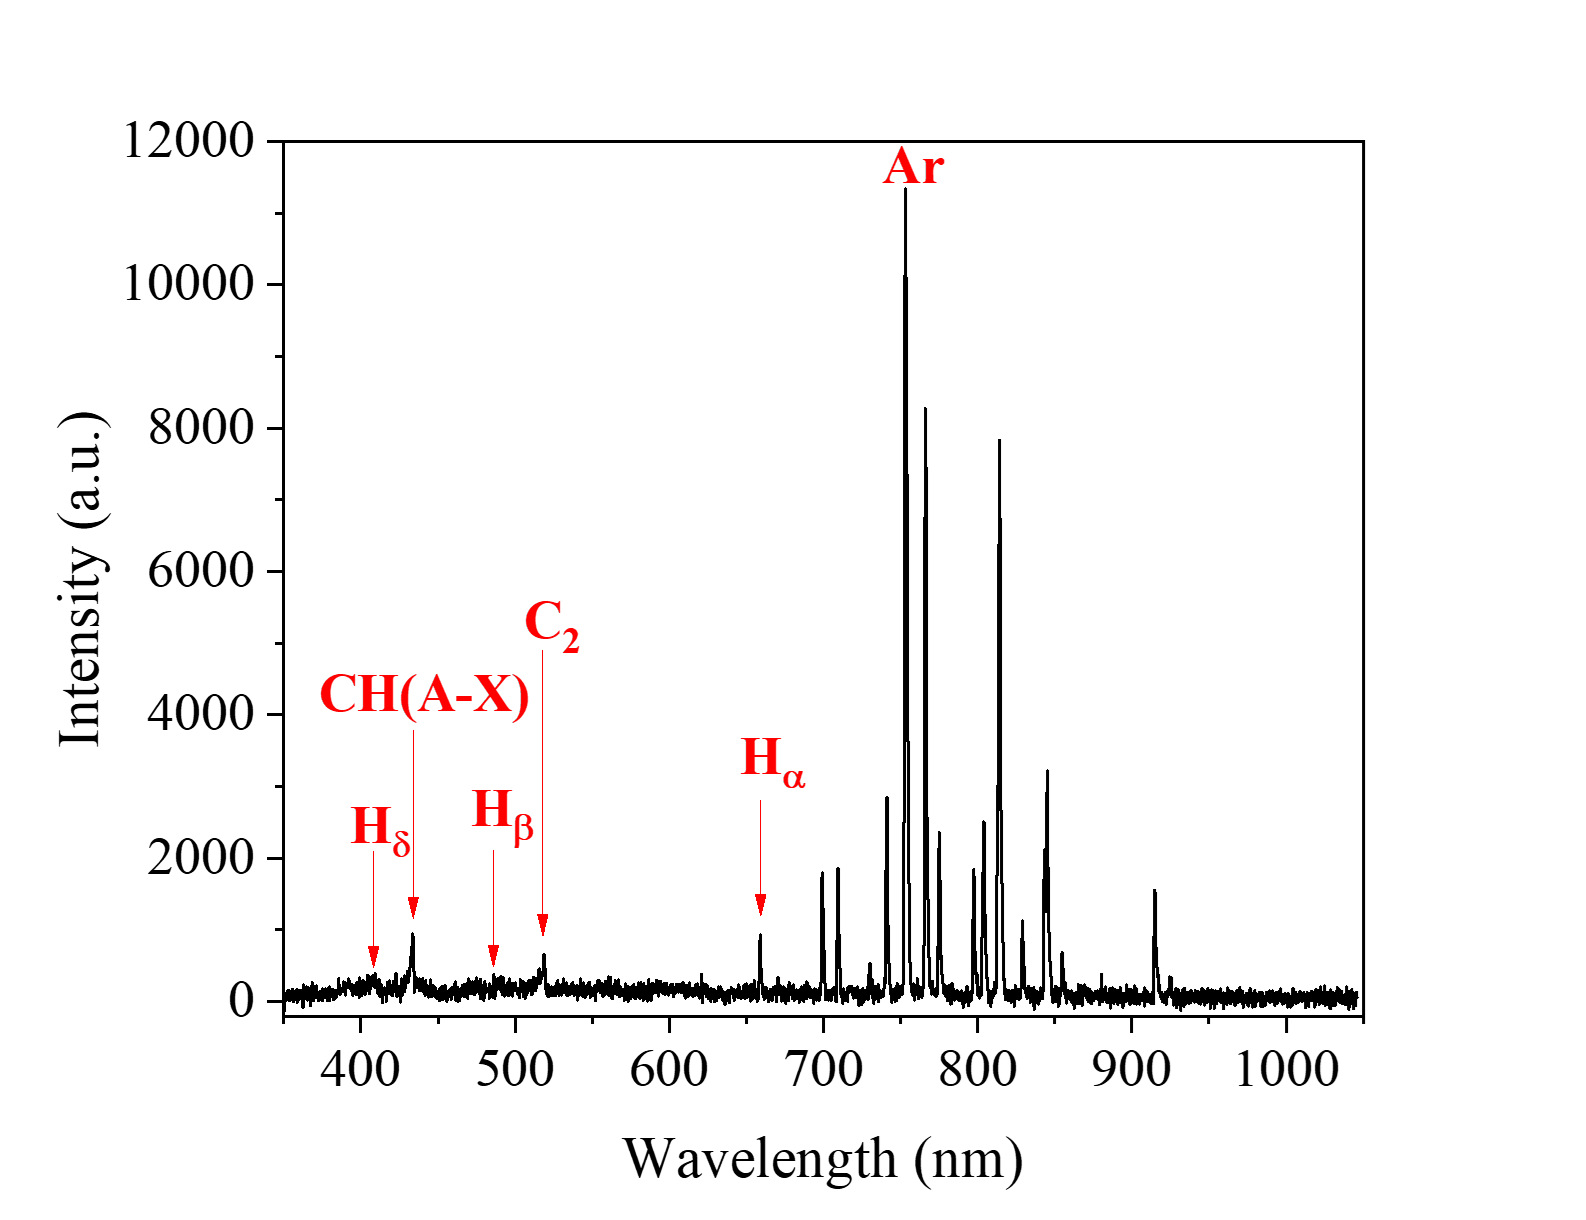
To identify the reactive species present in our reactor, we carried out a preliminary broadband OES, which revealed the presence of C2, CH, H, and Ar lines. The OES spectrum for the Ar/CH4 plasma is shown in Fig. 3.
Since C2 is attributed to play a major role in carbon formation,Mahoney et al. (2019) LIF was performed using the swan band transitions in C2 to quantify its number density in our reactor. The LIF signal is related to the total number density (m-3) of the target species by the following equation:Luque et al. (1997a)
| (1) |
where = 0.00655 is the Boltzmann factor calculated following the method stated by Luque et al.Luque et al. (1997b) using the rotational and vibrational temperature of 825 K and 2827 K, respectively corresponding to the C2 emission spectrum(discussed later in this section) from the following relation:
| (2) |
where and are the vibrational and rotational energies, is the rotational degeneracy. , , and are the vibrational, rotational and electronic partition functions, respectively. The energies of the rotational and vibration states are calculated from ,Hollas (2004) where is the effective rotational constant and is the rotational energy level; where is the quantum energy level, cm-1 is the vibrational wavenumber and cm-1 is the anharmonic constant. Taking into account the vibrational dependence of the rotational constant, is further expressed as where cm-1 is the vibration-rotation interaction constant and cm-1 is the rotational constant of the equilibrium state. All the constants used in the calculations have been taken from Ref. Huber and Herzberg, 1979.
m2J-1s-1 is the absorption coefficient for laser excited rotational transition as given in Ref. Luque et al., 1997a; ms-1 is the speed of light; J is the laser energy; is the line shape overlap integral obtained using the process stated in Ref. Partridge and Laurendeau, 1995; m-1 is the laser bandwidth; is the fluorescence quantum yield, where is the effective lifetime shortened by quenching calculated from the time-resolved exponential decay of the LIF signal using Ref. Luque et al., 1997a and ns is the radiative lifetime value corresponding to C2 as given in Ref. Luque et al., 1997a. is the fraction of light emitted by the pumped transition in the collected spectral region. is the solid angle of the laser-probed volume . is the transmission efficiency of the optics, is the photoelectric efficiency of the photomultiplier, and is the laser cross-section area.
The term is determined by the calibration measurements of Rayleigh scattering of air. The Rayleigh signal of the incident light collected at a normal angle is given by the following relation:Luque et al. (1997a)
| (3) |
where is the gas number density, pressure atm or 101325 Pa, JK-1 is the Boltzmann constant, and gas temperature K; Js is the Planck’s constant; m-1 is the wavenumber of the scattered photon; m2sr-1 is the Rayleigh cross section corresponding to the polarizability of air m3 and depolarization ratio of air calculated using Ref. Reichardt et al., 2003. The slope of the plot vs (), obtained by varying from 1.7 to 17 mJ at atmospheric pressure, is used to calculate the term which is plugged in Eq. 1 to give the absolute number density of C2 m-3. This concentration of in the highly collisional plasma is sufficient for the formation of phase carbon nanomaterial.Luque et al. (1997a); Kruis et al. (1994)
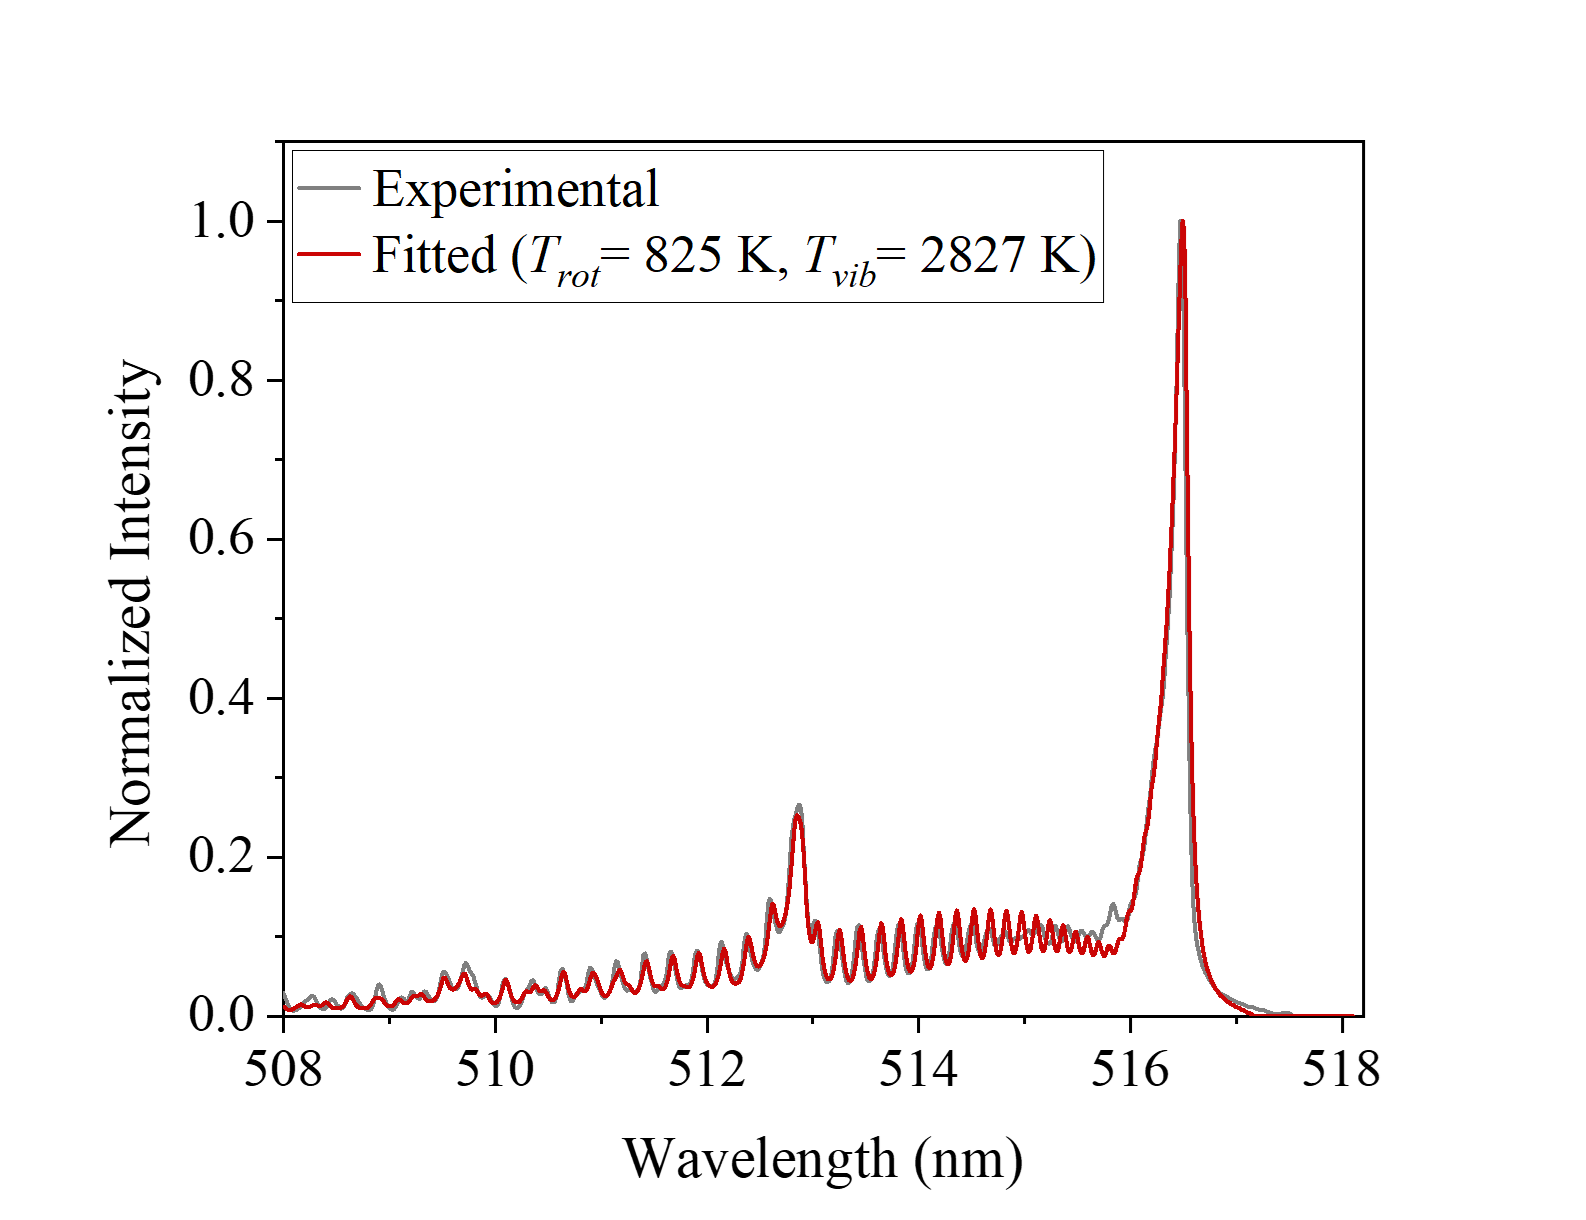
To estimate the gas temperature in the reactor during synthesis, HROES was used to measure the C2 emission spectrum around 516 nm and was fitted in Specair softwarespe to give a rotational temperature of 825 K and a vibrational temperature of 2827 K (see Fig. 4). To extrapolate the reactor gas temperature from this measurement requires the assumption that there is thermal equilibrium among the heavy species in the plasma (though the electrons have much higher energies), and that the rotational temperature is similar to the gas temperature.Bruggeman et al. (2014) From these assumptions, the C2 spectrum indicated the gas temperature of K in the reactor. This temperature is too low to induce crystallization via gas heating because crystallization temperatures of graphite or diamond exceed 1300 K. Furthermore, in a previous study, the authors reported that higher temperature promotes graphitization in CVD systems.Nikhar et al. (2020)
The gas temperature finding of K deserves closer consideration. In capacitively coupled flow-through reactors, gas temperature has been said to remain close to room temperature, exceeded only by a couple of hundred Kelvin.Agarwal et al. (2012) In the present study, the variable in question is apparently high in the traditional sense. Outside wall temperature measured by an attached thermocouple indicates that there must be a temperature gradient from the reaction zone (high temperature) to the wall (low temperature).
IV Discussion
The most plausible hypothesis that could explain self-consistently the extreme thermal gradient in the reactor ( K between centerline and wall) and, otherwise the overall amorphous product output is the presence of a hot filamentary region (in other words, plasma constriction) in the centerline of the reactor. If this were true, then RF power would be absorbed by the constricted plasma, thereby immensely increasing the power density and hence heating it to the condition of a hot wire. The rest of the reactor where gas flows at a given velocity would then receive additional heating through thermal conductivity and diffusivity.
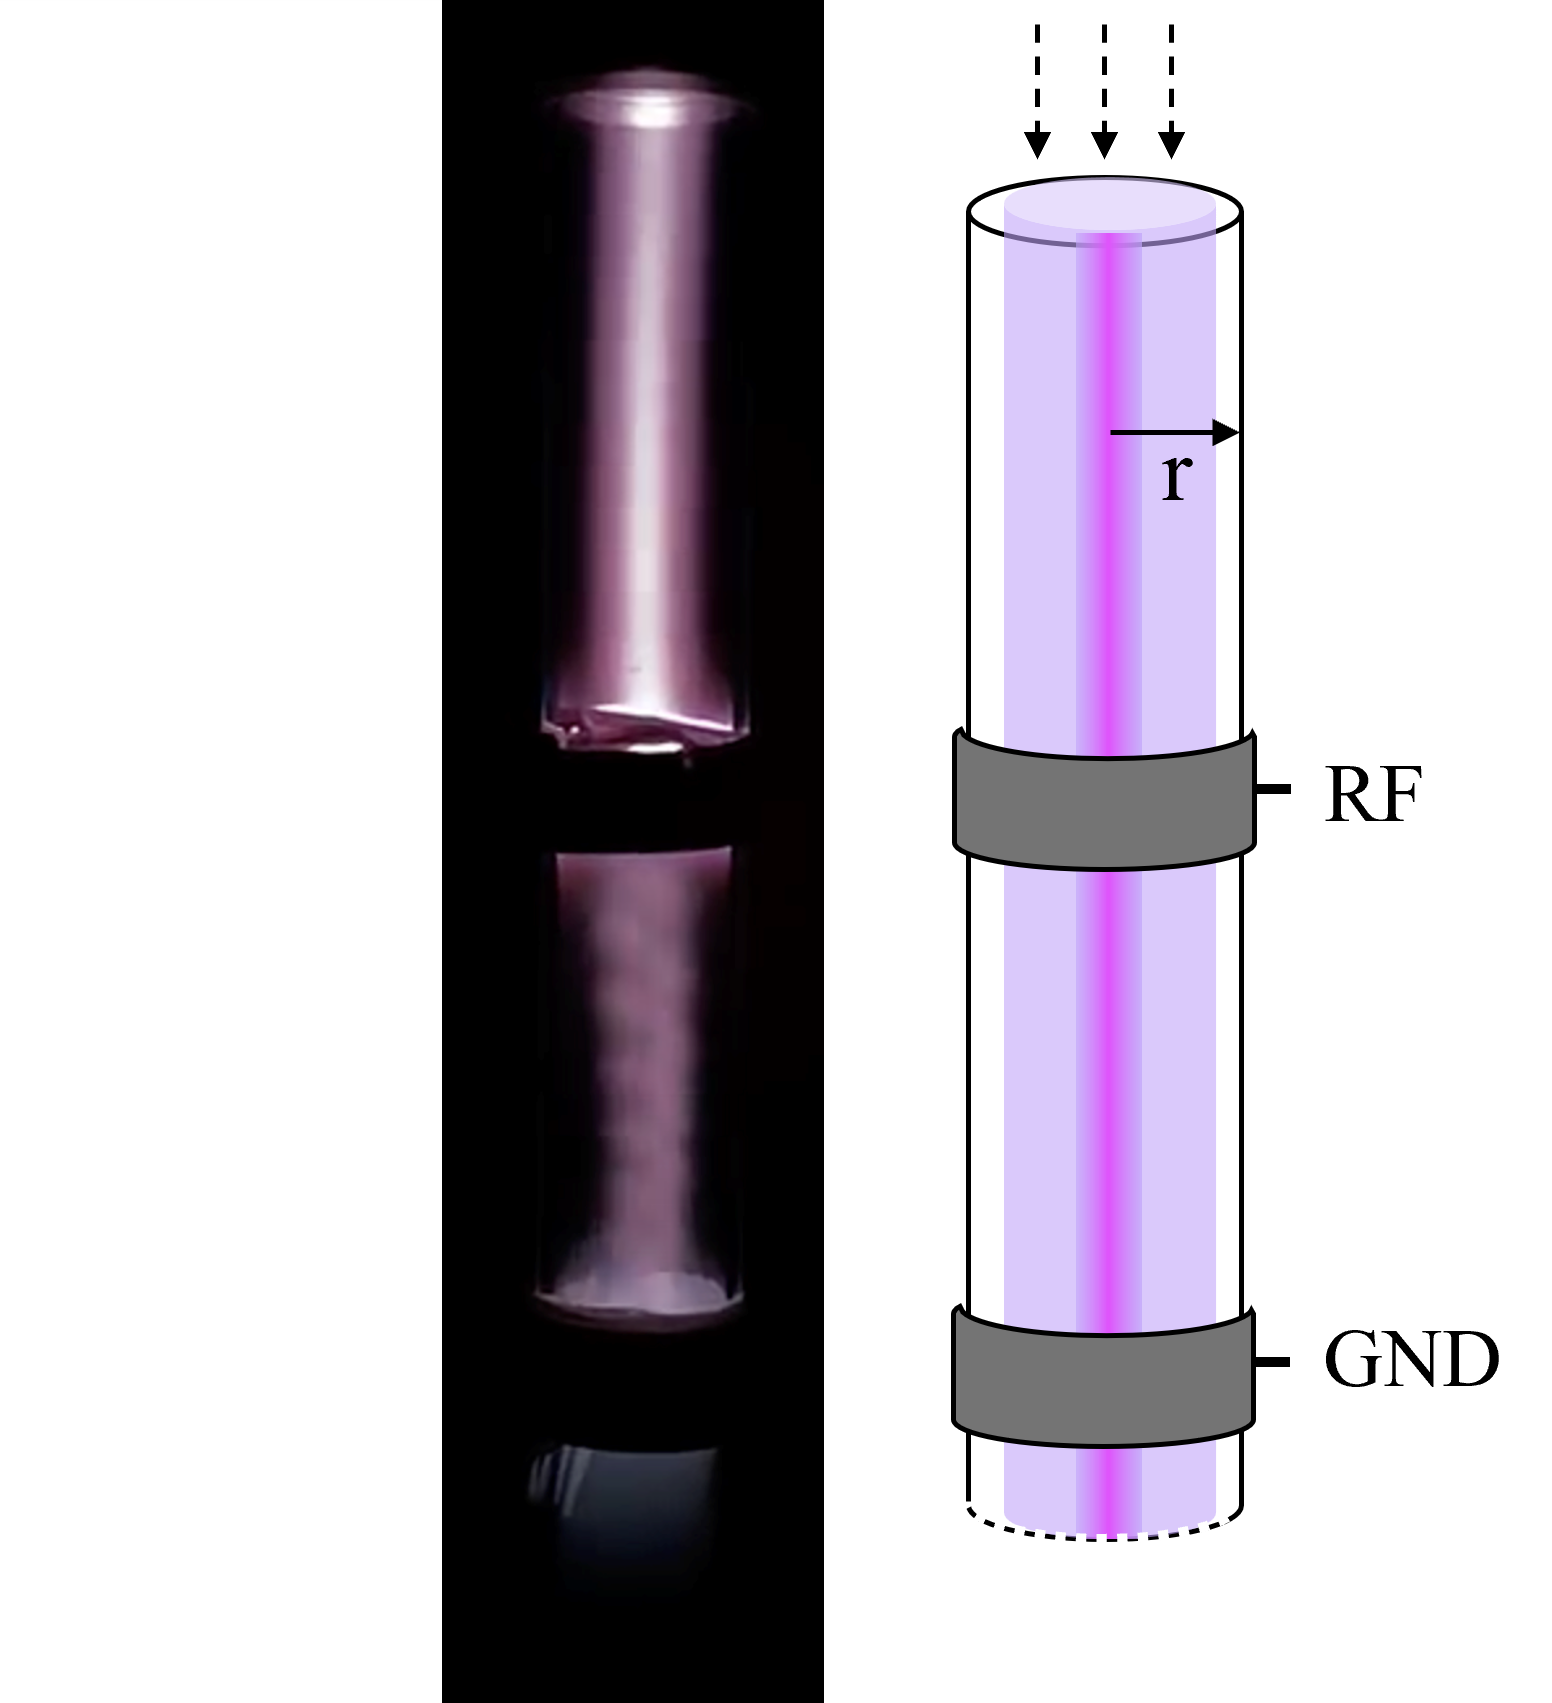
To prove this hypothesis, first, a separate experiment in a 1-inch tube (same reactor parameters as described in Section II.1) was conducted to exaggerate the spatial dimension and better visualize any potential constricted region. The result is shown in Fig. 5(left), in which a bright straight columnar structure in the middle of the reactor can be seen. This observation is then converted into a model representation shown in Fig.5(right). To connect the hot wire observation to the measurement results, the applied power portion absorbed by the plasma (i.e. electrons) and not the sheath must be determined. A formula derived by Godyak Godyak et al. (1991) was used. Eq. 4 represents the ratio between the power absorbed by the ions in the sheath and the power absorbed by electrons:
| (4) |
Here, is the ion Bohm velocity at the plasma-sheath edge, with being the electron charge, being the state of charge of ions, and being the electron temperature. Since CH4 is a minor fraction of the feedstock mixture dominated by the argon flow, it is plausible to assume that the gas properties are largely defined by those of argon. Hence, can be approximated as the argon atom mass. With eV,Godyak and Piejak (1990) kg, becomes ms-1. is the plasma frequency with being electron concentration being the electron mass and being the vacuum permittivity. With m-3,Moravej et al. (2004); Godyak and Piejak (1990) kg, and F/m, becomes s-1. is the electron-neutral collision frequency. Using a scaling for argon from RaizerRaizer (1997) as Torr s-1Torr-1, becomes s-1 for Torr. With cm, where is the distance between the electrodes as shown in Fig. 1, and the source frequency of 13.56 MHz converted to s-1, we finally find . Next, the input power can be written as . Then, a new relation for the finalized can be written:
| (5) |
where is the matchbox efficiency. With assumed =0.7, the nominal input power of 200 W results in 8.5 W given to the electrons.
Because the ionization degree of the studied discharge was low, it is then plausible to treat the reactor medium as a neutral gas. Further on, assuming that the gas properties are largely defined by those of argon, the plasma is approximated as a thin hot wire source. Mathematically, the hot wire model, shown in Fig. 5(right), can be expressed by the gas heating Assael et al. (2023) as:
| (6) |
where , is the thermal diffusivity, is the thermal conductivity, and is the linear power density. Eq. 6 quantifies the gas heating relative to the room temperature of 300 K at different coordinates , from the reactor center to the wall, as a function of time .
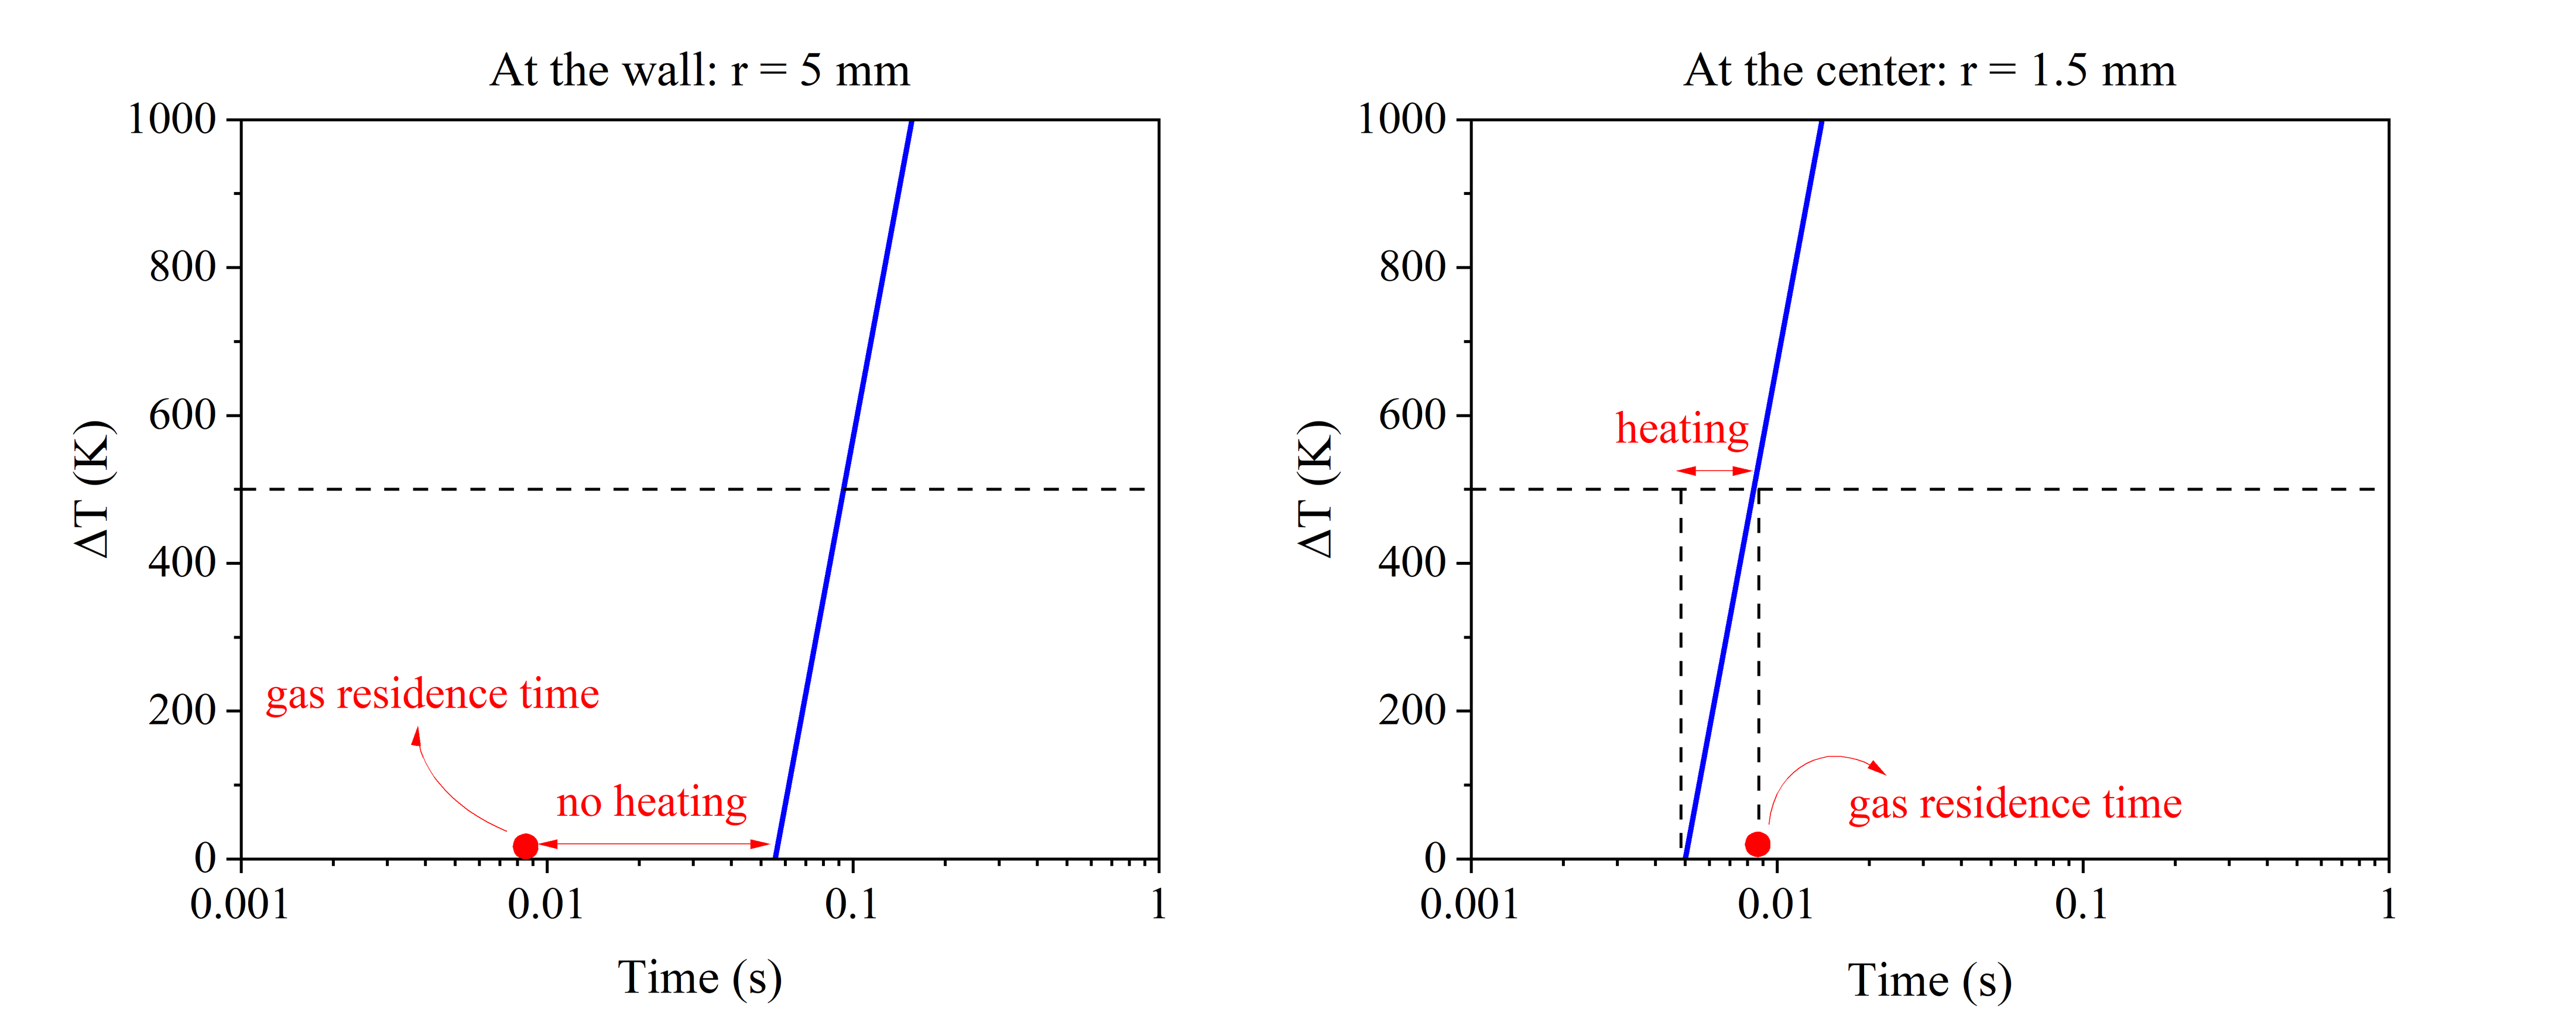
Since the atom-atom mean free path is much smaller than the radius of the tube, we use the thermophysical data presented in Ref. Sun and Venart, 2005 to find m2s-1 and WmK-1. From Eq. 6, the plot presented in Fig. 6 (left), shows a striking result: to enhance a measurable temperature increase on the wall, the gas flowing through the reactor has to spend at least s. At the same time, the residence time of the gas is only 0.0087 s, calculated as follows:
| (7) |
where is the flow rate in sccm, is the atmospheric pressure of 760 Torr and is the operating reactor pressure, and 60/1 is the minute-to-second conversion. With Torr, Eq. 7 yields the noted residence time of 0.0087 s and a gas flow velocity of 4.03 ms-1. On the other hand, at the center of tube, as shown in Fig. 6 (right), this residence time is enough to increase the gas temperature by K above room temperature. The analytically obtained distance of 1.5 mm of gas heating from the center of the tube appears to be consistent with the filament dimension observed visually in the reactor.
Hence, from the model results it is seen that the main body (right outside the hot filament) of the discharge is cold. These results now can be used to explain the synthetis results. Once methyl radical is generated from a methane molecule, the activation energy for the initial step ∙CH3 ∙CH3 ∙C2H6 to eventually form an adamantane molecule is high, close or above 13 kJmol-1 with a reaction rate cm3s-1.Forst (1991) To counter this limited kinetics, a higher gas temperature is required. At the same time, graphitic reactions are expected to be virtually barrierlessFedoseev et al. (1979) explaining immense product formation in cold Ar/CH4 discharge. The cold gas medium does not allow to crystallize leaving it in an amorphous state. While the same process should be happening in H2/CH4, phase is immediately etched by atomic hydrogen with net zero product effect. The nonexistence of Si allotropy is the main reason of successful and well-developed Si syntheses with capacitively coupled RF continuous flow-through reactors, where ∙SiH3 ∙SiH3 reactions are barrierless.Matsui et al. (1987)
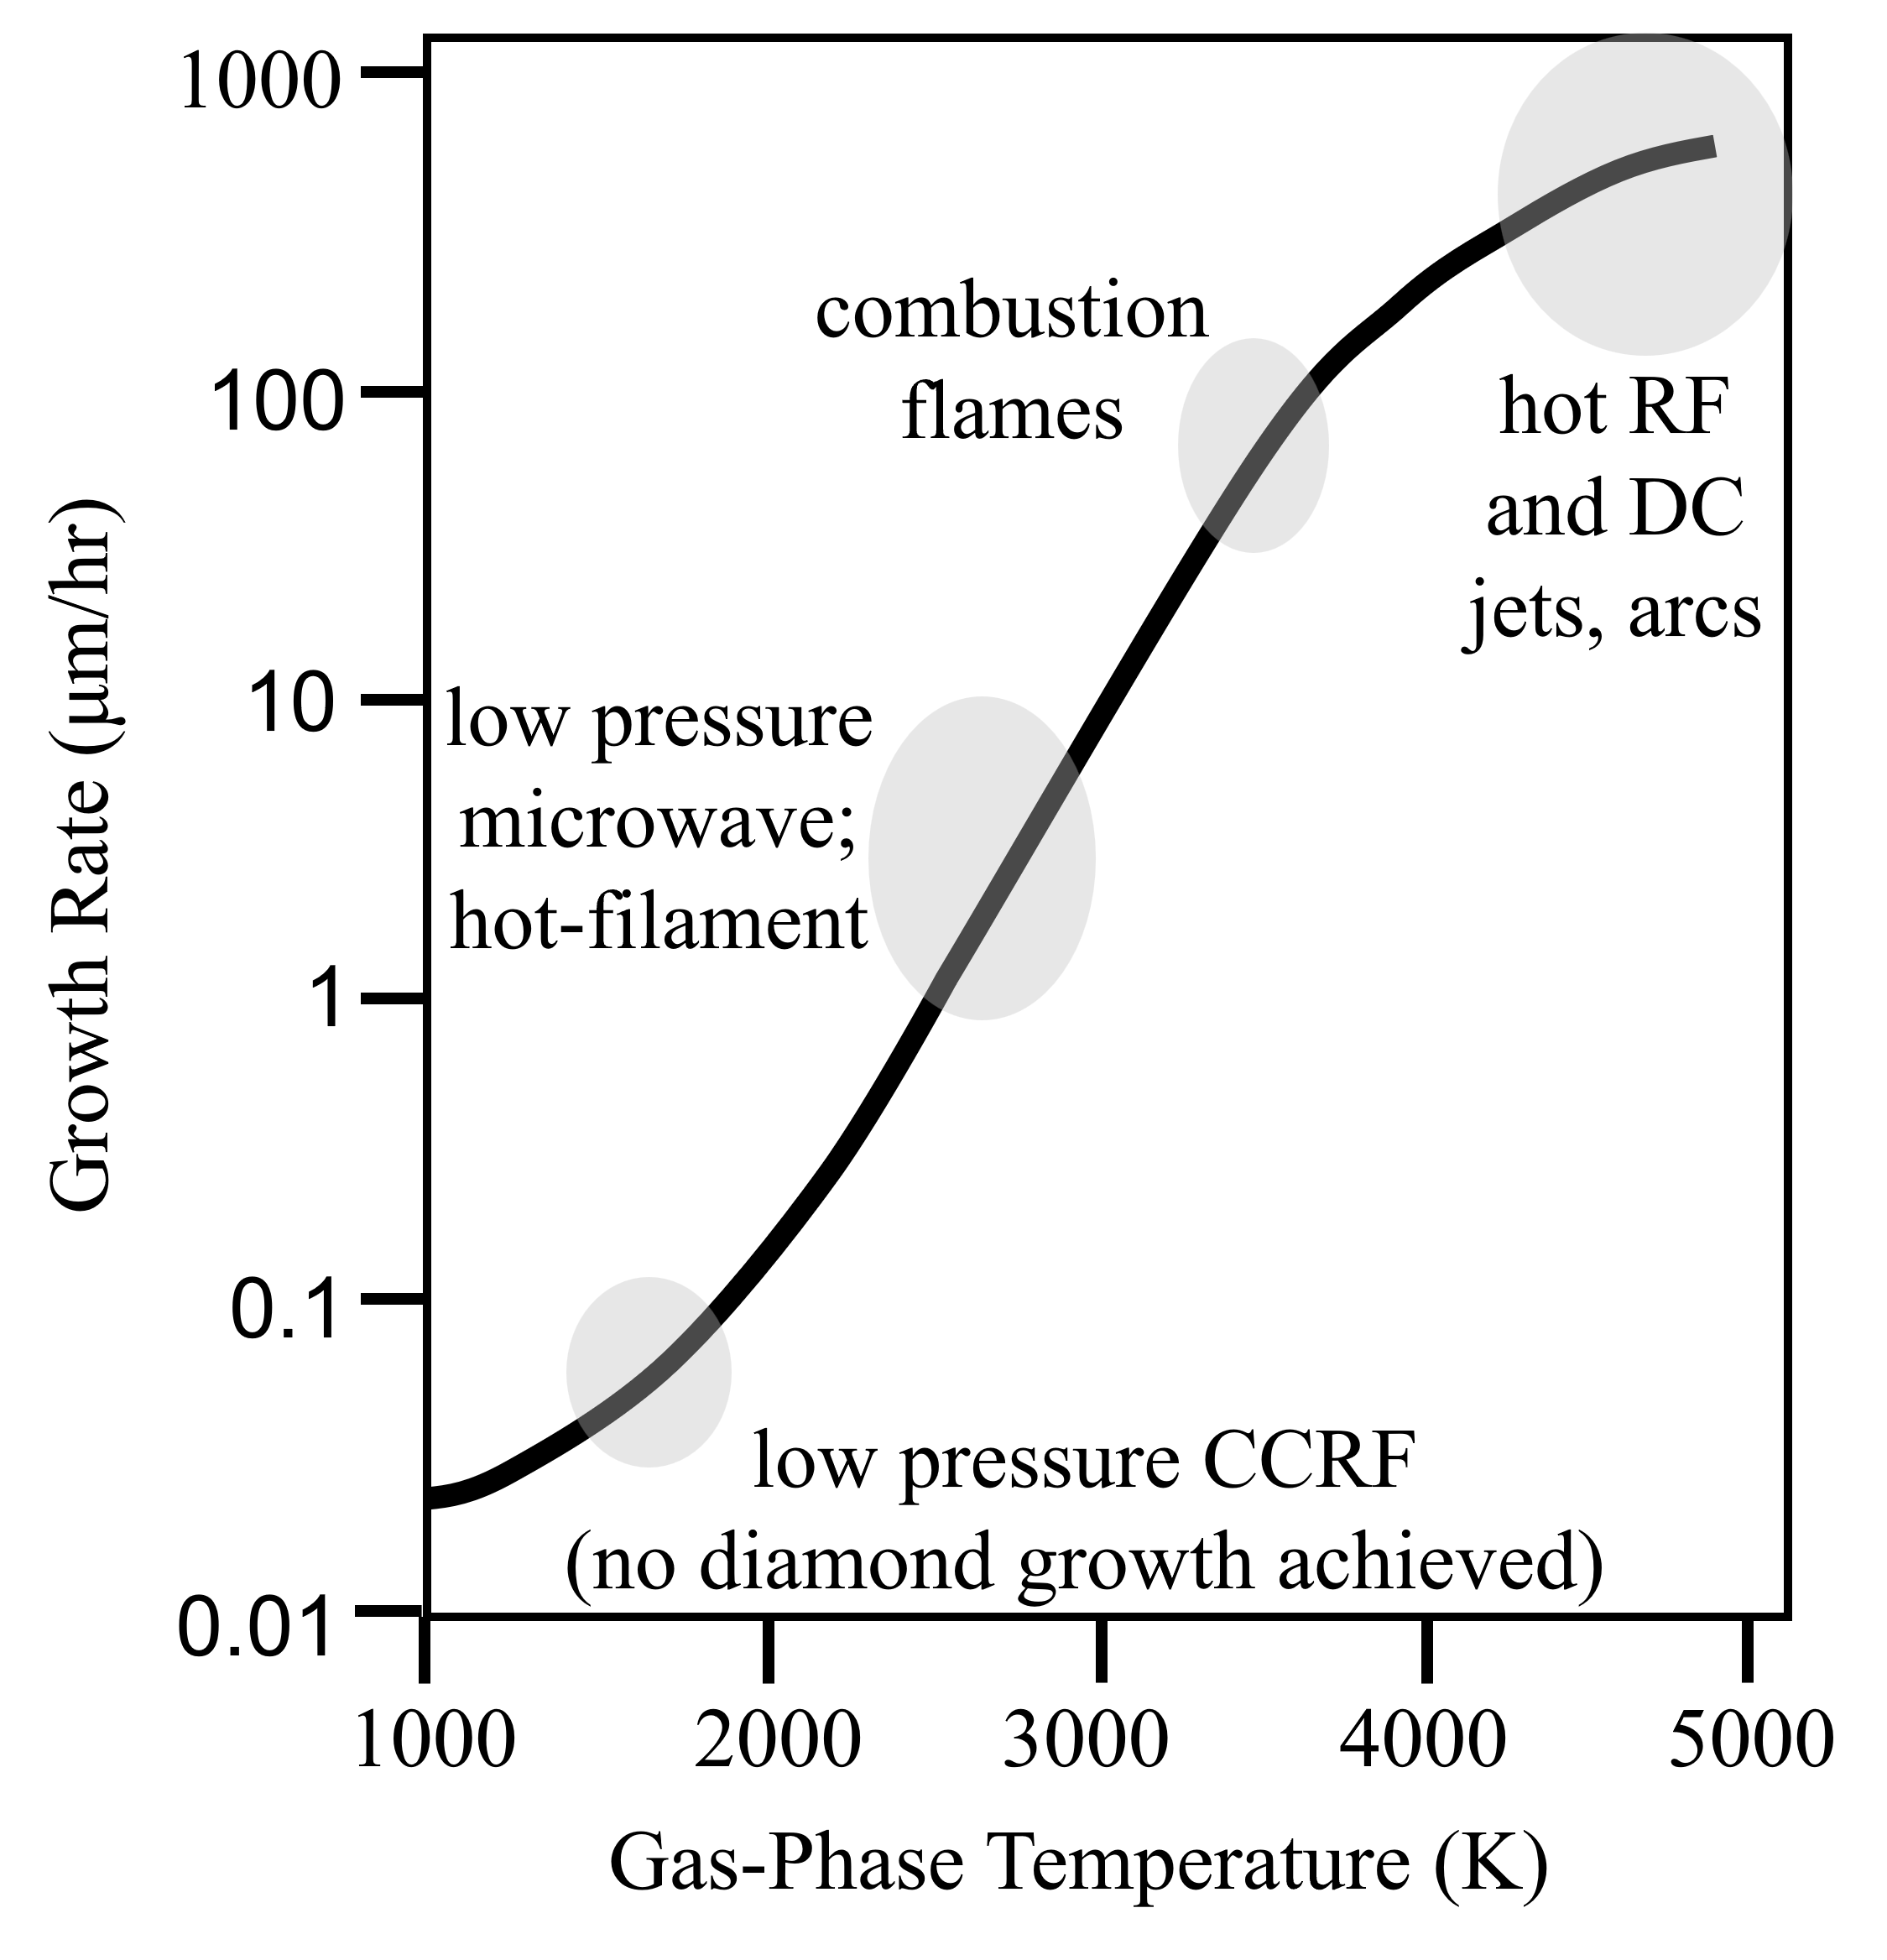
The limiting nature of methyl radical chemistry in the gas phase or on the substrateKang and Musgrave (2000) explains well why CVD reactors have to operate at high gas and substrate temperatures. From this, various diamond reactors can be compared as shown in Fig. 7. Diamond growth starts at gas temperatures above 1,000 K. In the early 80s, small tubular DC flame, jet or arc reactors were successfully developed and used for diamond synthesis at high production rates.Haubner (2021) These designs were obviously successful because their operating gas temperatures are near 5,000 K allowing for fast diamond kinetics. At the same time, such designs were quickly ruled out due to scalability issues and cavity microwave reactors became the industrial workhorses for single crystal diamond wafer productions.
In the new era of 3D additive manufacturing, reactor compactness is a plus, and flames, jets and arcs could be reconsidered for nanodiamond production. Talking about flow-through reactors, a number of new reactor strategies can be proposed. For CCRF, ambient pressure reactors of very small diameters could be beneficial for nanodiamond production. The plasma constriction (aka hot filament) is an unstable effect, therefore the easiest way to seize the hot gas filament is to induce it in a narrow capillary. High pressure increases RF power to electron coupling because, according to Eq. 4, ratio decreases. For larger reactor volumes, inductively coupled flow-through systems could be useful such that gas heating is optimized for best diamond chemistry/kinetics. Third option could be using microwave flow through reactors where gas temperature can be manipulated by the same pressure-power product but in much wider ranges over a wider range of reactor volumes thanks to more efficient microwave to plasma power coupling.
V Conclusion
A flow-through CCRF reactor utilizing Ar/CH4 mixture was attempted to synthesize diamond nanocrystals. For standard conditions 4 Torr and 200 W, typical for diamond-cubic Si and Ge nanocrystal syntheses, final product material analyses revealed that only a graphitic nanomaterial could be obtained, and with a fraction of diamond nanocrystals (if any at all) that could not be registered experimentally. Using high-resolution LIF and OES diagnostics of the reactor, it was shown that power density and hence gas heating is concentrated in the narrow 1.5 mm on the axial region of the reactor, while the remainder of the plasma volume contains cold gas. This promotes the formation of the thermodynamically favorable graphitic allotrope to form, although some small amount of hybridization in the material cannot be ruled out. If the same reactor was switched to operate with H2/CH4 mixture (traditionally used for diamond synthesis), no product was detected to form because atomic hydrogen actively must have etched the hybridized nanomaterial, thereby leading to a net zero synthesis effect. These results put into context the legacy polycrystalline diamond synthetic routes, and outline practical strategies that could allow for future diamond nanocrystal feedstock production using flow-through low-temperature plasma reactors for bottom up additive manufacturing.
Acknowledgement
This work was supported by the U.S. Department of Energy, Office of Science, Office of Fusion Energy Sciences, Award No. DE-SC0023211, and National Science Foundation, Division of Chemical, Bioengineering, Environmental and Transport Systems, Award No. 2333452. Work at Princeton Collaborative Low Temperature Plasma Research Facility (PCRF) was supported by the U.S. Department of Energy under Contract No. DE-AC02-09CH11466.
Data Access
The data that support the findings of this study are available from the corresponding author upon reasonable request.
Conflict of Interest
The authors have no conflicts to disclose.
References
- Graves et al. (2023) D. Graves, C. Labelle, and M. Kushner, Department of Energy Office of Science, Fusion Energy Sciences (2023).
- Hori and Niemira (2017) M. Hori and B. Niemira, J. Phys. D: Appl. Phys 50, 323001 (2017).
- Kortshagen et al. (2016) U. R. Kortshagen, R. M. Sankaran, R. N. Pereira, S. L. Girshick, J. J. Wu, and E. S. Aydil, Chemical reviews 116, 11061 (2016).
- Anthony and Kortshagen (2009) R. Anthony and U. Kortshagen, Phys. Rev. B 80, 115407 (2009).
- Kortshagen (2016) U. Kortshagen, Plasma Chemistry and Plasma Processing 36, 73 (2016).
- Mangolini and Kortshagen (2007) L. Mangolini and U. Kortshagen, Advanced Materials 19 (2007).
- Woodard et al. (2018) A. Woodard, L. Xu, A. A. Barragan, G. Nava, B. M. Wong, and L. Mangolini, Plasma Processes and Polymers 15, 1700104 (2018).
- Exarhos et al. (2018) S. Exarhos, A. Alvarez-Barragan, E. Aytan, A. A. Balandin, and L. Mangolini, ACS Energy Letters 3, 2349 (2018).
- Thimsen et al. (2015) E. Thimsen, U. R. Kortshagen, and E. S. Aydil, Journal of Physics D: Applied Physics 48, 314004 (2015).
- Uner et al. (2019) N. B. Uner, D. M. Niedzwiedzki, and E. Thimsen, The Journal of Physical Chemistry C 123, 30613 (2019).
- Izadi and Anthony (2019) A. Izadi and R. J. Anthony, Plasma Processes and Polymers 16, e1800212 (2019).
- Mandal et al. (2018) R. Mandal, K. O’Shea, and R. Anthony, Journal of Vacuum Science & Technology A 36 (2018).
- Ho et al. (2021) A. Ho, R. Mandal, R. R. Lunt, and R. J. Anthony, ACS Applied Nano Materials 4, 5624 (2021).
- Dsouza et al. (2023) S. D. Dsouza, M. Buerkle, B. Alessi, P. Brunet, A. Morelli, A. F. Payam, P. Maguire, D. Mariotti, and V. Svrcek, Nanotechnology 34, 505601 (2023).
- Askari et al. (2015) S. Askari, M. Macias-Montero, T. Velusamy, P. Maguire, V. Svrcek, and D. Mariotti, Journal of Physics D: Applied Physics 48, 314002 (2015).
- Nozaki et al. (2007) T. Nozaki, K. Sasaki, T. Ogino, D. Asahi, and K. Okazaki, Journal of Thermal Science and Technology 2, 192 (2007).
- Mangolini et al. (2005) L. Mangolini, E. Thimsen, and U. Kortshagen, Nano letters 5, 655 (2005).
- Pi and Kortshagen (2009) X. Pi and U. Kortshagen, Nanotechnology 20, 295602 (2009).
- Gresback et al. (2007) R. Gresback, Z. Holman, and U. Kortshagen, Applied Physics Letters 91 (2007).
- Deryagin and Fedoseev (1979) B. V. Deryagin and D. V. Fedoseev, Bulletin of the Academy of Sciences of the USSR, Division of chemical science 28, 1106 (1979).
- Frenklach et al. (1989) M. Frenklach, R. Kematick, D. Huang, W. Howard, K. Spear, A. W. Phelps, and R. Koba, Journal of applied physics 66, 395 (1989).
- Kumar et al. (2013) A. Kumar, P. Ann Lin, A. Xue, B. Hao, Y. Khin Yap, and R. M. Sankaran, Nature communications 4, 2618 (2013).
- Auciello (2022) O. Auciello, Functional Diamond 2, 1 (2022).
- Yatom et al. (2018) S. Yatom, A. Khrabry, J. Mitrani, A. Khodak, I. Kaganovich, V. Vekselman, B. Stratton, and Y. Raitses, MRS communications 8, 842 (2018).
- Yatom et al. (2017) S. Yatom, J. Bak, A. Khrabryi, and Y. Raitses, Carbon 117, 154 (2017).
- Stratton et al. (2018) B. Stratton, A. Gerakis, I. Kaganovich, M. Keidar, A. Khrabry, J. Mitrani, Y. Raitses, M. Shneider, V. Vekselman, and S. Yatom, Plasma Sources Science and Technology 27, 084001 (2018).
- Vekselman et al. (2018) V. Vekselman, A. Khrabry, I. Kaganovich, B. Stratton, R. Selinsky, and Y. Raitses, Plasma Sources Science and Technology 27, 025008 (2018).
- Yatom and Dobrynin (2022) S. Yatom and D. Dobrynin, Journal of Physics D: Applied Physics 55, 485203 (2022).
- Yatom et al. (2023) S. Yatom, N. Chopra, S. Kondeti, T. B. Petrova, Y. Raitses, D. R. Boris, M. J. Johnson, and S. G. Walton, Plasma Sources Science and Technology 32, 115005 (2023).
- Luque et al. (1997a) J. Luque, W. Juchmann, and J. Jeffries, Journal of applied physics 82, 2072 (1997a).
- Yatom and Raitses (2020) S. Yatom and Y. Raitses, Physical Chemistry Chemical Physics 22, 20837 (2020).
- Galli and Kortshagen (2009) F. Galli and U. R. Kortshagen, IEEE Transactions on Plasma Science 38, 803 (2009).
- Mangolini and Kortshagen (2009) L. Mangolini and U. Kortshagen, Physical review E 79, 026405 (2009).
- Lopez and Mangolini (2014) T. Lopez and L. Mangolini, Journal of Vacuum Science and Technology B 32, 061802 (2014).
- Mahoney et al. (2019) E. J. Mahoney, B. J. Rodriguez, S. Mushtaq, B. S. Truscott, M. N. Ashfold, and Y. A. Mankelevich, The Journal of Physical Chemistry A 123, 9966 (2019).
- Luque et al. (1997b) J. Luque, W. Juchmann, and J. Jeffries, Applied optics 36, 3261 (1997b).
- Hollas (2004) J. M. Hollas, Modern Spectroscopy, 4th Edition (Wiley, 2004).
- Huber and Herzberg (1979) K. P. Huber and G. Herzberg, Molecular Spectra and Molecular Structure (Springer, 1979).
- Partridge and Laurendeau (1995) W. P. Partridge and N. M. Laurendeau, Applied optics 34, 2645 (1995).
- Reichardt et al. (2003) J. Reichardt, R. Baumgart, and T. J. McGee, Applied optics 42, 4909 (2003).
- Kruis et al. (1994) F. E. Kruis, J. Schoonman, and B. Scarlett, Journal of Aerosol Science 25, 1291 (1994).
- (42) Laux, C.O., “Radiation and Nonequilibrium Collisional-Radiative Models,” von Karman Institute Lecture Series 2002-07, Physico-Chemical Modeling of High Enthalpy and Plasma Flows, eds. D. Fletcher, J.-M. Charbonnier, G.S.R. Sarma, and T. Magin, Rhode-Saint-Genèse, Belgium (2002).
- Bruggeman et al. (2014) P. J. Bruggeman, N. Sadeghi, D. Schram, and V. Linss, Plasma Sources Science and Technology 23, 023001 (2014).
- Nikhar et al. (2020) T. Nikhar, R. Rechenberg, M. F. Becker, and S. V. Baryshev, Journal of Applied Physics 128 (2020).
- Agarwal et al. (2012) A. Agarwal, S. Rauf, and K. Collins, Plasma Sources Science and Technology 21, 055012 (2012).
- Godyak et al. (1991) V. Godyak, R. Piejak, and B. Alexandrovich, Journal of applied physics 69, 3455 (1991).
- Godyak and Piejak (1990) V. Godyak and R. Piejak, Physical review letters 65, 996 (1990).
- Moravej et al. (2004) M. Moravej, X. Yang, G. Nowling, J. Chang, R. Hicks, and S. Babayan, Journal of applied physics 96, 7011 (2004).
- Raizer (1997) Y. P. Raizer, Gas discharge physics, edited by J. E. Allen, Vol. 2 (Springer, 1997).
- Assael et al. (2023) M. J. Assael, K. D. Antoniadis, D. Velliadou, and W. A. Wakeham, International Journal of Thermophysics 44, 85 (2023).
- Sun and Venart (2005) L. Sun and J. Venart, International journal of thermophysics 26, 325 (2005).
- Forst (1991) W. Forst, The Journal of Physical Chemistry 95, 3612 (1991).
- Fedoseev et al. (1979) D. Fedoseev, S. Vnukov, and B. Derjaguin, Carbon 17, 453 (1979).
- Matsui et al. (1987) Y. Matsui, A. Yuuki, N. Morita, and K. Tachibana, Japanese journal of applied physics 26, 1575 (1987).
- Kang and Musgrave (2000) J. K. Kang and C. B. Musgrave, The Journal of Chemical Physics 113, 7582 (2000).
- Haubner (2021) R. Haubner, ChemTexts 7, 10 (2021).
- Bachmann et al. (1991) P. K. Bachmann, D. Leers, and H. Lydtin, Diamond and related materials 1, 1 (1991).