The Trade-off between Performance, Efficiency, and Fairness
in Adapter Modules for Text Classification
Abstract
Current natural language processing (NLP) research tends to focus on only one or, less frequently, two dimensions – e.g., performance, privacy, fairness, or efficiency – at a time, which may lead to suboptimal conclusions and often overlooking the broader goal of achieving trustworthy NLP. Work on adapter modules (Houlsby et al., 2019; Hu et al., 2021) focuses on improving performance and efficiency, with no investigation of unintended consequences on other aspects such as fairness. To address this gap, we conduct experiments on three text classification datasets by either (1) finetuning all parameters or (2) using adapter modules. Regarding performance and efficiency, we confirm prior findings that the accuracy of adapter-enhanced models is roughly on par with that of fully finetuned models, while training time is substantially reduced. Regarding fairness, we show that adapter modules result in mixed fairness across sensitive groups. Further investigation reveals that, when the standard finetuned model exhibits limited biases, adapter modules typically do not introduce extra bias. On the other hand, when the finetuned model exhibits increased bias, the impact of adapter modules on bias becomes more unpredictable, introducing the risk of significantly magnifying these biases for certain groups. Our findings highlight the need for a case-by-case evaluation rather than a one-size-fits-all judgment.111Code is available at https://github.com/MinhDucBui/adapters-vs-fairness.
The Trade-off between Performance, Efficiency, and Fairness
in Adapter Modules for Text Classification
Minh Duc Bui Johannes Gutenberg University Mainz minhducbui@uni-mainz.de Katharina von der Wense University of Colorado Boulder Johannes Gutenberg University Mainz k.vonderwense@uni-mainz.de
1 Introduction
Experiments in NLP often focus on the fundamental goal of optimizing models for performance but overlook other dimensions, such as fairness, privacy, or efficiency. Ruder et al. (2022) have termed this the SQUARE ONE experimental setup. While modern NLP research has started to go beyond SQUARE ONE, it commonly remains solely focused on two aspects – often performance in addition to enhancing model efficiency –, while neglecting the broader context of multi-dimensional challenges. This oversight often hinders progress towards the goal of trustworthy NLP, potentially leading to suboptimal choices: e.g. recent studies have raised concerns about model compression methods compromising fairness Hansen and Søgaard (2021); Ahn et al. (2022); Hessenthaler et al. (2022); Ramesh et al. (2023).
Adapter modules (Houlsby et al., 2019; Hu et al., 2021) have emerged as a promising technique to finetune pretrained language models (LMs) on downstream tasks, increasing efficiency with respect to memory and training time, while roughly maintaining performance, see Table 1.
|
Performance |
(SQUARE ONE) |
Efficiency |
Fairness |
|
|---|---|---|---|---|
| BERT Devlin et al. (2019) | ||||
| RoBERTa Liu et al. (2019) | ||||
| GPT-2 Radford et al. (2019) | ||||
| Adapters Houlsby et al. (2019) | ||||
| LoRA Hu et al. (2021) | ||||
| Our Research (This Paper) | ||||
We emphasize the importance of fairness for two practical tasks: occupation classification, where we determine a person’s occupation based on their biography, and toxic text detection. These tasks have significant real-world implications, ranging from automating online recruitment to addressing the growing need for text toxicity detectors as online harassment is on the rise (Vogels, 2021). Our goal is to evaluate how two types of adapter modules – adapters and LoRA – affect the biases that models display in these tasks. In our context, bias refers to systematic disparities in outcomes experienced by certain groups of people, which leads to unfair systems. We experiment on three datasets: Jigsaw Jigsaw (2019), HateXplain Mathew et al. (2022) and the BIOS dataset De-Arteaga et al. (2019). We experiment with four LMs: BERT (Devlin et al., 2019), GPT-2 (Radford et al., 2019), RoBERTabase and RoBERTalarge (Liu et al., 2019). They remain relevant for our tasks due to their resource-efficient nature, particularly when compared to large LMs.
The performance of adapter modules is comparable to that of fully finetuned models, while strongly reducing training time. In terms of fairness, our experiments demonstrate that adapter modules result in mixed fairness across sensitive groups. Upon closer investigation, when the finetuned model exhibits limited biases, adapter modules usually do not add extra bias. However, in cases of preexisting high bias, the impact of adapter modules on bias becomes highly variable, rendering it more unpredictable and posing the risk of amplifying these biases. Our findings underscore the importance of assessing each situation individually rather than relying on a one-size-fits-all judgment.
2 Related Work
Efficiency vs. Fairness While many parameter-efficient methods have been recognized for their sustainability benefits, a comprehensive exploration of their implications on fairness is missing Ruder et al. (2022). However, recent studies have highlighted that such methods can have unintended side-effects on fairness: e.g., knowledge distillation Hinton et al. (2015) has been shown to be problematic in that regard Ahn et al. (2022); Hessenthaler et al. (2022); Ramesh et al. (2023). Additionally, Hansen and Søgaard (2021) show that weight pruning, another common technique for model compression, has disparate effects on performance across different demographics. However, no clear statement can be made regarding the fairness of LMs with respect to their size (Baldini et al., 2022; Tal et al., 2022). Renduchintala et al. (2021) observe that techniques aimed at making inference more efficient – e.g., quantization – have a small impact on performance improvements but dramatically amplify gender bias. For a comprehensive overview of fairness in the NLP domain, we refer to Blodgett et al. (2020); Delobelle et al. (2022).
Adapter Modules
Adapter modules are a lightweight training strategy for pretrained transformers which enable us to retain the integrity of pretrained model parameters while finetuning only a limited number of newly introduced parameters, either for new tasks (Houlsby et al., 2019; Stickland and Murray, 2019; Pfeiffer et al., 2021; Hu et al., 2021), or for novel domains (Bapna et al., 2019). Notably, they deliver performance levels that are either on par with or slightly below those achieved through full finetuning (Pfeiffer et al., 2021; Hu et al., 2021), while being up to 60% faster in training for certain settings Rücklé et al. (2021). Furthermore, adapters can be leveraged for debiasing or detoxifying strategies by finetuning on counterfactual or nontoxic corpora, eliminating the need for training an entire model from scratch (Lauscher et al., 2021; Kumar et al., 2023; Wang et al., 2022). However, a critical aspect that has remained largely unexplored is the impact of adapter modules on fairness when directly employed in the finetuning of LMs for downstream tasks. This raises the question of whether the benefits in terms of model efficiency come at the expense of fairness considerations, as is the case with other efficiency methods Hessenthaler et al. (2022); Hansen and Søgaard (2021); Renduchintala et al. (2021). We focus on two popular adapter modules: adapters Houlsby et al. (2019) and LoRA Hu et al. (2021).
3 Experiment
3.1 Experimental Setup

Models
We experiment with four base LMs: BERTbase, GPT-2, RoBERTabase and RoBERTalarge with 109 Million (M), 124M and 124M and 355M parameters, respectively. To insert adapters, we adopt the adapter architecture and placement outlined by Pfeiffer et al. (2021) and use a default reduction factor of 16, if not otherwise specified. For LoRA, we adopt the approach introduced by Hu et al. (2021) and apply LoRa exclusively to the query and value projection matrices within the self-attention module. In the case of GPT-2, we extend this to include the key projection matrix as well. We set the default rank to for all matrices. We train each model architecture with 5 random seeds and average the resulting metrics for robustness. See Appendix A.2 for more information about the training and hyperparameter tuning.
Dataset
We evaluate toxic text detection using the Jigsaw Jigsaw (2019) and HateXplain datasets Mathew et al. (2022). The Jigsaw dataset consists of approximately 2 million public comments, while HateXplain includes around 20,000 tweets and tweet-like samples. Both datasets allow us to create a binary toxic label, and they provide detailed annotations related to mentions of identity groups. Following Baldini et al. (2022), our analysis focuses on broad sensitive groups: religion, race, and gender.222A more descriptive name would be gender & sexuality.
For the occupation task, we utilize the BIOS dataset De-Arteaga et al. (2019), which comprises around 400,000 biographies labeled with 28 professions and gender information. We categorize the professions into three groups based on the percentage of female individuals working in each occupation within the training set. Further details about the sizes of training, development, and test sets as well as information on creating general categories and labels can be found in Appendix A.1.
Evaluation Metrics
For the toxic text datasets, which have a substantial class imbalance, we rely on balanced accuracy. This metric calculates the average of recall scores for both negative and positive classes. We further compute equalized odds (EO; Hardt et al., 2016) as a measure of group fairness. Intuitively, EO is fulfilled when the model predictions are independent of the sensitive attribute conditioned on the label. We quantify EO by considering the maximum difference between true positive and false positive rates for sensitive and complementary groups.
For occupation classification, we use accuracy as our performance metric. To assess fairness, we measure gender bias by calculating the true positive rate (TPR) gender gap, following De-Arteaga et al. (2019); Ravfogel et al. (2020). This gap is the difference in TPRs between genders for each occupation: we calculate the root mean squared value across all TPRs (TPRGap).
3.2 Results
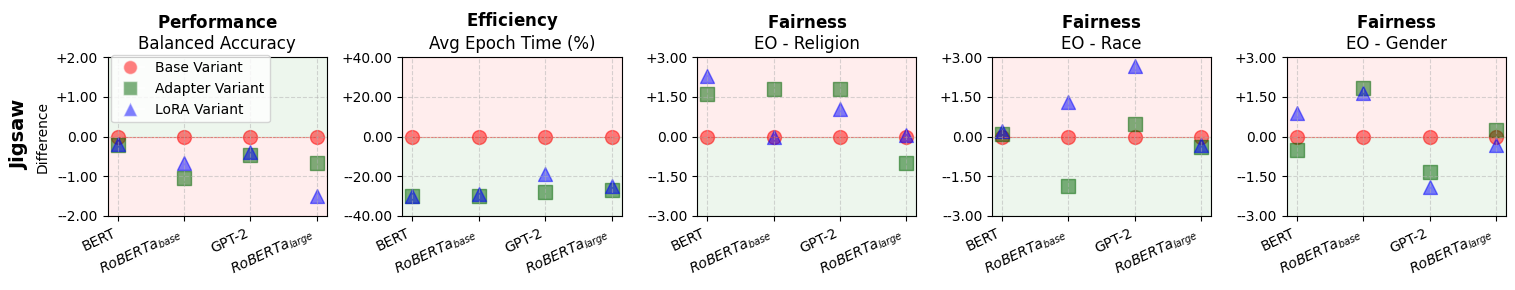
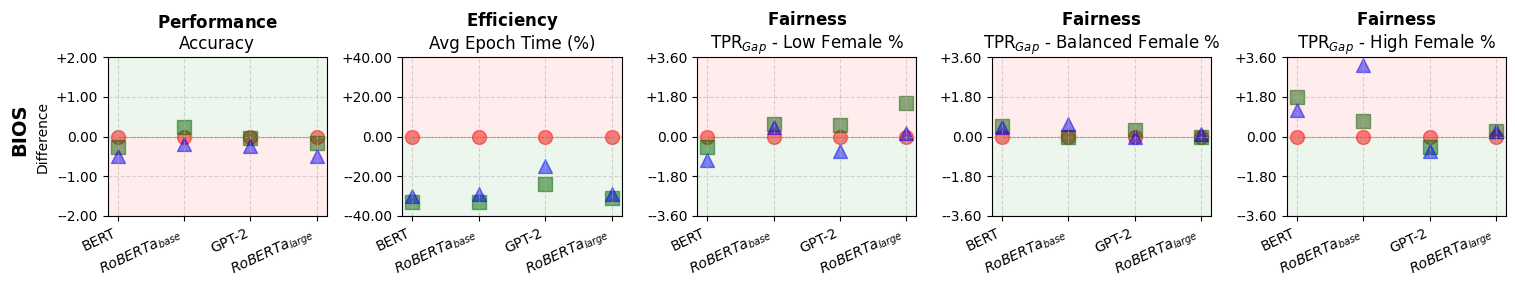
Our main results are shown in Figure 1.
Performance
With an average decrease of less than 1% for almost all models across all tasks, adapters and LoRA exhibit only a minor reduction in performance, confirming prior works. The biggest decrease we see is approx. 1.7% for RoBERTa+LoRA on Jigsaw, while, for RoBERTa+Adapters on BIOS, we even see a small increase in performance.
Efficiency
As we use a reduction factor of 16 in adapters and rank 16 for LoRA, we only introduce less than 1% to the total model parameter budget, see Appendix A.3 for a more detailed analysis on model parameter count. During training, we only finetune the new parameters and the classifier head. This leads to a significant speed advantage of approx. 30% per epoch on average. This speedup is comparable to prior findings Rücklé et al. (2021).
Fairness
Turning to fairness on Jigsaw, we observe that adapter modules tends to slightly decrease EO across most models and adapter modules. The most pronounced disparity is observed in the case of GPT-2+LoRA, with a difference of 2.7% on race. Notably, we observe improvements when using GPT-2 for the sensitive group gender, as well as RoBERTabase+Adapters for race.
On HateXplain, we see a steady fairness decrease on religion, with the highest decrease for RoBERTalarge+LoRA and RoBERTalarge+Adapters: 4.9% and 3.6% on religion, respectively. This implies that adapters and LoRA can have a detrimental effect on fairness in certain cases. However, it is essential to recognize that this pattern is not universal across all identity groups. On race and gender, we see an increase. Although improvements are subtle, with the most significant margin by far being 4.7% in the case of RoBERTabase+LoRA on race, they underscore the mixed impact of adapter modules across different sensitive groups.
On BIOS, we see a strong decrease in fairness for BERT and RoBERTabase with adapter modules, where RoBERTabase+LoRA exhibits with 3.5% the highest decrease. For the neutral group, we see almost no change, whereas for the low female % group, again, mixed results are observed.
![[Uncaptioned image]](/html/2405.02010/assets/images/variance.png)
3.3 Analysis: Mixed Fairness Results
For further analysis, we examine the bias in fully finetuned models for each sensitive group. This bias is categorized into different levels, and we evaluate the impact of adapter modules on bias within each level, see Figure LABEL:fig:analyze_bias_levels. For toxic text detection, we consider biases related to religion, race, and gender. For occupation classification, we assess biases linked to the professions.
Results
Our findings reveal a consistent trend: when the fully finetuned model has low bias, using adapter modules results in lower variance and does not add more bias to an unbiased base model. Conversely, when the base model exhibits high bias, the impacts of adapter modules show greater variance. Consequently, there is an increased likelihood that adapter modules may significantly alter the bias. We face the risk of further amplifying existing bias for certain groups: e.g., for toxic text detection, LoRA shows high positive change when the base model has high bias. Similarly, for BIOS, the positive TPRGap category displays positive outliers. Bias can also be strongly reduced in cases where the base model has high bias, as observed with LoRA and adapters in the positive TPRGap category.
4 Conclusion
We run experiments on three text classification datasets, comparing (1) finetuning all parameters of LMs and (2) using adapter modules across the three dimensions performance, efficiency, and fairness. We first confirm that adapters perform roughly on par with full finetuning, while increasing efficiency. Regarding fairness, the impact of adapters is not uniform and varies depending on the specific group. A deeper analysis reveals that, when the fully finetuned model has low bias, adapter modules tend to not introduce additional bias. Yet, in cases where the baseline model exhibits high bias levels, adapter modules exhibit significant variance, thereby posing a risk of further amplifying the existing bias. Therefore, we strongly recommend that both researchers and practitioners working on text classification carefully assess potential fairness implications when utilizing adapter modules.
Limitations
Our investigation is focused exclusively on text classification and examined a restricted set of identity groups. While our study sheds light on some aspects of fairness, it may not fully capture the full range of concerns. Nevertheless, it serves as a starting point into the vast landscape of fairness considerations.
Adapters prove effective in enhancing training efficiency by introducing minimal additional parameters. However, it is essential to consider that during inference, the use of adapters does add some computational overhead, albeit a relatively small one. This may impact real-time or resource-constrained applications. Further, we do not experiment with the largest and most recent language models such as LLaMA Touvron et al. (2023). Adding more models might lead to additional insights. However, as our results are mixed, it is unlikely that the main conclusion will change with more models.
Finally, we acknowledge that, while we are addressing three dimensions (performance, efficiency, and fairness), we ignore other important dimensions such as multilinguality or interpretability.
Ethics Statement
We recognize that there are additional identity groups to take into account for the toxic text classification task. Due to data limitations, we are only able to focus on religion, gender, and race. Moreover, a more detailed analysis of identities within each group is necessary, such as distinguishing between male and female within the gender category. It is important to note that the BIOS dataset simplifies gender into binary categories, which does not fully represent the diversity of gender identities and expressions. However, conducting a comprehensive study is again not feasible due to data constraints. Furthermore, the datasets we employ is compiled from publicly accessible sources within the public domain and is openly available to the community for any purpose, whether commercial or non-commercial (see Jigsaw Rules). We use the datasets as intended, specifically for the evaluation of model performance. We acknowledge that the Jigsaw and HateXplain datasets include messages that contain instances of vulgarity and degrading language, which may be offensive or distressing to certain readers.
Additionally, a potential risk of our study lies in the reliance on abstract metrics to measure fairness, as these metrics have demonstrated limitations Olteanu et al. (2017). Practitioners should be cautious about placing excessive reliance on a single metric without thoroughly assessing the impact on their users.
It is important to note that our work utilized approximately 1500 GPU hours, recognizing the environmental and resource implications of such usage. We aim to use resources efficiently and ensure that our research adds value to our field while minimizing any negative consequences.
Lastly, we state that we use large language models like ChatGPT OpenAI (2023) to rephrase and check for any grammatical mistakes in our texts.
Acknowledgement
The research in this paper was funded by the Carl Zeiss Foundation, grant number P2021-02-014 (TOPML project).
References
- Ahn et al. (2022) Jaimeen Ahn, Hwaran Lee, Jinhwa Kim, and Alice Oh. 2022. Why knowledge distillation amplifies gender bias and how to mitigate from the perspective of DistilBERT. In Proceedings of the 4th Workshop on Gender Bias in Natural Language Processing (GeBNLP), pages 266–272, Seattle, Washington. Association for Computational Linguistics.
- Baldini et al. (2022) Ioana Baldini, Dennis Wei, Karthikeyan Natesan Ramamurthy, Moninder Singh, and Mikhail Yurochkin. 2022. Your fairness may vary: Pretrained language model fairness in toxic text classification. In Findings of the Association for Computational Linguistics: ACL 2022, pages 2245–2262, Dublin, Ireland. Association for Computational Linguistics.
- Bapna et al. (2019) Ankur Bapna, Naveen Arivazhagan, and Orhan Firat. 2019. Simple, scalable adaptation for neural machine translation.
- Blodgett et al. (2020) Su Lin Blodgett, Solon Barocas, Hal Daumé III, and Hanna Wallach. 2020. Language (technology) is power: A critical survey of “bias” in NLP. In Proceedings of the 58th Annual Meeting of the Association for Computational Linguistics, pages 5454–5476, Online. Association for Computational Linguistics.
- De-Arteaga et al. (2019) Maria De-Arteaga, Alexey Romanov, Hanna Wallach, Jennifer Chayes, Christian Borgs, Alexandra Chouldechova, Sahin Geyik, Krishnaram Kenthapadi, and Adam Tauman Kalai. 2019. Bias in bios: A case study of semantic representation bias in a high-stakes setting. In Proceedings of the Conference on Fairness, Accountability, and Transparency, FAT* ’19. ACM.
- Delobelle et al. (2022) Pieter Delobelle, Ewoenam Tokpo, Toon Calders, and Bettina Berendt. 2022. Measuring fairness with biased rulers: A comparative study on bias metrics for pre-trained language models. In Proceedings of the 2022 Conference of the North American Chapter of the Association for Computational Linguistics: Human Language Technologies, pages 1693–1706, Seattle, United States. Association for Computational Linguistics.
- Devlin et al. (2019) Jacob Devlin, Ming-Wei Chang, Kenton Lee, and Kristina Toutanova. 2019. Bert: Pre-training of deep bidirectional transformers for language understanding.
- Hansen and Søgaard (2021) Victor Petrén Bach Hansen and Anders Søgaard. 2021. Is the lottery fair? evaluating winning tickets across demographics. In Findings of the Association for Computational Linguistics: ACL-IJCNLP 2021, pages 3214–3224, Online. Association for Computational Linguistics.
- Hardt et al. (2016) Moritz Hardt, Eric Price, and Nathan Srebro. 2016. Equality of opportunity in supervised learning.
- Hessenthaler et al. (2022) Marius Hessenthaler, Emma Strubell, Dirk Hovy, and Anne Lauscher. 2022. Bridging fairness and environmental sustainability in natural language processing. In Proceedings of the 2022 Conference on Empirical Methods in Natural Language Processing, pages 7817–7836, Abu Dhabi, United Arab Emirates. Association for Computational Linguistics.
- Hinton et al. (2015) Geoffrey Hinton, Oriol Vinyals, and Jeff Dean. 2015. Distilling the knowledge in a neural network.
- Houlsby et al. (2019) Neil Houlsby, Andrei Giurgiu, Stanislaw Jastrzebski, Bruna Morrone, Quentin de Laroussilhe, Andrea Gesmundo, Mona Attariyan, and Sylvain Gelly. 2019. Parameter-efficient transfer learning for nlp.
- Hu et al. (2021) Edward J. Hu, Yelong Shen, Phillip Wallis, Zeyuan Allen-Zhu, Yuanzhi Li, Shean Wang, Lu Wang, and Weizhu Chen. 2021. Lora: Low-rank adaptation of large language models.
- Jigsaw (2019) Jigsaw. 2019. Jigsaw. Accessed: 15-September-2023.
- Kumar et al. (2023) Deepak Kumar, Oleg Lesota, George Zerveas, Daniel Cohen, Carsten Eickhoff, Markus Schedl, and Navid Rekabsaz. 2023. Parameter-efficient modularised bias mitigation via AdapterFusion. In Proceedings of the 17th Conference of the European Chapter of the Association for Computational Linguistics, pages 2738–2751, Dubrovnik, Croatia. Association for Computational Linguistics.
- Lauscher et al. (2021) Anne Lauscher, Tobias Lüken, and Goran Glavaš. 2021. Sustainable modular debiasing of language models.
- Liu et al. (2019) Yinhan Liu, Myle Ott, Naman Goyal, Jingfei Du, Mandar Joshi, Danqi Chen, Omer Levy, Mike Lewis, Luke Zettlemoyer, and Veselin Stoyanov. 2019. Roberta: A robustly optimized bert pretraining approach.
- Loshchilov and Hutter (2019) Ilya Loshchilov and Frank Hutter. 2019. Decoupled weight decay regularization.
- Mangrulkar et al. (2022) Sourab Mangrulkar, Sylvain Gugger, Lysandre Debut, Younes Belkada, Sayak Paul, and Benjamin Bossan. 2022. Peft: State-of-the-art parameter-efficient fine-tuning methods. https://github.com/huggingface/peft.
- Mathew et al. (2022) Binny Mathew, Punyajoy Saha, Seid Muhie Yimam, Chris Biemann, Pawan Goyal, and Animesh Mukherjee. 2022. Hatexplain: A benchmark dataset for explainable hate speech detection.
- Olteanu et al. (2017) Alexandra Olteanu, Kartik Talamadupula, and Kush R. Varshney. 2017. The limits of abstract evaluation metrics: The case of hate speech detection. In Proceedings of the 2017 ACM on Web Science Conference, WebSci ’17, page 405–406, New York, NY, USA. Association for Computing Machinery.
- OpenAI (2023) OpenAI. 2023. Chatgpt: Openai’s conversational ai. https://chat.openai.com/. Accessed on September 25, 2023.
- Panda et al. (2022) Swetasudha Panda, Ari Kobren, Michael Wick, and Qinlan Shen. 2022. Don’t just clean it, proxy clean it: Mitigating bias by proxy in pre-trained models. In Findings of the Association for Computational Linguistics: EMNLP 2022, pages 5073–5085, Abu Dhabi, United Arab Emirates. Association for Computational Linguistics.
- Pfeiffer et al. (2021) Jonas Pfeiffer, Aishwarya Kamath, Andreas Rücklé, Kyunghyun Cho, and Iryna Gurevych. 2021. Adapterfusion: Non-destructive task composition for transfer learning.
- Pfeiffer et al. (2020) Jonas Pfeiffer, Andreas Rücklé, Clifton Poth, Aishwarya Kamath, Ivan Vulić, Sebastian Ruder, Kyunghyun Cho, and Iryna Gurevych. 2020. Adapterhub: A framework for adapting transformers. In Proceedings of the 2020 Conference on Empirical Methods in Natural Language Processing (EMNLP 2020): Systems Demonstrations, pages 46–54, Online. Association for Computational Linguistics.
- Radford et al. (2019) Alec Radford, Jeff Wu, Rewon Child, David Luan, Dario Amodei, and Ilya Sutskever. 2019. Language models are unsupervised multitask learners.
- Ramesh et al. (2023) Krithika Ramesh, Arnav Chavan, Shrey Pandit, and Sunayana Sitaram. 2023. A comparative study on the impact of model compression techniques on fairness in language models. In Proceedings of the 61st Annual Meeting of the Association for Computational Linguistics (Volume 1: Long Papers), pages 15762–15782, Toronto, Canada. Association for Computational Linguistics.
- Ravfogel et al. (2020) Shauli Ravfogel, Yanai Elazar, Hila Gonen, Michael Twiton, and Yoav Goldberg. 2020. Null it out: Guarding protected attributes by iterative nullspace projection. In Proceedings of the 58th Annual Meeting of the Association for Computational Linguistics, pages 7237–7256, Online. Association for Computational Linguistics.
- Renduchintala et al. (2021) Adithya Renduchintala, Denise Diaz, Kenneth Heafield, Xian Li, and Mona Diab. 2021. Gender bias amplification during speed-quality optimization in neural machine translation. In Proceedings of the 59th Annual Meeting of the Association for Computational Linguistics and the 11th International Joint Conference on Natural Language Processing (Volume 2: Short Papers), pages 99–109, Online. Association for Computational Linguistics.
- Rücklé et al. (2021) Andreas Rücklé, Gregor Geigle, Max Glockner, Tilman Beck, Jonas Pfeiffer, Nils Reimers, and Iryna Gurevych. 2021. AdapterDrop: On the efficiency of adapters in transformers. In Proceedings of the 2021 Conference on Empirical Methods in Natural Language Processing, pages 7930–7946, Online and Punta Cana, Dominican Republic. Association for Computational Linguistics.
- Ruder et al. (2022) Sebastian Ruder, Ivan Vulić, and Anders Søgaard. 2022. Square one bias in NLP: Towards a multi-dimensional exploration of the research manifold. In Findings of the Association for Computational Linguistics: ACL 2022, pages 2340–2354, Dublin, Ireland. Association for Computational Linguistics.
- Stickland and Murray (2019) Asa Cooper Stickland and Iain Murray. 2019. Bert and pals: Projected attention layers for efficient adaptation in multi-task learning.
- Tal et al. (2022) Yarden Tal, Inbal Magar, and Roy Schwartz. 2022. Fewer errors, but more stereotypes? the effect of model size on gender bias. In Proceedings of the 4th Workshop on Gender Bias in Natural Language Processing (GeBNLP), pages 112–120, Seattle, Washington. Association for Computational Linguistics.
- Touvron et al. (2023) Hugo Touvron, Thibaut Lavril, Gautier Izacard, Xavier Martinet, Marie-Anne Lachaux, Timothée Lacroix, Baptiste Rozière, Naman Goyal, Eric Hambro, Faisal Azhar, Aurelien Rodriguez, Armand Joulin, Edouard Grave, and Guillaume Lample. 2023. Llama: Open and efficient foundation language models.
- Vogels (2021) Emily A. Vogels. 2021. The state of online harassment.
- Wang et al. (2022) Boxin Wang, Wei Ping, Chaowei Xiao, Peng Xu, Mostofa Patwary, Mohammad Shoeybi, Bo Li, Anima Anandkumar, and Bryan Catanzaro. 2022. Exploring the limits of domain-adaptive training for detoxifying large-scale language models. In Advances in Neural Information Processing Systems, volume 35, pages 35811–35824. Curran Associates, Inc.
- Wolf et al. (2020) Thomas Wolf, Lysandre Debut, Victor Sanh, Julien Chaumond, Clement Delangue, Anthony Moi, Pierric Cistac, Tim Rault, Rémi Louf, Morgan Funtowicz, Joe Davison, Sam Shleifer, Patrick von Platen, Clara Ma, Yacine Jernite, Julien Plu, Canwen Xu, Teven Le Scao, Sylvain Gugger, Mariama Drame, Quentin Lhoest, and Alexander M. Rush. 2020. Huggingface’s transformers: State-of-the-art natural language processing.
Appendix A Appendix
A.1 Datasets
| Group | Jigsaw annotation | HateXplain annotation |
|---|---|---|
| religion | atheist, buddhist, muslim, christian, hindu, jewish, other_religion | Islam, Buddhism, Jewish, Hindu, Christian |
| race | white, asian, black, latino, other_race_or _ethnicity | African, Arab, Asian, Cau- casian, Hispanic |
| gender |
bisexual, female, male, heterosexual,
homosexual_gay _or_lesbian, transgender, other_gender, other_sexual _orientation |
Men, Women |
Jigsaw Dataset
The Jigsaw dataset originated from a Kaggle competition called "Unintended Bias in Toxicity Classification" held in 2019, hosted by Jigsaw Jigsaw (2019). It contains content from the Civil Comments platform, where users engage in discussions and comment on news articles. Jigsaw, a Google unit focused on issues like disinformation, toxicity, censorship, and extremism, curated this collection. The user ID is intentionally omitted from each sample, and the annotators’ identities in the datasets have been anonymized. The dataset spans posts from 2015 to 2017. The original dataset contains fine-grained annotations for identity groups such as Muslim. We, however, follow Baldini et al. (2022) and focus on broader, more general categories of identities, such as religion. The resulting three primary identity groups are religion, race, and gender & sexuality, and their respective annotations are detailed in Table 2. We abbreviate gender & sexuality as gender for the sake of brevity. The toxicity label for each sample is expressed as a fractional value, representing the proportion of human raters who deemed the sample to be toxic. In our evaluation, we follow to the Jigsaw Jigsaw (2019) competition guidelines, where any sample with a value of is categorized as belonging to the positive class (toxic). Furthermore, we divide the original dataset into a training set, comprising 80% of the data, and a development set, consisting of the remaining 20%. We observe that a random splitting method would yield highly variable results depending on the split due to the dataset’s inherent imbalance of identity groups. Consequently, we employ a stratified split according to our three defined sensitive groups. We report the results on the private test set. The resulting sample sizes are presented in Table 3.
HateXplain Dataset
The HateXplain dataset Mathew et al. (2022) comprises 20,148 posts from Twitter (https://X.com) and Gab (https://gab.com). It has been annotated by Amazon Mechanical Turk workers with three labels: hate, offensive, or normal speech. For our analysis, we merge the hate and offensive categories into a single label, creating a binary toxicity classification. Similar to the Jigsaw dataset, each sample is annotated for targeted identities. To enhance robustness against annotation noise, we select samples with majority-voted labels. We consider identities mentioned at least once by annotators, focusing on broader identity categories, see Table 2. The dataset’s original 8:1:1 train:development:test split is maintained Mathew et al. (2022), see Table 3.
| Split | Total | religion | race | gender |
| Jigsaw | ||||
| Train | 1,443,899 | 50,813 | 31,217 | 70,857 |
| Dev | 360,975 | 12,704 | 7,804 | 17,715 |
| Test | 97,320 | 3,316 | 1,911 | 4,367 |
| HateXplain | ||||
| Train | 15,383 | 4,127 | 5,773 | 3,351 |
| Dev | 1,922 | 507 | 718 | 423 |
| Test | 1,924 | 496 | 734 | 405 |
| BIOS | ||||
| Train | 255,710 | — | — | — |
| Dev | 39,369 | — | — | — |
| Test | 98,344 | — | — | — |
BIOS Dataset
The BIOS dataset De-Arteaga et al. (2019) is derived from 393,423 online biographies in English from the Common Crawl corpus, each including the subject’s occupation and gender. The dataset contains 28 occupations, assuming a binary gender classification. Gender identification is based on the pronoun extracted from the biographies, usually written in the third person. It’s essential to recognize that this dataset simplifies gender into binary categories, which may not fully represent the diversity of gender identities and expressions. Following the approach of De-Arteaga et al. (2019), we split the data into 65% training, 10% development, and 25% test sets333Preprocessed data downloaded from Ravfogel et al. (2020)., see Table 3. We categorize the occupations into three groups based on the percentage of females within each occupation: High female % (), balanced female % (), and low female % (), see Table 4.
| Group | BIOS Occupation |
|---|---|
| Low Female % | surgeon, architect, software_engineer, composer, comedian, pastor, dj, rapper |
| Balanced Female % | professor, attorney, photographer, journalist, psychologist, teacher, dentist, painter, poet, filmmaker, accountant, chiropractor, personal_trainer |
| High Female % | physician, nurse, model, dietitian, paralegal, yoga_teacher, interior_designer |
A.2 Training Setup & Hyperparameter Tuning
We use the Hugging Face transformers library implementation Wolf et al. (2020) for the four language models: BERT (bert-base-uncased), RoBERTabase (roberta-base), RoBERTalarge (roberta-large), and GPT-2 (gpt2). In our approach, we utilize a text sequence classifier with a sequence length of 512 for toxic text detection. However, for the BIOS dataset, we follow Panda et al. (2022) and use a sequence length of 128, considering the median length of a biography to be only 72 tokens. To integrate adapters, we adopt the Adapterhub framework Pfeiffer et al. (2020) and adapt the adapter architecture according to Pfeiffer et al. (2021), with a default reduction factor set at 16 unless explicitly specified otherwise. For incorporating LoRA, we use the peft framework Mangrulkar et al. (2022) and, following Hu et al. (2021), apply LoRA only on the query and value projection matrices of the self-attention module. Additionally, for GPT-2, we extend LoRA to the key projection matrix. We maintain a default rank of 16 for all matrices.
We utilize AdamW Loshchilov and Hutter (2019) as an optimizer, with a weight decay of 0.01 and a linear warming schedule with 10% of the total training step as warm-up steps. All models are trained with a batch size of 32. For toxic text detection, we train the model for a maximum of 3 epochs with early stopping based on (balanced) accuracy on the development set. For the occupation task, we follow the same setup but extend the training to 5 epochs. Moreover, our models are trained on V100 Nvidia GPUs, with the exception of the GPT-2 and RoBERTalarge variants for the Jigsaw dataset, for which we employ A100 Nvidia GPUs.
We create a minimal hyperparameter search setting: For the base models, we train with a learning rate of , the adapter version with and LoRA with . Each hyperparameter setting is trained with 5 different random seeds. We average the resulting metrics. The optimal model will be selected based on (balanced) accuracy from the dev set after each epoch. The ideal learning rate for the large base model RoBERTalarge is , whereas for BERT, RoBERTabase, and GPT-2, it stands at — with the exception being Jigsaw, where GPT-2 performs optimally with . In the case of LoRA, when paired with the RoBERTalarge model, the optimal learning rate is ; for the remaining models, it is .
A.3 Analysis: Number of Adapter Module Parameters
In our default settings, we apply a reduction factor of 16 for adapters, generating adapter parameters for BERT, RoBERTabase, and GPT-2. Meanwhile, for RoBERTalarge, the number of adapter parameters is . For LoRA, a rank of 16 is used, yielding LoRA parameters for BERT, RoBERTabase, and GPT-2, and for RoBERTalarge. In this analysis, we explore whether there exists a trade-off between the efficiency achieved with varying the number of adapter module parameters and the resulting fairness.
Setup
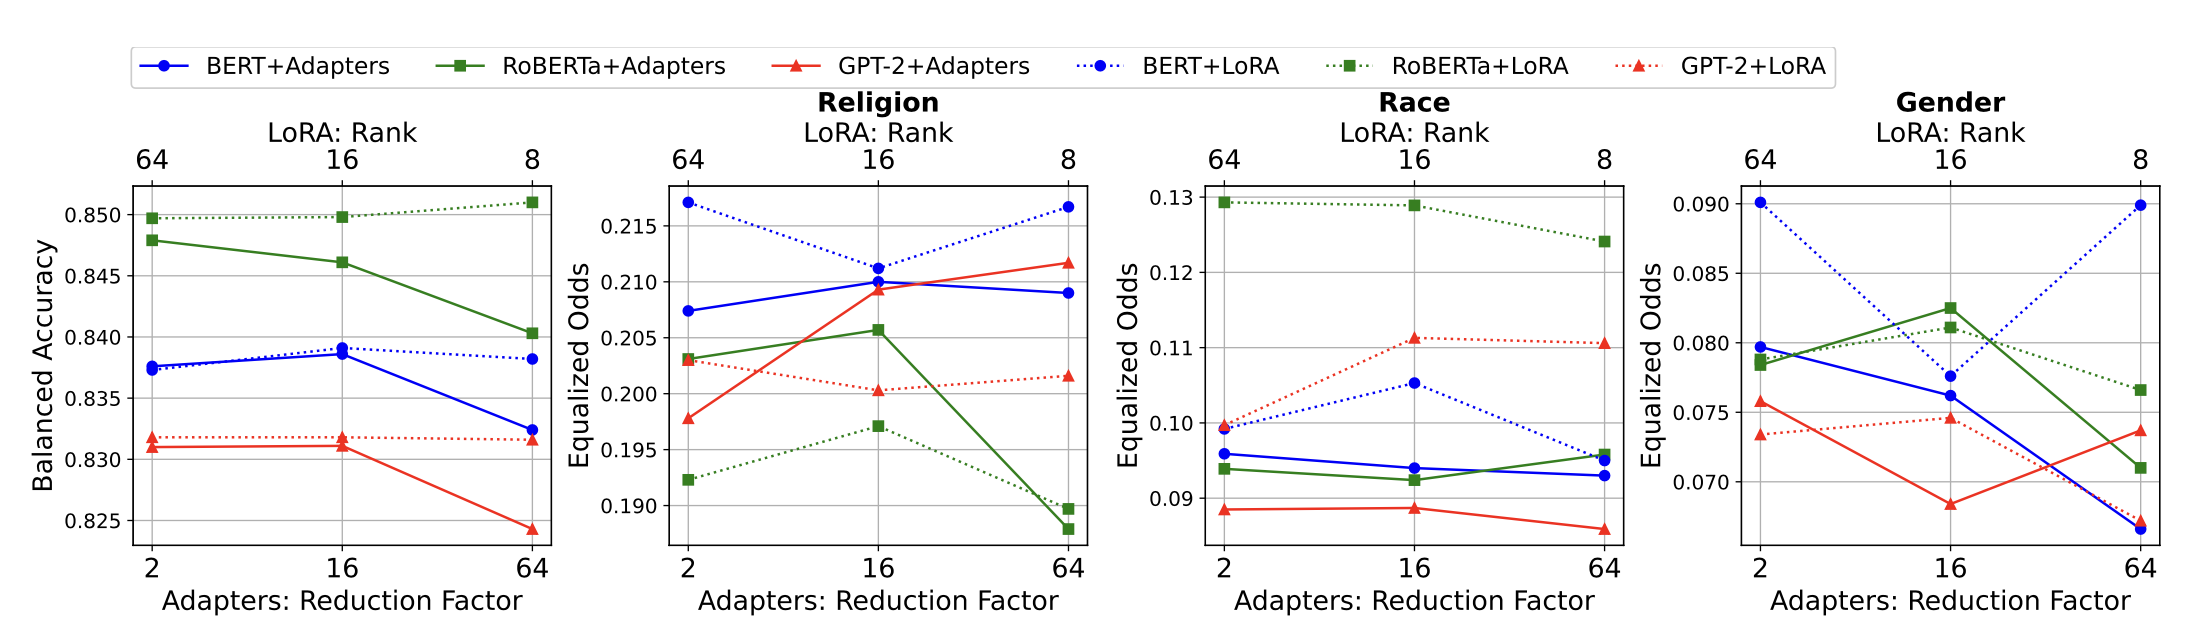
We explore different reduction factors for adapters: {2, 16, 64}, resulting in approximately {7M, 895K, 230K} additional adapter parameters for BERT, RoBERTabase and GPT-2. The greater the reduction factor, the fewer trainable parameters are involved, leading to more efficient training. For LoRA, we can vary the rank of the LoRA module to control the number of trainable parameters: We use a rank of {64, 16, 8}, leading in approximately {2.4M, 590K, 295K}. We limit our experiments to Jigsaw and do not use RoBERTalarge due to its high computational demands.
Results
Our results are summarized in Figure 3. We observe the following trend: a reduction factor of 64 significantly impairs performance across all models, while factors 2 and 16 yield similar results. This implies that, although a reduction factor of 64 reduces the number of parameters, it excessively diminishes the hidden size dimension, thereby causing a slight decline in performance. On the other hand, with LoRA, performance remains stable across various ranks, suggesting that even a small rank can achieve sufficient performance.
With regards to fairness, we do not detect any clear patterns across models, highlight again how adapter modules can have various effects on fairness. For instance, when considering the reduction factor of 64 throughout all models and factors, RoBERTa+Adapters exhibits the lowest EO in the religion category with 0.188, whereas GPT-2+Adapters demonstrates the highest EO with 0.212. Although we observe a trend in BERT+Adapters, where a higher reduction factor decreases EO for the groups race and gender, this does not hold across models.
| Model | Balanced Acc. | EO | AVG Epoch | ||
| Religion | Race | Gender | Time | ||
| Jigsaw | |||||
| BERT | 84.10 | 19.38 | 9.30 | 8.12 | 4:44h |
| 0.19 | 1.32 | 0.55 | 0.46 | ||
| BERT+Adapters | 83.89 | 21.00 | 9.40 | 7.62 | 3:18h (30% ) |
| 0.52 | 2.70 | 0.34 | 1.71 | ||
| BERT+LoRA | 83.91 | 21.67 | 9.49 | 8.99 | 3.20h (30% ) |
| 0.28 | 2.05 | 1.03 | 0.79 | ||
| RoBERTabase | 85.65 | 18.79 | 11.11 | 6.43 | 4:48h |
| 0.37 | 0.91 | 0.83 | 0.72 | ||
| RoBERTabase+Adapters | 84.61 | 20.57 | 9.24 | 8.25 | 3:21h (30% ) |
| 0.28 | 0.61 | 0.85 | 1.45 | ||
| RoBERTabase+LoRA | 84.98 | 18.79 | 12.41 | 8.07 | 3:25h (29% ) |
| 0.35 | 1.01 | 1.64 | 0.94 | ||
| GPT-2 | 83.57 | 19.12 | 8.38 | 8.17 | 3:55h |
| 0.43 | 1.82 | 0.79 | 0.49 | ||
| GPT-2+Adapters | 83.11 | 20.93 | 8.87 | 6.84 | 2:49h (28% ) |
| 0.29 | 1.13 | 1.05 | 0.94 | ||
| GPT-2+LoRA | 83.18 | 20.16 | 11.06 | 6.28 | 3:10h (19% ) |
| 0.12 | 0.51 | 0.10 | 0.11 | ||
| RoBERTalarge | 84.29 | 17.51 | 8.76 | 7.69 | 12:21h |
| 0.20 | 0.51 | 0.26 | 0.32 | ||
| RoBERTalarge+Adapters | 83.63 | 16.52 | 8.38 | 7.94 | 9:01h (27% ) |
| 0.12 | 0.75 | 0.57 | 0.67 | ||
| RoBERTalarge+LoRA | 82.80 | 17.57 | 84.22 | 7.38 | 9:13h (25% ) |
| 0.13 | 1.08 | 0.32 | 0.26 | ||
| HateXplain | |||||
| BERT | 78.21 | 19.86 | 17.83 | 6.79 | 1:00m |
| 0.22 | 3.25 | 1.05 | 0.31 | ||
| BERT+Adapters | 77.61 | 23.44 | 17.19 | 5.79 | 0:42m (32% ) |
| 0.39 | 4.49 | 2.49 | 1.14 | ||
| BERT+LoRA | 77.81 | 21.44 | 19.37 | 4.42 | 0:41m (33% ) |
| 0.57 | 4.34 | 1.76 | 1.24 | ||
| RoBERTabase | 79.70 | 19.63 | 19.15 | 5.77 | 1:04m |
| 0.41 | 2.94 | 2.67 | 1.81 | ||
| RoBERTabase+Adapters | 78.44 | 19.11 | 16.26 | 5.84 | 0:42m (34% ) |
| 0.47 | 3.33 | 1.67 | 1.49 | ||
| RoBERTabase+LoRA | 79.41 | 22.58 | 14.39 | 4.51 | 0:43m (33% ) |
| 0.48 | 2.64 | 2.06 | 1.27 | ||
| GPT-2 | 78.20 | 13.97 | 12.94 | 9.30 | 1:10m |
| 0.66 | 2.32 | 2.54 | 1.37 | ||
| GPT-2+Adapters | 77.07 | 16.75 | 12.85 | 8.59 | 0:47m (33% ) |
| 0.17 | 3.35 | 3.39 | 0.64 | ||
| GPT-2+LoRA | 77.62 | 15.11 | 11.74 | 6.95 | 0:52m (26% ) |
| 0.53 | 1.98 | 1.86 | 1.12 | ||
| RoBERTalarge | 80.43 | 16.66 | 14.86 | 4.82 | 3:25m |
| 0.50 | 1.66 | 1.91 | 1.58 | ||
| RoBERTalarge+Adapters | 79.84 | 20.29 | 13.48 | 4.83 | 2:12m (36% ) |
| 0.71 | 2.32 | 1.68 | 1.13 | ||
| RoBERTalarge+LoRA | 79.65 | 21.52 | 12.36 | 2.50 | 2:13m (35% ) |
| 0.43 | 1.46 | 2.69 | 1.37 | ||
| Model | Accuracy | TPR_Gap | AVG Epoch Time | ||
|---|---|---|---|---|---|
| Low | Balanced | High | |||
| BIOS | |||||
| BERT | 85.54 | 12.40 | 3.43 | 21.44 | 30:31m |
| 1.37 | 1.20 | 0.59 | 1.23 | ||
| BERT+Adapters | 85.28 | 11.94 | 3.90 | 23.25 | 20:20m (33% ) |
| 1.46 | 0.86 | 0.28 | 1.53 | ||
| BERT+LoRA | 85.06 | 11.32 | 3.86 | 22.64 | 21:14m (30% ) |
| 0.12 | 0.59 | 0.30 | 0.97 | ||
| RoBERTabase | 85.53 | 11.36 | 3.44 | 20.81 | 30:14m |
| 0.07 | 0.80 | 0.46 | 2.35 | ||
| RoBERTabase+Adapters | 85.78 | 11.92 | 3.40 | 21.52 | 20:09m (33% ) |
| 1.51 | 1.06 | 0.39 | 0.96 | ||
| RoBERTabase+LoRA | 85.33 | 11.78 | 4.00 | 24.03 | 21:21m (29% ) |
| 0.06 | 0.37 | 0.34 | 0.39 | ||
| GPT-2 | 84.61 | 12.14 | 3.59 | 23.20 | 43:20m |
| 0.12 | 1.02 | 0.35 | 1.18 | ||
| GPT-2+Adapters | 84.58 | 12.65 | 3.90 | 22.72 | 32:57m (24% ) |
| 0.07 | 0.79 | 0.35 | 1.16 | ||
| GPT-2+LoRA | 84.37 | 11.47 | 3.57 | 22.56 | 36:50m (15% ) |
| 0.08 | 0.45 | 0.37 | 0.74 | ||
| RoBERTalarge | 87.10 | 9.42 | 3.04 | 18.60 | 96:26m |
| 0.09 | 0.66 | 0.38 | 0.74 | ||
| RoBERTalarge+Adapters | 86.94 | 10.92 | 3.03 | 18.84 | 66:56m (31% ) |
| 0.04 | 1.44 | 0.37 | 0.74 | ||
| RoBERTalarge+LoRA | 86.62 | 9.57 | 3.17 | 18.85 | 68:52m (29% ) |
| 0.05 | 0.2 | 0.13 | 0.46 | ||